Dept. of Agriculture, Dept. of Defense - Roberts Environmental Center
Dept. of Agriculture, Dept. of Defense - Roberts Environmental Center
Dept. of Agriculture, Dept. of Defense - Roberts Environmental Center

Create successful ePaper yourself
Turn your PDF publications into a flip-book with our unique Google optimized e-Paper software.
B-<br />
<strong>Dept</strong>. <strong>of</strong> the Interior<br />
<strong>Dept</strong>. <strong>of</strong> the Interior 2010 Web Pages<br />
The U.S. Department <strong>of</strong> the Interior’s FY 2008 Annual <strong>Environmental</strong> Management Systems Report, FY 2008-2012 Workforce and Succession Plan, Green<br />
Purchasing Plan, Strategic Sustainability Performance Plan, and 2010 web pages contain much information on the department’s environmental and social<br />
programs and goals. The department has numerous energy and water conservation projects including the implementation <strong>of</strong> solar panels. Although the<br />
department has a good discussion <strong>of</strong> these programs and initiatives, and states that data are collected and reported, not much <strong>of</strong> the data is provided;<br />
lacking are data on environmental issues such as energy use, water conservation, and waste production; and on employee data such as turnover and<br />
accident rate. The Department <strong>of</strong> the Interior has a number <strong>of</strong> initiatives that show its dedication to the country’s Native American population; however, it<br />
does not report similar initiatives on its responsibility to its workforce, nor does it provide a code <strong>of</strong> ethics.<br />
Analyst(s):<br />
Karina Gomez<br />
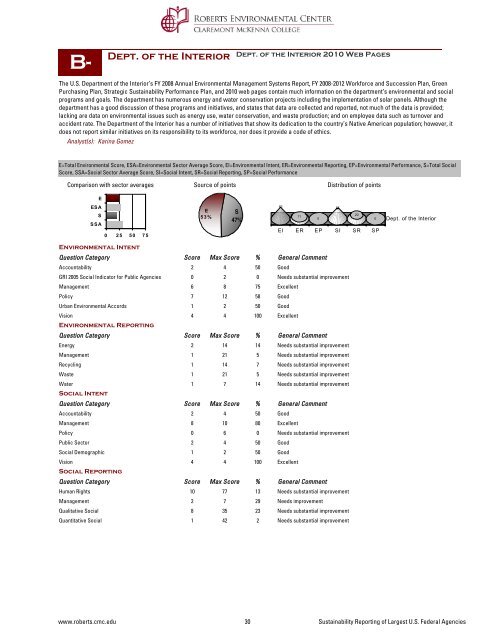
E=Total <strong>Environmental</strong> Score, ESA=<strong>Environmental</strong> Sector Average Score, EI=<strong>Environmental</strong> Intent, ER=<strong>Environmental</strong> Reporting, EP=<strong>Environmental</strong> Performance, S=Total Social<br />
Score, SSA=Social Sector Average Score, SI=Social Intent, SR=Social Reporting, SP=Social Performance<br />
Comparison with sector averages<br />
Source <strong>of</strong> points<br />
Distribution <strong>of</strong> points<br />
E<br />
ESA<br />
S<br />
SSA<br />
0 25 50 75<br />
E<br />
53%<br />
S<br />
47%<br />
63<br />
57<br />
11<br />
20<br />
0<br />
0<br />
EI ER EP SI SR SP<br />
<strong>Dept</strong>. <strong>of</strong> the Interior<br />
<strong>Environmental</strong> Intent<br />
Question Category Score Max Score % General Comment<br />
Accountability 2 4 50 Good<br />
GRI 2005 Social Indicator for Public Agencies 0 2 0 Needs substantial improvement<br />
Management 6 8 75 Excellent<br />
Policy 7 12 58 Good<br />
Urban <strong>Environmental</strong> Accords 1 2 50 Good<br />
Vision 4 4 100 Excellent<br />
<strong>Environmental</strong> Reporting<br />
Question Category Score Max Score % General Comment<br />
Energy 2 14 14 Needs substantial improvement<br />
Management 1 21 5 Needs substantial improvement<br />
Recycling 1 14 7 Needs substantial improvement<br />
Waste 1 21 5 Needs substantial improvement<br />
Water 1 7 14 Needs substantial improvement<br />
Social Intent<br />
Question Category Score Max Score % General Comment<br />
Accountability 2 4 50 Good<br />
Management 8 10 80 Excellent<br />
Policy 0 6 0 Needs substantial improvement<br />
Public Sector 2 4 50 Good<br />
Social Demographic 1 2 50 Good<br />
Vision 4 4 100 Excellent<br />
Social Reporting<br />
Question Category Score Max Score % General Comment<br />
Human Rights 10 77 13 Needs substantial improvement<br />
Management 2 7 29 Needs improvement<br />
Qualitative Social 8 35 23 Needs substantial improvement<br />
Quantitative Social 1 42 2 Needs substantial improvement<br />
www.roberts.cmc.edu 30 Sustainability Reporting <strong>of</strong> Largest U.S. Federal Agencies