Dept. of Agriculture, Dept. of Defense - Roberts Environmental Center
Dept. of Agriculture, Dept. of Defense - Roberts Environmental Center
Dept. of Agriculture, Dept. of Defense - Roberts Environmental Center

Create successful ePaper yourself
Turn your PDF publications into a flip-book with our unique Google optimized e-Paper software.
B+<br />
<strong>Dept</strong>. <strong>of</strong><br />
Transportation<br />
<strong>Dept</strong>. <strong>of</strong> Transportation 2010 Web Pages<br />
The U.S. Department <strong>of</strong> Transportation is a huge agency and provides a large amount <strong>of</strong> sustainability information on its website, but it is not centralized,<br />
nor is there a central sustainability index for it, so it is difficult to sort out. Rather the information is provided piecemeal as it has come in from various<br />
divisions. Similar to the sustainability issue, it is difficult to find overall departmental procedures, guidelines, and employment information for the entire<br />
Department <strong>of</strong> Transportation. The next iteration <strong>of</strong> DOT's website should provide a more integrated approach.<br />
Analyst(s): Jesse Maximilliano Madrigal<br />
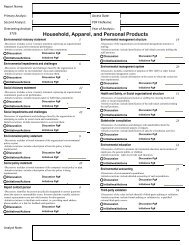
E=Total <strong>Environmental</strong> Score, ESA=<strong>Environmental</strong> Sector Average Score, EI=<strong>Environmental</strong> Intent, ER=<strong>Environmental</strong> Reporting, EP=<strong>Environmental</strong> Performance, S=Total Social<br />
Score, SSA=Social Sector Average Score, SI=Social Intent, SR=Social Reporting, SP=Social Performance<br />
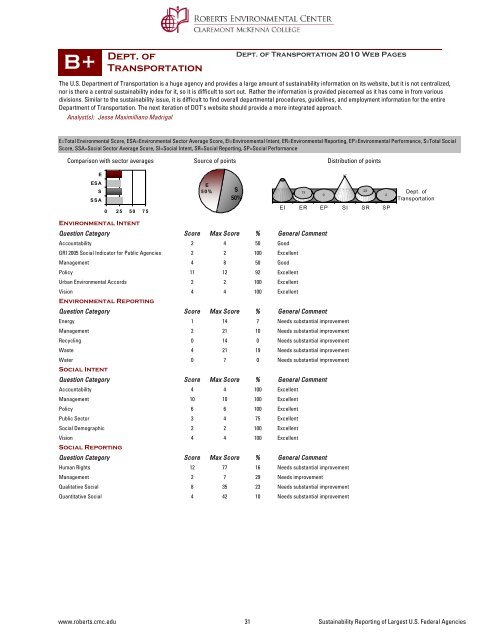
Comparison with sector averages<br />
Source <strong>of</strong> points<br />
Distribution <strong>of</strong> points<br />
E<br />
ESA<br />
S<br />
SSA<br />
0 25 50 75<br />
E<br />
50%<br />
S<br />
50%<br />
97<br />
78<br />
13<br />
23<br />
0<br />
2<br />
EI ER EP SI SR SP<br />
<strong>Dept</strong>. <strong>of</strong><br />
Transportation<br />
<strong>Environmental</strong> Intent<br />
Question Category Score Max Score % General Comment<br />
Accountability 2 4 50 Good<br />
GRI 2005 Social Indicator for Public Agencies 2 2 100 Excellent<br />
Management 4 8 50 Good<br />
Policy 11 12 92 Excellent<br />
Urban <strong>Environmental</strong> Accords 2 2 100 Excellent<br />
Vision 4 4 100 Excellent<br />
<strong>Environmental</strong> Reporting<br />
Question Category Score Max Score % General Comment<br />
Energy 1 14 7 Needs substantial improvement<br />
Management 2 21 10 Needs substantial improvement<br />
Recycling 0 14 0 Needs substantial improvement<br />
Waste 4 21 19 Needs substantial improvement<br />
Water 0 7 0 Needs substantial improvement<br />
Social Intent<br />
Question Category Score Max Score % General Comment<br />
Accountability 4 4 100 Excellent<br />
Management 10 10 100 Excellent<br />
Policy 6 6 100 Excellent<br />
Public Sector 3 4 75 Excellent<br />
Social Demographic 2 2 100 Excellent<br />
Vision 4 4 100 Excellent<br />
Social Reporting<br />
Question Category Score Max Score % General Comment<br />
Human Rights 12 77 16 Needs substantial improvement<br />
Management 2 7 29 Needs improvement<br />
Qualitative Social 8 35 23 Needs substantial improvement<br />
Quantitative Social 4 42 10 Needs substantial improvement<br />
www.roberts.cmc.edu 31 Sustainability Reporting <strong>of</strong> Largest U.S. Federal Agencies