Fiscal Years 2008 and 2007 Operating Expenses by Function Comparisons: 2008 2007 Increase Percent Amount % of total Amount % of total (Decrease) Change - Instruction $ 17,825,223 33.3 $ 17,176,057 32.9 $ 649,166 3.8 Academic Support 3,856,921 7.3 3,726,468 7.1 130,453 3.5 Student Services 3,057,211 5.8 2,810,344 5.4 246,867 8.8 Public Service 6,728,383 12.7 7,040,255 13.5 (311,872) (4.4) Plant, Operations & Maintenance 5,793,445 10.9 5,602,341 10.7 191,104 3.4 Institutional Support 8,434,693 15.9 8,348,682 16.0 86,011 1.0 Auxiliary Services 647,958 1.2 602,761 1.2 45,197 7.5 Amortization 263,800 0.5 248,205 0.5 15,595 6.3 Depreciation 6,461,293 12.2 6,386,168 12.2 75,125 1.2 Other 83,944 0.2 246,412 0.5 (162,468) (65.9) Total Expenses by Function $ 53,152,871 100.0 $ 52,187,693 100.0 $ 965,178 1.8 2008 Analysis of Operating Expenses by Function: The <strong>College</strong>’s operating expenses by function increased by approximately $1,000,000. The increase is primarily attributed to an increase in instruction of approximately $600,000 and an increase in academic support and student services in aggregate of approximately $400,000. Other contributing factors for the increase in expenses are due to an increase of approximately $600,000 in on-behalf payments and an increase in retirement benefits of approximately $200,000 offset by decreases in public service and other in aggregate of approximately $500,000. Fiscal Years 2007 and 2006 Operating Expenses by Function Comparisons: 2007 2006 Increase Percent Amount % of total Amount % of total (Decrease) Change - Instruction $ 17,176,057 32.9 $ 15,722,941 31.7 $ 1,453,116 9.2 Academic Support 3,726,468 7.1 3,283,344 6.6 443,124 13.5 Student Services 2,810,344 5.4 2,453,459 4.9 356,885 14.5 Public Service 7,040,255 13.5 6,950,452 14.0 89,803 1.3 Plant, Operations & Maintenance 5,602,341 10.7 5,597,258 11.3 5,083 0.1 Institutional Support 8,348,682 16.0 7,610,228 15.3 738,454 9.7 Auxiliary Services 602,761 1.2 800,874 1.6 (198,113) (24.7) Amortization 248,205 0.5 252,332 0.5 (4,127) (1.6) Depreciation 6,386,168 12.2 6,768,214 13.6 (382,046) (5.6) Other 246,412 0.5 252,331 0.5 (5,919) (2.3) Total Expenses by Function $ 52,187,693 100.0 $ 49,691,433 100.0 $ 2,496,260 5.0 2007 Analysis of Operating Expenses by Function: The <strong>College</strong>’s operating expenses by function increased by approximately $2,500,000. The increase is primarily attributed to an increase in instruction expense of approximately $1,500,000, an increase in academic support and student services in aggregate of roughly 800,000 and an increase in institutional support of approximately $700,000 offset by a decrease in auxiliary services of approximately $200,000. Other contributing factors for the increase in expenses are due to public service expenses increasing roughly $100,000 and an increase of approximately $600,000 in on-behalf payments. Offsetting the increases was depreciation that decreased by approximately $400,000 – primarily due to demolition of buildings A and B in November, 2006. 11
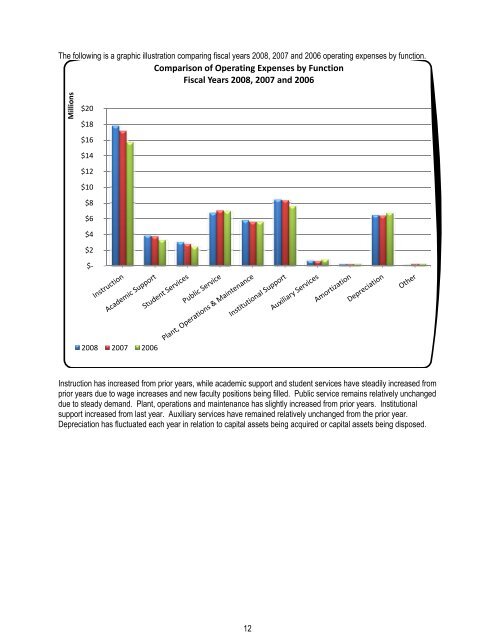
The following is a graphic illustration comparing fiscal years 2008, 2007 and 2006 operating expenses by function. Comparison of Operating Expenses by Function Fiscal Years 2008, 2007 and 2006 Millions $20 $18 $16 $14 $12 $10 $8 $6 $4 $2 $‐‐ 2008 2007 2006 Instruction has increased from prior years, while academic support and student services have steadily increased from prior years due to wage increases and new faculty positions being filled. Public service remains relatively unchanged due to steady demand. Plant, operations and maintenance has slightly increased from prior years. Institutional support increased from last year. Auxiliary services have remained relatively unchanged from the prior year. Depreciation has fluctuated each year in relation to capital assets being acquired or capital assetss being disposed. 12