Stabilising the supply chain - ArcelorMittal South Africa
Stabilising the supply chain - ArcelorMittal South Africa
Stabilising the supply chain - ArcelorMittal South Africa

You also want an ePaper? Increase the reach of your titles
YUMPU automatically turns print PDFs into web optimized ePapers that Google loves.
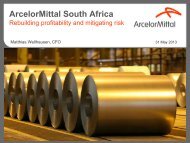
<strong>ArcelorMittal</strong> <strong>South</strong> <strong>Africa</strong><br />
<strong>Stabilising</strong> operations<br />
Dr. Hans Ludwig Rosenstock, COO 31 May 2013
Disclaimer<br />
Forward-Looking Statements<br />
This presentation may contain forward-looking information and statements about<br />
<strong>ArcelorMittal</strong> <strong>South</strong> <strong>Africa</strong> and its subsidiaries. These statements include financial<br />
projections and estimates and <strong>the</strong>ir underlying assumptions, statements regarding plans,<br />
objectives and expectations with respect to future operations, products and services, and<br />
statements regarding future performance. Forward-looking statements may be identified by<br />
<strong>the</strong> words “believe,” “expect,” “anticipate,” “target” or similar expressions. Although<br />
<strong>ArcelorMittal</strong> <strong>South</strong> <strong>Africa</strong>’s management believes that <strong>the</strong> expectations reflected in such<br />
forward-looking statements are reasonable, investors and holders of <strong>ArcelorMittal</strong> <strong>South</strong><br />
<strong>Africa</strong>’s securities are cautioned that forward-looking information and statements are<br />
subject to numerous risks and uncertainties, many of which are difficult to predict and<br />
generally beyond <strong>the</strong> control of <strong>ArcelorMittal</strong> <strong>South</strong> <strong>Africa</strong>, that could cause actual results<br />
and developments to differ materially and adversely from those expressed in, or implied or<br />
projected by, <strong>the</strong> forward-looking information and statements. These risks and uncertainties<br />
include those discussed or identified in <strong>the</strong> filings with <strong>the</strong> JSE made or to be made by<br />
<strong>ArcelorMittal</strong> <strong>South</strong> <strong>Africa</strong>, including <strong>ArcelorMittal</strong> <strong>South</strong> <strong>Africa</strong>’s Annual Report for <strong>the</strong> year<br />
ended December 31, 2012 filed with <strong>the</strong> JSE. These forward looking statements have not<br />
been reviewed and reported on by <strong>ArcelorMittal</strong> <strong>South</strong> <strong>Africa</strong>’s auditors and apply only as of<br />
<strong>the</strong> date <strong>the</strong>y are made. <strong>ArcelorMittal</strong> <strong>South</strong> <strong>Africa</strong> undertakes no obligation to publicly<br />
update its forward-looking statements, whe<strong>the</strong>r as a result of new information, future events,<br />
or o<strong>the</strong>rwise.<br />
1
Agenda<br />
• Stabilize operations<br />
• Asset reliability<br />
• Quality improvements<br />
• Energy savings<br />
• O<strong>the</strong>r cost reduction initiatives<br />
2
Management systems implemented to<br />
stabilise operations<br />
• Decision in 2010 to stabilize and improve operations by introducing management<br />
systems<br />
Vanderbijlpark,<br />
Vereeniging,<br />
Newcastle<br />
Business<br />
Improvement<br />
Saldanha<br />
World Class<br />
Manufacturing<br />
• Systematic approach to deal with<br />
business matters, divided into work<br />
streams along defined problem<br />
solving technology<br />
• Work streams are setup and working<br />
among o<strong>the</strong>rs in maintenance,<br />
energy saving, product development<br />
• 10 pillar program including safety,<br />
cost deployment, autonomous and<br />
professional maintenance, people<br />
development, environment and<br />
operational excellence<br />
• Holistic approach for business<br />
improvement<br />
Stabilize<br />
operations<br />
using<br />
Mgt<br />
Systems<br />
3
Op Standardisation<br />
Maintenance<br />
Quality<br />
Outsource<br />
Energy<br />
Vanderbijlpark Works master plan<br />
AREA<br />
Complete SOP audits &<br />
Visual Management<br />
Management Routines<br />
Management of Abnormalities<br />
CMN (Full ARP implementation)<br />
CMS (Full ARP implementation)<br />
Roll & Shear (Full ARP implementation)<br />
Hot Rolling (Selected roll-out)<br />
Coke Making (M&B Analysis only)<br />
Iron Making (Phased in full roll-out)<br />
Steel Making (Planning & Scheduling)<br />
Slab quality<br />
Coil quality 6-σ black spots<br />
Plate Quality<br />
Caster segments<br />
Refractories<br />
Lubrication systems<br />
Work roll mill bearings maintenance<br />
Energy awareness<br />
Plant energy audits<br />
Plant benchmarking gap analysis<br />
Best practice implementation<br />
2013 2014<br />
Q1 Q2 Q3 Q4 Q1 Q2<br />
• Detailed work plan<br />
• Best practise<br />
implementation<br />
• Leveraging from<br />
<strong>ArcelorMittal</strong> Group<br />
expertise<br />
• Large Group internal<br />
data base of<br />
information<br />
• Access to world class<br />
R&D<br />
1 – FTE: BI / Plant FTEs for team for 2013;<br />
2 – P=Production/Productivity, Q=Quality, C=Cost, D=Delivery, S=Safety, M=Management, E=Environment<br />
SOURCE: BI Team<br />
4
World Class Manufacturing (WCM)<br />
overview<br />
• Started program in 2010 with 5 WCM pillars<br />
and 5S<br />
• Focus on autonomous maintenance to<br />
deliver improvement in reliability shifted<br />
from achieving high reliability to focused<br />
improvement to deliver <strong>the</strong> savings<br />
Savings achieved by Dec 2012 (from baseline H1 2010)<br />
Target<br />
17.0<br />
6.3<br />
7.7<br />
15.9<br />
5.2<br />
9.4<br />
17.5 17.3<br />
Actual<br />
2.1 2.2<br />
FI<br />
Footprint<br />
FI Energy<br />
FI o<strong>the</strong>r<br />
AM & PM<br />
PD<br />
• The program currently supported by teams:<br />
– 40 safety project teams; 28 autonomous<br />
maintenance teams; 15 professional maintenance<br />
teams; 20 focussed improvement teams<br />
– Annual cost deployment to prioritise/focus efforts<br />
5
Maintenance systems<br />
Breakdown<br />
maintenance<br />
• Equipment is repaired<br />
after a failure in<br />
operation<br />
• advantage: Life time of<br />
<strong>the</strong> equipment is fully<br />
utilized<br />
• problem: repair not<br />
planned, capital<br />
intensive (spares) &<br />
longer stops<br />
Life cycle maintenance<br />
• Repair is performed in<br />
fixed intervals,<br />
depending of <strong>the</strong><br />
estimated life cycle of<br />
equipment<br />
• advantage: planned<br />
repair stops, stable<br />
operations<br />
• problem: life time of<br />
equipment is not always<br />
fully utilized<br />
Condition based<br />
maintenance<br />
• Repair is performed<br />
according <strong>the</strong> actual<br />
equipment status<br />
• advantage: planned repair<br />
stops, stable operations,<br />
life time of equipment<br />
utilized to maximum,<br />
minimum spares<br />
• precondition: highly skilled<br />
and reliable workforce<br />
required, good, adequate<br />
data base for support<br />
required<br />
6
Vanderbijlpark reliability initiatives:<br />
Hot rolling mill<br />
Dec-12<br />
Dec-12<br />
Nov-12<br />
Oct-12<br />
Sep-12<br />
Aug-12<br />
Jul-12<br />
Jun-12<br />
May-12<br />
Apr-12<br />
Mar-12<br />
Feb-12<br />
Jan-12<br />
Target 2012<br />
Avg 2012<br />
Avg 2011<br />
Avg 2010<br />
Avg 2009<br />
2011<br />
2012<br />
Benchmark<br />
YTD 2013<br />
Jan-13<br />
Feb-13<br />
Mar-13<br />
Apr-13<br />
Hot strip mill and plate mill reliability plan<br />
• Short loop to tackle <strong>the</strong> shorter delays<br />
– Positive outcome employees focus on <strong>the</strong> wider<br />
problem ra<strong>the</strong>r than only on <strong>the</strong> obvious problem<br />
– Action must ensure that delays are not repeated<br />
• Root cause analysis (RCA)<br />
– From 2011 onwards HSM RCA’s conducted on delays<br />
longer than 90min (previously 120min)<br />
– Identify root cause and eliminate <strong>the</strong> problem<br />
• The asset reliability program include:<br />
– Preventative replacement of equipment<br />
– Upgrading of equipment<br />
– Back to basic conditions on equipment<br />
• Execution of job cards<br />
Hot strip mill quality plan<br />
• Training of young engineers - overseas experts<br />
• Develop proactive tools stabilise performance<br />
– Develop trends, model performances indicators etc.<br />
– Process standardization<br />
• Process yield focus areas<br />
– Focus on mechanical yield (cobbles and plate shears)<br />
• Roughing mill reliability program<br />
• Curl at roughing mill<br />
– Coil appearance<br />
– Shape and profile<br />
– Pinchers on tail ends<br />
40<br />
30<br />
20<br />
10<br />
0<br />
99.5<br />
99.0<br />
99.0<br />
98.6<br />
98.5<br />
98.0<br />
97.5 97.3<br />
0.0<br />
Unplanned downtime Yield (%)<br />
99.2<br />
98.8 98.8<br />
98.4<br />
98.0<br />
7
Vanderbijlpark reliability initiatives:<br />
Blast furnace area<br />
Key drivers for blast furnace optimization<br />
• Blast furnace C hearth wall and tuyere belt<br />
replaced<br />
• Blast furnace D tapholes repaired with<br />
design improvements<br />
• Modifications done to blast furnace D<br />
through design<br />
• Operational stability, improved availability<br />
85<br />
VDB blast furnace C<br />
Zero Wind Equivalent Availability<br />
(% of operating time)<br />
53<br />
76<br />
89<br />
92<br />
Ongoing efforts<br />
• Continue with extensive operator training<br />
• Roll-out of asset reliability program to<br />
improve maintenance approach<br />
• “Back-to-basics” on tapping equipment<br />
• Raw material quality focus<br />
2008 2009 2010<br />
2011 2012<br />
Improvements exhibited<br />
8
Vanderbijlpark reliability initiatives:<br />
Strip processing lines<br />
• Significant improvements made in unplanned stoppage rates<br />
18.9<br />
Galvanizing line<br />
(hours between stoppages)<br />
20.8<br />
17.6<br />
Pickling line<br />
(hours between stoppages)<br />
1.89<br />
2.27<br />
14.6<br />
1.24<br />
1.29<br />
2011<br />
2012<br />
2013 YTD<br />
Target<br />
2011 2012 2013 YTD Target<br />
• Mean time between failure describes <strong>the</strong> time in hours between two unplanned<br />
stops of a processing line<br />
9
Maintenance spend is sufficient<br />
• Maintenance capex plus repairs and maintenance are and will remain<br />
sufficient to sustain our competitive position<br />
• Decreased expenditure in 2009 due to global financial crisis o<strong>the</strong>rwise<br />
overall incremental spend increase each year<br />
Maintenance spent on both capex and opex per tonne of steel shipped ($/t)<br />
82<br />
22<br />
86<br />
17<br />
76<br />
8<br />
+25.6%<br />
99<br />
21<br />
108<br />
18<br />
100 103<br />
13 21<br />
Capex<br />
Opex<br />
60<br />
69<br />
68<br />
78<br />
90<br />
87<br />
82<br />
2007<br />
2008<br />
2009<br />
2010<br />
2011 2012 2013F<br />
10
Quality improvements - Vanderbijlpark<br />
• Ongoing quality improvement<br />
efforts<br />
• Customer complaint ratio of 1.08%<br />
of total sales revenue in 2012<br />
• Significant reduction achieved<br />
• 2013 YTD at 0.52%<br />
• 2012 scrapped tons (i.e. scrap &<br />
secondary grade) was 2,500t<br />
• 26% lower than <strong>the</strong> seven<br />
year peak of 3,400t in 2011<br />
• 2012 cost of quality R66m:<br />
• 30% below 2011<br />
• 35% below 2010<br />
• Tin and HRC receive <strong>the</strong> majority<br />
of complaints<br />
Vanderbijlpark Works<br />
(quality claims by volume for flat steel products)<br />
11
Quality improvements – Saldanha works<br />
• Customer complaint ratio of 0.102%<br />
of total sales revenue in 2012<br />
• 2013 YTD rate of 0.058%<br />
• Scrapped tons (ie scrap &<br />
secondary grade) in 2012 was<br />
6,510t<br />
• 51% lower than 2011 peak of<br />
13,308t<br />
• Surface defects make out 90% of<br />
claims with shape <strong>the</strong> balance<br />
• Cost of quality in 2012 was R16m<br />
• 16% below <strong>the</strong> 2011 result<br />
• 31% lower than <strong>the</strong> 2010<br />
Prime ratio<br />
99.5<br />
99.1%<br />
99.0<br />
98.5<br />
98.0 97.8%<br />
98.6%<br />
97.5<br />
97.6%<br />
97.0<br />
96.7%<br />
96.5<br />
2008 2009 2010 2011 2012<br />
3.0<br />
Rejections based on quality<br />
2.6%<br />
2.5<br />
2.0<br />
1.7%<br />
1.5<br />
1.6%<br />
1.2%<br />
1.0<br />
0.6%<br />
0.5<br />
2008 2009 2010 2011 2012<br />
12
Yield improvements - Newcastle<br />
• In 2012 <strong>the</strong> bar mill was responsible for 56% of <strong>the</strong> relevant complaints by volume<br />
and <strong>the</strong> rod mill for 44%<br />
• 2013 YTD medium mill yield against target at 94%<br />
• 2013 YTD cobble rate of 1.3% at bar mill<br />
Newcastle medium mill – yield % Newcastle bar mill – cobble rate %<br />
93.8%<br />
93.6%<br />
93.8%<br />
1.60%<br />
1.55%<br />
1.56%<br />
1.55%<br />
93.4%<br />
93.4%<br />
1.50%<br />
93.2%<br />
93.0%<br />
92.8%<br />
93.2%<br />
1.45%<br />
1.40%<br />
1.35%<br />
1.30%<br />
1.28%<br />
92.6% 92.5%<br />
1.25%<br />
1.24%<br />
0.0%<br />
0.00%<br />
2010<br />
2011<br />
2012<br />
2013 YTD<br />
2010<br />
2011<br />
2012<br />
2013 YTD<br />
13
Energy – fuel rates Vanderbijlpark<br />
Key drivers for <strong>the</strong> blast furnace<br />
optimization at Vanderbijlpark<br />
• Charging of DRI<br />
• Improve stability<br />
• Fine sinter charging<br />
• Thabazimbi lump on mixing bed<br />
• Eliminate blast furnace D<br />
charging delays (on-going)<br />
• Full operation of Stove 4 to improve<br />
hot blast temperature in June<br />
Ongoing efforts<br />
• Operator refresher training<br />
• Improved maintenance approach<br />
• Implementation of autonomous<br />
maintenance<br />
• Focussing on raw material quality<br />
580<br />
560<br />
540<br />
520<br />
0<br />
580<br />
560<br />
540<br />
520<br />
565<br />
2008 2009<br />
561<br />
VDB blast furnace C - Total fuel rate<br />
(coke equivalent) Kg/tHM<br />
565<br />
498<br />
560<br />
565<br />
526 529<br />
2010 2011 2012 Jan- Feb- Mar-<br />
13 13 13<br />
VDB blast furnace D - Total fuel rate<br />
(coke equivalent) Kg/tHM<br />
560<br />
516<br />
562<br />
529<br />
504<br />
528<br />
2013<br />
YTD<br />
0<br />
2008<br />
2009<br />
2010<br />
2011<br />
2012<br />
14
Energy – electricity Saldanha works<br />
2012 projects (total savings R127m)<br />
• Technology<br />
• Variable speed drives, waste heat<br />
utilisation to replace diesel heater, lighting<br />
replacement<br />
• Operational efficiency<br />
• RHF, WTP pump system & LPG savings<br />
• Eskom tariff structure (winter peak tariff) -<br />
utilise chemical energy<br />
• ISO 50001 and improved reporting by<br />
empowering area managers to set targets and<br />
manage <strong>the</strong>ir energy consumption<br />
Saldanha works electricity consumption<br />
Kwh/t HRC<br />
1.31<br />
1.51<br />
1.31<br />
1.27<br />
1.19<br />
2011 projects (total savings R64m)<br />
• Switch off what is not required in low<br />
production periods<br />
• Compressed air- repair leaks / prevent misuse<br />
2008 2009 2010 2011 2012<br />
Electricity consumption Kwh/t HRC<br />
15
Energy – LPG Saldanha works<br />
• Reduce LPG consumption by 30% by changing operating philosophy<br />
• Use process gas for furnace reheating<br />
• Reduce temperature losses by stabilizing <strong>the</strong> operations<br />
Saldanha works LPG consumption<br />
36<br />
24<br />
18,303<br />
23<br />
20,625<br />
28<br />
18,811<br />
25<br />
22,112<br />
17<br />
13,072<br />
25,000<br />
20,000<br />
15,000<br />
12<br />
12<br />
10,000<br />
5,000<br />
0<br />
2008<br />
2009<br />
2010 2011 2012<br />
0<br />
LPG consumption 1000Kg<br />
LPG consumption Kg/t HRC<br />
16
Energy – Newcastle<br />
• Process review for reheating<br />
furnaces<br />
• Improvement of measurement<br />
technology<br />
• Training of operators<br />
• Stabilizing of operations<br />
Newcastle medium mill gas consumption GJ/ton<br />
2.76<br />
2.30<br />
1.78<br />
2011 2012 2013 YTD<br />
Newcastle bar mill gas consumption GJ/ton<br />
1.28<br />
1.19<br />
1.08<br />
2011 2012<br />
2013 YTD<br />
Newcastle rod mill gas consumption GJ/ton<br />
1.25<br />
1.23<br />
1.21<br />
2011 2012<br />
2013 YTD<br />
17
Asset optimisation at Vanderbijlpark<br />
• Closure of electric arc furnace<br />
– Vanderbijlpark has sufficient capacity to meet domestic and<br />
AOL demand<br />
– Allows <strong>the</strong> full utilization of <strong>the</strong> BF route<br />
• Closure of caster 3<br />
– Improve productivity of casters V1 and V2<br />
• Closure of coke oven battery 3<br />
– Reduced blast furnace consumption<br />
– Import coke for Saldanha steel is more cost effective<br />
– poor technical status of battery 3 required stop of production<br />
• Improve productivity in cold rolling mills<br />
– Run pickling line / cold rolling north at full capacity<br />
– Restructure shift pattern in cold rolling south<br />
19
Key messages<br />
• Comprehensive cost savings<br />
• Operational performance enhanced with new management<br />
systems implemented<br />
• Focus on improving asset reliability<br />
• Our assets will continue to receive adequate repair and<br />
maintenance to ensure our reliability<br />
• Quality is focus area and we are showing positive results<br />
• Asset optimization leading to improved utilization rates<br />
• Energy efficiencies improved by reduced fuel rates, lower<br />
electricity and gas consumption<br />
Zero fatalities with record LTIFRs<br />
20
Thank you<br />
www.arcelormittalsa.c<br />
om