Report on the Physical Nature of the Victorian Fires occurring on 7th ...
Report on the Physical Nature of the Victorian Fires occurring on 7th ...
Report on the Physical Nature of the Victorian Fires occurring on 7th ...

You also want an ePaper? Increase the reach of your titles
YUMPU automatically turns print PDFs into web optimized ePapers that Google loves.
F<br />
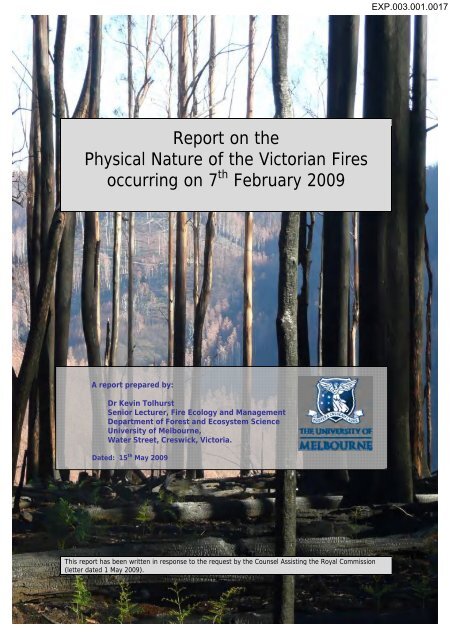
EXP.003.001.0017<br />
<str<strong>on</strong>g>Report</str<strong>on</strong>g> <strong>on</strong> <strong>the</strong><br />
<strong>Physical</strong> <strong>Nature</strong> <strong>of</strong> <strong>the</strong> <strong>Victorian</strong> <strong>Fires</strong><br />
<strong>occurring</strong> <strong>on</strong> 7 th February 2009<br />
A report prepared by:<br />
Dr Kevin Tolhurst<br />
Senior Lecturer, Fire Ecology and Management<br />
Department <strong>of</strong> Forest and Ecosystem Science<br />
University <strong>of</strong> Melbourne,<br />
Water Street, Creswick, Victoria.<br />
Dated: 15 th May 2009<br />
This report has been written in resp<strong>on</strong>se to <strong>the</strong> request by <strong>the</strong> Counsel Assisting <strong>the</strong> Royal Commissi<strong>on</strong><br />
(letter dated 1 May 2009).
EXP.003.001.0018<br />
Tolhurst (2009)<br />
“Describing The Black Saturday <strong>Fires</strong>”<br />
<str<strong>on</strong>g>Report</str<strong>on</strong>g> <strong>on</strong> <strong>the</strong> <strong>Physical</strong> <strong>Nature</strong> <strong>of</strong> <strong>the</strong> <strong>Victorian</strong> <strong>Fires</strong><br />
<strong>occurring</strong> <strong>on</strong> 7 th February 2009<br />
Dr Kevin Tolhurst, 15 th May 2009<br />
This report has been written in resp<strong>on</strong>se to <strong>the</strong> request by <strong>the</strong> Counsel Assisting <strong>the</strong><br />
Royal Commissi<strong>on</strong> (letter dated 1 May 2009). Specifically, <strong>the</strong> request was to provide a<br />
written report, “which describes in general terms <strong>the</strong> major aspects <strong>of</strong> <strong>the</strong> behaviour <strong>of</strong><br />
<strong>the</strong> fires including:<br />
(i) <strong>the</strong> intensity <strong>of</strong> <strong>the</strong> fires (energy c<strong>on</strong>sumed);<br />
(ii) rate <strong>of</strong> spread;<br />
(iii)<br />
(iv)<br />
radiant heat and spotting;<br />
a comparis<strong>on</strong> with <strong>the</strong> behaviour <strong>of</strong> o<strong>the</strong>r major fires (for example <strong>the</strong> Ash<br />
Wednesday fires) to <strong>the</strong> extent that you are able to make comparis<strong>on</strong>s with<br />
<strong>the</strong> available data, with <strong>the</strong> time allowed for <strong>the</strong> delivery <strong>of</strong> your report; and<br />
(v) Identificati<strong>on</strong> <strong>of</strong> <strong>the</strong> challenges that <strong>the</strong> scale and intensity fires <strong>of</strong> 7<br />
February 2009 presented for fire management at <strong>the</strong> incident c<strong>on</strong>trol level.”<br />
Preface<br />
At <strong>the</strong> time <strong>of</strong> preparing this report, a comprehensive analysis <strong>of</strong> <strong>the</strong> wea<strong>the</strong>r c<strong>on</strong>diti<strong>on</strong>s<br />
across <strong>the</strong> State (by <strong>the</strong> Bureau <strong>of</strong> Meteorology) and <strong>the</strong> behaviour <strong>of</strong> <strong>the</strong> fires (by <strong>the</strong><br />
Bushfire CRC <strong>on</strong> behalf <strong>of</strong> <strong>the</strong> Country Fire Authority and <strong>the</strong> Department <strong>of</strong><br />
Sustainability and Envir<strong>on</strong>ment, Victoria) have not been completed. These analyses<br />
and o<strong>the</strong>r eyewitness accounts will provide more detail than can be achieved at this<br />
point in time by <strong>the</strong> author.<br />
This report is based <strong>on</strong> pers<strong>on</strong>al knowledge <strong>of</strong> <strong>the</strong> fires during and after <strong>the</strong> event,<br />
intelligence ga<strong>the</strong>red during <strong>the</strong> fire whilst performing <strong>the</strong> duty <strong>of</strong> a Fire Behaviour<br />
Specialist, and<br />
• Video footage recorded by Sim<strong>on</strong> Langd<strong>on</strong>, Managing Director, EYEfi Pty. Ltd.<br />
from a camera located at Mt Poley, 12 km south <strong>of</strong> Marysville and 23 km east <strong>of</strong><br />
Healesville.<br />
• Video footage recorded by Daryl Hull in Marysville.<br />
• Still photographs taken by Jacqueline Brooks, from Harvest Close, Romsey, 20 km<br />
west-south-west <strong>of</strong> Kilmore.<br />
• Various records <strong>of</strong> fire reports collated by <strong>the</strong> Country Fire Authority and<br />
presented in Google Earth format (4D_STAR_2009_05_12.kmz)<br />
<str<strong>on</strong>g>Report</str<strong>on</strong>g> <strong>on</strong> <strong>the</strong> <strong>Physical</strong> <strong>Nature</strong> <strong>of</strong> <strong>the</strong> <strong>Victorian</strong> Fire <strong>occurring</strong> <strong>on</strong> <strong>7th</strong> February 2009.doc Page 2 <strong>of</strong> 18
EXP.003.001.0019<br />
Tolhurst (2009)<br />
“Describing The Black Saturday <strong>Fires</strong>”<br />
The <strong>Nature</strong> <strong>of</strong> Fire Behaviour<br />
Fire behaviour is determined by <strong>the</strong> interacti<strong>on</strong> <strong>of</strong> four primary factors: fuel, wea<strong>the</strong>r,<br />
topography and <strong>the</strong> fire itself. Diagrammatically, this is shown in Fig. 1.<br />
Topography<br />
Topography<br />
Wea<strong>the</strong>r Wea<strong>the</strong>r<br />
Fire<br />
Fuel<br />
Fire Behaviour Triangle<br />
Figure 1.<br />
Factors important in determining bushfire behaviour. Each element is<br />
affected by and in turn affects each o<strong>the</strong>r element.<br />
Wea<strong>the</strong>r<br />
Elements <strong>of</strong> <strong>the</strong> wea<strong>the</strong>r critical to fire behaviour include predisposing seas<strong>on</strong>al<br />
c<strong>on</strong>diti<strong>on</strong>s such as drought, shorter-term episodic events like heat waves and storms,<br />
dynamic situati<strong>on</strong>s such as periods <strong>of</strong> extreme temperature combined with low air<br />
moistures and str<strong>on</strong>g winds, and atmospheric patterns such as <strong>the</strong> passage <strong>of</strong> low<br />
pressure troughs and cold fr<strong>on</strong>ts across <strong>the</strong> landscape.<br />
In <strong>the</strong> case <strong>of</strong> <strong>the</strong> fires in 2009, parts <strong>of</strong> Victoria have had significantly below <strong>the</strong><br />
average rainfall for 13 years, a very severe drought. Most <strong>of</strong> Victoria had <strong>the</strong> driest<br />
period <strong>on</strong> record or in <strong>the</strong> lowest <strong>on</strong>e percentile <strong>of</strong> records (Fig. 2). Prol<strong>on</strong>ged drought<br />
leads to plant death and <strong>the</strong> thinning out <strong>of</strong> many plant communities adding to <strong>the</strong> dead<br />
material in forests, parks and gardens, particularly woody material.<br />
“Black Saturday”, 7 February 2009, had been preceded by a record breaking heat wave<br />
across <strong>the</strong> State in <strong>the</strong> last week <strong>of</strong> January. Maximum daily temperatures for<br />
Melbourne were near or exceeding 30 o C for <strong>the</strong> 11 days prior to “Black Saturday”. This<br />
heat wave was unusual in that it scorched many green plants and destroyed many<br />
horticultural crops. This period <strong>of</strong> desiccati<strong>on</strong> was important in pre-drying many live<br />
plants making <strong>the</strong>m more combustible.<br />
Temperatures <strong>on</strong> 7 February 2009 were <strong>the</strong> highest <strong>on</strong> record across most <strong>of</strong> <strong>the</strong> State<br />
(Fig. 3). In Melbourne, <strong>the</strong> maximum temperature reached 47 o C. Such high<br />
temperatures lead to rapid and extreme fuel drying and bring <strong>the</strong> fuels closer to <strong>the</strong><br />
kindling temperature and <strong>the</strong>refore aid igniti<strong>on</strong> from whatever source, including burning<br />
embers.<br />
<str<strong>on</strong>g>Report</str<strong>on</strong>g> <strong>on</strong> <strong>the</strong> <strong>Physical</strong> <strong>Nature</strong> <strong>of</strong> <strong>the</strong> <strong>Victorian</strong> Fire <strong>occurring</strong> <strong>on</strong> <strong>7th</strong> February 2009.doc Page 3 <strong>of</strong> 18
EXP.003.001.0020<br />
Tolhurst (2009)<br />
“Describing The Black Saturday <strong>Fires</strong>”<br />
The amount <strong>of</strong> moisture in <strong>the</strong> air was also extremely low. The relative humidity was<br />
less than 10% for several hours. This very dry air forces drying <strong>of</strong> dead fuels and<br />
stresses live fuels, dropping <strong>the</strong>ir moisture c<strong>on</strong>tent as well. Combined with high air<br />
temperatures, fuels are primed for igniti<strong>on</strong> which manifests itself in more explosive fire<br />
behaviour.<br />
Australian Go ernment<br />
Bureau <strong>of</strong> Ssrlnm loge'<br />
HgMrst <strong>on</strong><br />
Record<br />
Very Muoe<br />
AWVC AVCM1ge<br />
69 goose Average<br />
4-I Average<br />
2-3 Below Average<br />
Vrrr M.P.<br />
Average<br />
Lowest <strong>on</strong><br />
ReCatl<br />
M1IIVIMnctmnwv:w<br />
Australian Rainfall Deciles<br />
I April 2006 to 31 March 2009<br />
latbuli n Sash or. Griddod Data<br />
laoeuet<strong>of</strong> Me Nafarral Climate Centre<br />
OCui.vr mrdll.rl Awrlrrlu:SPo.PUalralrarr awwWapanaFUr<br />
^<br />
Nan 01052Wd<br />
Figure 2.<br />
Australian rainfall deciles for <strong>the</strong> three years up until 30 March 2009. Note<br />
<strong>the</strong> extent <strong>of</strong> extremely low rainfall in sou<strong>the</strong>rn Australia.<br />
Figure 3.<br />
Daily maximum temperature extremes. Red areas indicate <strong>the</strong> highest <strong>on</strong><br />
record.<br />
<str<strong>on</strong>g>Report</str<strong>on</strong>g> <strong>on</strong> <strong>the</strong> <strong>Physical</strong> <strong>Nature</strong> <strong>of</strong> <strong>the</strong> <strong>Victorian</strong> Fire <strong>occurring</strong> <strong>on</strong> <strong>7th</strong> February 2009.doc Page 4 <strong>of</strong> 18
EXP.003.001.0021<br />
Tolhurst (2009)<br />
“Describing The Black Saturday <strong>Fires</strong>”<br />
Once a fire has started, <strong>the</strong> heat and many <strong>of</strong> <strong>the</strong> combusti<strong>on</strong> products rise in <strong>the</strong> smoke<br />
plume. They rise because <strong>the</strong>y are hotter and <strong>the</strong>refore less dense than <strong>the</strong> surrounding<br />
air. Eventually <strong>the</strong>y mix with <strong>the</strong> surrounding air and cool until <strong>the</strong>y reach an<br />
equilibrium with <strong>the</strong>ir surroundings. This may be several thousand metres above <strong>the</strong><br />
ground. These smoke plumes, created by <strong>the</strong> bushfire, help coalesce <strong>the</strong> burning area<br />
including <strong>the</strong> thousands <strong>of</strong> spotfires. This is because air is drawn into <strong>the</strong> base <strong>of</strong> <strong>the</strong><br />
smoke plume to replace <strong>the</strong> rising air. Two particular factors are important in <strong>the</strong> nature<br />
<strong>of</strong> <strong>the</strong> plume – <strong>the</strong> amount <strong>of</strong> heat being released from <strong>the</strong> fuel burning in <strong>the</strong> fire and<br />
<strong>the</strong> instability <strong>of</strong> <strong>the</strong> atmosphere. Atmospheric instability is a measure <strong>of</strong> how easy it is<br />
for a parcel <strong>of</strong> warm air to rise in <strong>the</strong> atmosphere. In an unstable atmosphere, it is easy<br />
for a parcel <strong>of</strong> air to rise. Thunderstorms develop in unstable atmospheres because<br />
warm moist air rises readily forming <strong>the</strong> thunder clouds. On 7 th February 2009, a low<br />
pressure trough passed over <strong>the</strong> fire area ahead <strong>of</strong> a cold fr<strong>on</strong>t (Fig. 4). Low pressure<br />
troughs are lines <strong>of</strong> unstable air and enhance <strong>the</strong> development <strong>of</strong> smoke plumes leading<br />
to <strong>the</strong> formati<strong>on</strong> <strong>of</strong> pyrocumulus clouds, which can and did develop into a fire induced<br />
thunderstorm <strong>on</strong> <strong>the</strong> evening <strong>of</strong> “Black Saturday”. At around 1924 hours, <strong>the</strong><br />
pyrocumulus cloud was estimated by scaling a photograph (Fig. 5) to be 8,500 m high<br />
with <strong>the</strong> smoke rising to around 5,200 m.<br />
Figure 4. A mean sea-level pressure analysis made at 1700 hrs <strong>on</strong> 7 th February 2009<br />
showing a low pressure trough over <strong>the</strong> fire area (red dashed line) ahead <strong>of</strong><br />
<strong>the</strong> cold fr<strong>on</strong>t (black barbed line) in <strong>the</strong> Great Australian Bight.<br />
Pyrocumulus cloud is formed when water vapour in <strong>the</strong> smoke plume rises to a level<br />
where it cools below <strong>the</strong> c<strong>on</strong>densati<strong>on</strong> point. When <strong>the</strong> water vapour c<strong>on</strong>denses to<br />
water droplets or ice crystals, to form <strong>the</strong> cloud, heat is released. This heat is called <strong>the</strong><br />
“latent heat <strong>of</strong> vaporizati<strong>on</strong>” and it amounts to 2.44 kJ/g <strong>of</strong> water. Water in <strong>the</strong> smoke<br />
plume is a combinati<strong>on</strong> <strong>of</strong> free water evaporated in <strong>the</strong> pre-heating process and water<br />
produced during <strong>the</strong> combusti<strong>on</strong> reacti<strong>on</strong>. On average, about 40% <strong>of</strong> <strong>the</strong> smoke plume<br />
is water vapour. The formati<strong>on</strong> <strong>of</strong> <strong>the</strong> pyrocumulus cloud effectively adds fur<strong>the</strong>r heat<br />
to <strong>the</strong> smoke column, reinforcing <strong>the</strong> updraught <strong>of</strong> <strong>the</strong> plume over <strong>the</strong> fire area. The<br />
c<strong>on</strong>densati<strong>on</strong> <strong>of</strong> water vapour from <strong>on</strong>e t<strong>on</strong>ne <strong>of</strong> burnt fuel would add about 2.44 GJ <strong>of</strong><br />
energy to <strong>the</strong> c<strong>on</strong>vecti<strong>on</strong> column. An experiment in Western Australia showed that <strong>the</strong><br />
<str<strong>on</strong>g>Report</str<strong>on</strong>g> <strong>on</strong> <strong>the</strong> <strong>Physical</strong> <strong>Nature</strong> <strong>of</strong> <strong>the</strong> <strong>Victorian</strong> Fire <strong>occurring</strong> <strong>on</strong> <strong>7th</strong> February 2009.doc Page 5 <strong>of</strong> 18
EXP.003.001.0022<br />
Tolhurst (2009)<br />
“Describing The Black Saturday <strong>Fires</strong>”<br />
heat released in this process approximately doubled <strong>the</strong> amount <strong>of</strong> heat produced by <strong>the</strong><br />
burning fuel al<strong>on</strong>e.<br />
The Modis satellite image captured at about 1555 hours <strong>on</strong> “Black Saturday”, shows <strong>the</strong><br />
relative locati<strong>on</strong> <strong>of</strong> <strong>the</strong> fires in central Victoria (Fig. 6). It is worth noting that <strong>of</strong> <strong>the</strong><br />
100 odd fires starting <strong>on</strong> this day, <strong>the</strong> <strong>on</strong>es doing <strong>the</strong> most damage and developing to <strong>the</strong><br />
greatest extent were those aligned with <strong>the</strong> prefr<strong>on</strong>tal trough during <strong>the</strong> mid-afterno<strong>on</strong>.<br />
A low pressure trough was also a significant factor in <strong>the</strong> 2003 fires that burnt into<br />
Canberra <strong>on</strong> <strong>the</strong> 18 th January and into Wulgulmerang in <strong>the</strong> Gelantipy valley <strong>on</strong> <strong>the</strong> 30 th<br />
January and <strong>the</strong> Berringa fire in west-central Victoria in 25 th February1995.<br />
Ano<strong>the</strong>r wea<strong>the</strong>r element critical to <strong>the</strong> nature <strong>of</strong> <strong>the</strong> fire behaviour <strong>on</strong> 7 th February, and<br />
comm<strong>on</strong> to many (most) o<strong>the</strong>r bushfire disasters in Victoria, is <strong>the</strong> passage <strong>of</strong> a cold<br />
fr<strong>on</strong>t across <strong>the</strong> fire area. Recent research has identified a number <strong>of</strong> cold fr<strong>on</strong>ts types,<br />
but a comm<strong>on</strong> element to all <strong>of</strong> <strong>the</strong>m is how <strong>the</strong>y turn <strong>the</strong> flank <strong>of</strong> a l<strong>on</strong>g and narrow<br />
(cigar shaped) fire driven by str<strong>on</strong>g nor<strong>the</strong>rly winds into a fire fr<strong>on</strong>t several kilometres<br />
wide. Typically, about 80% <strong>of</strong> <strong>the</strong> total area burnt occurs after this wind change. As a<br />
c<strong>on</strong>sequence <strong>of</strong> both <strong>the</strong> extent <strong>of</strong> <strong>the</strong> fire fr<strong>on</strong>t and <strong>the</strong> sudden change in directi<strong>on</strong> <strong>of</strong><br />
<strong>the</strong> wind, this is also when a high proporti<strong>on</strong> <strong>of</strong> <strong>the</strong> fire damage occurs. The passage <strong>of</strong><br />
a cold fr<strong>on</strong>t was an important part <strong>of</strong> <strong>the</strong> Ash Wednesday fires in 1983 and <strong>the</strong><br />
numerous fires in 1977 to name a few.<br />
Finally, <strong>the</strong> wind pr<strong>of</strong>ile <strong>on</strong> a day when a cold fr<strong>on</strong>t is passing across <strong>the</strong> State, <strong>of</strong>ten<br />
shows a significant difference in <strong>the</strong> surface and <strong>the</strong> upper winds. On <strong>the</strong> 7 th February,<br />
<strong>the</strong> upper winds were already more westerly than <strong>the</strong> surface winds at 1000 hrs in <strong>the</strong><br />
morning (Fig. 7). The significance <strong>of</strong> this was that burning firebrands carried al<strong>of</strong>t in<br />
<strong>the</strong> smoke plume (c<strong>on</strong>vecti<strong>on</strong> column) were being acted up<strong>on</strong> by winds from a different<br />
directi<strong>on</strong> to that driving <strong>the</strong> surface fire. This resulted in two phenomena; firstly, <strong>the</strong>re<br />
was a predominance <strong>of</strong> spotfires being started to <strong>the</strong> nor<strong>the</strong>ast (left) <strong>of</strong> <strong>the</strong> main fire path<br />
when it was being driven by <strong>the</strong> nor<strong>the</strong>rly winds. This is evident in <strong>the</strong> video footage<br />
from Mt Poley where a spotfire was observed burning <strong>on</strong> <strong>the</strong> ridge to <strong>the</strong> west <strong>of</strong> Mt<br />
Poley at 1643 hours, more than an hour before <strong>the</strong> main fire fr<strong>on</strong>t burnt through this<br />
area. This was also evident in <strong>the</strong> reports <strong>of</strong> spotfires in mid- to late-afterno<strong>on</strong> in <strong>the</strong><br />
Kinglake area while <strong>the</strong> fire was still burning towards <strong>the</strong> south <strong>of</strong> <strong>the</strong> area, whereas <strong>the</strong><br />
main fire fr<strong>on</strong>t travelled through Kinglake in <strong>the</strong> late afterno<strong>on</strong> and early evening (CFA<br />
4D Star presentati<strong>on</strong>). Similarly, spotfires were <strong>occurring</strong> <strong>on</strong> <strong>the</strong> outskirts <strong>of</strong> Marysville<br />
around 1824 hrs, but <strong>the</strong> main fire did not move through <strong>the</strong> town until about 1900 hrs<br />
(ABC 4 Corners report, 27 April 2009). The sec<strong>on</strong>d effect was for <strong>the</strong> c<strong>on</strong>vecti<strong>on</strong><br />
column to be blown more to <strong>the</strong> east and hence “drag” <strong>the</strong> head <strong>of</strong> <strong>the</strong> fire more to <strong>the</strong><br />
east as if it were being acted up<strong>on</strong> by a more westerly wind. On “Black Saturday”, this<br />
effectively made <strong>the</strong> fire track about 10 degrees fur<strong>the</strong>r to <strong>the</strong> east.<br />
<str<strong>on</strong>g>Report</str<strong>on</strong>g> <strong>on</strong> <strong>the</strong> <strong>Physical</strong> <strong>Nature</strong> <strong>of</strong> <strong>the</strong> <strong>Victorian</strong> Fire <strong>occurring</strong> <strong>on</strong> <strong>7th</strong> February 2009.doc Page 6 <strong>of</strong> 18
EXP.003.001.0023<br />
Tolhurst (2009)<br />
“Describing The Black Saturday <strong>Fires</strong>”<br />
Figure 5.<br />
Pyrocumulus cloud from <strong>the</strong> Kilmore East fire viewed from Romsey, 33 km to<br />
<strong>the</strong> west <strong>of</strong> <strong>the</strong> fire at 1924 hrs, 7 February 2009. Cloud height estimated to<br />
be 8,500 m above ground level. (Photo: Jacqueline Brooks, P2070054.JPG)<br />
Redesdale<br />
Kilmore<br />
Murrindindi<br />
Dargo<br />
MELBOURNE<br />
Bunyip<br />
Churchill<br />
Modis – Aqua, 15:55 hrs, 7 Feb 2009<br />
Wils<strong>on</strong>s Prom<br />
Figure 6.<br />
Modis satellite image acquired about 1555 hrs, 7 th February 2009. Note <strong>the</strong><br />
alignment <strong>of</strong> <strong>the</strong> fires and smoke plumes with <strong>the</strong> cloud pattern and<br />
approaching cold fr<strong>on</strong>t.<br />
<str<strong>on</strong>g>Report</str<strong>on</strong>g> <strong>on</strong> <strong>the</strong> <strong>Physical</strong> <strong>Nature</strong> <strong>of</strong> <strong>the</strong> <strong>Victorian</strong> Fire <strong>occurring</strong> <strong>on</strong> <strong>7th</strong> February 2009.doc Page 7 <strong>of</strong> 18
EXP.003.001.0024<br />
0<br />
Tolhurst (2009)<br />
“Describing The Black Saturday <strong>Fires</strong>”<br />
Sounding courtesy <strong>of</strong> <strong>the</strong> Australian Bureau <strong>of</strong> Meteorology.<br />
Raw data sourced from <strong>the</strong> University <strong>of</strong> Wyoming.<br />
PS : 990HPa<br />
TS 34.86c<br />
DS : 7.82c<br />
LCL : 670mb<br />
LFC : 0mb<br />
CAP 27.92c<br />
CIN : 0 j/kg<br />
CAPE :<br />
j/kg<br />
: 23.3c<br />
LI : 2.2c<br />
TT 44.6c<br />
K-IN<br />
SWEAT 604<br />
FRZ : 582mb<br />
HEL<br />
EHI<br />
PW :<br />
TH : 5740m<br />
40<br />
Melbourne Intl Airport 11000TC Feb 6 2009 (Analysis) soundings.bsch.au.com<br />
94866 23001JTC Feb 6 2009Analysis<br />
Figure 7.<br />
Temperature, dew point and wind observati<strong>on</strong>s with height above ground<br />
level taken at 1000 hours <strong>on</strong> Saturday 7 February 2009, at <strong>the</strong> Melbourne<br />
Airport. Note <strong>the</strong> increasing westerly wind directi<strong>on</strong> with elevati<strong>on</strong>.<br />
<str<strong>on</strong>g>Report</str<strong>on</strong>g> <strong>on</strong> <strong>the</strong> <strong>Physical</strong> <strong>Nature</strong> <strong>of</strong> <strong>the</strong> <strong>Victorian</strong> Fire <strong>occurring</strong> <strong>on</strong> <strong>7th</strong> February 2009.doc Page 8 <strong>of</strong> 18
EXP.003.001.0025<br />
0<br />
Tolhurst (2009)<br />
“Describing The Black Saturday <strong>Fires</strong>”<br />
Sounding courtesy <strong>of</strong> <strong>the</strong> Australian Bureau <strong>of</strong> Meteorology.<br />
Raw data sourced from <strong>the</strong> University <strong>of</strong> Wyoming.<br />
75<br />
PS : 993HPa<br />
TS : 28.43c<br />
DS : 13.95c<br />
79<br />
74<br />
70<br />
rr- 71<br />
LCL : 804mb<br />
LFC : 0mb<br />
CAP 29.77c<br />
CIN 0 j/kg<br />
CAPE :<br />
j/kg<br />
: 29.5c<br />
LI : 0.8c<br />
TT : 50c<br />
K-IN<br />
SWEAT 369<br />
FRZ : 586mb<br />
e \ 65 HEL :<br />
EHI :<br />
52<br />
PW :<br />
TH : 5740m<br />
40<br />
2999n<br />
6562ft<br />
977n<br />
3295ft<br />
129n<br />
394ft<br />
Melbourne Intl Airport 23000TC Feb 6 2009 (Analysis) soundings.bsch.au.com<br />
94866 11001JTC Feb 7 2009Analysis<br />
Figure 8.<br />
Temperature, dew point and wind observati<strong>on</strong>s with height above ground<br />
level taken at 2200 hrs <strong>on</strong> Saturday 7 February 2009, at <strong>the</strong> Melbourne<br />
Airport.<br />
<str<strong>on</strong>g>Report</str<strong>on</strong>g> <strong>on</strong> <strong>the</strong> <strong>Physical</strong> <strong>Nature</strong> <strong>of</strong> <strong>the</strong> <strong>Victorian</strong> Fire <strong>occurring</strong> <strong>on</strong> <strong>7th</strong> February 2009.doc Page 9 <strong>of</strong> 18
EXP.003.001.0026<br />
Tolhurst (2009)<br />
“Describing The Black Saturday <strong>Fires</strong>”<br />
Fuels<br />
Fuels across <strong>the</strong> areas burnt varied from grassland to s<strong>of</strong>twood and hardwood<br />
plantati<strong>on</strong>s, dry forest, mountain forests, rainforests and subalpine woodlands.<br />
Due to <strong>the</strong> drought c<strong>on</strong>diti<strong>on</strong>s, many <strong>of</strong> <strong>the</strong> normally moist forests were dry and carried<br />
fire easily. In <strong>the</strong> Mountain Ash forests in Melbourne’s water catchments, fires were<br />
backing down hills in relatively uniform flame fr<strong>on</strong>ts with a height <strong>of</strong> about <strong>on</strong>e metre.<br />
Normally <strong>the</strong>se forests would be too moist to burn.<br />
Fine fuels, defined as those fuels burning in <strong>the</strong> flaming z<strong>on</strong>e <strong>of</strong> <strong>the</strong> fire, varied from<br />
about 1.5 t/ha in eaten-out grass paddocks, to about 45 t/ha in mountain forests,<br />
averaging about 25 t/ha across most <strong>of</strong> <strong>the</strong> burnt area. It is <strong>the</strong>se fuels that carry <strong>the</strong> fire<br />
fr<strong>on</strong>t and largely determine <strong>the</strong> flame height <strong>of</strong> <strong>the</strong> fire. Green vegetati<strong>on</strong> will normally<br />
<strong>on</strong>ly burn if it has sufficient dry fuel around it. In <strong>the</strong> case <strong>of</strong> grass this proporti<strong>on</strong> <strong>of</strong><br />
live to dead fuel is called <strong>the</strong> degree <strong>of</strong> curing. As a result <strong>of</strong> <strong>the</strong> heatwave in late<br />
January, <strong>the</strong>re had already been a degree <strong>of</strong> desiccati<strong>on</strong> in <strong>the</strong> green vegetati<strong>on</strong> and an<br />
increase in <strong>the</strong> degree <strong>of</strong> curing in grasslands. This added to <strong>the</strong> total amount <strong>of</strong> fuel<br />
available to burn. A similar situati<strong>on</strong> occurred in 1982/3 before <strong>the</strong> Ash Wednesday<br />
fires, but via a different process. Unusually severe frosts and heavy snowfalls before<br />
<strong>the</strong> summer in 1982 resulted in a significantly greater amount <strong>of</strong> normally green<br />
vegetati<strong>on</strong> being desiccated before <strong>the</strong> fires. In both cases this additi<strong>on</strong>al dry fuel<br />
resulted in more energy being available to drive <strong>the</strong> fire instead <strong>of</strong> being used to dry <strong>the</strong><br />
fuel and heat it to <strong>the</strong> kindling temperature.<br />
Woody fuels such as twigs, branches, fallen trees and dead standing trees also caught<br />
fire and added c<strong>on</strong>siderably to <strong>the</strong> amount <strong>of</strong> heat coming <strong>of</strong>f <strong>the</strong> burnt area. The heat<br />
generated from <strong>the</strong>se woody fuels can add c<strong>on</strong>siderably to <strong>the</strong> heat in <strong>the</strong> main<br />
c<strong>on</strong>vecti<strong>on</strong> column and hence help drive <strong>the</strong> fire. These woody fuels may vary from<br />
about 50 t/ha in dry foothill forests and woodlands to over 200 t/ha in <strong>the</strong> wet mountain<br />
forests. Video footage <strong>of</strong> <strong>the</strong> fires burning at Mt Poley, Marysville and Kinglake all<br />
show this wood fuel burning freely and with very l<strong>on</strong>g burn out times, in excess <strong>of</strong> five<br />
hours in <strong>the</strong> case <strong>of</strong> Mt Poley (see timelines in Appendix <strong>of</strong> this report).<br />
Topography<br />
The “Black Saturday” fires burnt from grassy plains to alpine meadows. There was<br />
over 1,000 m <strong>of</strong> elevati<strong>on</strong> range in <strong>the</strong> areas burnt. With this elevati<strong>on</strong> range <strong>the</strong>re were<br />
<strong>the</strong> effects <strong>of</strong> fires running up hills and backing down o<strong>the</strong>rs and all variati<strong>on</strong>s in<br />
between. These elevati<strong>on</strong> differences were associated with differences in vegetati<strong>on</strong><br />
types and <strong>the</strong>refore fuels in terms <strong>of</strong> quantity, structure, compositi<strong>on</strong> and moisture<br />
c<strong>on</strong>tent. The range <strong>of</strong> topography involved in <strong>the</strong> 2009 fires was similar to that burnt in<br />
1939, 1982, 2003, and 2007.<br />
An important aspect <strong>of</strong> <strong>the</strong> topography was <strong>the</strong> way <strong>the</strong> winds changed with elevati<strong>on</strong>,<br />
both in terms <strong>of</strong> speed and directi<strong>on</strong>. For example, when <strong>the</strong> Kilmore East fire burnt up<br />
<strong>the</strong> side <strong>of</strong> Mt Disappointment, <strong>the</strong> winds became str<strong>on</strong>ger and more westerly than those<br />
lower down in <strong>the</strong> valleys. This resulted in <strong>the</strong> fire being directed more towards<br />
<str<strong>on</strong>g>Report</str<strong>on</strong>g> <strong>on</strong> <strong>the</strong> <strong>Physical</strong> <strong>Nature</strong> <strong>of</strong> <strong>the</strong> <strong>Victorian</strong> Fire <strong>occurring</strong> <strong>on</strong> <strong>7th</strong> February 2009.doc Page 10 <strong>of</strong> 18
EXP.003.001.0027<br />
Tolhurst (2009)<br />
“Describing The Black Saturday <strong>Fires</strong>”<br />
Stra<strong>the</strong>wen and Kinglake West ra<strong>the</strong>r than towards Whittlesea, but it also meant that<br />
firebrands were blown fur<strong>the</strong>r as well, reaching <strong>the</strong> area north <strong>of</strong> Healesville. This is a<br />
distance <strong>of</strong> about 35 km, with <strong>the</strong> previous l<strong>on</strong>gest spotting distance recorded being<br />
30 km from a fire in Gippsland. Similarly, <strong>the</strong> Churchill fire in south Gippsland threw<br />
firebrands 23 km from <strong>the</strong> top <strong>of</strong> <strong>the</strong> Strezlecki Range down to <strong>the</strong> Yarram area. The<br />
predicted spotting distance was <strong>on</strong>ly about 15 km, but because <strong>the</strong> winds were str<strong>on</strong>ger<br />
at <strong>the</strong> top <strong>of</strong> <strong>the</strong> range, embers were carried fur<strong>the</strong>r.<br />
The topography was also a factor in creating a fire induced wind str<strong>on</strong>g enough to snap<br />
<strong>of</strong>f trees in a gully in <strong>the</strong> Bunyip Ridge fire (Fig. 9). Winds would need to be in excess<br />
<strong>of</strong> 120 km/h to cause this type <strong>of</strong> damage.<br />
V<br />
• -<br />
-- •<br />
Figure 9.<br />
Gully <strong>of</strong> trees snapped <strong>of</strong> by high fire induced winds. Jack Road, Bunyip<br />
Ridge Fire. (Photo: Derek Ch<strong>on</strong>g, Uni. Melb.)<br />
Fire Itself<br />
The fire helps enhance itself as previously menti<strong>on</strong>ed, by creating it own local winds<br />
with indraughts into <strong>the</strong> c<strong>on</strong>vecti<strong>on</strong> column. It also enhances itself by producing and<br />
projecting firebrands to create spotfires ahead <strong>of</strong> itself. The degree to which <strong>the</strong> fire<br />
provides a positive feedback <strong>on</strong> its behaviour is influenced in part by <strong>the</strong> wea<strong>the</strong>r, <strong>the</strong><br />
fuel and <strong>the</strong> topography, but it also depends <strong>on</strong> <strong>the</strong> size <strong>of</strong> <strong>the</strong> fire.<br />
As a fire becomes larger, it tends to “see” <strong>the</strong> fuels and topography differently. Fire<br />
effectively integrates or averages out <strong>the</strong> fuels and topography within its “footprint”.<br />
The mechanism for doing this integrati<strong>on</strong> is <strong>the</strong> c<strong>on</strong>vecti<strong>on</strong> column.<br />
<str<strong>on</strong>g>Report</str<strong>on</strong>g> <strong>on</strong> <strong>the</strong> <strong>Physical</strong> <strong>Nature</strong> <strong>of</strong> <strong>the</strong> <strong>Victorian</strong> Fire <strong>occurring</strong> <strong>on</strong> <strong>7th</strong> February 2009.doc Page 11 <strong>of</strong> 18
EXP.003.001.0028<br />
Tolhurst (2009)<br />
“Describing The Black Saturday <strong>Fires</strong>”<br />
An extreme example <strong>of</strong> how <strong>the</strong> fire feeds back <strong>on</strong> itself, was <strong>the</strong> way in which <strong>the</strong><br />
pyrocumulus clouds developed into a thunderstorm. These thunderstorms produced<br />
lightning which initiated a new set <strong>of</strong> fires. Many <strong>of</strong> <strong>the</strong>se new fires were in<br />
Melbourne’s water catchments. Fortunately, most <strong>of</strong> <strong>the</strong> new lightning fires were<br />
suppressed while still relatively small. In 2003, lightning induced by a pyrocumulus<br />
cloud started fires in <strong>the</strong> Snow River Nati<strong>on</strong>al Park, 25 km ahead <strong>of</strong> <strong>the</strong> fire fr<strong>on</strong>t.<br />
These fires did develop into a significant area. O<strong>the</strong>r examples exist <strong>of</strong> this<br />
phenomen<strong>on</strong>.<br />
General Fire Behaviour<br />
A unique aspect <strong>of</strong> <strong>the</strong>se fires was <strong>the</strong> extent <strong>of</strong> <strong>the</strong> “fire-active area”. This was a<br />
functi<strong>on</strong> <strong>of</strong> <strong>the</strong> dryness <strong>of</strong> <strong>the</strong> fuels brought about by <strong>the</strong> severe drought c<strong>on</strong>diti<strong>on</strong>s and<br />
<strong>the</strong> heat wave in late-January.<br />
Three types <strong>of</strong> fire-active areas can be recognised in <strong>the</strong> fires <strong>of</strong> “Black Saturday”.<br />
• Firstly, <strong>the</strong> area impacted by <strong>the</strong> run <strong>of</strong> <strong>the</strong> initial fire under <strong>the</strong> nor<strong>the</strong>rly wind.<br />
This includes <strong>the</strong> initial buildup phase through to <strong>the</strong> time <strong>of</strong> <strong>the</strong> wind change.<br />
• The sec<strong>on</strong>d type <strong>of</strong> fire-active area is <strong>the</strong> eastern or left-hand flank <strong>of</strong> <strong>the</strong> fire where<br />
spotfires start and develop for <strong>on</strong>e to two hours before being burnt over after <strong>the</strong><br />
wind change.<br />
• The third type <strong>of</strong> fire-active area is <strong>the</strong> area burnt after <strong>the</strong> wind change when <strong>the</strong><br />
flank fire turns into <strong>the</strong> main fire fr<strong>on</strong>t. This area is characterised by a massive<br />
number <strong>of</strong> spotfires with no single coherent fr<strong>on</strong>t.<br />
Each type <strong>of</strong> fire-active area has its own characteristics and implicati<strong>on</strong>s for those being<br />
affected by <strong>the</strong>m. Each type <strong>of</strong> area will be discussed in turn.<br />
The first type <strong>of</strong> fire-active area ahead <strong>of</strong> <strong>the</strong> fire being driven by <strong>the</strong> nor<strong>the</strong>rly wind is<br />
directly under <strong>the</strong> smoke plume and is subjected to spotting. This is normally <strong>the</strong> fastest<br />
and most intense phase <strong>of</strong> <strong>the</strong> fire. It is here that <strong>the</strong> greatest potential impact can occur.<br />
The impact <strong>on</strong> Stra<strong>the</strong>wen is a good example <strong>of</strong> this phase. The <strong>on</strong>ly c<strong>on</strong>solati<strong>on</strong> about<br />
<strong>the</strong> area burnt in this first phase is that <strong>the</strong> fire burns out relatively quickly, but could<br />
still last for an hour.<br />
The sec<strong>on</strong>d type <strong>of</strong> fire-active area is to left or east <strong>of</strong> <strong>the</strong> left-hand flank <strong>of</strong> <strong>the</strong> fire.<br />
This area will be affected for <strong>the</strong> l<strong>on</strong>gest period <strong>of</strong> time because it may be subjected to<br />
fires starting from high-l<strong>of</strong>ted and l<strong>on</strong>g-distance firebrands. This area will be <strong>the</strong> area<br />
first affected <strong>on</strong> <strong>the</strong> wind change so it will be affected by fires coming from multiple<br />
directi<strong>on</strong>s. The durati<strong>on</strong> <strong>of</strong> exposure to running fires could be two hours or more, but it<br />
will be a more gradual process, but may be very c<strong>on</strong>fusing and disorientating.<br />
The third type <strong>of</strong> fire-active area is <strong>the</strong> area burnt after <strong>the</strong> wind change. On and after<br />
<strong>the</strong> wind change, <strong>the</strong>re is a massive release <strong>of</strong> embers and prolific spotting occurs.<br />
Areas previously in relatively clear air will be filled with smoke and embers with <strong>on</strong>ly<br />
limited warning. Because <strong>of</strong> <strong>the</strong> extensive area <strong>of</strong> spotting (20 km or more l<strong>on</strong>g and 5<br />
km or more ahead <strong>of</strong> <strong>the</strong> fire fr<strong>on</strong>t), fire suppressi<strong>on</strong> will be limited to local asset<br />
protecti<strong>on</strong> <strong>on</strong>ly, but <strong>the</strong> dangers <strong>of</strong> getting caught, surrounded by fire, is very high. This<br />
is <strong>the</strong> time when <strong>the</strong>re is a huge potential for loss <strong>of</strong> life and property due to <strong>the</strong><br />
dispersed, but still intense nature <strong>of</strong> <strong>the</strong> fire.<br />
<str<strong>on</strong>g>Report</str<strong>on</strong>g> <strong>on</strong> <strong>the</strong> <strong>Physical</strong> <strong>Nature</strong> <strong>of</strong> <strong>the</strong> <strong>Victorian</strong> Fire <strong>occurring</strong> <strong>on</strong> <strong>7th</strong> February 2009.doc Page 12 <strong>of</strong> 18
EXP.003.001.0029<br />
Tolhurst (2009)<br />
“Describing The Black Saturday <strong>Fires</strong>”<br />
Some Characteristics <strong>of</strong> <strong>the</strong> “Black Saturday” <strong>Fires</strong><br />
Table 1 lists some <strong>of</strong> <strong>the</strong> major fire events in Australia. The fires in Victoria <strong>on</strong> “Black<br />
Saturday” represented <strong>the</strong> worst bushfire disaster in Australia in terms <strong>of</strong> <strong>the</strong> number <strong>of</strong><br />
fatalities. An area <strong>of</strong> approximately 300,000 ha was burnt <strong>on</strong> <strong>the</strong> 7 th February with <strong>the</strong><br />
majority <strong>of</strong> that being burnt in <strong>the</strong> Kilmore East, Murrundindi, Bunyip Ridge and<br />
Churchill fires.<br />
The extremely dry c<strong>on</strong>diti<strong>on</strong>s brought about by <strong>the</strong> combinati<strong>on</strong> <strong>of</strong> over a decade <strong>of</strong><br />
drought, a record breaking heatwave in late-January, and <strong>the</strong> highest temperatures ever<br />
recorded across <strong>the</strong> State combined with extremely str<strong>on</strong>g dry winds to drive fires<br />
unc<strong>on</strong>trollably across <strong>the</strong> landscape.<br />
In terms <strong>of</strong> <strong>the</strong> combinati<strong>on</strong> <strong>of</strong> wea<strong>the</strong>r c<strong>on</strong>diti<strong>on</strong>s, <strong>the</strong>y were <strong>the</strong> most extreme<br />
c<strong>on</strong>diti<strong>on</strong>s ever experienced in Australia with <strong>the</strong> excepti<strong>on</strong> <strong>of</strong> <strong>the</strong> Wangary fires in<br />
South Australia in 2005 (Table 1). Fire wea<strong>the</strong>r c<strong>on</strong>diti<strong>on</strong>s were two to three times<br />
worse than those experienced in <strong>the</strong> legendary “Black Friday” fires <strong>of</strong> 1939 and<br />
significantly more severe than <strong>the</strong> c<strong>on</strong>diti<strong>on</strong>s <strong>of</strong> <strong>the</strong> more recent “Ash Wednesday” fires<br />
in 1983.<br />
The rates <strong>of</strong> spread <strong>of</strong> <strong>the</strong> fires in forest equalled <strong>the</strong> maximum previously recorded <strong>on</strong><br />
“Ash Wednesday”, averaging 12 km/h for an hour in <strong>the</strong> case <strong>of</strong> <strong>the</strong> Kilmore East fire.<br />
There was an excepti<strong>on</strong>al run <strong>of</strong> fire in <strong>the</strong> Canberra fires <strong>of</strong> 2003 which spread at a rate<br />
<strong>of</strong> about 26 km/h for an hour due to <strong>the</strong> “pull” <strong>of</strong> a major c<strong>on</strong>vecti<strong>on</strong> column <strong>on</strong> ei<strong>the</strong>r<br />
side <strong>of</strong> it. However, it was <strong>the</strong> extent and prolific spotfires that made <strong>the</strong> behaviour <strong>of</strong><br />
<strong>the</strong>se fires unique. The very hot and dry c<strong>on</strong>diti<strong>on</strong>s were c<strong>on</strong>ducive to keeping <strong>the</strong><br />
firebrands alight for l<strong>on</strong>ger than normal, and upper winds <strong>of</strong> around 100 km/h carried<br />
firebrands and started spotfires up to 35 km ahead <strong>of</strong> <strong>the</strong> fire fr<strong>on</strong>t. The previous<br />
au<strong>the</strong>nticated spotting distance was 30 km (Luke and McArthur, 1978).<br />
The rate <strong>of</strong> spread <strong>of</strong> <strong>the</strong> fire for shorter periods <strong>of</strong> time would have been much faster<br />
than <strong>the</strong> hourly average. Prolific short-distance spotting was <strong>occurring</strong> about 10<br />
minutes before <strong>the</strong> arrival <strong>of</strong> <strong>the</strong> main fire, i.e. about <strong>on</strong>e kilometre ahead <strong>of</strong> <strong>the</strong> main<br />
fr<strong>on</strong>t. Black smoke indicated that <strong>the</strong> burning efficiency <strong>of</strong> <strong>the</strong> fire was very poor due<br />
to <strong>the</strong> air-fuel mixture being too rich to burn. This resulted in fire flares and what have<br />
been described as “fireballs” where parcels <strong>of</strong> flammable gases released from <strong>the</strong> forest<br />
fuels have been blown ahead or above <strong>the</strong> fire and when <strong>the</strong>y have mixed with sufficient<br />
air (oxygen), <strong>the</strong>y ignite. This phenomen<strong>on</strong> could occur several hundred metres ahead<br />
<strong>of</strong> <strong>the</strong> fire fr<strong>on</strong>t. Modelling <strong>of</strong> <strong>the</strong>se fires, using PHOENIX RapidFire, indicated that<br />
fires could have spread as fast as 60 km/h in grassland and 40 km/h in forest for <strong>on</strong>e<br />
hundredth <strong>of</strong> an hour – about half a minute. The fire <strong>the</strong>n effectively moves in pulses<br />
where several hundreds <strong>of</strong> meters <strong>of</strong> forest can be set alight and <strong>the</strong>n it take a few<br />
minutes for <strong>the</strong> fuel to be fully incorporated into <strong>the</strong> fire and <strong>the</strong>n it pulses again. The<br />
rate at which <strong>the</strong>se pulses move could be as fast as <strong>the</strong> prevailing winds, which in <strong>the</strong><br />
case <strong>of</strong> “Black Saturday” was 50 to 60 km/h.<br />
Flames were observed to leap 100 m or more into <strong>the</strong> air. Radiati<strong>on</strong> from <strong>the</strong> flame<br />
would make survival within a distance <strong>of</strong> three to four times this flame height difficult<br />
except for very short exposures. Flame temperatures would have been 900 to 1200 o C,<br />
depending <strong>on</strong> <strong>the</strong> amount <strong>of</strong> moisture in <strong>the</strong> fuels and <strong>the</strong> depth <strong>of</strong> <strong>the</strong> flames. Some<br />
aluminium road signs melted in <strong>the</strong> flames indicating that <strong>the</strong>y were exposed to<br />
<str<strong>on</strong>g>Report</str<strong>on</strong>g> <strong>on</strong> <strong>the</strong> <strong>Physical</strong> <strong>Nature</strong> <strong>of</strong> <strong>the</strong> <strong>Victorian</strong> Fire <strong>occurring</strong> <strong>on</strong> <strong>7th</strong> February 2009.doc Page 13 <strong>of</strong> 18
EXP.003.001.0030<br />
Tolhurst (2009)<br />
“Describing The Black Saturday <strong>Fires</strong>”<br />
temperatures in excess <strong>of</strong> 700 o C. However, <strong>the</strong> heat from <strong>the</strong> bushfire should not be<br />
c<strong>on</strong>fused with <strong>the</strong> much greater heat generated by burning buildings and vehicles<br />
ignited by <strong>the</strong> bushfire.<br />
The total amount <strong>of</strong> heat released from <strong>the</strong> fires <strong>on</strong> “Black Saturday” would have been<br />
sufficient to provide <strong>the</strong> total energy needs for all <strong>Victorian</strong> domestic and industrial use<br />
for a year. This energy was released in just a few hours. The energy <strong>of</strong> <strong>the</strong> fires was<br />
equivalent to more than 1500 atomic bombs <strong>the</strong> size <strong>of</strong> <strong>the</strong> <strong>on</strong>e used at Hiroshima,<br />
which devastated an area equivalent to 2,000 ha, but bushfires release <strong>the</strong>ir energy in a<br />
“storm” not a “blast”. This gives an indicati<strong>on</strong> <strong>of</strong> <strong>the</strong> destructive power <strong>of</strong> <strong>the</strong>se fires.<br />
Table 1.<br />
Summary <strong>of</strong> wea<strong>the</strong>r and impact <strong>of</strong> some significant Australian fires. The<br />
Fire Danger Indices (FDI), calculated using McArthur’s method, for grass and<br />
forest for <strong>the</strong> peak wea<strong>the</strong>r is used for comparis<strong>on</strong>.<br />
Disaster Losses Max<br />
Temp<br />
( o C)<br />
Wangary Fire, 10 Jan 2005,<br />
SA<br />
“Black Saturday”, 7 Feb 2009,<br />
Victoria<br />
“Ash Wednesday”, 16 Feb<br />
1983, Victoria / SA<br />
“Black Friday”, 13 Jan 1939,<br />
Victoria<br />
“Canberra <strong>Fires</strong>”, 18 Feb<br />
2003<br />
9 fatalities<br />
93 homes lost<br />
173 fatalities<br />
2029 homes lost<br />
76 fatalities<br />
2080 homes lost<br />
71 fatalities<br />
1,380,000 ha burnt<br />
1000 homes lost<br />
4 fatalities<br />
500 homes lost<br />
8 Jan 1969, Victoria 20 fatalities<br />
240 homes lost<br />
“Hobart <strong>Fires</strong>”, 7 Feb 1967<br />
Beerburrum <strong>Fires</strong>, 6 Nov<br />
1994, Qld<br />
62 fatalities<br />
1400 homes lost<br />
> $10 milli<strong>on</strong> loss <strong>of</strong> plantati<strong>on</strong><br />
wood<br />
14 Jan 1944, Victoria 51 fatalities<br />
700 homes lost<br />
“Black Sunday”, 2 Jan 1955,<br />
SA<br />
Min<br />
RH<br />
(%)<br />
Wind<br />
Spd<br />
(km/h)<br />
Forest<br />
FDI<br />
Grass<br />
FDI<br />
42 3 65 192 336<br />
46 4 51 (69) 172 241<br />
41 14 60 (90) 120 196<br />
46 8 35 (65) 100 87<br />
37 10 50 (80) 99 133<br />
40 10 45 (90) 97 114<br />
39 18 55 90 138<br />
37 13 50 89 120<br />
40 10 35 (55) 77 69<br />
43 15 35 72 64<br />
14 Feb 1926, Victoria 31 fatalities 38 15 40 (75) 70 72<br />
25 Oct 1918, Blackall, Qld 39 17 40 66 70<br />
Alpine <strong>Fires</strong>, Jan/Feb 2003,<br />
Victoria / NSW (ACT)<br />
Dwellingup <strong>Fires</strong>, 19 Jan<br />
1961, WA<br />
Pickering Brook fire, 15 Jan<br />
2005, WA<br />
“Black Thursday”, 6 Feb<br />
1851, Victoria<br />
14-16 Jan 1962,<br />
Danden<strong>on</strong>gs, Victoria<br />
7 fatalities<br />
2.7 Mha burnt in Vic/NSW/ACT<br />
127 homes lost in Vic / NSW<br />
Many homes lost<br />
145,000 ha burnt<br />
35 10 35 63 57<br />
40 26 20 31 18<br />
No significant losses 30 20 21 28 17<br />
One quarter <strong>of</strong> State affected<br />
by fire<br />
10 fatalities<br />
14 fatalities<br />
454 homes lost<br />
<str<strong>on</strong>g>Report</str<strong>on</strong>g> <strong>on</strong> <strong>the</strong> <strong>Physical</strong> <strong>Nature</strong> <strong>of</strong> <strong>the</strong> <strong>Victorian</strong> Fire <strong>occurring</strong> <strong>on</strong> <strong>7th</strong> February 2009.doc Page 14 <strong>of</strong> 18
EXP.003.001.0031<br />
Tolhurst (2009)<br />
“Describing The Black Saturday <strong>Fires</strong>”<br />
Table 2.<br />
Summary <strong>of</strong> fire behaviour statistics for four <strong>of</strong> <strong>the</strong> main fires burning <strong>on</strong><br />
Black Saturday, 7 February 2009, in Victoria.<br />
Kilmore Murrundindi Churchill Bunyip<br />
Maximum fireline intensity (kW/m) 150,000 150,000 71,000 77,000<br />
Average fireline intensity, N’ly wind (kW/m) 100,000 100,000 45,000 38,700<br />
Average fireline intensity, S’ly wind (kW/m) 64,000 71,000 64,500 25,800<br />
Total heat output (TJ) 53,000 36,000 11,000 10,000<br />
Maximum spread rate in <strong>on</strong>e hour (km/h) 12 12 5.5 6<br />
Average spread rate in <strong>on</strong>e hour N’ly wind (km/h) 8 8 3.5 3<br />
Average spread rate in <strong>on</strong>e hour S’ly wind (km/h) 5 5.5 5 2<br />
Area burnt <strong>on</strong> 7 th Feb. (ha) 114,929 77,400 23,800 21,000<br />
Maximum spotting distance (km) 35 23 24 16<br />
Average spotting distance (km) 10-15 7 8 11<br />
Predictability using Current Models<br />
Once <strong>the</strong> spread <strong>of</strong> <strong>the</strong> fires have been accurately documented, it will be possible to<br />
undertake a comprehensive review <strong>of</strong> how well <strong>the</strong> available fire behaviour models<br />
predicted <strong>the</strong> rate <strong>of</strong> spread and spotting <strong>of</strong> <strong>the</strong>se fires. However, early indicati<strong>on</strong>s are<br />
that <strong>the</strong> PHOENIX RapidFire model developed as part <strong>of</strong> <strong>the</strong> Bushfire CRC gives a<br />
good representati<strong>on</strong> <strong>of</strong> <strong>the</strong> fire spread rates and extent (Fig.10). Fur<strong>the</strong>r evaluati<strong>on</strong> will<br />
be needed.<br />
:, Goorgle Earth<br />
File Ede view All Add Help<br />
, Search<br />
000<br />
Places<br />
-o-n, "--6<br />
, 03 AD 12669<br />
- Temp<br />
STAR<br />
Aid-<br />
-oA<br />
o ©6Affilr,O our 21A"<br />
. Layers<br />
_o p<br />
o<br />
o_ Re<br />
0rl 3D<br />
oI=<br />
ow3<br />
oo*<br />
'oaw<br />
oa Gdrd,<br />
,Web<br />
ndLeoen<br />
o m o oelAweneoenn<br />
Figure 10. A screen grab <strong>of</strong> <strong>the</strong> modelled extent <strong>of</strong> <strong>the</strong> Kilmore East fire using <strong>the</strong><br />
Kilmore Gap wea<strong>the</strong>r observati<strong>on</strong>s. Note how <strong>the</strong> model did not predict <strong>the</strong><br />
spotting in <strong>the</strong> area north and west <strong>of</strong> Healesville. The fire indicated around<br />
Broadford did not occur due to suppressi<strong>on</strong> activity.<br />
<str<strong>on</strong>g>Report</str<strong>on</strong>g> <strong>on</strong> <strong>the</strong> <strong>Physical</strong> <strong>Nature</strong> <strong>of</strong> <strong>the</strong> <strong>Victorian</strong> Fire <strong>occurring</strong> <strong>on</strong> <strong>7th</strong> February 2009.doc Page 15 <strong>of</strong> 18
EXP.003.001.0032<br />
Tolhurst (2009)<br />
“Describing The Black Saturday <strong>Fires</strong>”<br />
C<strong>on</strong>clusi<strong>on</strong>s<br />
The fires <strong>on</strong> “Black Saturday” were excepti<strong>on</strong>al in <strong>the</strong>ir severity and <strong>the</strong> manner in<br />
which <strong>the</strong>y spread. The spread pattern <strong>the</strong>y showed was typical <strong>of</strong> many previous fire<br />
events, but <strong>the</strong>re were some key spread characteristics which were magnified.<br />
The pulsating nature <strong>of</strong> <strong>the</strong> fire spread, with <strong>the</strong> accompanying propagati<strong>on</strong> by spotting<br />
and wind-blown volatile gases, needs better descripti<strong>on</strong> and research. These are<br />
important characteristics that need to be communicated to <strong>the</strong> public and taken into<br />
account in building design and land-use planning.<br />
<str<strong>on</strong>g>Report</str<strong>on</strong>g> <strong>on</strong> <strong>the</strong> <strong>Physical</strong> <strong>Nature</strong> <strong>of</strong> <strong>the</strong> <strong>Victorian</strong> Fire <strong>occurring</strong> <strong>on</strong> <strong>7th</strong> February 2009.doc Page 16 <strong>of</strong> 18
EXP.003.001.0033<br />
Tolhurst (2009)<br />
“Describing The Black Saturday <strong>Fires</strong>”<br />
Appendix<br />
Timelines from video taken at Poley Tower<br />
The black bar in <strong>the</strong> time column indicates <strong>the</strong> period <strong>of</strong> direct fire activity at <strong>the</strong> tower.<br />
The red bar in <strong>the</strong> time column indicates <strong>the</strong> period <strong>of</strong> flaming and running fire at <strong>the</strong><br />
tower. Fire was affecting <strong>the</strong> area around <strong>the</strong> tower for in excess <strong>of</strong> six hours.<br />
16:43 Spotfire to West <strong>of</strong> Mt Poley (looking to St Filians). Carried by upper winds<br />
17:10 Spotfire to East. Spotfire running to ridge (Poley ridge). Carried by upper winds.<br />
17:46 Sec<strong>on</strong>d spot fire to East. Carried by upper winds.<br />
17:50 Covered in smoke<br />
17:55 Shift in wind to West<br />
18:00 Embers (18:02:50)<br />
18:15 Lots <strong>of</strong> embers<br />
18:17 Spotfires close to West<br />
18:25 Lots <strong>of</strong> spotfires.<br />
18:33 Darkness<br />
18:35 Wind South-westerly<br />
18:44 Fierce fire around tower<br />
18:50 Red glow.<br />
18:52:00 Fireball.<br />
18:50 Burning out, spread finished<br />
18:56 Fireball in background.<br />
19:07 Some clear air<br />
19:05 Ember attack over.<br />
23:00 Woody fuel still burning out.<br />
<str<strong>on</strong>g>Report</str<strong>on</strong>g> <strong>on</strong> <strong>the</strong> <strong>Physical</strong> <strong>Nature</strong> <strong>of</strong> <strong>the</strong> <strong>Victorian</strong> Fire <strong>occurring</strong> <strong>on</strong> <strong>7th</strong> February 2009.doc Page 17 <strong>of</strong> 18
EXP.003.001.0034<br />
Tolhurst (2009)<br />
“Describing The Black Saturday <strong>Fires</strong>”<br />
Timelines from ABC 4 Corners program aired 27 April 2009<br />
“Eye <strong>of</strong> <strong>the</strong> Storm”<br />
14:55 Fire ignited (observed by R<strong>on</strong> Philpot)<br />
15:10 First attack. Fire took <strong>of</strong>f towards <strong>the</strong> mill and hills.<br />
15:30 Plume visible from Marysville<br />
16:30 Spotting at Narbeth<strong>on</strong>g.<br />
Mt Gord<strong>on</strong> Tower, fire running towards him.<br />
Mt Gord<strong>on</strong> Tower ph<strong>on</strong>ed Marysville CFA and o<strong>the</strong>rs<br />
17:00 Smoke clearly visible from Marysville.<br />
Spotfires to west <strong>of</strong> Mt Gord<strong>on</strong>.<br />
Fire threat warning broadcast from community radio UG FM<br />
17:35 Fire threat warning broadcast <strong>on</strong> ABC radio<br />
17:33 Fire 3-4 km away from Marysville, behind Mt Gord<strong>on</strong><br />
17:45 Fire still approaching Marysville<br />
17:51 Fire visible from Marysville<br />
18:00 People ga<strong>the</strong>red <strong>on</strong> football oval<br />
18:24 Tankers at Kings Rd.<br />
DSE put in backburn just before wind change (15 mins)<br />
18:40 CFA pager message: wind change imminent<br />
19:00 Embers in town<br />
19:15 Fire in town around oval.<br />
Trying to get strike team <strong>on</strong> King’s Road spotfire.<br />
Daryl Hull in dam for about 50 mins.<br />
14 out <strong>of</strong> 400 buildings survived<br />
<str<strong>on</strong>g>Report</str<strong>on</strong>g> <strong>on</strong> <strong>the</strong> <strong>Physical</strong> <strong>Nature</strong> <strong>of</strong> <strong>the</strong> <strong>Victorian</strong> Fire <strong>occurring</strong> <strong>on</strong> <strong>7th</strong> February 2009.doc Page 18 <strong>of</strong> 18