remote sensing techniques for land use classification - GERS ...
remote sensing techniques for land use classification - GERS ...
remote sensing techniques for land use classification - GERS ...

You also want an ePaper? Increase the reach of your titles
YUMPU automatically turns print PDFs into web optimized ePapers that Google loves.
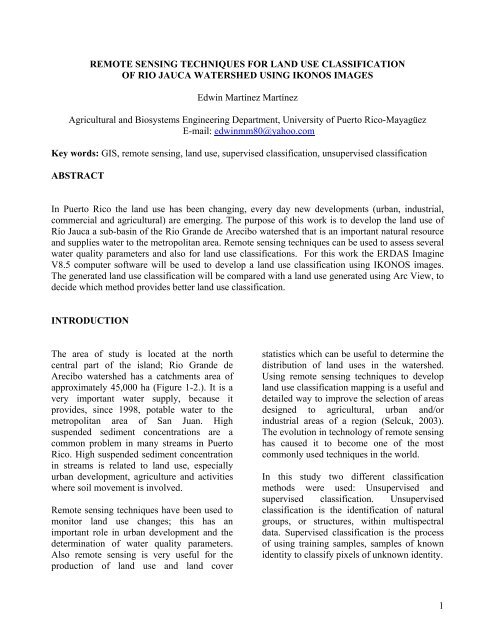
REMOTE SENSING TECHNIQUES FOR LAND USE CLASSIFICATION<br />
OF RIO JAUCA WATERSHED USING IKONOS IMAGES<br />
Edwin Martínez Martínez<br />
Agricultural and Biosystems Engineering Department, University of Puerto Rico-Mayagüez<br />
E-mail: edwinmm80@yahoo.com<br />
Key words: GIS, <strong>remote</strong> <strong>sensing</strong>, <strong>land</strong> <strong>use</strong>, supervised <strong>classification</strong>, unsupervised <strong>classification</strong><br />
ABSTRACT<br />
In Puerto Rico the <strong>land</strong> <strong>use</strong> has been changing, every day new developments (urban, industrial,<br />
commercial and agricultural) are emerging. The purpose of this work is to develop the <strong>land</strong> <strong>use</strong> of<br />
Río Jauca a sub-basin of the Rio Grande de Arecibo watershed that is an important natural resource<br />
and supplies water to the metropolitan area. Remote <strong>sensing</strong> <strong>techniques</strong> can be <strong>use</strong>d to assess several<br />
water quality parameters and also <strong>for</strong> <strong>land</strong> <strong>use</strong> <strong>classification</strong>s. For this work the ERDAS Imagine<br />
V8.5 computer software will be <strong>use</strong>d to develop a <strong>land</strong> <strong>use</strong> <strong>classification</strong> using IKONOS images.<br />
The generated <strong>land</strong> <strong>use</strong> <strong>classification</strong> will be compared with a <strong>land</strong> <strong>use</strong> generated using Arc View, to<br />
decide which method provides better <strong>land</strong> <strong>use</strong> <strong>classification</strong>.<br />
INTRODUCTION<br />
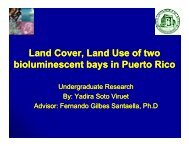
The area of study is located at the north<br />
central part of the is<strong>land</strong>; Rio Grande de<br />
Arecibo watershed has a catchments area of<br />
approximately 45,000 ha (Figure 1-2.). It is a<br />
very important water supply, beca<strong>use</strong> it<br />
provides, since 1998, potable water to the<br />
metropolitan area of San Juan. High<br />
suspended sediment concentrations are a<br />
common problem in many streams in Puerto<br />
Rico. High suspended sediment concentration<br />
in streams is related to <strong>land</strong> <strong>use</strong>, especially<br />
urban development, agriculture and activities<br />
where soil movement is involved.<br />
Remote <strong>sensing</strong> <strong>techniques</strong> have been <strong>use</strong>d to<br />
monitor <strong>land</strong> <strong>use</strong> changes; this has an<br />
important role in urban development and the<br />
determination of water quality parameters.<br />
Also <strong>remote</strong> <strong>sensing</strong> is very <strong>use</strong>ful <strong>for</strong> the<br />
production of <strong>land</strong> <strong>use</strong> and <strong>land</strong> cover<br />
statistics which can be <strong>use</strong>ful to determine the<br />
distribution of <strong>land</strong> <strong>use</strong>s in the watershed.<br />
Using <strong>remote</strong> <strong>sensing</strong> <strong>techniques</strong> to develop<br />
<strong>land</strong> <strong>use</strong> <strong>classification</strong> mapping is a <strong>use</strong>ful and<br />
detailed way to improve the selection of areas<br />
designed to agricultural, urban and/or<br />
industrial areas of a region (Selcuk, 2003).<br />
The evolution in technology of <strong>remote</strong> <strong>sensing</strong><br />
has ca<strong>use</strong>d it to become one of the most<br />
commonly <strong>use</strong>d <strong>techniques</strong> in the world.<br />
In this study two different <strong>classification</strong><br />
methods were <strong>use</strong>d: Unsupervised and<br />
supervised <strong>classification</strong>. Unsupervised<br />
<strong>classification</strong> is the identification of natural<br />
groups, or structures, within multispectral<br />
data. Supervised <strong>classification</strong> is the process<br />
of using training samples, samples of known<br />
identity to classify pixels of unknown identity.<br />
1
OBJECTIVES<br />
• Use <strong>remote</strong> <strong>sensing</strong> <strong>techniques</strong> to<br />
identify the <strong>land</strong> <strong>use</strong> of one sub-basin<br />
in the Río Grande de Arecibo<br />
watershed (Río Jauca).<br />
• Compare the distribution of <strong>land</strong> <strong>use</strong><br />
areas to identify which is the most<br />
predominant in the watershed<br />
(agriculture, urban area, <strong>for</strong>est, etc.)<br />
• Compare the <strong>land</strong> <strong>use</strong> <strong>classification</strong><br />
data generated by ERDAS vs. the data<br />
generated by using Arc View.<br />
METHODOLOGY<br />
For this research, true color images of<br />
IKONOS will be <strong>use</strong>d to identify the study<br />
area. Remote <strong>sensing</strong> <strong>techniques</strong> using<br />
ERDAS software to process IKONOS images<br />
<strong>for</strong> the area of interest will be <strong>use</strong>d (ERDAS,<br />
1997).<br />
obtained from the Geology Department at the<br />
University of Puerto Rico-Mayagüez. A<br />
mosaic was obtained from the three images<br />
and then a mask created to work in the study<br />
area.<br />
Two unsupervised <strong>classification</strong>s were<br />
generated using ERDAS, one using<br />
ISODATA and the other using a K-Means<br />
method. Several supervised <strong>classification</strong>s<br />
were generated, to select the most appropriate.<br />
For this <strong>classification</strong> approximately 12<br />
training samples were obtained from a visit to<br />
the area of study (Table 1) (Figure 3), using a<br />
Global Position System (GPS) to collect the<br />
data. The software <strong>use</strong>d <strong>for</strong> this study is:<br />
ERDAS Imagine V8.5, ENVI, ARC View<br />
GIS, WMS, and Excel.<br />
Area of Interest<br />
Río Grande de Arecibo Watershed<br />
Río Grande de Arecibo<br />
Sub-basin<br />
Río Jauca<br />
Sub- basin<br />
Río Limón<br />
Sub-basin<br />
Río Caonillas<br />
Sub-basin<br />
5 0 5 10 Miles<br />
W<br />
N<br />
E<br />
DEM (Digital Elevation Models) will be <strong>use</strong>d<br />
to delineate the catchments area of the subbasing<br />
(Río Jauca). Arc GIS (ESRI, 2000) will<br />
be <strong>use</strong>d to process the data obtained from<br />
DEM’s, (Figure 4)<br />
Figure 1. Area of study<br />
S<br />
The <strong>remote</strong> sensor to be <strong>use</strong>d is IKONOS<br />
which produces 1-meter black-and-white<br />
(panchromatic) and 4-meter multispectral<br />
(red, blue, green, near infrared) imagery that<br />
can be combined in a variety of ways to<br />
accommodate a wide range of high-resolution<br />
imagery applications using supervised<br />
<strong>classification</strong>.<br />
The IKONOS images: N18W066B6NE,<br />
N18W066B5SW and N18W066B6SE were<br />
Figure 2. Río Jauca Watershed, IKONOS<br />
2
Table 1. Training Samples Description<br />
RESULTS AND DISCUSSION<br />
Lat.<br />
Long.<br />
Site (°) (') (") (°) (') (")<br />
Sampling<br />
Site 18 12 43.248 66 38 42.296<br />
River<br />
Point #1 18 12 43.025 66 38 42.27<br />
River<br />
Point #2 18 12 42.79 66 38 42.388<br />
River<br />
Point #3 18 11 50.53 66 39 0.23<br />
Forest 18 12 42.59 66 38 42.64<br />
Urban 18 12 11.135 66 38 48.632<br />
Agriculture 18 11 53.43 66 38 52.04<br />
Figure 5. Unsupervised (K-Means)<br />
(8) classes, (2) max iterations<br />
Figure 3. Area of Interest (AOI)<br />
selection using training samples areas.<br />
Figure 6. Unsupervised Isodata,<br />
(6) classes, (2) maximum iterations,<br />
convergence threshold 0.950<br />
F<br />
i<br />
g<br />
u<br />
r<br />
e<br />
Figure 4. Río Jauca Watershed delineation<br />
using the Water Modeling System (WMS)<br />
Figure 7. Supervised Minimum<br />
Distance Method<br />
3
Figure 8. Supervised Minimum Distance<br />
Method, using training samples.<br />
Supervised Classification (Figures 7 - 8)<br />
After generated eight different supervised<br />
<strong>classification</strong>s using different parameters such<br />
as number of classes and parametric methods;<br />
maximum likelihood and minimum distance,<br />
It was found that minimum distance<br />
<strong>classification</strong> generated a better <strong>classification</strong><br />
than maximum likelihood <strong>classification</strong>. In the<br />
supervised <strong>classification</strong> the most common<br />
errors were found in the <strong>classification</strong> of<br />
pasture and <strong>for</strong>est, in some areas the<br />
wavelength of these elements was conf<strong>use</strong>d,<br />
this can be due to the high intensity of green<br />
<strong>land</strong> cover of the area and the intensity of<br />
<strong>for</strong>est in the watershed.<br />
Arc View Classification (Figure 9)<br />
In the <strong>land</strong> <strong>use</strong> <strong>classification</strong> generated using<br />
Arc View tools; the distribution of <strong>land</strong> <strong>use</strong> is<br />
the following: the predominant <strong>land</strong> <strong>use</strong> of the<br />
area is <strong>for</strong>est, followed by herbaceous<br />
range<strong>land</strong>, followed by agriculture, and a<br />
small portion of the watershed composed an<br />
urban area. In this <strong>classification</strong> the range<strong>land</strong><br />
area that is located in the center of the<br />
watershed can not be observed.<br />
Figure 9. Arc View GIS, Land Use<br />
Classification of Río Jauca.<br />
Unsupervised Classification (Figures 5 - 6)<br />
Per<strong>for</strong>ming this <strong>classification</strong> generated some<br />
errors, especially in the <strong>for</strong>est and agricultural<br />
<strong>land</strong>. This <strong>classification</strong> was a significant tool<br />
to continue with the supervised <strong>classification</strong>.<br />
In this <strong>classification</strong> the most common errors<br />
were observed between the agriculture,<br />
pasture and <strong>for</strong>est classes, also errors were<br />
found in the urban area, that were in some<br />
areas classified as clouds. These errors can be<br />
corrected using atmospheric corrections, <strong>for</strong><br />
clouds and shadows in the original image of<br />
IKONOS.<br />
Conclusions<br />
After <strong>use</strong>d ERDAS to per<strong>for</strong>m the<br />
<strong>classification</strong>, significant data has been<br />
obtained using a minimum distance<br />
supervised <strong>classification</strong> method.<br />
Correction methods need to be<br />
per<strong>for</strong>med <strong>for</strong> clouds and shadows.<br />
Land <strong>use</strong> <strong>classification</strong> is more<br />
detailed using <strong>remote</strong> <strong>sensing</strong> tools<br />
such as ERDAS software than the Arc<br />
View GIS.<br />
4
Also <strong>land</strong> <strong>use</strong> <strong>classification</strong> using<br />
ERDAS, can be per<strong>for</strong>med faster and<br />
with more precision, after you have<br />
your training samples.<br />
Using the obtained results from<br />
ERDAS and Arc View GIS <strong>for</strong> <strong>land</strong><br />
<strong>use</strong> <strong>classification</strong>, can help to per<strong>for</strong>m<br />
a more accurate <strong>classification</strong>.<br />
To per<strong>for</strong>m a better <strong>classification</strong> of<br />
this area using ERDAS, it is<br />
recommended to <strong>use</strong> the Modeler tool,<br />
to correct the errors and be more<br />
accurate.<br />
REFERENCES<br />
ENVI.2003. ENVI Tutorials. Research<br />
System Inc.<br />
ERDAS Imagine, 1997. Tour Guides V8.3,<br />
ERDAS, Inc.Atlanta Georgia.<br />
ESRI.2000. Getting to know Arc View GIS.<br />
Environmental Research Institute. ESRI,<br />
Cali<strong>for</strong>nia.<br />
Selçuk R., R. Nişanci, B. Uzun, A. Yalçin, H.<br />
Inan and T.Yomralioğlu. 2003. Monitoring<br />
Land –Use Changes by GIS and Remote<br />
Sensing Techniques: Case Study of Trabzon.<br />
http://www.fig.net/pub/morocco/proceedings/<br />
TS18/TS18_6_reis_el_al.pdf<br />
5