Chapter 5 Urban Area Travel Demand Model - Saginaw County
Chapter 5 Urban Area Travel Demand Model - Saginaw County
Chapter 5 Urban Area Travel Demand Model - Saginaw County

Create successful ePaper yourself
Turn your PDF publications into a flip-book with our unique Google optimized e-Paper software.
socio-economic data and network data provided by the local participating<br />
agencies, and the skill of the users in interpreting the reasonableness of<br />
the results.<br />
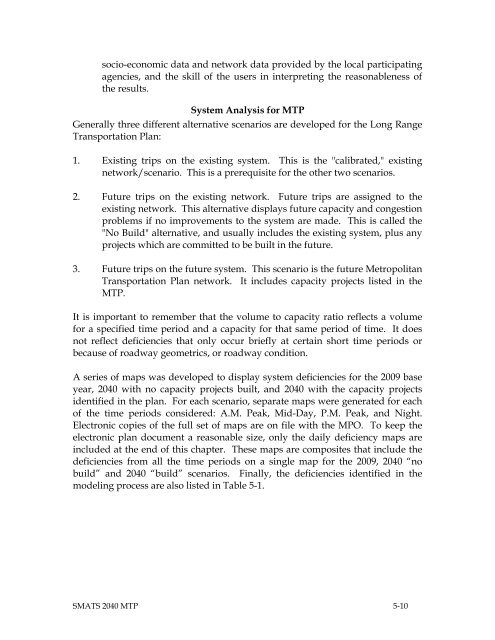
System Analysis for MTP<br />
Generally three different alternative scenarios are developed for the Long Range<br />
Transportation Plan:<br />
1. Existing trips on the existing system. This is the "calibrated," existing<br />
network/scenario. This is a prerequisite for the other two scenarios.<br />
2. Future trips on the existing network. Future trips are assigned to the<br />
existing network. This alternative displays future capacity and congestion<br />
problems if no improvements to the system are made. This is called the<br />
"No Build" alternative, and usually includes the existing system, plus any<br />
projects which are committed to be built in the future.<br />
3. Future trips on the future system. This scenario is the future Metropolitan<br />
Transportation Plan network. It includes capacity projects listed in the<br />
MTP.<br />
It is important to remember that the volume to capacity ratio reflects a volume<br />
for a specified time period and a capacity for that same period of time. It does<br />
not reflect deficiencies that only occur briefly at certain short time periods or<br />
because of roadway geometrics, or roadway condition.<br />
A series of maps was developed to display system deficiencies for the 2009 base<br />
year, 2040 with no capacity projects built, and 2040 with the capacity projects<br />
identified in the plan. For each scenario, separate maps were generated for each<br />
of the time periods considered: A.M. Peak, Mid-Day, P.M. Peak, and Night.<br />
Electronic copies of the full set of maps are on file with the MPO. To keep the<br />
electronic plan document a reasonable size, only the daily deficiency maps are<br />
included at the end of this chapter. These maps are composites that include the<br />
deficiencies from all the time periods on a single map for the 2009, 2040 “no<br />
build” and 2040 “build” scenarios. Finally, the deficiencies identified in the<br />
modeling process are also listed in Table 5-1.<br />
SMATS 2040 MTP 5-10


![[ Of Commissioners] - Saginaw County](https://img.yumpu.com/25951211/1/190x245/-of-commissioners-saginaw-county.jpg?quality=85)