Chapter 5 Urban Area Travel Demand Model - Saginaw County
Chapter 5 Urban Area Travel Demand Model - Saginaw County
Chapter 5 Urban Area Travel Demand Model - Saginaw County

You also want an ePaper? Increase the reach of your titles
YUMPU automatically turns print PDFs into web optimized ePapers that Google loves.
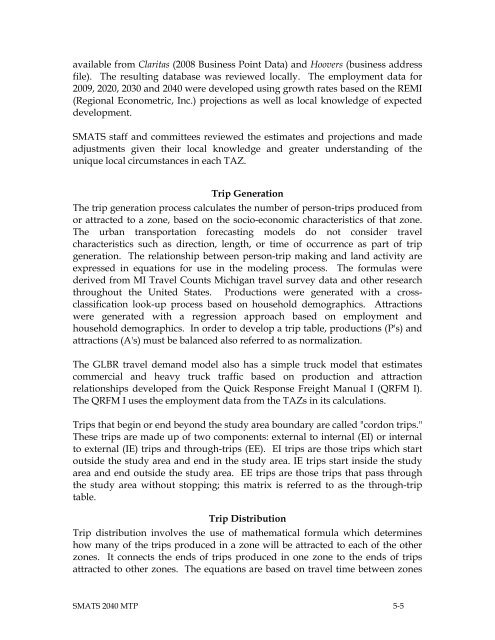
available from Claritas (2008 Business Point Data) and Hoovers (business address<br />
file). The resulting database was reviewed locally. The employment data for<br />
2009, 2020, 2030 and 2040 were developed using growth rates based on the REMI<br />
(Regional Econometric, Inc.) projections as well as local knowledge of expected<br />
development.<br />
SMATS staff and committees reviewed the estimates and projections and made<br />
adjustments given their local knowledge and greater understanding of the<br />
unique local circumstances in each TAZ.<br />
Trip Generation<br />
The trip generation process calculates the number of person-trips produced from<br />
or attracted to a zone, based on the socio-economic characteristics of that zone.<br />
The urban transportation forecasting models do not consider travel<br />
characteristics such as direction, length, or time of occurrence as part of trip<br />
generation. The relationship between person-trip making and land activity are<br />
expressed in equations for use in the modeling process. The formulas were<br />
derived from MI <strong>Travel</strong> Counts Michigan travel survey data and other research<br />
throughout the United States. Productions were generated with a crossclassification<br />
look-up process based on household demographics. Attractions<br />
were generated with a regression approach based on employment and<br />
household demographics. In order to develop a trip table, productions (P's) and<br />
attractions (A's) must be balanced also referred to as normalization.<br />
The GLBR travel demand model also has a simple truck model that estimates<br />
commercial and heavy truck traffic based on production and attraction<br />
relationships developed from the Quick Response Freight Manual I (QRFM I).<br />
The QRFM I uses the employment data from the TAZs in its calculations.<br />
Trips that begin or end beyond the study area boundary are called "cordon trips."<br />
These trips are made up of two components: external to internal (EI) or internal<br />
to external (IE) trips and through-trips (EE). EI trips are those trips which start<br />
outside the study area and end in the study area. IE trips start inside the study<br />
area and end outside the study area. EE trips are those trips that pass through<br />
the study area without stopping; this matrix is referred to as the through-trip<br />
table.<br />
Trip Distribution<br />
Trip distribution involves the use of mathematical formula which determines<br />
how many of the trips produced in a zone will be attracted to each of the other<br />
zones. It connects the ends of trips produced in one zone to the ends of trips<br />
attracted to other zones. The equations are based on travel time between zones<br />
SMATS 2040 MTP 5-5


![[ Of Commissioners] - Saginaw County](https://img.yumpu.com/25951211/1/190x245/-of-commissioners-saginaw-county.jpg?quality=85)