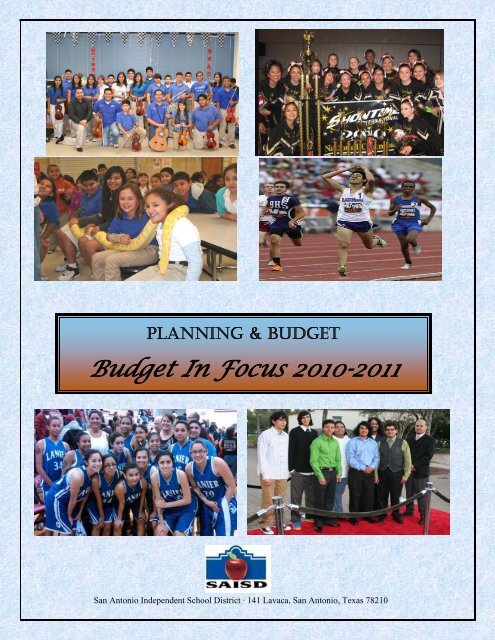
Budget In Focus 2010-2011 - San Antonio Independent School District
Budget In Focus 2010-2011 - San Antonio Independent School District
Budget In Focus 2010-2011 - San Antonio Independent School District

You also want an ePaper? Increase the reach of your titles
YUMPU automatically turns print PDFs into web optimized ePapers that Google loves.
PLANNING & BUDGET<br />
<strong>Budget</strong> <strong>In</strong> <strong>Focus</strong> <strong>2010</strong>-<strong>2011</strong><br />
<strong>San</strong> <strong>Antonio</strong> <strong>In</strong>dependent <strong>School</strong> <strong>District</strong> · 141 Lavaca, <strong>San</strong> <strong>Antonio</strong>, Texas 78210
Board of Education • Administration<br />
<strong>San</strong> <strong>Antonio</strong> <strong>In</strong>dependent <strong>School</strong> <strong>District</strong><br />
Board of Education<br />
James Howard<br />
President<br />
Carlos Villarreal<br />
Vice-President<br />
Thomas C. Lopez<br />
Secretary<br />
Rubén D. Cuero<br />
Trustee<br />
Ed Garza<br />
Trustee<br />
Adela R. Segovia<br />
Trustee<br />
Olga M. Hernandez<br />
Assistant Secretary<br />
Superintendent’s Cabinet<br />
Dr. Robert J. Durón<br />
Superintendent of <strong>School</strong>s<br />
Betty E. Burks<br />
Deputy Superintendent<br />
Teaching and Learning<br />
Steven J. Bassett, CPA,<br />
RTSBA<br />
Associate Superintendent<br />
Financial Services, Business<br />
Operations and Food<br />
Services<br />
John Gomez<br />
Leadership Executive<br />
Director<br />
Elementary <strong>School</strong> Team I<br />
Mary Macias<br />
Leadership Executive<br />
Director<br />
Elementary <strong>School</strong> Team II<br />
Dr. Priscilla Canales<br />
Leadership Executive<br />
Director<br />
Middle <strong>School</strong><br />
Dr. Carol Saxenian<br />
Leadership Executive<br />
Director<br />
High <strong>School</strong><br />
Jose H. Moreno<br />
Senior Executive Director<br />
Curriculum & <strong>In</strong>struction<br />
Cora Johns<br />
Executive Assistant<br />
Superintendent and Special<br />
Projects<br />
Tiffany Grant<br />
Director<br />
Board and Superintendent<br />
Services<br />
Leslie Price<br />
Executive Director<br />
Communications & Printing<br />
Services<br />
Toni Thompson<br />
Associate Superintendent<br />
Human Resources<br />
Kamal ElHabr<br />
Associate Superintendent<br />
Facilities Services<br />
Marcos Zorola<br />
Chief <strong>In</strong>formation Officer<br />
Technology & Management<br />
<strong>In</strong>formation Systems<br />
Carmen Vasquez-<br />
Gonzalez<br />
Executive Director<br />
Governmental & Community<br />
Relations
<strong>Budget</strong> <strong>In</strong> <strong>Focus</strong><br />
Table of Contents <strong>2010</strong><strong>2011</strong><br />
LETTER TO BOARD OF EDUCATION………………………………………………………………... ..1<br />
BUDGET CALENDAR…………………………………………………………………………………. 14<br />
BUDGET HIGHLIGHTS……………………………………………………………………………...... 16<br />
FUNDING SOURCES…………………………………………………………………………………... 18<br />
ESTIMATED REVENUE – ALL FUNDS…………………………………………………………....... 19<br />
APPROPRIATIONS BUDGET……………………………………………………………………........ 20<br />
BUDGET ENHANCEMENTS………………………………………………………………………….. 21<br />
TOTAL ESTIMATED REVENUE – BY SOURCE……………………………………………………. 22<br />
SUMMARY OF ESTIMATED REVENUE – BY FUND………………………………………………. 23<br />
TOTAL ESTIMATED EXPENDITURES……………………………………………………………… 24<br />
EXPENDITURES BY FUNCTION – ALL FUNDS……………………………………………………. 25<br />
GENERAL FUND ESTIMATED REVENUE………………………………………………………….. 27<br />
GENERAL FUND ESTIMATED EXPENDITURES…………………………………………………... 28<br />
GENERAL FUND FUNCTION COMPARISON……………………………………………………… 29<br />
GENERAL FUND BY TYPE OF SERVICE……………………………………………………………31<br />
GENERAL FUND BY PROGRAM INTENT AND MAJOR OBJECT CODE……………………….. 32<br />
FOOD SERVICE FUND – REVENUE AND EXPENDITURES………………………………………. 33<br />
SPECIAL REVENUE FUND – REVENUE AND EXPENDITURES………………………………… 34<br />
SPECIAL REVENUE FUND – FUNCTION AND MAJOR OBJECT CODE………………………… 36<br />
DEBT SERVICE FUND – REVENUE AND EXPENDITURES……………………………………… 37<br />
GLOSSARY……………………………………………………………………………………………… 39
<strong>San</strong> <strong>Antonio</strong> <strong>In</strong>dependent <strong>School</strong> <strong>District</strong><br />
141 Lavaca Street • <strong>San</strong> <strong>Antonio</strong>, Texas 78210-1095<br />
Telephone (210) 554-8590 • Fax (210) 299-5572<br />
BOARD OF EDUCATION<br />
August 23, <strong>2010</strong><br />
The Honorable Board of Education<br />
<strong>San</strong> <strong>Antonio</strong> <strong>In</strong>dependent <strong>School</strong> <strong>District</strong><br />
141 Lavaca Street<br />
<strong>San</strong> <strong>Antonio</strong>, Texas 78210-1095<br />
Dear Board Members:<br />
JAMES HOWARD<br />
President<br />
CARLOS VILLARREAL<br />
Vice President<br />
THOMAS C. LOPEZ<br />
Secretary<br />
OLGA M. HERNANDEZ<br />
Asst. Secretary<br />
ADELA R. SEGOVIA<br />
Member<br />
RUBEN D. CUERO<br />
Member<br />
ED GARZA<br />
Member<br />
DR. ROBERT J. DURÓN<br />
Superintendent<br />
The <strong>San</strong> <strong>Antonio</strong> <strong>In</strong>dependent <strong>School</strong> <strong>District</strong> (the “<strong>District</strong>”) budget for fiscal year <strong>2010</strong>-<strong>2011</strong> is<br />
the <strong>District</strong>’s finance plan that will guide the Board, staff and stakeholders in working toward the<br />
<strong>District</strong>’s mission: “To graduate all of our students and prepare them for success in higher<br />
education.”<br />
<strong>In</strong>troduction<br />
The <strong>District</strong> is proud to publish and disseminate budget information to the Board of Trustees and<br />
to our community. Vision <strong>2011</strong> is the <strong>District</strong>’s strategic plan that guides the budget, school<br />
board, administration and staff, and the community in working toward the goals of educating all<br />
children and continuously improving the quality of teaching and learning.<br />
The development, review and consideration of the <strong>2010</strong>-<strong>2011</strong> <strong>Budget</strong> (the Operating Fund, the<br />
Food Service Fund, the Debt Service Fund, and the Special Revenue Fund) were completed with<br />
a review of every campus and department budget within the context of the <strong>District</strong>’s Vision <strong>2011</strong><br />
mission, goals, and financial policies. <strong>In</strong>formation on each of the fund budgets is provided in this<br />
budget document.<br />
This budget document and the year-end Comprehensive Annual Financial Report (CAFR) are the<br />
primary sources used to present Vision <strong>2011</strong>’s financial plan and the results of programs and<br />
services of the <strong>District</strong>. This report, the <strong>2010</strong>-11 <strong>District</strong> <strong>Budget</strong>, is comprised of four sections:<br />
• Executive Summary<br />
• Campus Local and Federal <strong>Budget</strong>s<br />
• Department <strong>Budget</strong>s<br />
• Supplemental Section – <strong>Budget</strong> Enhancements<br />
<strong>2010</strong>-<strong>2011</strong><br />
<strong>District</strong> <strong>Budget</strong> Executive Summary<br />
1
Our most important objective in the presentation of the budget data is to improve the quality of<br />
information provided to our community about the financial support plan for the <strong>District</strong>’s mission<br />
and goals, and educational programs and services for the <strong>2010</strong>-11 fiscal year. The material in the<br />
budget document includes information that has been suggested by the Board Members, staff, and<br />
the community.<br />
The budget reflects the allocation of revenues and expenditures to support educational programs<br />
and services. It presents the vision of district and staff articulated through financial and operating<br />
policies. It also represents a responsive balance between the educational needs of students and the<br />
ability of the community and the State to provide the necessary financial support to serve them.<br />
Mission Statement<br />
To graduate all of our students and prepare them for success in higher education.<br />
Core Beliefs and Commitments:<br />
• Every student can learn and achieve at high levels.<br />
o We will make all decisions based on attaining student achievement at or above grade<br />
level.<br />
• We are responsible for the education and safety of every student.<br />
o We will ensure that all decisions, actions, and resource allocations are made in the best<br />
interest of the students.<br />
o We will ensure a safe learning and working environment for all students and<br />
employees.<br />
• We are responsible for the efficient and effective operation of the school system.<br />
o We will ensure fiscal responsibility to the taxpayers of the <strong>District</strong>.<br />
• Everyone should be treated with respect.<br />
o We will ensure a high level of professionalism, customer service, and respect for<br />
everyone.<br />
o We will lead by example.<br />
• People support what they help create.<br />
o We will maintain the collaborative process for decision-making.<br />
<strong>2010</strong>-<strong>2011</strong> <strong>Budget</strong><br />
The budget process is comprised of seven phases – planning, preparation and submission, review<br />
and coordination, adoption, implementation, monitoring, and evaluation. The preparation of the<br />
budget commenced in October 2009 with the initial student enrollment forecast, property value<br />
projections, and the development and adoption of the budget calendar. The budget process<br />
continues through August and included budget reviews of each of the department’s base level<br />
budget and proposed budget enhancements. Recommendations from schools, parents, employee<br />
union groups, and stakeholders of the <strong>District</strong> were considered during the budget process. The<br />
final <strong>2010</strong>-11 budget was approved by the Board of Trustees on August 23, <strong>2010</strong>.<br />
<strong>2010</strong>-<strong>2011</strong><br />
<strong>District</strong> <strong>Budget</strong> Executive Summary<br />
2
Legislative Changes<br />
The Texas Legislature meets in regular session in odd-numbered years. During these sessions,<br />
the Legislature approves the state budget, which includes funding for local school districts. The<br />
81 st Legislative Session, which convened in January 2009, approved House Bill 3646 (HB 3646)<br />
for school finance effective for the school years 2009-<strong>2010</strong> and <strong>2010</strong>-<strong>2011</strong>.<br />
The major impacts of HB 3646 to school districts included: 1) a mandatory wage increase of at<br />
least $800 per year for employees subject to the minimum salary schedule, including teachers,<br />
librarians, nurses, speech pathologists, and counselors; 2) the use of State Fiscal Stabilization<br />
Funds (SFSF) in the State Foundation Program (SFP) revenues; and 3) a return to formula-based<br />
funding from the previous target revenues that were based on 2006-07 revenues. The SFSF<br />
revenue is a result of the Legislature using federal American Recovery and Reinvestment Act<br />
(ARRA) funds to cover shortfalls in the Foundation <strong>School</strong> Program. Even though the SFSF is<br />
part of the FSP, districts are required to submit a separate application for the SFSF and maintain<br />
compliance with federal requirements when expending these funds.<br />
Priorities for the 2012-13 Biennium<br />
The upcoming 82 nd legislative session of the state of Texas will be closely watched as legislators<br />
prepare to deal with a record budget shortfall at the state level. The impact on the funding for<br />
education remains to be seen, but public school districts in Texas are facing the possibility of a<br />
significant decrease in funding from current levels. Texas Education Agency Commissioner<br />
Robert Scott states that TEA has taken a “very deliberative approach to the 2012-2013 legislative<br />
appropriation reduction request. Agency priorities and recommended reductions were designed<br />
specifically to maximize fiscal resources without compromising the agency’s ability to execute on<br />
the state’s ambitious education agenda.” Mr. Scott lists TEA’s three major priorities as follows:<br />
1. Maintain focus on the goal of preparing all students in Texas for success in college and<br />
career;<br />
2. Pursue policies and strategies to help Texas school districts and campuses succeed in a<br />
tough fiscal environment; and,<br />
3. Support innovative teacher recruitment, retention, and reward policies to ensure all Texas<br />
students have access to effective teachers<br />
<strong>In</strong> the midst of the budgetary concerns, the state, school districts, and students in Texas are<br />
gearing up for significant changes in assessment and accountability measures. The goal of these<br />
changes is to increase student achievement and to provide greater accountability for<br />
administrators and teachers.<br />
There is no doubt that this next Legislative session presents fiscal challenges for state government<br />
in general and for public education.<br />
Major Changes for the <strong>2010</strong>-11 <strong>Budget</strong><br />
Due to a realization of savings through prior year campus closures, the <strong>District</strong> was able to<br />
include in the <strong>2010</strong>-11 budget a 1.5% average salary increase for all employees, which amounted<br />
to a $5.2 million increase in payroll expenditures in all funds. This is the second raise approved<br />
for employees since 2006-07. <strong>In</strong> addition, the starting salary for new teachers was increased<br />
which now enables SAISD to be more competitive with other districts in the area.<br />
<strong>2010</strong>-<strong>2011</strong><br />
<strong>District</strong> <strong>Budget</strong> Executive Summary<br />
3
The <strong>District</strong> has seen a decrease in student membership of over 1,400 students over the past five<br />
years from 56,580 in the 2004-05 school year to 55,086 in the 2009-10 school year. During the<br />
budget development process, enrollment for <strong>2010</strong>-11 was projected to be 56,111. The increase is<br />
due to a projected student population increase in grade K based on the establishment of a new<br />
Head Start program last year. The Head Start program is a new program that is being funded<br />
through a grant with the City of <strong>San</strong> <strong>Antonio</strong>, as well as local matching funds, that will serve<br />
1,934 students in the three and four year old age group. <strong>In</strong> order to accommodate this new<br />
program, three existing elementary campuses were re-purposed into Early Childhood Education<br />
centers during the 2009-10 school year and one additional vacant school was utilized.<br />
<strong>In</strong>ternal Service Funds<br />
At the start of the <strong>2010</strong>-11 school year, the district has implemented internal service funds for<br />
both Worker’s Compensation and Dental <strong>In</strong>surance. One purpose in establishing these service<br />
funds is to better capture all costs that are applicable to the service in order to more accurately<br />
price these services to internal users. The financial structure is meant to simulate an enterprise<br />
where all costs of operating the business are charged to the fund and operating efficiency can be<br />
assessed. <strong>In</strong> order to facilitate cost containment and manage risk, internal service funds for<br />
printing and health insurance will be established next year.<br />
Looking Beyond <strong>2010</strong>-11<br />
The Board of Trustees is committed to continuing the restructuring process for the campuses.<br />
The Long-Range Facility Planning Committee, which met throughout the 2008-09 school year,<br />
presented a plan for community input. <strong>In</strong> April <strong>2010</strong>, The Board of Trustees approved the<br />
formation of a community-based committee to work towards a November <strong>2010</strong> bond election.<br />
Trustees also approved initial recommendations for the first phase of implementation of the<br />
restructuring plan, which if a bond was passed, would eventually involve the consolidation of six<br />
of the <strong>District</strong>’s 91 schools, extensive renovation of the main receiving schools, program<br />
enhancements for high schools and middle schools, and additional campus upgrades. <strong>In</strong> August<br />
<strong>2010</strong>, The <strong>San</strong> <strong>Antonio</strong> ISD Board of Trustees voted to call for a $515 million bond election. The<br />
bond proposal was developed with input from a community-based committee representing all<br />
areas of the district. Funds from the bond will pay for improvements to schools across the district<br />
where some buildings are more than 100 years old, and almost half are more than 50 years old.<br />
The district staff will continue to monitor enrollment trends and make adjustments accordingly in<br />
future budgets.<br />
<strong>2010</strong>-<strong>2011</strong><br />
<strong>District</strong> <strong>Budget</strong> Executive Summary<br />
4
<strong>Budget</strong> Comparison<br />
The following table presents a comparison of the 2009-<strong>2010</strong> <strong>Budget</strong> for selected Governmental<br />
Funds with the <strong>2010</strong>-<strong>2011</strong> budget year. The Governmental Funds shown below are those that<br />
The Texas Education Agency requires that the Board of Education adopt an annual budget. These<br />
funds are the General Fund, Food Service Fund and the Debt Service Fund.<br />
Total <strong>Budget</strong>s for All Governmental Funds<br />
Funds<br />
Final Amended<br />
<strong>Budget</strong> *<br />
2009-<strong>2010</strong><br />
Approved <strong>Budget</strong> *<br />
<strong>2010</strong>-<strong>2011</strong><br />
%<br />
Change<br />
Local Operating Fund $ 404,876,425 $ 399,929,278 (1.2%)<br />
Food Service Fund $ 35,162,064 $ 34,604,101 (1.6%)<br />
Debt Service Fund $ 42,124,081 $ 39,544,071 (6.1%)<br />
Total Appropriations $ 482,162,570 $ 474,077,450 (1.7%)<br />
*State Fiscal Stabilization Fund 266 included in local operating fund<br />
<strong>2010</strong>-<strong>2011</strong><br />
<strong>District</strong> <strong>Budget</strong> Executive Summary<br />
5
Analysis of Adopted <strong>Budget</strong><br />
The composition of the <strong>District</strong>’s workforce is determined by the staffing formulas, policies and<br />
guidelines of the Board of Trustees on the basis of projected student membership and curriculum<br />
requirements. For the <strong>2010</strong>-11 fiscal year, salaries and fringe benefits are budgeted to consume<br />
86.3% of the General Operating Fund resources.<br />
General Funds Expenditures by Object<br />
(Comparison of Total Expenditures – Actual and <strong>Budget</strong>)<br />
Object<br />
Actual<br />
2008-09<br />
Payroll Costs 329,123,104<br />
Actual<br />
2009-10<br />
Approved <strong>Budget</strong><br />
<strong>2010</strong>-11<br />
%<br />
Change<br />
$ $ 345,156,352 $ 346,252,029 0.3%<br />
Contracted Services 24,474,858 26,650,209 29,743,082 11.6%<br />
Supplies & Materials 11,355,961 13,437,943 14,136,590 5.2%<br />
Other Operating Costs 2,630,852 2,461,526 3,164,635 28.6%<br />
Debt Service - - - 0.0%<br />
Capital Outlay 7,402,776 9,870,373 6,632,942 -32.8%<br />
Other Uses 2,125,486 7,465,721 1,267,470 -83.0%<br />
Total General Fund<br />
Expenditure $ 377,113,037 $ 405,042,124 $ 401,196,748 -0.9%<br />
Supplies &<br />
Materials<br />
3.3%<br />
Contracted<br />
Services<br />
6.6%<br />
Other<br />
Operating<br />
Costs<br />
0.6%<br />
2009‐<strong>2010</strong><br />
Capital<br />
Outlay<br />
2.4%<br />
Other Uses<br />
1.8%<br />
Payroll<br />
Costs<br />
85.2%<br />
Other<br />
Operating<br />
Costs<br />
Supplies & 0.8%<br />
Materials<br />
3.5%<br />
Contracted<br />
Services<br />
7.4%<br />
<strong>2010</strong>‐<strong>2011</strong><br />
Capital<br />
Outlay<br />
1.7%<br />
Other Uses<br />
0.3%<br />
Payroll Costs<br />
86.3%<br />
Payroll costs consume over 86.3% of the entire budget.<br />
<strong>2010</strong>-<strong>2011</strong><br />
<strong>District</strong> <strong>Budget</strong> Executive Summary<br />
6
General Fund Revenues<br />
Programs and services included in the General Fund <strong>Budget</strong> are primarily supported by local<br />
and state sources of revenue. A comparison of General Fund revenue sources is presented<br />
below.<br />
Revenue Sources<br />
Final Amended<br />
<strong>Budget</strong><br />
2009-<strong>2010</strong><br />
Approved <strong>Budget</strong><br />
<strong>2010</strong>-<strong>2011</strong><br />
Change<br />
<strong>In</strong>crease<br />
(Decrease)<br />
$<br />
Local Sources $ 130,833,116 $ 125,301,277 (5,531,839)<br />
State Sources 261,663,601 265,545,543 3,881,942<br />
Federal Sources 11,500,542 10,365,317 (1,135,225)<br />
Other Resources 89,549 - (89,549)<br />
Total Operating Fund Revenues $ 404,086,808 $ 401,212,137 $ (2,874,671)<br />
300,000,000<br />
2009-<strong>2010</strong> vs <strong>2010</strong>-<strong>2011</strong><br />
General Fund Revenue Sources<br />
200,000,000<br />
100,000,000<br />
Final Amended <strong>Budget</strong><br />
2009-<strong>2010</strong><br />
Approved <strong>Budget</strong><br />
<strong>2010</strong>-<strong>2011</strong><br />
-<br />
Local Sources State Sources Federal Sources Other<br />
Resources<br />
The local sources of revenue that support the General Fund <strong>Budget</strong> represent 31% of General<br />
Fund funding for the <strong>2010</strong>-<strong>2011</strong> school year. Of this amount, the largest source of revenue<br />
available to the <strong>District</strong> is the property tax that is derived from current and delinquent real estate<br />
tax payments. The decrease in local sources is a result of lower property values.<br />
The budget shows an increase in state revenue. The <strong>2010</strong>-11 state revenue projections are based<br />
on an estimated average daily attendance (ADA) of 49,261 students and certified taxable property<br />
values of $11,743,746,896.<br />
State revenue represents 66.0% of the General Fund of which $21M are State Fiscal Stabilization<br />
funds. These funds are granted by the American Recovery and Reinvestment Act (ARRA) of<br />
2009, Title XIV. The General Fund federal revenues are 2.5% of the revenue budget.<br />
<strong>2010</strong>-<strong>2011</strong><br />
<strong>District</strong> <strong>Budget</strong> Executive Summary<br />
7
Debt Service Fund<br />
The following table illustrates a comparison of the actual revenues for 2008-2009, the budget for<br />
2009-<strong>2010</strong> and the <strong>2010</strong>-<strong>2011</strong> estimated revenue reflecting the <strong>In</strong>terest and Sinking Fund (I&S)<br />
tax rate of $0.2097 per $100 of assessed property value in 2008-09 and 2009-10 and $0.2397 in<br />
<strong>2010</strong>-11.<br />
Debt Service Fund<br />
Actual<br />
Revenue<br />
2008-2009<br />
Final Amended<br />
<strong>Budget</strong><br />
2009-<strong>2010</strong><br />
Approved<br />
<strong>Budget</strong><br />
<strong>2010</strong>-<strong>2011</strong><br />
Percent<br />
Change<br />
Local $ 24,967,456 $ 25,924,065 $ 27,993,932 8.0%<br />
State (IFA & EDA) 15,105,941 11,938,163 11,564,375 (3.1%)<br />
Total $ 40,073,397 $ 37,862,228 $ 39,558,307 4.5%<br />
The expenditure budget for <strong>2010</strong>-11 consists of the following amounts: $9,085,191 for bond<br />
principal payments and $30,458,878 for bond interest payments. Detailed debt service<br />
requirements are found in the Debt Service Fund section of this budget book.<br />
For Fiscal Year <strong>2010</strong>-11, the Board of Trustees adopted an I&S tax rate of $0.2397. The adopted<br />
I&S tax rate will generate sufficient tax collections to meet the FY <strong>2010</strong>-11 debt service<br />
requirement.<br />
Personnel Allocation<br />
The goals and objectives of the <strong>District</strong> are achieved through the dedicated efforts of teachers,<br />
aides, administrators, and other support personnel. Student membership projections and campus<br />
staffing formulas direct the allocation of teachers and other staff among the campuses. The<br />
<strong>District</strong> has undertaken many innovative approaches to help reach specific goals. The following<br />
table illustrates a three-year staffing history along with the projected budget year.<br />
Staffing Allocations<br />
ALL FUNDS<br />
Actual<br />
2007-08<br />
Actual<br />
2008-09<br />
Actual<br />
2009-10*<br />
Projection<br />
<strong>2010</strong>-11<br />
%<br />
Change**<br />
Teachers 3,460.3 3,396.9 3,463.0 3,476.7 0.4%<br />
Other Campus Staff 2,550.2 2,404.0 2,483.7 2,485.4 0.1%<br />
Non Campus<br />
Staff 2,151.7 2,039.5 2,115.2 2,116.2 0.1%<br />
Total FTE's 8,162.2 7,840.4 8,061.9 8,078.3 0.2%<br />
* <strong>In</strong>crease due to Head Start Program<br />
** % Change is comparing <strong>2010</strong>-11 to 2009-10.<br />
<strong>2010</strong>-<strong>2011</strong><br />
<strong>District</strong> <strong>Budget</strong> Executive Summary<br />
8
Tax <strong>In</strong>formation<br />
Estimated Taxes on a Typical Home<br />
$900<br />
$800<br />
$700<br />
$600<br />
$500<br />
$400<br />
$300<br />
$200<br />
<strong>2010</strong><br />
$824<br />
$842<br />
<strong>2011</strong><br />
<strong>2010</strong> Average Market Value: $83,295 Average Taxable Value: $65,913<br />
<strong>2011</strong> Average Market Value: $82,272 Average Taxable Value: $65,758<br />
Change ($1,023) ($155)<br />
The <strong>District</strong>’s initial certification report from the Bexar Appraisal <strong>District</strong> reflects a total<br />
estimated taxable value for the <strong>2010</strong>-11 fiscal year of $11,285,562,681 compared to the estimated<br />
taxable value in 2009-10 of $11,711,440,130. Taxes to fund programs and services for the <strong>2010</strong>-<br />
<strong>2011</strong> fiscal year for the average homeowner increased due to a rise in the property tax rate of<br />
$1.2797 from $1.2497 and not local property values. The tax bill in 2009-10 for a home with an<br />
average market value of $83,295 and average taxable value of $65,913 was estimated to be $824<br />
and the estimated tax bill in <strong>2010</strong>-11 for the same home now with an average market value of<br />
$82,272 and average taxable value of $65,758 will be $842. It is estimated that the <strong>District</strong> will<br />
experience relatively modest increases in the tax base over the next several years.<br />
Demographics and Student Enrollment<br />
<strong>San</strong> <strong>Antonio</strong> is now the seventh largest city in the United States and is the fastest growing city in<br />
Texas. It is located in South-Central Texas, southwest of Austin, approximately 140 miles<br />
northwest of the Gulf of Mexico and 150 miles northeast of the city of Laredo on the Mexican<br />
border. It is located on the edge of the Gulf Coastal Plains, the fastest growing region within the<br />
state.<br />
According to the <strong>San</strong> <strong>Antonio</strong> Economic Foundation, the population of the area is over 1.3<br />
million with a median household income of $43,087. An annual cost of living comparison of<br />
selected cities produced by the Council for Community and Economic Research reflected that <strong>San</strong><br />
<strong>Antonio</strong>’s cost of living is much more affordable than other large cities such as Los Angeles,<br />
Cleveland, Portland, and Denver.<br />
<strong>2010</strong>-<strong>2011</strong><br />
<strong>District</strong> <strong>Budget</strong> Executive Summary<br />
9
53,000<br />
<strong>San</strong> <strong>Antonio</strong> ISD's ADA Trend<br />
52,877<br />
52,000<br />
51,000<br />
51,698<br />
50,488<br />
50,740<br />
ADA<br />
50,000<br />
49,000<br />
48,829<br />
48,000<br />
47,000<br />
46,000<br />
2006 2007 2008 2009 <strong>2010</strong><br />
<strong>School</strong> Year<br />
* Source: PEIMS Edit+ Reports<br />
Performance Measurement<br />
Beginning Spring 2003, by law, Texas students must pass a state assessment in order to be<br />
promoted at certain grade levels and to graduate from high school. The previous state assessment<br />
was called the Texas Assessment of Academic Skills (TAAS). TAAS has been replaced by the<br />
new state assessment called the Texas Assessment of Knowledge and Skills (TAKS). The TAKS<br />
test evaluates student learning based on the state-required curriculum – the Texas Essential<br />
Knowledge and Skills (TEKS). TAKS is administered in the 3 rd through the 11 th grades and<br />
students are held to higher academic standards than the TAAS test. The Student Success<br />
<strong>In</strong>itiative (SSI) grade advancement requirements apply to grade 3 reading test, the grade 5 reading<br />
and mathematics test, and the grade 8 reading and mathematics test. A student may advance to<br />
the next grade level only by passing these tests or by unanimous decision of his or her grade<br />
placement committee (GPC). Students in the 11 th grade must pass all portions of TAKS<br />
(Mathematics, English Language Arts, Social Studies and Science) in order to graduate.<br />
On June 16, 2007, the governor signed Senate Bill 1031, which called for development of “endof-course”<br />
assessment instruments for secondary-level courses. A current proposed section to<br />
field test and implement the twelve EOC assessments over the next several years beginning in the<br />
spring 2007 to 2012. The EOC assessments currently will be administered online on a voluntary<br />
basis.<br />
On January <strong>2010</strong>, House Bill (HB) 3, passed by the 81 st Texas Legislature, which includes<br />
changes to graduation requirements. The new requirements will be effective beginning in the<br />
<strong>2010</strong>-11 school year.<br />
HB3 has also placed Texas in the forefront of states working to ensure students graduate college<br />
and career ready. Beginning in the <strong>2011</strong>-12 school year, the state will adopt a new, more rigorous<br />
assessment system. The new testing system, called State of Texas Assessments of Academic<br />
<strong>2010</strong>-<strong>2011</strong><br />
<strong>District</strong> <strong>Budget</strong> Executive Summary<br />
10
Readiness (STARR), will place greater emphasis on alignment of the assessments across grades<br />
and alignment to college and career readiness.<br />
The charts below reflect the <strong>District</strong>’s TAKS performance for the assessment administered in the<br />
spring of the 2009 and <strong>2010</strong> school years.<br />
TAKS Performance Results All Students<br />
100%<br />
Percent Passing<br />
80%<br />
60%<br />
40%<br />
20%<br />
Reading<br />
Mathematics<br />
Writing<br />
0%<br />
2009 <strong>2010</strong><br />
<strong>School</strong> Year<br />
TAKS Performance Results All Students<br />
100%<br />
Percent Passing<br />
80%<br />
60%<br />
40%<br />
20%<br />
Social Studies<br />
Science<br />
0%<br />
2009 <strong>2010</strong><br />
<strong>School</strong> Year<br />
<strong>2010</strong>-<strong>2011</strong><br />
<strong>District</strong> <strong>Budget</strong> Executive Summary<br />
11
<strong>2010</strong>-11 <strong>District</strong> <strong>Budget</strong> Highlights<br />
The following selection of highlights is presented as a brief overview of the significant items and<br />
issues contained in the <strong>2010</strong>-<strong>2011</strong> budget.<br />
Student Membership. During the <strong>2010</strong>-11 school year, projected student<br />
membership increased. The <strong>2010</strong>-<strong>2011</strong> student membership is slightly higher than the<br />
2009-10 membership by 1,025 students.<br />
<strong>Budget</strong> Projections. The estimated revenues for fiscal year <strong>2011</strong> were based on the<br />
following assumptions:<br />
Average Daily Attendance 49,261<br />
Maintenance and Operations Tax Rate $1.04<br />
Tax Collection Rate 98.5%<br />
Property Value Growth (3.17%)<br />
Payroll Share of General Fund. Salaries and fringe benefits are expected to<br />
consume 86.3% of General Fund expenditures.<br />
Tax Rate. The <strong>2010</strong>-11 tax rate increased to $1.2797. The maintenance and<br />
operations tax rate is $1.0400 and the debt service rate is $0.2397. The <strong>District</strong> has<br />
consistently tried to maintain a low rate while delivering effective educational<br />
programs to children.<br />
The <strong>District</strong> is exploring strategies that focus on instructional productivity, reducing noninstructional<br />
expenditures through cost containment, efficiency programs and innovations as well<br />
as restructuring programs, such as reallocating existing teaching staff. The <strong>District</strong> intends to<br />
continue this focus on instructional outcomes.<br />
<strong>2010</strong>-<strong>2011</strong><br />
<strong>District</strong> <strong>Budget</strong> Executive Summary<br />
12
Summary<br />
I appreciate the fiscal support provided by the Board of Trustees and the community for<br />
development, implementation, and maintenance of the excellent educational program for children<br />
of the <strong>District</strong>. The <strong>2010</strong>-<strong>2011</strong> budget supports the <strong>District</strong>’s commitment to improving student<br />
achievement and maintaining strict public accountability for quality instructional services. This<br />
budget is a sound, school-centered proposal that has been built to facilitate cost-effective<br />
management and an ongoing open relationship with the entire community.<br />
Respectfully,<br />
Dr. Robert Durón<br />
Superintendent<br />
<strong>2010</strong>-<strong>2011</strong><br />
<strong>District</strong> <strong>Budget</strong> Executive Summary<br />
13
BUDGET CALENDAR<br />
FOR FISCAL YEAR <strong>2010</strong> - <strong>2011</strong><br />
Date<br />
January <strong>2010</strong><br />
Activity<br />
• <strong>Budget</strong> Calendar/Guidance Proposed<br />
February - May • Staff prepares Proposed <strong>Budget</strong>s for <strong>2010</strong>-<strong>2011</strong><br />
April 8<br />
May 24<br />
June 29<br />
• Board Meeting-<br />
Regarding all aspects of SAISD’s Financial Status<br />
• Board Meeting-<br />
Regarding all aspects of SAISD’s Financial Status<br />
• Board Meeting-<br />
Regarding all aspects of SAISD’s Financial Status<br />
July 12<br />
July 21<br />
August 13<br />
August 23<br />
• Board Meeting-<br />
Regarding all aspects of SAISD’s Financial Status<br />
• Board Meeting-<br />
Regarding all aspects of SAISD’s Financial Status<br />
• Publish Notice of Public Hearing in<br />
Local Newspaper<br />
SAISD website<br />
• Board Meeting-<br />
Public Hearing to Discuss <strong>Budget</strong> and Proposed Tax Rate<br />
Approval of Final Amended <strong>Budget</strong> for 2009-<strong>2010</strong><br />
Adoption of <strong>Budget</strong> for <strong>2010</strong>-<strong>2011</strong><br />
Adoption of Tax Rate for <strong>2010</strong>-<strong>2011</strong><br />
14
BUDGET CALENDAR<br />
FOR FISCAL YEAR <strong>2010</strong> - <strong>2011</strong><br />
Date<br />
September 1<br />
Activity<br />
• Fiscal Year <strong>2010</strong>-<strong>2011</strong> Officially Begins<br />
September 8-15 • Publish Notice of Public Hearing in local newspaper once a week<br />
for two weeks for State Financial Accountability Rating<br />
September 22<br />
• Public Hearing to Discuss the <strong>District</strong>’s 2008-2009 State Financial<br />
Accountability Rating<br />
October<br />
October 29<br />
December 3<br />
December 21<br />
January <strong>2011</strong><br />
• Continue budget monitoring each month of the fiscal year<br />
• PEIMS snap shot date<br />
• PEIMS first submission for fall collection due to TEA<br />
• Submit the <strong>District</strong> <strong>Budget</strong> document to GFOA and ASBOI for<br />
review<br />
• Approve External Auditors’ Annual Financial Report<br />
15
<strong>Budget</strong> Highlights<br />
<strong>2010</strong>-<strong>2011</strong><br />
The following section presents a brief overview of significant factors that impact the official budget<br />
for <strong>2010</strong>-<strong>2011</strong>.<br />
• Estimated revenue for <strong>2010</strong>-<strong>2011</strong>:<br />
$598,690,408 for all Governmental Funds including Special Revenue Funds.<br />
$476,831,541 for General Fund, Food Service Fund and Debt Service Fund.<br />
Local revenue is expected to decrease based on drop in taxable values of the district.<br />
State revenue is expected to increase by $3.3M based on increased enrollment and<br />
lower property values. HB 3646 Total Revenue for <strong>San</strong> <strong>Antonio</strong> ISD is $5,208 per<br />
WADA.<br />
• The <strong>2010</strong>-<strong>2011</strong> total appropriations:<br />
$603,982,494 total appropriations for all Governmental Funds including Special<br />
Revenue Funds.<br />
$474,077,450 total appropriations for General Fund, Food Service Fund and Debt<br />
Service Fund.<br />
• An increase in General Fund Balance is expected for the <strong>2010</strong>-11 school year.<br />
• Estimated Average Daily Attendance (ADA) is 49,261. The <strong>District</strong>’s average daily<br />
attendance is expected to increase 461 from last year. <strong>In</strong> this challenging urban<br />
environment, the <strong>District</strong> has decided to explore different means of increasing daily<br />
attendance including repurposing 4 campuses in support of the Head Start Program. The<br />
<strong>District</strong> is also focusing on a variety of academic offerings including college readiness<br />
programs, high school re-design, more in-house charter academies, and a Young<br />
Women’s Leadership Academy - all that allow students from other school districts to<br />
enroll in SAISD. <strong>In</strong> addition, the district is investing in numerous creative strategies<br />
aimed at improving graduation rates and preparing students for future endeavors. The<br />
district remains committed to both the Pre-K and Head Start Programs allowing students<br />
to begin their education at a younger age and enhancing their educational success.<br />
• State law mandates a lower class size for elementary classrooms in grades kindergarten to<br />
4 th grade with a maximum class size of 22 students to 1 teacher. The <strong>District</strong> expects to<br />
maintain a student/teacher ratio of 22:1 in these elementary grade levels.<br />
• Federal law mandates a lower class size for Head Start classrooms. The <strong>District</strong> expects<br />
to maintain a student/teacher ratio of 17:1 in the 3 year old classrooms and 20:1 in the 4<br />
year old classrooms.<br />
16
<strong>Budget</strong> Highlights<br />
<strong>2010</strong>-<strong>2011</strong><br />
• Maintenance & Operations Tax Rate of $1.04/$100 valuation. House Bill 1 (HB1)<br />
required school districts to incorporate a new rollback tax rate calculation beginning with<br />
the 2006-2007 year. For <strong>2010</strong>-<strong>2011</strong> the M&O tax rate was continued at the rate of $1.04<br />
per $100 property valuation.<br />
• Debt Service Tax Rate of $0.2397/$100 valuation. The calculation of this tax was not<br />
impacted by HB1. Based on current debt service requirements, the district tax rate was<br />
increased by $0.03 to $0.2397/$100 property valuation.<br />
• Total Tax Rate is $1.2797/$100 valuation. This year’s total tax rate is a $0.03 increase<br />
over last year’s rate; however, the amount of the increase to taxpayers is tempered in part<br />
by a slight decline in property values.<br />
• Tax Appraised Value of $15,506,411,394. As local property values continue to decrease<br />
in our city, local property taxes impact the <strong>District</strong>’s Local Revenue. This decrease is<br />
offset by an increase in state funding due to the “equalization” in the state funding<br />
formula. The burden to finance our schools has shifted from the state to the local<br />
taxpayers; however, the American Recovery and Reinvestment Act (ARRA) of 2009,<br />
Title VIII has helped lessen the burden.<br />
• Projected Property Value Growth for the district is expected to show a decline of 3.17%.<br />
The <strong>San</strong> <strong>Antonio</strong> ISD exists in the heart of the <strong>San</strong> <strong>Antonio</strong> metropolitan area, and the<br />
economic development and trends of the city impact the future of the district. The recent<br />
decrease in property values is due to the current economic downturn and the anticipated<br />
slow recovery of the real estate market. A gradual increase in values is expected in future<br />
years.<br />
17
Funding Sources <strong>2010</strong><strong>2011</strong><br />
The <strong>San</strong> <strong>Antonio</strong> <strong>In</strong>dependent <strong>School</strong> <strong>District</strong> has three major sources of revenues i.e., Local, State<br />
and Federal Funds.<br />
LOCAL<br />
This revenue is primarily derived from taxes levied on real estate by the <strong>District</strong>. Other sources of<br />
local funds include interest earnings, athletic events, and other miscellaneous income. The Local tax<br />
revenue amounts to approximately 24.70% of the <strong>District</strong>’s total revenue. Local revenue is 26.29%<br />
of the total revenue.<br />
STATE<br />
Maintenance & Operations $1.0400/ $100<br />
Debt Service $0.2397/ $100<br />
Total SAISD Tax Rate $1.2797/ $100<br />
This revenue is based primarily upon average daily attendance (ADA) of the <strong>District</strong>’s pupils by their<br />
educational category (Bilingual, Compensatory, Regular, Special Education, and Career &<br />
Technology). The State determines what the total cost for a basic program should be for the <strong>District</strong><br />
by special formulas and weights for type of students served. The State then deducts the amount of<br />
revenue required to be raised by the <strong>District</strong>. The balance is then provided as State Aid. The State<br />
assists with funding Debt Service on new and old bond issues. This amounts to 2.15% of the<br />
revenue. State funds account for approximately 49.23% of the total revenue.<br />
FEDERAL<br />
This revenue is primarily provided from grants designated for a special purpose. It cannot be spent for<br />
any reason other than the one so specified. Federal sources accounts for approximately 24.48% of the<br />
total revenue.<br />
18
Estimated Revenue<br />
All Funds <strong>2010</strong>-11<br />
TEA REQUIRED*<br />
<strong>In</strong>fo. Only<br />
Operating Food Service Debt Service Special Revenue Total<br />
ESTIMATED REVENUE Fund Fund Fund Fund** All Funds<br />
Local Revenue $ 125,301,277 $ 2,561,585 $ 27,993,932 $ 1,540,648 $ 157,397,442<br />
State Revenue 265,545,543 212,168 11,564,375 17,435,044 294,757,130<br />
Federal Revenue 10,365,317 33,287,344 102,883,175 146,535,836<br />
TOTAL EST. REVENUE $ 401,212,137 $ 36,061,097 $ 39,558,307 $ 121,858,867 $ 598,690,408<br />
* TEA (Texas Education Agency) requires the <strong>District</strong> to adopt an annual budget for these designated funds.<br />
** For information only. The Special Revenue Fund includes Federal and State funds such as Title I and other grants and entitlements.<br />
TEA does not require the <strong>District</strong> to include these funds in the annual budget to be adopted. The totals here represent those in the Finance System with<br />
a fiscal year "1" (<strong>2010</strong>-11) as of 09/30/10.<br />
19
Appropriations <strong>Budget</strong><br />
<strong>2010</strong>-<strong>2011</strong><br />
TEA REQUIRED*<br />
<strong>In</strong>fo. Only<br />
Operating Food Service Debt Service Special Revenue Total<br />
STIMATED EXPENDITURES Fund Fund Fund Fund** All Funds<br />
struction $ 235,109,755<br />
$ 73,198,755 $ 308,308,510<br />
structional Resources & Media 5,172,203 2,783,252 7,955,455<br />
urriculum & Prof. Development 6,565,341 20,186,165 26,751,506<br />
structional Administration 6,015,109 6,844,387 12,859,496<br />
hool Leadership 21,387,535 5,577,281 26,964,816<br />
uidance & Counseling 15,476,876 3,475,029 18,951,905<br />
ocial Work Services 1,772,222 2,034,596 3,806,818<br />
ealth Services 6,393,931 739,049 7,132,980<br />
udent Transportation ti 10,202,029 029 167,882 10,369,911<br />
911<br />
od Services 368,745 $ 32,879,012<br />
226,403 33,474,160<br />
tracurricular 9,741,044 143,709 9,884,753<br />
eneral Administration 13,057,152 3,500 16,500 13,077,152<br />
cilities Maintenance and<br />
perations 49,021,071 1,721,589 254,793 50,997,453<br />
ecurity & Monitoring 5,429,780 30,299 5,460,079<br />
ata Processing 11,241,625 1,006,268 12,247,893<br />
ommunity Services 1,602,546 4,771,655 6,374,201<br />
ebt Services 0 $ 39,544,071<br />
39,544,071<br />
cilities Acq. & Constr. 40,114 8,277,922 8,318,036<br />
ayments to Members SSA 171,099 171,099<br />
ayments to JJAEP 140,000 140,000<br />
ergovernmental Payments 1,192,200 1,192,200<br />
TOTAL EST. EXPENDITURES $ 399,929,278 $ 34,604,101 $ 39,544,071 $ 129,905,044 $ 603,982,494<br />
tal Other Uses $ 1,267,470 $ - $ - $ - $ 1,267,470<br />
tal Expenditures $ 401,196,748 $ 34,604,101 $ 39,544,071 $ 129,905,044 $ 605,249,964<br />
TEA (Texas Education Agency) requires the <strong>District</strong> to adopt an annual budget for these designated funds.<br />
For information only. The Special Revenue Fund includes Federal and State funds such as Title I and other grants and entitlements.<br />
TEA does not require the <strong>District</strong> to include these funds in the annual budget to be adopted. The totals here represent those in the Finance<br />
System with a fiscal year "1" (<strong>2010</strong>-11) as of 09/30/10. 20
Vision <strong>2011</strong><br />
<strong>Budget</strong> Enhancements<br />
<strong>2010</strong> - <strong>2011</strong> <strong>School</strong> Year<br />
Enhancement<br />
<strong>In</strong>creases<br />
● Police Department Mobile City/County Radios $ 37,249<br />
These radios are needed for 11 supervisors with each receiving two radios.<br />
One radio for internal communication, and one for communication with <strong>San</strong><br />
<strong>Antonio</strong> Fire and Police Department. These portable radios are compatible<br />
with the radios used by <strong>San</strong> <strong>Antonio</strong> Fire and Police Department and will<br />
increase communication with these agencies in times of emergency as well<br />
as every day situations thus providing increased safety of SAISD students<br />
and staff.<br />
● Police Department Mobile Radio Airtime 2,876<br />
The City of <strong>San</strong> <strong>Antonio</strong> charges outside agencies utilization of their radio<br />
system. The charge is $18 per month per radio. This cost covers upgrades<br />
as well as system upgrades.<br />
● Police Department Mobile Computers 30,000<br />
This enhancement is to install and replace in-car computers that are 13<br />
years old and parts are not available for them. Currently five computers are<br />
needed.<br />
● CPR Training Equipment 2,500<br />
Adult, child, and infant mannequins and training mats will be purchased to utilize<br />
in CPR/AED re-certification of RNs, LVNs and Health Assistants mandated by<br />
Senate Bill 7.<br />
● Vision Screening Equipment 10,000<br />
This enhancement will purchase 50 vision illuminator cabinets and vision<br />
screening charts used to conduct state mandated vision screenings on<br />
students in grades designated by the Special Senses and Communication<br />
Disorders Act, Texas Health and Safety Code, Chapter 36.<br />
● Assistant Director of Testing Position 67,080<br />
This position allows the <strong>District</strong> to be better equipped to monitor and track<br />
the new state testing program that includes EOC as well as manage all<br />
logistics for state and college readiness testing.<br />
● Consultants for Unacceptable Campuses 54,000<br />
The <strong>District</strong> is required by TEA to contract with external campus improvement<br />
team members as a consequence of identification as an Academically<br />
Unacceptable campus.<br />
● Campus Server 500,000<br />
The current campus servers were purchased in 2004. These servers are<br />
obsolete and out of warranty. The purchase of new servers will be used<br />
for supporting software applications and Microsoft System Management<br />
software at the campus level.<br />
● Stage Pulley System 100,000<br />
This enhancement will replace stage support equipment (cables, ropes,<br />
rigging, pulley mechanisms, etc. excluding lighting and curtains) at various<br />
sites.<br />
$ 803,705<br />
21
Total Estimated Revenue For<br />
All Funds by Source<br />
Percent of<br />
Source Description Amount Total Total<br />
Local Revenue<br />
Property Taxes M & O $ 120,013,876<br />
Property Taxes Debt Service 27,843,932<br />
Food Service (Meals/Misc.) 2,535,585<br />
Tuition, <strong>In</strong>terest, & Other 1,897,566<br />
Other 5,106,483<br />
Total Local Revenue $ 157,397,442 26.29%<br />
State Revenue<br />
Foundation Fund $ 226,497,401<br />
TRS on Behalf 18,024,434<br />
Debt Service (Bond) 11,564,375<br />
Stimulus Funds 21,889,537<br />
Special Revenue 16,781,383<br />
Total State Revenue 294,757,130 49.23%<br />
Federal Revenue<br />
Food Service $<br />
32,733,369<br />
369<br />
Special Revenue 102,883,175<br />
Other Federal 10,919,292<br />
Total Federal Revenue 146,535,836 24.48%<br />
Total Estimated Revenue $ 598,690,408 100.00%<br />
*M&O Tax Rate of $1.04<br />
$350,000,000<br />
$300,000,000<br />
Total Estimated Revenue <strong>2010</strong>-<strong>2011</strong><br />
$294,757,130<br />
$250,000,000<br />
$200,000,000<br />
$150,000,000<br />
$100,000,000<br />
$50,000,000<br />
$157,397,442<br />
$146,535,836<br />
$-<br />
Local Revenue State Revenue Federal Revenue<br />
22
Summary of Estimated<br />
Revenues by Fund<br />
FUND DESCRIPTION AMOUNT TOTAL<br />
Operating Fund<br />
**199 Local Maintenance $ 401,212,137<br />
General Fund Total $ 401,212,137<br />
Special Revenue Fund<br />
204 Title IV Part A, Safe & Drug Free Sch $ 367,657<br />
205 Head Start Program Grant 9,988,399<br />
206 McKinney-Vento Homeless Education 529,941<br />
211 ESEA Title I, Regular 38,480,629<br />
212 ESEA Title I, Migrant 293,269<br />
220 Adult Education and Family Literacy 2,293,933<br />
223 Federal, TANF 450,333<br />
224 IDEA-B Formula Fed. Special Ed 11,913,204<br />
225 IDEA Part B, Preschool 261,528<br />
240 Food Service 36,061,097<br />
244 Carl Perkins, CATE 2,034,489<br />
255 Title II, Part A, TPTR 5,931,456<br />
258 PCS <strong>School</strong> Grant 1,914,451<br />
261 TX Reading First <strong>In</strong>t. 378,543<br />
262 Title II, Part D, Technology 1,636,067<br />
274 Gear Up Project 4,238,021<br />
275 <strong>School</strong> Dropout Prevention 2,788,737<br />
276 Title I, SIP Academy Grant 124,403<br />
279 Title II, Part D, Technology - ARRA 404,466<br />
285 ESA, Title I, Part A - ARRA Stimulus 493,688<br />
286 Title I SIP Academy Grant - ARRA Stimulu 1,322,133<br />
289 Federally Funded Special Revenue 16,884,985<br />
381 Adult Basic Education - State 290,394<br />
385 State Supplemental Visually Impaired 34,001<br />
394 Life Skills Grant for Student Parents 622,403<br />
397 Advanced Placement <strong>In</strong>centive 19,626<br />
399 <strong>In</strong>vestment Capital Fund 47,943<br />
401 State Funded Optional Extended Year 280,117<br />
404 Student Success <strong>In</strong>itiative 1,939,152<br />
409 High <strong>School</strong> Completion and Success 290,246<br />
411 Technology Grant 2,866,387<br />
425 Teacher <strong>In</strong>duction and Mentoring Program 123,750<br />
426 TX Educator Excellence Award Grant 3,040,000<br />
428 High <strong>School</strong> Allotment 113,044<br />
429 State Funded Special Revenue Funds 7,916,301<br />
461 Student Activity 188,378<br />
499 Local Funded Special Revenue 906,792<br />
$401,212,137<br />
General<br />
Fund<br />
Summary by Fund Group<br />
$157,469,964<br />
Special<br />
Revenue<br />
$39,558,307<br />
Debt<br />
Service<br />
Fund<br />
$450,000<br />
Capital<br />
Projects<br />
$400,400,000<br />
$350,400,000<br />
$300,400,000<br />
$250,400,000<br />
$200,400,000<br />
$150,400,000<br />
$100,400,000<br />
$50,400,000<br />
$400,000<br />
Total Special Revenue Fund* 157,469,964<br />
511 Debt Service Fund 39,558,307<br />
6xx Capital Projects 450,000<br />
Total Estimated Resources $ 598,690,408<br />
* Special Revenue changes as grants and amounts change during the year.<br />
23
Total Estimated<br />
Expenditures<br />
The estimated SAISD expenditures for all funds are as follows:<br />
BUDGET PERCENT<br />
EXPENDITURE TYPE <strong>2010</strong>-11 OF TOTAL<br />
Payroll Costs 427,544,949 70.79%<br />
Contracted Services 61,236,831 10.14%<br />
Supplies and Materials 43,097,427 7.14%<br />
Other Operating Costs 8,777,734 1.45%<br />
Debt Service 39,544,071 6.55%<br />
Capital Outlay 23,781,482 3.94%<br />
TOTAL BUDGET $ 603,982,494 100.00%<br />
Total Estimated Expenditure<br />
450,000,000<br />
400,000,000<br />
350,000,000<br />
427,544,949<br />
300,000,000<br />
250,000,000<br />
200,000,000<br />
150,000,000<br />
100,000,000<br />
61,236,831<br />
43,097,427<br />
8,777,734<br />
39,544,071<br />
23,781,482<br />
50,000,000<br />
-<br />
24
Estimated Expenditures by Function and Fund Type<br />
Fund Type for All Funds<br />
Special<br />
Major<br />
Food Debt Revenue Function Function<br />
DESCRIPTION General Fund Service Service Fund Total Total<br />
11-<strong>In</strong>struction $ 235,109,755<br />
$ 73,198,755 $ 308,308,510<br />
12-<strong>In</strong>st. Resources & Media Svc 5,172,203 2,783,252 7,955,455<br />
13-Curriculum & <strong>In</strong>st Staff Dev. 6,565,341 20,186,165 26,751,506<br />
10-INST. SVC. SUBTOTAL $ 343,015,471<br />
21-<strong>In</strong>structional Administration 6,015,109 6,844,387 12,859,496<br />
23-<strong>School</strong> Administration 21,387,535 5,577,281 26,964,816<br />
20-INSTR. RELATED SUBTOTAL 39,824,311<br />
31-Guidance & Counseling Svc. 15,476,876 3,475,029 18,951,905<br />
32-Attendance & Social Work 1,772,222 2,034,596 3,806,818<br />
33 Health Services 6,393,931 739,049 7,132,980<br />
34-Pupil Transportation 10,202,029 167,882 10,369,911<br />
35-Food Services 368,745 32,879,012 226,403 33,474,160<br />
36-Extracurricular Activities 9,741,044 143,709 9,884,753<br />
30-PUPIL SVCS. SUBTOTAL 83,620,528<br />
41-General Administration 13,057,152 3,500 16,500 13,077,152<br />
40-GENERAL ADMIN. SUBTOTAL 13,077,152<br />
51-Facilities Maintenance and<br />
Operations 49,021,071 1,721,589 254,793 50,997,453<br />
52-Security & Monitoring 5,429,780 30,299 5,460,079<br />
53-Data Processing 11,241,625 1,006,268 12,247,893<br />
50-PLANT MAINT. SUBTOTAL 68,705,426<br />
61-Community Services 1,602,546 4,771,655 6,374,201<br />
60-ANCILLARY SERVICES SUB. 6,374,201<br />
71-Debt Service - 39,544,071 39,544,071<br />
70-DEBT SERVICES SUBTOTAL 39,544,071<br />
81-Facilities Acquisition & Construction 40,114 8,277,922 8,318,036<br />
80-FACILITIES ACQUISITION &<br />
CONSTRUCTION SUBTOTAL 8,318,036<br />
93-Payments to members SSA 171,099 171,099<br />
95-Payments to JJAEP 140,000 140,000<br />
99-<strong>In</strong>tergovernmental Payments 1,192,200 1,192,200<br />
90-INTERGOVT'L CHARGES SUB 1,503,299<br />
Function Total $ 399,929,278 $ 34,604,101 $ 39,544,071 $ 129,905,044 $ 603,982,494 $ 603,982,494<br />
25
Estimated Expenditures by Function<br />
Major Function - All Funds<br />
$350,000,000<br />
$300,000,000<br />
$250,000,000<br />
$200,000,000<br />
$150,000,000<br />
$100,000,000<br />
$50,000,000<br />
$-<br />
10-INST. SVC. SUBTOTAL<br />
20-INSTR. RELATED SUBTOTAL<br />
30-PUPIL SVCS. SUBTOTAL<br />
40-GENERAL ADMIN. SUBTOTAL<br />
50-PLANT MAINT. SUBTOTAL<br />
60-ANCILLARY SERVICES SUB.<br />
70-DEBT SERVICES SUBTOTAL<br />
80-FACILITIES ACQUISITION &<br />
CONSTRUCTION SUBTOTAL<br />
90-INTERGOVT'L CHARGES SUB<br />
26
General Fund<br />
Estimated Revenue<br />
ACTUAL PERCENT BUDGET PERCENT<br />
REVENUE TYPE 2009-<strong>2010</strong> OF TOTAL <strong>2010</strong>-<strong>2011</strong> OF TOTAL<br />
LOCAL REVENUE<br />
Local Taxes $ 123,737,538 30.62% $ 120,013,876 29.91%<br />
Other Local 5,672,917 1.40% 5,287,401 1.32%<br />
Estimated Total Local Revenue 129,410,455 32.03% 125,301,277 31.23%<br />
STATE REVENUE<br />
State Foundation 222,129,005 54.97% 225,434,449 56.19%<br />
State Fiscal Stabilization 22,191,510 21,889,537 5.46%<br />
TRS On Behalf 17,442,431 18,024,434 4.49%<br />
Other State Revenue 147,805 0.04% 197,123 0.05%<br />
Estimated Total State Revenue 261,910,751 64.82% 265,545,543 66.19%<br />
FEDERAL REVENUE 12,654,289 3.13% 10,365,317 2.58%<br />
TOTAL ESTIMATED REVENUE 403,975,495 99.98% 401,212,137 100.00%<br />
OTHER RESOURCES 89,549 0.02% -<br />
FROM FUND BALANCE - 0.00% - 0.00%<br />
89,549 0.02% - 0.00%<br />
TOTAL ESTIMATED REVENUE &<br />
OTHER RESOURCES $ 404,065,044 100.00% $ 401,212,137 100.00%<br />
LOCAL REVENUE<br />
125,301,277<br />
265,545,543<br />
STATE REVENUE<br />
FEDERAL<br />
REVENUE<br />
10,365,317<br />
27
General Fund<br />
Estimated Expenditures<br />
Actual PERCENT BUDGET PERCENT<br />
EXPENDITURE TYPE 2009-<strong>2010</strong> OF TOTAL <strong>2010</strong>-<strong>2011</strong> OF TOTAL<br />
Payroll Costs $ 345,156,352 85.43% $ 346,252,029 86.30%<br />
Contracted Services 25,788,337 6.38% 29,743,082 7.41%<br />
Supplies and Materials 13,437,943 3.33% 14,136,590 3.52%<br />
Other Operating Costs 2,461,956 0.61% 3,164,635 0.79%<br />
Debt Service - 0.00% - 0.00%<br />
Capital Outlay 9,870,373 2.44% 6,632,942 1.65%<br />
Other Uses 7,285,700 1.80% 1,267,470 0.32%<br />
TOTAL BUDGET $ 404,000,661 100.00% $ 401,196,748 100.00%<br />
Non-Payroll<br />
Estimated General<br />
Fund Expenditures<br />
Payroll Costs, 86.30%<br />
Supplies and Materials,<br />
3.52% Other Operating Costs,<br />
0.79%<br />
Other , 13.7%<br />
Capital Outlay, 1.65%<br />
Other Uses, 0.32%<br />
Contracted Services,<br />
7.41%<br />
28
General Fund<br />
Function Comparison<br />
FINAL<br />
BUDGET* PERCENT BUDGET * PERCENT<br />
FUNCTION 2009-<strong>2010</strong> OF TOTAL <strong>2010</strong>-<strong>2011</strong> OF TOTAL<br />
<strong>In</strong>struction $ 235,790,454 57.00% $ 235,109,755 58.60%<br />
<strong>In</strong>structional Resource & Media Services 5,454,071 1.32% 5,172,203 1.29%<br />
Curr. and <strong>In</strong>structional Staff Dev. 5,311,462 1.28% 6,565,341 1.64%<br />
<strong>In</strong>structional Leadership 6,295,317 1.52% 6,015,109 1.50%<br />
<strong>School</strong> Leadership 23,044,557 5.57% 21,387,535 5.33%<br />
Guidance and Counseling 16,367,621 3.96% 15,476,876 3.86%<br />
Social Worker Services 1,909,070 0.46% 1,772,222 0.44%<br />
Health Services 6,537,642 1.58% 6,393,931 1.59%<br />
Student t (Pupil) Transportation ti 11,701,073 073 2.83% 10,202,029 029 2.54%<br />
Food Services 409,458 0.10% 368,745 0.09%<br />
Extracurricular Activities 9,928,021 2.40% 9,741,044 2.43%<br />
General Administration 14,139,187 3.42% 13,057,152 3.25%<br />
Facilities Maintenance & Operations 47,078,430 11.38% 49,021,071 12.22%<br />
Security & Monitoring Services 5,973,576 1.44% 5,429,780 1.35%<br />
Data Processing Services 8,433,194 2.04% 11,241,625 2.80%<br />
Community Services 1,695,243 0.41% 1,602,546 0.40%<br />
Debt Service 20,000 0.00% - 0.00%<br />
Facilities Acquisition & Construction 3,495,849 0.85% 40,114 0.01%<br />
Payments to Juv. Justice Alt. Ed. Prog. (JJAEP) 100,000 0.02% 140,000 0.03%<br />
<strong>In</strong>tergovernmental Payments 1,192,200 0.29% 1,192,200 0.30%<br />
Other Uses 8,773,948 2.12% 1,267,470 0.32%<br />
TOTAL BUDGET $ 413,650,373 100.00% $ 401,196,748 100.00%<br />
* <strong>In</strong>cludes State Fiscal Stabilization Funds<br />
I<br />
29
General Fund - Major Function<br />
20 <strong>School</strong><br />
Leadership<br />
6.83%<br />
30 Student Support<br />
Svcs.<br />
10.96%<br />
40 Administration<br />
3.25%<br />
50 Support Services<br />
16.37%<br />
10 <strong>In</strong>struction<br />
61.53%<br />
60-90 Other<br />
1.06%<br />
30
General Fund<br />
by Type of Service<br />
FINAL<br />
BUDGET PERCENT BUDGET PERCENT<br />
TYPE OF SERVICE 2009-<strong>2010</strong> OF TOTAL <strong>2010</strong>-<strong>2011</strong> OF TOTAL**<br />
<strong>In</strong>struction & <strong>In</strong>structional Related Services $ 246,555,987 59.60% $ 246,847,299 61.53%<br />
<strong>In</strong>structional and <strong>School</strong> Leadership 29,339,874 7.09% 27,402,644 6.83%<br />
Support Services-Student 46,852,885 11.33% 43,954,847 10.96%<br />
Administrative Support Services 14,139,187 3.42% 13,057,152 3.25%<br />
Support Services Non-Student Based 61,485,200 14.86% 65,692,476 16.37%<br />
Community Services 1,695,243 0.41% 1,602,546 0.40%<br />
Debt Service 20,000 0.00% - 0.00%<br />
Facilities Acquisition & Construction 3,495,849 0.85% 40,114 0.01%<br />
<strong>In</strong>tergovernmental Charges 1,292,200 0.31% 1,332,200 0.33%<br />
Other Uses 8,773,948 2.12% 1,267,470 0.32%<br />
TOTAL BUDGET $ 413,650,373 100.00% $ 401,196,748 100.00%<br />
** NOTE: Totals may vary due to rounding.<br />
General Fund by Type of Service - <strong>Budget</strong><br />
Community Services,<br />
0.40% Facilities Acquisition &<br />
Construction, 0.01%<br />
Support Services Non‐<br />
Student Based, 16.37%<br />
<strong>In</strong>tergovernmental<br />
Charges, 0.33%<br />
Other Uses, 0.32%<br />
Administrative Support<br />
Services, 3.25%<br />
Support Services‐<br />
Student, 10.96%<br />
<strong>In</strong>structional and<br />
<strong>School</strong> Leadership,<br />
6.83%<br />
<strong>In</strong>struction &<br />
<strong>In</strong>structional Related<br />
Services, 61.53%<br />
31
General Fund by Program <strong>In</strong>tent<br />
and Major Object Code<br />
61XX 62XX 63XX 64XX 65XX 66XX Total By<br />
Payroll Costs Purch./Contr. Supplies & Other Oper. Debt Cap. Outlay Program<br />
P.I.C. Description Services Materials Expenses Services Land, Bldg, Eqp. <strong>In</strong>tent Code<br />
11 Basic Educ Services $ 131,874,475 $ 1,367,405 $ 1,699,828 $ 1,105,386 $ - $ 722,342 $ 136,769,436<br />
21 Gifted and Talented 1,525,334 10,500 74,129 92,950 0 2,000 1,704,913<br />
22 Career and Tech (VOC) 8,339,887 82,919 228,089 115,968 0 32,630 8,799,493<br />
23 Student w/Disabilities (Sp Ed) 46,192,984 59,845 609,713 11,000 0 27,000 46,900,542<br />
24 Accelerated Ed (Compensation) 2,549,280 3,231,178 1,427,660 181,780 0 71,088 7,460,986<br />
25 Bilingual Ed & ESL 22,460,429 17,843 282,401 98,872 0 11,750 22,871,295<br />
26 Non-Disciplinary AEP Services 4,598,516 160,174 48,253 8,385 0 24,000 4,839,328<br />
28 DAEP Basic Services 2,989,622 8,825 31,897 4,792 0 10,040 3,045,176<br />
30 T-1 <strong>School</strong>wide Related 11,560,832 146,000 707,175 0 0 0 12,414,007<br />
31 High <strong>School</strong> Allotment 3,641,165 22,300 24,500 8,383 0 14,081 3,710,429<br />
91 Athletics & Related Acti. 5,687,692 0 0 0 0 0 5,687,692<br />
99 Undistributed (Generic) 104,831,813 24,636,093 9,002,945 1,537,119 5,718,011 145,725,981<br />
Major Class Object Total<br />
% of Total<br />
$ 346,252,029 $ 29,743,082 $ 14,136,590 $ 3,164,635 $ - $ 6,632,942 $ 399,929,278<br />
86.58% 7.44% 3.53% 0.79% 0.00% 1.66% 100.00%<br />
32
Food Service Fund<br />
Estimated Revenues & Expenditures<br />
FINAL<br />
ESTIMATED<br />
BUDGET PERCENT REVENUE PERCENT<br />
REVENUE TYPE 2009-<strong>2010</strong> OF TOTAL <strong>2010</strong>-<strong>2011</strong> OF TOTAL<br />
ESTIMATED REVENUE<br />
Local Revenue $ 2,513,593 6.88% $ 2,561,585 7.03%<br />
State Revenue 212,168 0.58% 212,168 0.58%<br />
Federal Revenue 32,910,803 90.05% 33,287,344 91.33%<br />
Other Resources 912,527 2.50% 384,403 1.05%<br />
TOTAL ESTIMATED REVENUE $ 36,549,091 100.00% $ 36,445,500 100.00%<br />
FINAL<br />
BUDGET PERCENT BUDGET PERCENT<br />
EXPENDITURE TYPE 2009-<strong>2010</strong> OF TOTAL <strong>2010</strong>-<strong>2011</strong> OF TOTAL<br />
ESTIMATED EXPENDITURES<br />
Payroll Costs $ 16,303,925 46.37% $ 15,501,946 44.80%<br />
Contracted Services 2,072,128 5.89% 1,890,260 5.46%<br />
Supplies and Materials 15,746,102 44.78% 16,063,521 46.42%<br />
Other Operating Costs 385,817 1.10% 324,374 0.94%<br />
Capital Outlay 654,092 1.86% 824,000 2.38%<br />
TOTAL ESTIMATED EXPENDITURES $ 35,162,064 100.00% $ 34,604,101 100.00%<br />
Estimated Revenue<br />
Estimated Expenditures<br />
Local Revenue<br />
$2,561,585<br />
Payroll Costs<br />
$15,501,946<br />
Contracted Services<br />
$1,890,260<br />
State Revenue<br />
$212,168<br />
Supplies and Materials<br />
$16,063,521<br />
Federal Revenue<br />
$33,287,344<br />
Other Operating Costs<br />
$324,374<br />
Other Resources<br />
$384,403<br />
Capital Outlay<br />
$824,000<br />
0 10,000,000 20,000,000 30,000,000<br />
0 5,000,00010,000,00015,000,00020,000,000<br />
33
Special Revenue Fund<br />
Estimated Revenues & Expenditures<br />
ORIGINAL*<br />
ESTIMATED<br />
BUDGET PERCENT REVENUE PERCENT<br />
REVENUE TYPE 2009-<strong>2010</strong> OF TOTAL <strong>2010</strong>-<strong>2011</strong> OF TOTAL**<br />
ESTIMATED REVENUE<br />
Local $ 3,554,689 3.03% $ 1,090,648<br />
0.90%<br />
State 6,910,219 5.90% 17,435,044 14.36%<br />
Federal Revenue 106,673,416 91.07% 102,883,175 84.74%<br />
TOTAL ESTIMATED REVENUE $ 117,138,324 100.00% $ 121,408,867 100.00%<br />
ORIGINAL*<br />
BUDGET PERCENT BUDGET PERCENT<br />
EXPENDITURE TYPE 2009-<strong>2010</strong> OF TOTAL <strong>2010</strong>-<strong>2011</strong> OF TOTAL<br />
ESTIMATED EXPENDITURES<br />
Payroll Costs $ 57,192,163 48.38% $ 65,790,974 53.97%<br />
Contracted Services 18,049,698 15.27% 29,603,489 24.28%<br />
Supplies and Materials 31,752,187 26.86% 12,897,316 10.58%<br />
Other Operating Costs 3,567,458 3.02% 5,288,725 4.34%<br />
Capital Outlay 7,656,219 6.48% 8,324,540 6.83%<br />
TOTAL ESTIMATED EXPENDITURES $ 118,217,725 100.00% $ 121,905,044 100.00%<br />
Other Oper and Capital Outlay 13,613,265<br />
MAJOR SPECIAL REVENUE FUNDS INCLUDED:<br />
TITLE I, PART A<br />
TITLE II, PART A, TEACHER, PRINCIPAL<br />
TRAINING AND RECRUITING<br />
HEAD START PROGRAM GRANT<br />
FEDERAL CAREER AND TECHNOLOGY BASIC<br />
IDEA-B FORMULA SPECIAL ED.<br />
IDEA-B PRESCHOOL SPECIAL ED.<br />
FOOD SERVICE FUND<br />
* The original budget is used for Special Revenue comparison because a number of grants are received<br />
during the school year. Some grants are multi-year and the balances are carried forward from prior years.<br />
The Special Revenue fund increase for <strong>2010</strong>- <strong>2011</strong> is due in part to the timing of when grants are approved<br />
and does not necessarily indicate a total change in grants and entitlements.<br />
** NOTE: Totals may vary due to rounding.<br />
34
Special Revenue Fund Chart<br />
Estimated Expenditures<br />
Contracted Services<br />
$29,603,489<br />
24.28%<br />
Other Operating<br />
Costs $12,897,316<br />
10.58%<br />
Debt Service<br />
$5,288,725<br />
4.34%<br />
Payroll Costs<br />
$65,790,974<br />
53.97%<br />
Capital Outlay<br />
$8,324,540<br />
6.83%<br />
35
Special Revenue by Function<br />
and Major Object Code<br />
61XX 62XX 63XX 64XX 65XX 66XX<br />
Payroll Costs Purch./Contr. Supplies & Other Oper. Debt Cap. Outlay Function Major % of<br />
Function Description Services Materials Expenses Services Land, Bldg, Eqp. Total Function Total Total<br />
11 <strong>In</strong>struction 35,758,663 19,098,840 9,390,164 1,484,351 7,466,736 73,198,755<br />
12<br />
<strong>In</strong>structional Resources &<br />
Media 2,377,030 23,564 377,496 2,036 3,126 2,783,252<br />
13<br />
Curriculum & Prof.<br />
Development 13,110,263 3,987,153 1,154,400 1,692,681 241,668 20,186,165 1X 96,168,172 78.89%<br />
21 <strong>In</strong>structional Administration 4,202,072 2,035,820 281,881 287,664 36,949 6,844,387<br />
23 <strong>School</strong> Leadership 4,155,033 217,764 434,054 739,412 31,019 5,577,281 2X 12,421,667 10.19%<br />
31 Guidance & Counseling 2,370,462 709,348 286,624 108,595 0 3,475,029<br />
32 Social Work Services 1,098,085 923,365 2,449 10,698 2,034,596<br />
33 Health Services 430,390 275,471 15,359 16,328 1,501 739,049<br />
34 Student Transportation 52,958 80 114,845 167,882<br />
35 Food Services 226,403 - - 226,403<br />
36 Extracurricular 2,769 2,100 32,517 99,327 6,997 143,709 3X 6,786,669 5.57%<br />
41 General Administration 16,500 16,500 4X 16,500 0.01%<br />
Facilities Maintenance and<br />
51 Operations 82,164 123,222 9,916 766 38,726 254,793<br />
52 Security & Monitoring 8,920 9,886 7,715 2,125 1,653 30,299<br />
53 Data Processing 536,063 227,503 148,412 13,440 80,850 1,006,268 5X 1,291,361 1.06%<br />
61 Community Services 1,379,700 1,952,953 756,250 660,203 22,548 4,771,655 6X 4,771,655 3.91%<br />
81 Facilities Acquisition 277,922 277,922 8X 277,922 0.23%<br />
93 Payment to Member SSA 171,099 - 171,099 9x 171,099 0.14%<br />
Total by Object<br />
65,790,974 29,603,489 12,897,316 5,288,725 8,324,540 121,905,044 XX 121,905,044 100%<br />
Percent of Total<br />
53.97% 24.28% 10.58% 4.34% 0.00% 6.83% 100%<br />
* Excludes fund 266 and 240.<br />
36
Debt Service Fund<br />
Estimated t Revenues & Expenditures<br />
FINAL<br />
ESTIMATED<br />
BUDGET PERCENT REVENUE PERCENT<br />
REVENUE TYPE 2009-<strong>2010</strong> OF TOTAL <strong>2010</strong>-<strong>2011</strong> OF TOTAL*<br />
ESTIMATED REVENUE<br />
Local Taxes $ 24,807,065 60.17% $ 27,843,932 68.85%<br />
Local <strong>In</strong>terest & <strong>In</strong>vestments 1,117,000 2.70% 150,000 0.37%<br />
State Aid 11,938,163 28.96% 11,564,375 28.60%<br />
Other Resources 3,361,421 8.15% 883,067 2.18%<br />
TOTAL EST REVENUE & OTHER RESOURCES $ 41,223,649 100.00% $ 40,441,374 100.00%<br />
FINAL<br />
BUDGET PERCENT BUDGET PERCENT<br />
EXPENDITURE TYPE 2009-<strong>2010</strong> OF TOTAL <strong>2010</strong>-<strong>2011</strong> OF TOTAL<br />
ESTIMATED EXPENDITURES<br />
Principal - Bonds SR 2000 $ 830,000 1.97% $ - 0.00%<br />
Principal - Bonds SR 2001 A & B 5,719,382 13.58% 7,220,191 18.26%<br />
Principal - Bonds SR 2005 4,920,000 11.68% 995,000 2.52%<br />
Principal - Bonds SR 2006 150,000 0.36% 155,000 0.39%<br />
Principal - Bonds SR 2007 690,000 1.64% 715,000 1.81%<br />
Principal - Lease Purchase 2,370,000 5.63% - 0.00%<br />
<strong>In</strong>terest - Bonds SR 2000 40,670 0.10% - 0.00% 00%<br />
<strong>In</strong>terest - Bonds SR 2001 A & B 10,336,187 24.54% 13,736,322 34.74%<br />
<strong>In</strong>terest - Bonds SR 2005 14,637,028 34.75% 14,471,428 36.60%<br />
<strong>In</strong>terest - Bonds SR 2006 2,089,063 4.96% 2,083,063 5.27%<br />
<strong>In</strong>terest - Bonds SR 2007 192,872 0.46% 168,067 0.43%<br />
<strong>In</strong>terest - Lease Purchase 103,049 0.24% - 0.00%<br />
Other DS Fees -Arbitrage 45,830 0.11% - 0.00%<br />
TOTAL EST EXPENDITURES & OTHER USES $ 42,124,081<br />
100.00% $ 39,544,071 100.00%<br />
* NOTE: Totals may vary due to rounding.<br />
37
Debt Service Fund Charts<br />
Estimated Revenue<br />
Other Resources<br />
$883,067<br />
State Aid<br />
$11,564,375<br />
Local <strong>In</strong>terest & <strong>In</strong>vestments<br />
$150,000<br />
Local Taxes<br />
$27,843,932<br />
Estimated Expenditures<br />
Principal - Bonds SR 2007<br />
Principal 715,000<br />
<strong>In</strong>terest 168,067<br />
Principal - Bonds SR 2006<br />
Principal 155,000<br />
<strong>In</strong>terest 2,083,063<br />
Principal - Bonds SR 2005<br />
Principal 995,000<br />
<strong>In</strong>terest 14,471,428<br />
Principal - Bonds SR 2001 A & B<br />
Principal 7,220,191<br />
<strong>In</strong>terest 13,736,322<br />
Principal - Bonds SR 2000<br />
Principal 0<br />
<strong>In</strong>terest 0<br />
38
Term<br />
County Number and Name<br />
CPTD<br />
Average Daily Attendance<br />
(ADA)<br />
<strong>Budget</strong> Assumption Property<br />
Value<br />
Fund Number<br />
Function<br />
Expenditure Object<br />
Local Revenues<br />
<strong>San</strong> <strong>Antonio</strong> <strong>In</strong>dependent <strong>School</strong> <strong>District</strong><br />
<strong>Budget</strong> Glossary<br />
Definition<br />
The Texas Education Agency uses this unique number to<br />
identify the <strong>District</strong>. This number is used to report audit<br />
report financial information, PEIMS, student and budget<br />
data.<br />
This is the property value assigned to the <strong>District</strong> by the<br />
Comptroller’s Property Tax Division through their property<br />
value study. The value is used by TEA to determine how<br />
much of the state funding should be the district’s local<br />
funding share.<br />
ADA is used by TEA to determine and distribute the <strong>District</strong>’s<br />
state funding amount. ADA is the total number of<br />
instructional days that students are in attendance divided by<br />
177 instructional days.<br />
The estimated property taxable value used to determine the<br />
property taxes that will be collected during the <strong>2010</strong>-<strong>2011</strong><br />
school year.<br />
Three (3) digit number identifying the fund source. For<br />
example, fund number 1XX identifies local operating budget<br />
funds such as 168 Special Education, 199 Local Operating;<br />
2XX identifies federal funding such as 211 Title I.<br />
This is a two digit number identifies the purpose for which<br />
the expenditure was made. Some examples of functions<br />
used include; Function 11 for <strong>In</strong>struction, Function 34 for<br />
Student Transportation, and Function 53 for Data<br />
Processing Services.<br />
This is a four (4) digit number that identifies what was<br />
purchased. Examples are 61XX Payroll Costs, 62XX<br />
Professional and Contract Services, 63XX Supplies and<br />
Materials, 64XX Other Operating Expenses such as Travel,<br />
Meals, and Lodging, 65XX Debt Payments, 66XX Capital<br />
Outlay such as computer purchases.<br />
This is the estimated amount of revenues generated by<br />
property taxes, interest income, athletic events, GED fees,<br />
and tuition. (ALL FUNDS)<br />
Number or Estimated<br />
Amount<br />
015-907<br />
$ 12,136,259,986<br />
49,260.67<br />
$ 11,743,746,896<br />
$ 157,397,442<br />
39
State Revenues*<br />
Federal Revenues<br />
Proposed Property Tax Rate<br />
<strong>San</strong> <strong>Antonio</strong> <strong>In</strong>dependent <strong>School</strong> <strong>District</strong><br />
<strong>Budget</strong> Glossary<br />
The estimated amount of revenues generated by the<br />
<strong>District</strong>’s average daily attendance and the number of<br />
students in compensatory education, gift and talented,<br />
special education. This amount also includes state<br />
payments for IFA/EDA debt allotment. (ALL FUNDS)<br />
The estimated amount of revenues received by the <strong>District</strong><br />
from the Federal Department of Agriculture, and other<br />
Federal revenues distributed through TEA, such as Medicaid<br />
and SHARS reimbursements. (ALL FUNDS)<br />
This is the tax rate that is necessary to maintain the <strong>District</strong>’s<br />
local operating budget and pay for the Bond issued in prior<br />
years. There are two components in the total tax rate.<br />
These are the Maintenance and Operations (M&O) and<br />
<strong>In</strong>terest & Sinking (I&S) tax rates. The M&O tax rate is used<br />
to pay for the local operating expenditures, and the I&S tax<br />
rate is used to pay the debt such as the bond issue. Must be<br />
approved by the Board.<br />
$ 294,757,130<br />
$ 146,535,836<br />
Total Tax Rate<br />
$1.2797 (M&O of $1.04<br />
and I&S of .2397)<br />
Fiscal Year<br />
Total Expenditures<br />
The fiscal year for the <strong>District</strong>’s local operating budget starts<br />
on September 1st and ends on August 31st. Generally,<br />
federal programs operate in a fiscal year that starts on July<br />
1st and ends on June 30th.<br />
The total budget for expenditures in the local operating<br />
budget. Local operating expenditures do not include the<br />
Food Service, Bond Program, and Special Revenue funds.<br />
<strong>2010</strong>-<strong>2011</strong><br />
$ 401,196,748<br />
Total Revenue<br />
The total of local, state, and federal revenues budgeted in<br />
the local operating fund. Local operating funds do not<br />
include the Food Service, Bond Program, and Special<br />
Revenue funds.<br />
Total Local Operating <strong>Budget</strong> The total expenditures and estimated amount needed from<br />
Fund Balance that is adopted by the Board. <strong>Budget</strong> is<br />
adopted by Fund and Function. This provides the maximum<br />
flexibility in using budget amounts within the same Function<br />
Code.<br />
$ 401,212,137<br />
$ 401,196,748<br />
* For 2009-10 and <strong>2010</strong>-11, State Revenue includes the state Fiscal Stabilization Funds.<br />
40