Budget In Focus 2010-2011 - San Antonio Independent School District
Budget In Focus 2010-2011 - San Antonio Independent School District
Budget In Focus 2010-2011 - San Antonio Independent School District

You also want an ePaper? Increase the reach of your titles
YUMPU automatically turns print PDFs into web optimized ePapers that Google loves.
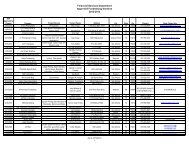
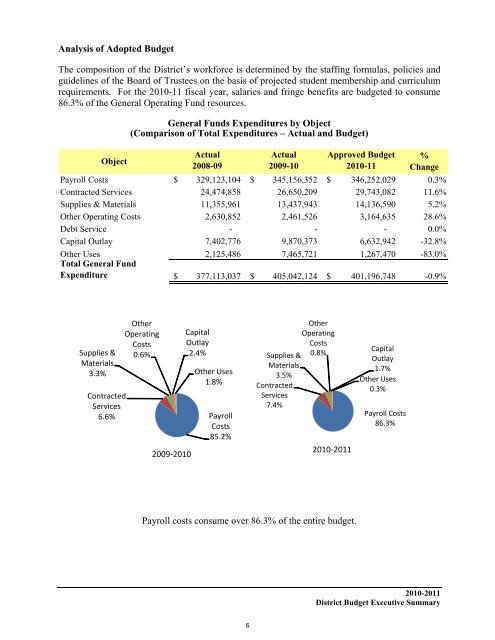
Analysis of Adopted <strong>Budget</strong><br />
The composition of the <strong>District</strong>’s workforce is determined by the staffing formulas, policies and<br />
guidelines of the Board of Trustees on the basis of projected student membership and curriculum<br />
requirements. For the <strong>2010</strong>-11 fiscal year, salaries and fringe benefits are budgeted to consume<br />
86.3% of the General Operating Fund resources.<br />
General Funds Expenditures by Object<br />
(Comparison of Total Expenditures – Actual and <strong>Budget</strong>)<br />
Object<br />
Actual<br />
2008-09<br />
Payroll Costs 329,123,104<br />
Actual<br />
2009-10<br />
Approved <strong>Budget</strong><br />
<strong>2010</strong>-11<br />
%<br />
Change<br />
$ $ 345,156,352 $ 346,252,029 0.3%<br />
Contracted Services 24,474,858 26,650,209 29,743,082 11.6%<br />
Supplies & Materials 11,355,961 13,437,943 14,136,590 5.2%<br />
Other Operating Costs 2,630,852 2,461,526 3,164,635 28.6%<br />
Debt Service - - - 0.0%<br />
Capital Outlay 7,402,776 9,870,373 6,632,942 -32.8%<br />
Other Uses 2,125,486 7,465,721 1,267,470 -83.0%<br />
Total General Fund<br />
Expenditure $ 377,113,037 $ 405,042,124 $ 401,196,748 -0.9%<br />
Supplies &<br />
Materials<br />
3.3%<br />
Contracted<br />
Services<br />
6.6%<br />
Other<br />
Operating<br />
Costs<br />
0.6%<br />
2009‐<strong>2010</strong><br />
Capital<br />
Outlay<br />
2.4%<br />
Other Uses<br />
1.8%<br />
Payroll<br />
Costs<br />
85.2%<br />
Other<br />
Operating<br />
Costs<br />
Supplies & 0.8%<br />
Materials<br />
3.5%<br />
Contracted<br />
Services<br />
7.4%<br />
<strong>2010</strong>‐<strong>2011</strong><br />
Capital<br />
Outlay<br />
1.7%<br />
Other Uses<br />
0.3%<br />
Payroll Costs<br />
86.3%<br />
Payroll costs consume over 86.3% of the entire budget.<br />
<strong>2010</strong>-<strong>2011</strong><br />
<strong>District</strong> <strong>Budget</strong> Executive Summary<br />
6