Geochemical energy sources for microbial primary production in the ...
Geochemical energy sources for microbial primary production in the ...
Geochemical energy sources for microbial primary production in the ...

Create successful ePaper yourself
Turn your PDF publications into a flip-book with our unique Google optimized e-Paper software.
24 C. Schmidt et al. / Mar<strong>in</strong>e Chemistry 108 (2008) 18–31<br />
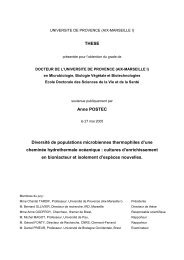
Iron distribution appears conservative <strong>in</strong> first approximation<br />
<strong>in</strong> <strong>the</strong> studied environment, with a roughly l<strong>in</strong>ear<br />
correlation with temperature. The observed trend still lies<br />
significantly below <strong>the</strong> reference end-member dilution model.<br />
This depletion reflects, ei<strong>the</strong>r a reduction of <strong>the</strong> end-member<br />
iron content, or more likely, iron removal by precipitation from<br />
<strong>the</strong> secondary source fluid be<strong>for</strong>e its emission <strong>in</strong>to seawater.<br />
From <strong>the</strong> <strong>in</strong> situ iron II measurements per<strong>for</strong>med <strong>in</strong> 2005, a<br />
ratio of 51 μMFe II °C − 1 was established. This estimate depicts<br />
an iron depletion <strong>in</strong> <strong>the</strong> local source fluid of about 23%, with<br />
regard to <strong>the</strong> end-member dilution measured <strong>in</strong> 1997 (i.e.<br />
18.4 mM <strong>in</strong>stead of 24 mM when extrapolated to <strong>the</strong> end-<br />
Fig. 4. (a) Iron as a function of temperature at Ra<strong>in</strong>bow show<strong>in</strong>g <strong>the</strong><br />
reference end-member dilution model (dotted l<strong>in</strong>e) and <strong>the</strong> model<br />
def<strong>in</strong>ed from 2005 <strong>in</strong> situ data (solid l<strong>in</strong>e). Open circles: total Fe <strong>in</strong><br />
samples (2001), triangles: <strong>in</strong> situ Fe II measurements (2005), crosses:<br />
<strong>in</strong> situ Fe II measurements (2001). (b) Sulfide as a function of iron at<br />
Ra<strong>in</strong>bow. Bold dotted l<strong>in</strong>e: reference end-member dilution model,<br />
solid l<strong>in</strong>e: empirical model, th<strong>in</strong> dotted l<strong>in</strong>e: model allow<strong>in</strong>g<br />
equilibrium with FeS precipitate. Open circles: sample contents,<br />
Close circles: Fe II <strong>in</strong> situ data (ATOS 2001).<br />
temperatures were measured <strong>in</strong> <strong>the</strong> center of <strong>the</strong> swarms. A<br />
temperature gradient was observed along a vertical axis<br />
with<strong>in</strong> <strong>the</strong> shrimp assemblages. Similar ranges and patterns<br />
were obta<strong>in</strong>ed dur<strong>in</strong>g <strong>the</strong> ATOS cruise (2001) <strong>for</strong> two different<br />
swarms at <strong>the</strong> Ra<strong>in</strong>bow site (Table 3). These features<br />
and <strong>the</strong> turbulent currents of shimmer<strong>in</strong>g fluid observed<br />
around <strong>the</strong> bottom of <strong>the</strong> swarm suggest a hot fluid emission<br />
below <strong>the</strong> swarm as schematized <strong>in</strong> Fig. 3. The direct outflow<br />
source was not observable, as it was masked by a group of<br />
m<strong>in</strong>eral spires.<br />
3.2. Comparison of empirical data with <strong>the</strong> end-member<br />
dilution model<br />
3.2.1. Ra<strong>in</strong>bow<br />
Iron concentrations <strong>in</strong> <strong>the</strong> swarm environment have been<br />
determ<strong>in</strong>ed, both, <strong>in</strong> situ (Fe II alone) and from fluid sampl<strong>in</strong>g<br />
(total labile Fe after reduction of Fe III with ascorbic acid). The<br />
iron–temperature correlation <strong>for</strong> <strong>the</strong> data sets obta<strong>in</strong>ed <strong>in</strong> 2001<br />
and 2005 is ra<strong>the</strong>r consistent (Fig. 4a). Fur<strong>the</strong>rmore, <strong>the</strong> total<br />
Fe-temperature correlation <strong>in</strong> fluid samples does not significantly<br />
depart from <strong>in</strong> situ data (Fig. 4a). This suggests that <strong>the</strong><br />
contribution of ferric iron to <strong>the</strong> overall <strong>in</strong> situ iron budget <strong>in</strong><br />
<strong>the</strong> shrimp surround<strong>in</strong>g is m<strong>in</strong>or.<br />
Fig. 5. (a) pH as a function of temperature, (b) CO 2 as a function of pH<br />
<strong>for</strong> Ra<strong>in</strong>bow samples. Solid l<strong>in</strong>e: without Fe II oxidation, l<strong>in</strong>e with<br />
crosses: allow<strong>in</strong>g Fe II oxidation <strong>in</strong> samples. Open squares: <strong>in</strong> <strong>the</strong><br />
shrimp habitat (2001), triangles: local hot fluid source (2001), close<br />
squares: <strong>in</strong> <strong>the</strong> shrimp habitat (2005). (c) CH 4 as a function of pH <strong>for</strong><br />
Ra<strong>in</strong>bow samples. Th<strong>in</strong> l<strong>in</strong>e: reference end-member dilution model,<br />
solid l<strong>in</strong>e: empirically fitted model.