1 Multi phase flow modeling applied to metallurgical processes ...
1 Multi phase flow modeling applied to metallurgical processes ...
1 Multi phase flow modeling applied to metallurgical processes ...

You also want an ePaper? Increase the reach of your titles
YUMPU automatically turns print PDFs into web optimized ePapers that Google loves.
Stein Tore Johansen<br />
SINTEF Materials Technology<br />
Department of Process Metallurgy and Ceramics,<br />
Fluid Flow Technology<br />
Trondheim , Norway<br />
http://www.sintef.no/<strong>flow</strong>tech<br />
Email: Stein.T.Johansen@matek.sintef.no<br />
<br />
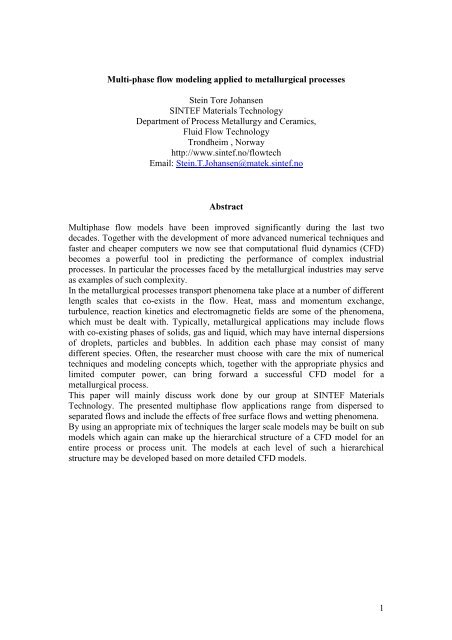
<strong>Multi</strong><strong>phase</strong> <strong>flow</strong> models have been improved significantly during the last two<br />
decades. Together with the development of more advanced numerical techniques and<br />
faster and cheaper computers we now see that computational fluid dynamics (CFD)<br />
becomes a powerful <strong>to</strong>ol in predicting the performance of complex industrial<br />
<strong>processes</strong>. In particular the <strong>processes</strong> faced by the <strong>metallurgical</strong> industries may serve<br />
as examples of such complexity.<br />
In the <strong>metallurgical</strong> <strong>processes</strong> transport phenomena take place at a number of different<br />
length scales that co-exists in the <strong>flow</strong>. Heat, mass and momentum exchange,<br />
turbulence, reaction kinetics and electromagnetic fields are some of the phenomena,<br />
which must be dealt with. Typically, <strong>metallurgical</strong> applications may include <strong>flow</strong>s<br />
with co-existing <strong>phase</strong>s of solids, gas and liquid, which may have internal dispersions<br />
of droplets, particles and bubbles. In addition each <strong>phase</strong> may consist of many<br />
different species. Often, the researcher must choose with care the mix of numerical<br />
techniques and <strong>modeling</strong> concepts which, <strong>to</strong>gether with the appropriate physics and<br />
limited computer power, can bring forward a successful CFD model for a<br />
<strong>metallurgical</strong> process.<br />
This paper will mainly discuss work done by our group at SINTEF Materials<br />
Technology. The presented multi<strong>phase</strong> <strong>flow</strong> applications range from dispersed <strong>to</strong><br />
separated <strong>flow</strong>s and include the effects of free surface <strong>flow</strong>s and wetting phenomena.<br />
By using an appropriate mix of techniques the larger scale models may be built on sub<br />
models which again can make up the hierarchical structure of a CFD model for an<br />
entire process or process unit. The models at each level of such a hierarchical<br />
structure may be developed based on more detailed CFD models.<br />
1
<strong>Multi</strong><strong>phase</strong> <strong>flow</strong> phenomena are frequently observed in the various <strong>metallurgical</strong><br />
<strong>processes</strong>. In all process steps, starting from breaking of ore, processing of minerals,<br />
transportation and s<strong>to</strong>rage of minerals, feeding furnaces and in the pyro-<strong>metallurgical</strong><br />
or electrochemical process we find that multi<strong>phase</strong> <strong>flow</strong> often phenomena play a<br />
dominating role. After the raw metal has been produced the metal is tapped, alloyed <strong>to</strong><br />
the required composition, slag is separated from metal, solid inclusions are removed,<br />
metal is refined by gas injection or bubbling and finally the metal is solidified. Even<br />
the latter steps consist of complex multi<strong>phase</strong> <strong>flow</strong> phenomena. The complexity of<br />
these <strong>processes</strong> can in some situations be extreme due <strong>to</strong> electromagnetic fields, high<br />
temperatures and heterogeneous chemical reactions.<br />
Situations that involve simultaneously both dispersed <strong>flow</strong>s and interface dynamics<br />
are for example found in aluminum reduction cells with anodic bubble formation and<br />
metal-bath interfacial waves, in the hearth of blast furnaces and electric arc furnaces<br />
and in metal refining units where gas bubble injection and entrainment of air and slag<br />
is a well known phenomena.<br />
At present there are no models that can deal with such combined effects<br />
and this is a good challenge for further development. However, <strong>modeling</strong><br />
techniques may be combined sequentially. This was done by Laux et al. [22],<br />
who used a free surface model <strong>to</strong> compute the entrainment of gas from a tapping jet<br />
plunging in<strong>to</strong> a 305 <strong>to</strong>n ladle. By combining the entrainment rate, predicted from the<br />
surface dynamics model, with a two fluid dispersed model modifications of the <strong>flow</strong><br />
field due <strong>to</strong> gas entrainment could be studied.<br />
The paper will show applications of dispersed <strong>flow</strong> models and demonstrate how free<br />
interface dynamics can be used <strong>to</strong> study <strong>processes</strong> like metal tapping, filling of metal<br />
in<strong>to</strong> moulds and breakup of falling jets in granulation of metals and slags.<br />
An ambition with the paper is <strong>to</strong> demonstrate how we can use Computational Fluid<br />
Dynamics (CFD) <strong>to</strong> simulate phenomena on different scales, and give some ideas<br />
about how this can be use <strong>to</strong> assemble models on a larger but coarser level.<br />
<br />
The <strong>modeling</strong> concepts used by the Flow Technology group at SINTEF Materials<br />
Technology are based on the application of New<strong>to</strong>n’s second law <strong>to</strong> all materials in<br />
question. In particular, each fluid is described by the well-known conservation<br />
equations for mass and momentum, expressing mass conservation by;<br />
∂<br />
∂<br />
∂<br />
( ) + ( ρ ) = 0<br />
ρ<br />
I<br />
I M<br />
(1)<br />
∂<br />
M<br />
and fluid momentum conservation by;<br />
∂<br />
∂<br />
∂<br />
∂ ∂<br />
( ρ<br />
IL) + ( ρ<br />
I M<br />
L) = − + τ<br />
ML<br />
+ ρ<br />
I<br />
L<br />
∂<br />
M<br />
∂<br />
L<br />
∂<br />
M<br />
(2)<br />
2
where ρ<br />
I<br />
is fluid density, U f is fluid velocity, p is fluid pressure, g is the specific<br />
gravity and τ LM<br />
is the fluid stress tensor. When the fluid stress tensorτ LM<br />
is known, such<br />
as for a New<strong>to</strong>nian fluid, the single-<strong>phase</strong> <strong>flow</strong> can be predicted by numerical solution<br />
of (1) and (2).<br />
<br />
Extension <strong>to</strong> multi<strong>phase</strong> can be done in several ways. Let us first consider a situation<br />
when particulates (solid particles, bubbles or droplets) are dispersed in a fluid. The<br />
carrier fluid is here described by the Eulerian representation, given by the equations<br />
(1) and (2). The particle <strong>phase</strong> can now be introduced as a continuous field that can<br />
penetrate the carrier fluid. Transport equations for the <strong>phase</strong>s appear from volume<br />
averages of the fluid and particles in a control volume [1]. For a gas-particle system<br />
typical transport equations that appear are for mass conservation:<br />
∂ ∂<br />
( ρ ) ( )<br />
Iα<br />
I<br />
+ ρ<br />
Iα<br />
I<br />
M<br />
= 0<br />
(3)<br />
∂<br />
∂<br />
M<br />
and for fluid momentum:<br />
∂<br />
∂<br />
∂ ∂<br />
( ρ ) ( )<br />
Iα<br />
I<br />
L<br />
+ ρ<br />
Iα<br />
I M<br />
L<br />
= −α<br />
I<br />
+ α<br />
I<br />
τ<br />
ML<br />
+ ρ<br />
Iα<br />
I<br />
L<br />
+ α<br />
Sβ<br />
( L<br />
−<br />
L<br />
) (4)<br />
∂<br />
∂<br />
M<br />
∂L<br />
∂<br />
M<br />
Here we note that the volume fraction of fluid α<br />
I<br />
and the inter-<strong>phase</strong> friction fac<strong>to</strong>r β<br />
(drag term) appear from the volume averages of (1) and (2).<br />
In case of the particle mass balance we obtain:<br />
∂ ∂<br />
( ρ α ) + ( ρ α ) = 0<br />
(5)<br />
S S<br />
S S M<br />
∂<br />
∂<br />
M<br />
and for particle momentum:<br />
∂<br />
∂<br />
( ρ α ) + ( ρ α )=<br />
S S L<br />
S S M L<br />
∂<br />
∂<br />
M<br />
∂ V ∂ V<br />
∂ ∂<br />
− + τ + ρ α −α<br />
+ α τ + α β ( −<br />
)<br />
(6)<br />
ML S S L S<br />
S ML S L L<br />
∂<br />
∂<br />
∂<br />
∂<br />
L<br />
M<br />
L<br />
M<br />
Here α is the volume fraction of particles. Because of inter-particle collisions and<br />
S<br />
momentum exchange due <strong>to</strong> collisions both the solids pressure V<br />
and the solid<br />
particle internal stress τ V is included in the equations. For more details about the<br />
ML<br />
origin of these equations see Laux [1]. It should be noted that in case of inter<strong>phase</strong><br />
mass transfer and more complex inter<strong>phase</strong> momentum exchange mechanisms, these<br />
equations must be modified. For many <strong>metallurgical</strong> applications chemical species<br />
must be conserved within each <strong>phase</strong>. In addition the averaging procedure must be<br />
performed for the energy equation in order <strong>to</strong> yield volume-averaged equations for<br />
conservation of enthalpy.<br />
The velocities are now averages from small control volumes and are no longer the<br />
instantaneous velocities given in the equations (1) and (2). In a swarm of large<br />
particles the fluid velocity close <strong>to</strong> the particle surface is very different from the<br />
volume-averaged velocity. However, the effects of the local variations will in practice<br />
only affect the inter<strong>phase</strong> transfer terms such as drag and mass transfer.<br />
3
An alternative way <strong>to</strong> include a second <strong>phase</strong> in<strong>to</strong> a model is by using a Lagrangian<br />
description for the dispersed <strong>phase</strong>. In this case particle trajec<strong>to</strong>ries are calculated on a<br />
given <strong>flow</strong> field. The particle position is advanced in time by the momentum<br />
equation:<br />
d<br />
m<br />
p<br />
Vi<br />
= mp + k <br />
L i<br />
+ H[W .,<br />
(7)<br />
L<br />
dt<br />
where V i is particle velocity, is particle mass, k<br />
S<br />
i is the forces caused by the<br />
surrounding fluid and <br />
H[W., is the external body forces (not gravity). The particle<br />
L<br />
position X i is calculated from:<br />
d<br />
X i<br />
= V i<br />
(8)<br />
dt<br />
By using the "Particle Source in Cell" concept due <strong>to</strong> Crowe [2] the influence of<br />
particles on the fluid’s momentum can be calculated. The Lagrangian treatment of<br />
particles can be extended <strong>to</strong> deal with particle-particle interactions by the so-called<br />
Discrete Element Method (DEM) [3]. Sawley and Cleary [4] used this method <strong>to</strong><br />
study the particle <strong>flow</strong> and inter-particle impacts in a high intensity grinding mill. See<br />
figure 1.<br />
Figure 1. From a simulation of particle milling using the Discrete Element Method<br />
(DEM) [4]. All individual particles are represented by the method.<br />
<br />
When large regions of separated fluids coexist, the methods described above are hard<br />
<strong>to</strong> adopt. In this case it is possible <strong>to</strong> track the positions of the interfaces with<br />
appropriate methods and solve a single-<strong>phase</strong> momentum equation for the entire <strong>flow</strong><br />
domain [6]. In such models the interface is a transition region where density and<br />
viscosity change abruptly over typically one single computational cell. The effects of<br />
surface tension and wetting [6] can be treated using continuous fields, associated with<br />
the interface itself. We use the method described in reference [5] <strong>to</strong> investigate free<br />
surface <strong>flow</strong> phenomena.<br />
Wetting has recently been added <strong>to</strong> our separated <strong>flow</strong> model. At present only three<br />
wetting regimes can be reproduced. These regimes are: i) No wetting, ii) 90 º wetting<br />
angle and iii) Complete wetting. Numerically these regimes are represented by setting<br />
4
the interface normal vec<strong>to</strong>r at the walls. In the case of a gas liquid system with no<br />
wetting, i), it is assumed that there is a microscopic gas film covering the wall when<br />
liquid contacts the wall. In the full wetting case, iii), it is assumed that all walls have a<br />
thin film of liquid. The 90º contact angle is represented by the interface normal vec<strong>to</strong>r<br />
that always is tangential <strong>to</strong> the wall.<br />
We investigated the full wetting implementation on an initially cylindrically shaped<br />
droplet of water, with equivalent diameter 9.08 mm, that was placed inside a cylinder<br />
of 10 mm of height and 20 mm of diameter. The grid consisted of 40 cells in both the<br />
axial and radial direction.<br />
Predicted interface shapes are shown in the figures 2 and 3. It is interesting <strong>to</strong> note the<br />
apparent wetting angle observed in figure 2. The Youngs contact angle imposed on<br />
the system is 180º. However, the apparent contact angle is here a result of gravity and<br />
surface tension. This tells us that:<br />
i) The contact angle cannot be read from experiments like figure 2 without careful<br />
analyses.<br />
ii) Numerical methods that tend <strong>to</strong> enforce a given contact angle on the interface are<br />
bound <strong>to</strong> fail. This has until recently been a popular method.<br />
Figure 2. Non wetted walls: Predicted<br />
equlibrium shape of 9 mm diameter<br />
water droplet.<br />
Figure 3. Fully wetted walls: Predicted<br />
interface shape of 9 mm water droplet at<br />
time t=0.30 sec.<br />
<br />
In most industrial <strong>flow</strong> situations the <strong>flow</strong> is turbulent. Therefore the model equations<br />
(3) <strong>to</strong> (6) must be time averaged or ensemble averaged. By using mass weighted<br />
ensemble averages for velocity, as demonstrated in Laux [1], phenomena like<br />
turbulent dispersion can be treated rigorously. The turbulence models are multi<strong>phase</strong><br />
adoptions of the well-known k-ε model concept. In the case of dense particle<br />
suspensions we need <strong>to</strong> add model equations for the particle <strong>phase</strong> turbulent energy<br />
and dissipation rate [1].<br />
When Lagrangian methods are <strong>applied</strong> for the dispersed <strong>phase</strong>, turbulent dispersion of<br />
particles are simulated by imposing random generated turbulent velocities [7].<br />
In dynamic simulations like free surface <strong>flow</strong>s, turbulence is most often treated by a<br />
sub-grid Large Eddy turbulence model, such as the Smagorinski model [8].<br />
All these models need appropriate boundary conditions in order <strong>to</strong> achieve a high<br />
quality of the predictions. The most successful boundary conditions are the wall laws<br />
[7] which try <strong>to</strong> express wall fluxes as analytic expressions without solving<br />
numerically for the details in the <strong>flow</strong> boundary layers.<br />
5
In order <strong>to</strong> deal with the various multi<strong>phase</strong> <strong>flow</strong> phenomena related <strong>to</strong> the<br />
<strong>metallurgical</strong> industry a mixture of techniques may often be an advantage. In order <strong>to</strong><br />
have a flexible <strong>to</strong>ol <strong>to</strong> simulate the various phenomena we use the commercial<br />
FLUENT TM Code, which in some situations have been modified in source code or by<br />
using User Defined Subroutines (UDF).<br />
<br />
In most <strong>metallurgical</strong> applications models must treat phenomena at a large number of<br />
different scales simultaneously. A typical example is a Silicon furnace, as seen in<br />
figure 4. Here the geometrical scales of the system range from micrometers (pores in<br />
carbon materials), <strong>to</strong> centimeters (quarts and iron pellets), further <strong>to</strong> meters (electrode<br />
diameter) and finally <strong>to</strong> the full diameter of the furnace that may be typically 10 m. In<br />
practical calculations the phenomena that take place on scales below, say 10 cm, must<br />
be modeled and cannot be predicted directly.<br />
SiO condensates<br />
Expansion of<br />
the cavity<br />
Electrodes<br />
à *5$18/$5à )/2:<br />
2)Ã 7+(Ã &+$5*(<br />
72:$5'6Ã7+(Ã&$9,7<<br />
SiO,CO<br />
Charge surface<br />
à *$6à )/2:<br />
7+528*+<br />
7+(Ã&+$5*(<br />
à *$6à )/2:<br />
)520Ã 7+(<br />
7$33,1*Ã+2/(<br />
SiO 2 , CO 2<br />
Metal pool<br />
SiO, CO<br />
(Tapping)<br />
Figure 4 Principal sketch of a Ferro Silicon furnace [9]. The raw materials are fed on<br />
the charge surface and <strong>flow</strong> slow down <strong>to</strong> the reaction zone (cavity area).<br />
In order <strong>to</strong> model these sub-grid phenomena the <strong>flow</strong> of gas or liquid slag through a<br />
packed bed can be studied by single <strong>flow</strong> simulations as indicated in figure 5. From<br />
this type of simulation the pressure drop can be predicted and correlations regarding<br />
the permeability may be obtained for each particular system. Hence, the inter-<strong>phase</strong><br />
friction fac<strong>to</strong>r β in equation (4) may be obtained even if experimental data is not<br />
available.<br />
6
Figure 5. To the left a digitized image of a sample of packed solid raw materials. The<br />
right hand picture shows the predicted fluid <strong>flow</strong> passing through such a bed.<br />
We can now use the equations (3) and (4) <strong>to</strong> predict the <strong>flow</strong> of gas out<br />
from the reaction zone of a Ferro Silicon furnace. A resulting <strong>flow</strong> field of<br />
the mainly vertical gas <strong>flow</strong> is seen in figure 6. In this case the bed of solid<br />
raw materials is stagnant. The horizontal cross-section is slightly above<br />
the tip of the electrodes, as seen in figure 4. Note that, with the actual<br />
permeability for the packed bed of raw materials, the gas <strong>flow</strong> is<br />
concentrated in between the electrodes.<br />
Figure 6. The velocity distribution of CO-gas up from the bot<strong>to</strong>m of a FeSi furnace<br />
[10].<br />
By using the granular <strong>flow</strong> concept, illustrated by the equations (3)-(6), it is possible<br />
<strong>to</strong> study the <strong>flow</strong> of raw materials and gas released from the process in a two-<strong>phase</strong><br />
simulation. In figure 7 we see the prediction of the charge surface and the velocities of<br />
raw materials and process gas. In this case the simulation is simplified <strong>to</strong> a 2D axisymmetrical<br />
geometry with only one electrode involved. It is assumed that there is no<br />
7
shear stress from the raw materials on the electrode. The result is in good qualitative<br />
agreement with observation of charge movements during furnace operation [11].<br />
Electrode<br />
Gas<br />
Gas<br />
Solids<br />
Electrode<br />
Solids<br />
Figure 7. Simulation of <strong>flow</strong> in FeSi-furnace using the granular <strong>flow</strong> model [1]. In the<br />
middle we se the electrode. Initially, in the computation, the bed of particles is flat<br />
after charging. Both figures show the volume fraction of solid materials after a given<br />
time. To the left we se velocity vec<strong>to</strong>rs for the solids. To the right the velocity vec<strong>to</strong>rs<br />
for the gas is displayed.<br />
<br />
As indicated in Figure 4 above, metal is tapped from holes in the side of these<br />
furnaces, typically ranging from 10 <strong>to</strong> 40 MW of electric power. The pool of metal<br />
indicated in Figure 4 may typically contain up <strong>to</strong> 40 <strong>to</strong>ns of ferro-alloy. In the side of<br />
the furnace a hole is maintained that is opened at regular intervals. The mouth of this<br />
hole is planned <strong>to</strong> be well below the metal surface. However, immediately after<br />
opening, large amounts of combustible SiO-gas often escape from the furnace, mainly<br />
because of the large internal pressure caused by the reactions of the process itself.<br />
Flames from these “blow-outs” are a potential risk for the opera<strong>to</strong>rs and lead <strong>to</strong><br />
pollution of the working environment. By using a free surface <strong>flow</strong> model [5] we can<br />
explain the phenomenon in a simple manner.<br />
<br />
b)<br />
<br />
d)<br />
Figure 8. The figure shows a tapping sequence in a ferro-alloy furnace. The refrac<strong>to</strong>ry<br />
walls are colored grey. Initial metal pad depth is 30 cm. a) Initial configuration, b)<br />
Tapping is started, c) First break-through of process gas and d) Strongly reduced<br />
metal <strong>flow</strong>rate.<br />
8
In Figure 8 a porous region, resembling observed regions of porous sludge, is placed<br />
inside the furnace. This porous region is in the model blocking the direct access of<br />
metal <strong>to</strong> the tapping hole. In this case the metal close <strong>to</strong> the tapping hole is rapidly<br />
drained out and process gas will escape <strong>to</strong>gether with metal during the complete<br />
tapping period. In order <strong>to</strong> improve the situation it is important <strong>to</strong> find methods <strong>to</strong><br />
prevent formation of the low permeability sludge region inside the metal pool.<br />
<br />
During tapping of steel from a steel converter <strong>to</strong> a ladle the fall height of the free steel<br />
jet may be more than 10 m, with a typical jet diameter of 10 cm. Two phenomena are<br />
of particular interest: i) nitrogen entrained by the plunging jet in<strong>to</strong> the ladle may<br />
deteriorate the steel quality, and ii) entrained gas may influence the <strong>flow</strong> pattern in the<br />
ladle significantly and thereby effect the dissolution and mixing of alloy elements.<br />
Figure 9a). Steel jet, plunging in<strong>to</strong> a<br />
ladle at 40 % filling [21]. First bubbles<br />
arrive at the ladle bot<strong>to</strong>m.<br />
Figure 9b) Steel jet, plunging in<strong>to</strong> a<br />
ladle at 40 % filling [21]. Surface<br />
entrainment is initiated.<br />
In figure 9 we see the predicted gas entrainment in a 2D axisymmetric simulation.<br />
The <strong>flow</strong> is not well resolved and the bubbles are numerically diffused by the<br />
numerical technique [5]. However, the predicted entrainment <strong>flow</strong>rates are<br />
comparable <strong>to</strong> results from experimental correlations [12]. In order <strong>to</strong> predict the<br />
effect of gas entrainment on the dissolution rate of alloy materials we use an Eulerian<br />
description of the bubble <strong>phase</strong> [12], where the bubble size is predicted from a<br />
transport model [14]. The gas entrainment rate predicted by the free surface model, as<br />
seen in figure 9, is here used as a boundary condition. Using a Lagrangian description<br />
of the alloy particles [13], the effect of entrained gas on <strong>flow</strong> pattern and alloy particle<br />
dissolution have been studied [12].<br />
In figure 10 we see the predicted bubbles sizes (background color) and the liquid steel<br />
streamlines [12]. Inside the jet region the predicted bubble sizes are typically below 5<br />
mm in diameter. We see that the tapping jet penetrates <strong>to</strong> the bot<strong>to</strong>m of the ladle and<br />
rises up along the sidewall. However, close <strong>to</strong> the jet boundary the presence of<br />
bubbles supplies sufficient buoyancy <strong>to</strong> turn the direction of the <strong>flow</strong>. Accordingly,<br />
the entrainment of gas leads <strong>to</strong> an outward <strong>flow</strong> in the surface. This surface <strong>flow</strong><br />
direction is opposite of what is the case when gas entrainment is not present.<br />
9
Figure 10. The figure displays the predicted average bubble diameter distribution as<br />
well as the <strong>flow</strong> streamlines [12]. The <strong>modeling</strong> technique is the dispersed <strong>flow</strong><br />
Eulerian description. Note that <strong>flow</strong> direction is parallel <strong>to</strong> the streamlines. The blue<br />
arrows indicate the plunging jet seen in figure 9.<br />
<br />
During the process of transferring a liquid metal <strong>to</strong> some solid state, metal must often<br />
be filled in<strong>to</strong> some die or mould. During the filling process the evolvement of gas<br />
pockets that may lead <strong>to</strong> porosities is of great interest. Phenomena related <strong>to</strong> wetting<br />
of the mould are also of primary interest. In figure 11 we see a liquid jet of water with<br />
diameter 4.4 mm and vertical velocity 3.0 m/s. The jet enters centrally at the <strong>to</strong>p, hits<br />
the mould and spreads radially outwards in a thin film of approximately 200 µ of<br />
thickness. The height of the domain is 10 mm and the gas wets the substrate<br />
completely. We see that a hydraulic jump is produced, initially due <strong>to</strong> the surface<br />
tension of the water. Figure 12 shows a close up of the <strong>flow</strong> inside the hydraulic jump.<br />
It is interesting <strong>to</strong> note that the <strong>flow</strong> separates inside the jump, contrary <strong>to</strong> current<br />
understanding of the phenomenon.<br />
Figure 11. A liquid jet of water spreads on a non-wetted substrate.<br />
10
Figure 12. The <strong>flow</strong> inside the hydraulic jump seen in figure 11.<br />
When a liquid metal is poured on<strong>to</strong> a plate like seen in figure 11, we have a typical<br />
casting situation for some <strong>metallurgical</strong> products. However, by repeating the<br />
simulation above for liquid aluminum, it was found that the metal would not spread<br />
like seen in figure 11. The metal will first collect in a metal balloon until the volume<br />
of the balloon is sufficiently large <strong>to</strong> start spreading. This phenomenon disappears at<br />
sufficiently large initial velocities and <strong>flow</strong>-rates.<br />
Another challenging phenomenon is the breakup of liquid metal jets in water. By<br />
pouring liquid metal in<strong>to</strong> water the jet breaks up and forms droplets that solidify as<br />
granules. This is <strong>to</strong>day a popular method for casting ferro-alloys.<br />
Figure 13. Snapshots of cylinder-symmetrical isothermal predictions of the shape of a<br />
jet of liquid metal plunging in<strong>to</strong> water. The initial jet diameter is 16 mm, and the<br />
length of the vessel is 500 mm. To the left: Initial velocity is 1.0 m/s. To the right:<br />
Initial jet velocity is 4.0 m/s.<br />
11
The granulation of liquid metals is a complex phenomenon as it involves a large<br />
number of phenomena. When the liquid metal is pored in<strong>to</strong> water, breakup of the<br />
metal jet is initiated, as predicted in figure 13. At the same time vapor evolves on the<br />
metal surface, effecting the heat transfer and solidification, effecting the surface<br />
dynamics that controls droplet breakup. In worst cases powerful and damaging<br />
explosions may occur that may lead <strong>to</strong> severe injuries of plant personnel.<br />
In the snapshots from the iso-thermal simulations seen in Figure 13 we see that fast jet<br />
<strong>to</strong> the right seems <strong>to</strong> break up faster than the slower left jet. Both jets are perturbed by<br />
the same initial instability wavelength. However, it is evident that the fast jet that<br />
experience more shear force from the surrounding liquid is more unstable. Note that<br />
the main breakup mechanism is the shedding of <strong>to</strong>roidal structures away from the jet.<br />
These structures form individual droplets by capillary breakup in the circumferential<br />
direction. After individual droplet formation these droplets are expected <strong>to</strong> fall down<br />
as “rain” surrounding the incoming jet. In order <strong>to</strong> capture these phenomena the<br />
simulations must be repeated in full 3D.<br />
<br />
In aluminum electrolyses the process gas developed at the anodes forms bubbles that<br />
escape at regular intervals. If the bot<strong>to</strong>m surface of the anodes are slightly deviating<br />
from the horizontal the bubble will slide easily along the anode surface. Such bubbles<br />
have been simulated by Rudman [15]. We have used Langrangian techniques <strong>to</strong> study<br />
bubble movement and convection, heat and mass transfer controlled by these bubbles<br />
([16],[17]). However, it is not known what will happen in industrial operation if the<br />
anodes are completely horizontal [18]. In the cylinder symmetrical simulations shown<br />
in figure 14, the anode is completely wetted by the liquid. The anode diameter is 30<br />
cm and the liquid is cryolite.<br />
Figure 14 a) Gas release from wetted<br />
anode.<br />
Figure 14 b) Released gas bubble,<br />
drifting away from anode surface.<br />
Figure 15 a) Gas release from non-wetted<br />
anode.<br />
Figure 15 b) Released gas bubble, sliding<br />
along the surface of the non-wetted<br />
anode.<br />
12
When the bubbles detach from the anode surface most of the gas is drained away from<br />
the surface, leaving a surface with good electric contact <strong>to</strong> the liquid. It is interesting<br />
<strong>to</strong> note that the bubble shapes create sufficient lift <strong>to</strong> move the bubbles well away<br />
from the side of the anode.<br />
However, on the contrary, if the gas wets the anode the behavior is completely<br />
changed, as seen in Figure 15. Now the gas sticks <strong>to</strong> the anode and forms a more or<br />
less permanent gas sheet that increases the electrical resistance between anode and<br />
liquid considerably. This is in good agreement with the current understanding of the<br />
anode effect. During the anode effect the concentration of dissolved alumina becomes<br />
sufficiently low <strong>to</strong> produce poor wetting of the anode, leading <strong>to</strong> a high electric<br />
resistance and strong ohmic heating. Note that the bubbles now slide along the anode<br />
surface and are not able <strong>to</strong> detach from the anode.<br />
<br />
By starting out from single <strong>phase</strong> <strong>flow</strong> <strong>modeling</strong> it is possible <strong>to</strong> build more complex<br />
multi-field and multi<strong>phase</strong> models. These models can be used <strong>to</strong> study complex<br />
<strong>metallurgical</strong> systems with bubble break up and fragmentation as well as chemical<br />
reactions and <strong>phase</strong> transitions with heat and mass transfer.<br />
It has further been demonstrated that also free surface <strong>modeling</strong> techniques can be<br />
used <strong>to</strong> explain a number of industrial problems. The number of possible industrial<br />
applications for such techniques is large.<br />
The free surface techniques have a large potential in simulating detailed <strong>flow</strong><br />
phenomena. Results from such simulations can be used <strong>to</strong> develop sub-models for<br />
studies of phenomena at larger scales. These submodels will then be used in Eulerian<br />
multi-field models that has the potential <strong>to</strong> describe very complex systems without<br />
<strong>modeling</strong> every detail directly. These macro level models will be statistically<br />
averaged, but may even so be a powerful <strong>to</strong>ol in improving and designing industrial<br />
<strong>processes</strong>.<br />
Experimental verifications at all levels are crucial for predictive CFD models. Better<br />
experimental techniques for validation of CFD models for <strong>metallurgical</strong> applications<br />
will be one important corners<strong>to</strong>ne in the future development of this field.<br />
<br />
The Research Council of Norway is acknowledged for supporting general<br />
development in this field under the program CARPET (www.carpet.ntnu.no), project<br />
140527/420. My colleague Harald Laux is acknowledged for proofreading the<br />
manuscript.<br />
<br />
[1] H. Laux, “Modeling of dilute and dense dispersed fluid-particle two-<strong>phase</strong> <strong>flow</strong>”<br />
(Ph.D. thesis 1998:71, Norwegian University of Science and Technology, 1998).<br />
[2] 4. C.T. Crowe, M.P. Sharma and D.E. S<strong>to</strong>ck, "The particle source in Cell (PSI-<br />
Cell) model for gas-droplet <strong>flow</strong>s", J. Fluids Engr. ,99 (1977) 235<br />
[3] Stein Tore Johansen and Harald Laux “Simulations of Granular Materials<br />
Flows”, Proceedings of RELPOWFLO III , Proceedings of the International<br />
13
Symposium on the Reliable Flow of Particulate Solids, 11-13 August 1999, Telemark<br />
College, Porsgrunn, Norway, 1999, 11 pages<br />
[4] M. L.Sawley,P.W.Cleary,” A parallel discrete element method for industrial<br />
granular <strong>flow</strong> simulations”, EPFL Supercomputing Review, Nov. 1999, p 23-29<br />
[5] S. T. Johansen, ”Large scale simulation of separated multi<strong>phase</strong> <strong>flow</strong>s”<br />
Proceedings of Third International Conference on <strong>Multi</strong><strong>phase</strong> Flows, ICMF’ 98 (on<br />
CD-ROM), Lyon, France, June 8-12, 1998<br />
[6] S.T. Johansen, ” <strong>Multi</strong><strong>phase</strong> <strong>flow</strong> <strong>modeling</strong> of <strong>metallurgical</strong> <strong>flow</strong>s”, Proceedings<br />
of the 4 th International Conference on <strong>Multi</strong><strong>phase</strong> Flow, ICMF’2001, New Orleans,<br />
LA, U.S.A., May 27-June 1, 2001, CD-rom, Paper 204<br />
[7] S.T. Johansen, "On the modelling of turbulent two-<strong>phase</strong> <strong>flow</strong>s", Dr.Techn.-thesis,<br />
The Norwegian Institute of Technology, Trondheim, 1990<br />
[8] J. Smagorinsky, “General circulation experiments with the primitive equations:<br />
Part I. The basic experiment”, Mon. Weather Rev., 91, 1963, pp. 99-164<br />
[9] B. Ravary , “Beregninger av strømning i chargen og ovnsrom”, FFF-seminar, 25.<br />
& 26. Ok<strong>to</strong>ber 2000, Kristiansand<br />
[10] B. Ravary and J.-C. Laclau, “Modelling of the charge <strong>flow</strong> around the electrode,<br />
the gas <strong>flow</strong> in the charge and out of the taphole in FeSi furnaces”, SINTEF Report<br />
STF24 F99626<br />
[11] A. Skei, J. Kr. Tuset and H. Tveit, Production of High Silicon Alloys, Tapir<br />
Forlag, Trondheim, 1998<br />
[12] H. Laux, S. T. Johansen, H. Berg and O.-S. Klevan, "Gas-induced motion in<br />
<strong>metallurgical</strong> ladles due <strong>to</strong> gas-entrainment during tapping of steel furnaces", SINTEF<br />
Report STF24 A01605<br />
[13] H. Berg, H. Laux, S. T. Johansen and O.S. Klevan “ Flow pattern and alloy<br />
dissolution during tapping of steel furnaces”, Ironmaking & Steelmaking, 1999, 26,<br />
pp. 127–139<br />
[14] H. Laux and S.T. Johansen , “A CFD Analysis of the Air Entrainment Rate Due<br />
<strong>to</strong> a Plunging Steel Jet Combining Mathematical Models for Dispersed and Separated<br />
<strong>Multi</strong><strong>phase</strong> Flows “, Fluid Flow Phenomena in Metals Processing, Edited by N. El-<br />
Kaddah et al., TMS, 1999, pp. 21-30<br />
[15] M.J. Rudman,A volume-tracking method for incompressible multifluid <strong>flow</strong>s<br />
with large density variations. . . . 28, 1998, pp. 357–378<br />
[16] A. Solheim, S.T. Johansen, S. Rolseth, J. Thonstad. "Gas Driven Flow in Hall-<br />
Heroult Cells". Light Metals, TMS, 1989, pp. 245-252.<br />
[17] T. Haarberg, A. Solheim, S.T. Johansen "Effect of anodic gas release on current<br />
efficiency in Hall-Héroult celles" Light Metals, Edited by Barry Welch , TMS, 1998,<br />
pp. 475-481.<br />
[18] R. Shekar, J. W. Evans. "Physical Modeling Studies of Electrolyte Flow due <strong>to</strong><br />
Gas Evolution and Some Aspects of Bubble Behavior in Advanced Hall Cells: Part I.<br />
Flow in Cells with a Flat Anode".Met. Trans. B, 25B, pp. 333-340.<br />
[19] H. Laux, K.H. Bech, L.R. Hellevik and S.T. Johansen (2001) "CFD <strong>modeling</strong> of<br />
bubble-driven <strong>flow</strong>", in Proceedings of MekIT'01, Trondheim 3-4 May 2001, pp.279-<br />
300, and is accepted for publication in International Journal of Applied Mechanics in<br />
Engineering (IJAME), Vol 17, No. 1, 2001<br />
[20] H. Laux and S.T. Johansen, ”Eulerian multi<strong>phase</strong> <strong>modeling</strong> of bubbly <strong>flow</strong> in a<br />
gas-stirred ladle ”, Proceedings of the 4 th International Conference on <strong>Multi</strong><strong>phase</strong><br />
Flow, ICMF’2001 , New Orleans, LA, U.S.A., May 27-June 1, 2001, CD-rom, Paper<br />
203<br />
[21]H. Laux, Private communication, 2001<br />
14
[22]H. Laux, S.T. Johansen, H. Berg, and O.S. Klevan, “CFD analyses of turbulent<br />
<strong>flow</strong> in ladles and the alloying process during tapping of steel furnaces”,<br />
Scandinavian Journal of Metallurgy, 29, 2000, pp. 71-80<br />
15