The Cross-Level Effects of Culture and Climate in Human Service ...
The Cross-Level Effects of Culture and Climate in Human Service ...
The Cross-Level Effects of Culture and Climate in Human Service ...

Create successful ePaper yourself
Turn your PDF publications into a flip-book with our unique Google optimized e-Paper software.
CULTURE AND CLIMATE 777<br />
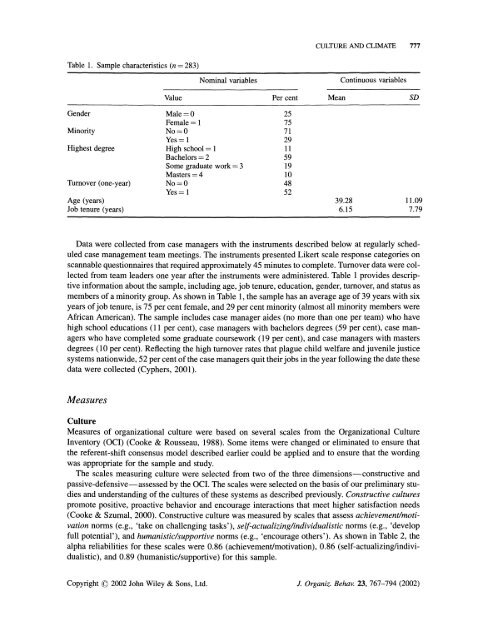
Table 1. Sample characteristics (n = 283)<br />
Nom<strong>in</strong>al variables<br />
Cont<strong>in</strong>uous variables<br />
Value Per cent Mean SD<br />
Gender Male = 0 25<br />
Female = 1 75<br />
M<strong>in</strong>ority No = 0 71<br />
Yes -= 1 29<br />
Highest degree High school= 1 11<br />
Bachelors = 2 59<br />
Some graduate work = 3 19<br />
Masters = 4 10<br />
Turnover (one-year) No = 0 48<br />
Yes =- 1 52<br />
Age (years) 39.28 11.09<br />
Job tenure (years) 6.15 7.79<br />
Data were collected from case managers with the <strong>in</strong>struments described below at regularly scheduled<br />
case management team meet<strong>in</strong>gs. <strong>The</strong> <strong>in</strong>struments presented Likert scale response categories on<br />
scannable questionnaires that required approximately 45 m<strong>in</strong>utes to complete. Turnover data were collected<br />
from team leaders one year after the <strong>in</strong>struments were adm<strong>in</strong>istered. Table 1 provides descriptive<br />
<strong>in</strong>formation about the sample, <strong>in</strong>clud<strong>in</strong>g age, job tenure, education, gender, turnover, <strong>and</strong> status as<br />
members <strong>of</strong> a m<strong>in</strong>ority group. As shown <strong>in</strong> Table 1, the sample has an average age <strong>of</strong> 39 years with six<br />
years <strong>of</strong> job tenure, is 75 per cent female, <strong>and</strong> 29 per cent m<strong>in</strong>ority (almost all m<strong>in</strong>ority members were<br />
African American). <strong>The</strong> sample <strong>in</strong>cludes case manager aides (no more than one per team) who have<br />
high school educations (11 per cent), case managers with bachelors degrees (59 per cent), case managers<br />
who have completed some graduate coursework (19 per cent), <strong>and</strong> case managers with masters<br />
degrees (10 per cent). Reflect<strong>in</strong>g the high turnover rates that plague child welfare <strong>and</strong> juvenile justice<br />
systems nationwide, 52 per cent <strong>of</strong> the case managers quit their jobs <strong>in</strong> the year follow<strong>in</strong>g the date these<br />
data were collected (Cyphers, 2001).<br />
Measures<br />
<strong>Culture</strong><br />
Measures <strong>of</strong> organizational culture were based on several scales from the Organizational <strong>Culture</strong><br />
Inventory (OCI) (Cooke & Rousseau, 1988). Some items were changed or elim<strong>in</strong>ated to ensure that<br />
the referent-shift consensus model described earlier could be applied <strong>and</strong> to ensure that the word<strong>in</strong>g<br />
was appropriate for the sample <strong>and</strong> study.<br />
<strong>The</strong> scales measur<strong>in</strong>g culture were selected from two <strong>of</strong> the three dimensions--constructive <strong>and</strong><br />
passive-defensive--assessed by the OCI. <strong>The</strong> scales were selected on the basis <strong>of</strong> our prelim<strong>in</strong>ary studies<br />
<strong>and</strong> underst<strong>and</strong><strong>in</strong>g <strong>of</strong> the cultures <strong>of</strong> these systems as described previously. Constructive cultures<br />
promote positive, proactive behavior <strong>and</strong> encourage <strong>in</strong>teractions that meet higher satisfaction needs<br />
(Cooke & Szumal, 2000). Constructive culture was measured by scales that assess achievement/motivation<br />
norms (e.g., 'take on challeng<strong>in</strong>g tasks'), self-actualiz<strong>in</strong>g/<strong>in</strong>dividualistic norms (e.g., 'develop<br />
full potential'), <strong>and</strong> humanistic/supportive norms (e.g., 'encourage others'). As shown <strong>in</strong> Table 2, the<br />
alpha reliabilities for these scales were 0.86 (achievement/motivation), 0.86 (self-actualiz<strong>in</strong>g/<strong>in</strong>dividualistic),<br />
<strong>and</strong> 0.89 (humanistic/supportive) for this sample.<br />
Copyright ( 2002 John Wiley & Sons, Ltd. J. Organiz. Behav. 23, 767-794 (2002)