The Cross-Level Effects of Culture and Climate in Human Service ...
The Cross-Level Effects of Culture and Climate in Human Service ...
The Cross-Level Effects of Culture and Climate in Human Service ...

Create successful ePaper yourself
Turn your PDF publications into a flip-book with our unique Google optimized e-Paper software.
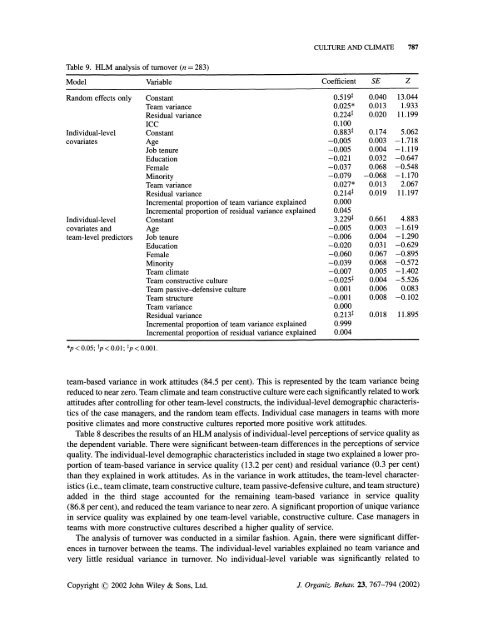
Table 9. HLM analysis <strong>of</strong> turnover (n = 283)<br />
CULTURE AND CLIMATE 787<br />
Model Variable Coefficient SE Z<br />
R<strong>and</strong>om effects only Constant 0.5191 0.040 13.044<br />
Team variance 0.025* 0.013 1.933<br />
Residual variance 0.224t 0.020 11.199<br />
ICC 0.100<br />
Individual-level Constant 0.883t 0.174 5.062<br />
covariates Age -0.005 0.003 -1.718<br />
Job tenure -0.005 0.004 -1.119<br />
Education -0.021 0.032 -0.647<br />
Female -0.037 0.068 -0.548<br />
M<strong>in</strong>ority -0.079 -0.068 -1.170<br />
Team variance 0.027* 0.013 2.067<br />
Residual variance 0.214f 0.019 11.197<br />
Incremental proportion <strong>of</strong> team variance expla<strong>in</strong>ed 0.000<br />
Incremental proportion <strong>of</strong> residual variancexpla<strong>in</strong>ed 0.045<br />
Individual-level Constant 3.229t 0.661 4.883<br />
covariates <strong>and</strong> Age -0.005 0.003 -1.619<br />
team-level predictors Job tenure -0.006 0.004 -1.290<br />
Education -0.020 0.031 -0.629<br />
Female -0.060 0.067 -0.895<br />
M<strong>in</strong>ority -0.039 0.068 -0.572<br />
Team climate -0.007 0.005 -1.402<br />
Team constructive culture -0.025t 0.004 -5.526<br />
Team passive-defensive culture 0.001 0.006 0.083<br />
Team structure -0.001 0.008 -0.102<br />
Team variance 0.000<br />
Residual variance 0.213t 0.018 11.895<br />
Incremental proportion <strong>of</strong> team variance expla<strong>in</strong>ed 0.999<br />
Incremental proportion <strong>of</strong> residual variance expla<strong>in</strong>ed 0.004<br />
*p < 0.05; tp < 0.01; tp < 0.001.<br />
team-based variance <strong>in</strong> work attitudes (84.5 per cent). This is represented by the team variance be<strong>in</strong>g<br />
reduced to near zero. Team climate <strong>and</strong> team constructive culture were each significantly related to work<br />
attitudes after controll<strong>in</strong>g for other team-level constructs, the <strong>in</strong>dividual-level demographic characteristics<br />
<strong>of</strong> the case managers, <strong>and</strong> the r<strong>and</strong>om team effects. Individual case managers <strong>in</strong> teams with more<br />
positive climates <strong>and</strong> more constructive cultures reported more positive work attitudes.<br />
Table 8 describes the results <strong>of</strong> an HLM analysis <strong>of</strong> <strong>in</strong>dividual-level perceptions <strong>of</strong> service quality as<br />
the dependent variable. <strong>The</strong>re were significant between-team differences <strong>in</strong> the perceptions <strong>of</strong> service<br />
quality. <strong>The</strong> <strong>in</strong>dividual-level demographic characteristics <strong>in</strong>cluded <strong>in</strong> stage two expla<strong>in</strong>ed a lower proportion<br />
<strong>of</strong> team-based variance <strong>in</strong> service quality (13.2 per cent) <strong>and</strong> residual variance (0.3 per cent)<br />
than they expla<strong>in</strong>ed <strong>in</strong> work attitudes. As <strong>in</strong> the variance <strong>in</strong> work attitudes, the team-level characteristics<br />
(i.e., team climate, team constructive culture, team passive-defensive culture, <strong>and</strong> team structure)<br />
added <strong>in</strong> the third stage accounted for the rema<strong>in</strong><strong>in</strong>g team-based variance <strong>in</strong> service quality<br />
(86.8 per cent), <strong>and</strong> reduced the team variance to near zero. A significant proportion <strong>of</strong> unique variance<br />
<strong>in</strong> service quality was expla<strong>in</strong>ed by one team-level variable, constructive culture. Case managers <strong>in</strong><br />
teams with more constructive cultures described a higher quality <strong>of</strong> service.<br />
<strong>The</strong> analysis <strong>of</strong> turnover was conducted <strong>in</strong> a similar fashion. Aga<strong>in</strong>, there were significant differences<br />
<strong>in</strong> turnover between the teams. <strong>The</strong> <strong>in</strong>dividual-level variables expla<strong>in</strong>ed no team variance <strong>and</strong><br />
very little residual variance <strong>in</strong> turnover. No <strong>in</strong>dividual-level variable was significantly related to<br />
Copyright ( 2002 John Wiley & Sons, Ltd. J. Organiz. Behav. 23, 767-794 (2002)