SEG - Society of Economic Geologists
SEG - Society of Economic Geologists
SEG - Society of Economic Geologists

You also want an ePaper? Increase the reach of your titles
YUMPU automatically turns print PDFs into web optimized ePapers that Google loves.
12 <strong>SEG</strong> NEWSLETTER No 90 • JULY 2012<br />
... from 1<br />
A Radical Approach to Exploration: Let the Data Speak for Themselves! (Continued)<br />
discovery rate, we need to put more<br />
effort into targeting, or deciding where<br />
to look.<br />
These same 10 to 15 years have seen<br />
a significant growth in the volume <strong>of</strong><br />
accessible exploration data. To stimulate<br />
exploration and mining, regional<br />
and national governments are releasing<br />
non-proprietary data sets, including<br />
geophysics and geochemistry, and compiling<br />
databases <strong>of</strong> known mineral<br />
deposits, such as MINEDEX for Western<br />
Australia or FINGOLD for Finland. This<br />
ever increasing quantity <strong>of</strong> information<br />
is overwhelming to the unaided human<br />
interpreter. In future, conventional<br />
approaches to exploration will be able<br />
to sample only an ever-diminishing<br />
fraction <strong>of</strong> the available information.<br />
Two other relevant developments<br />
have taken place over the same period.<br />
First, the costs <strong>of</strong> storage, transfer, and<br />
processing <strong>of</strong> even very large quantities<br />
<strong>of</strong> data have been reduced to a level at<br />
which they are no longer significant.<br />
Secondly, advances in data mining and<br />
statistical pattern recognition now make<br />
it possible to extract almost all the relevant<br />
information from this wealth <strong>of</strong><br />
data. In sufficiently mature districts,<br />
multivariate correlations between exploration<br />
data and known deposits can be<br />
used to determine the statistical probabilities<br />
<strong>of</strong> similar economic mineral<br />
occurrences at any location in the region.<br />
The targets generated by this<br />
approach are based only on measurable<br />
exploration data. While such data sets<br />
include geology—both lithology and<br />
structure—they do not include geological<br />
accounts <strong>of</strong> the ore genesis process.<br />
The advantage <strong>of</strong> the data mining<br />
approach, however, is that initial targets<br />
are based only on known facts, although<br />
insights into the underlying mineralization<br />
process can still inform later stages<br />
<strong>of</strong> target ranking or screening. A further<br />
advantage <strong>of</strong> the approach is that, in<br />
places where there are good quality data<br />
sets, targets are very tightly defined, and<br />
they can be assigned probabilities, relative<br />
to the available data, from which<br />
numerical estimates <strong>of</strong> expected economic<br />
costs and rewards can be derived.<br />
For example, integrating the probability<br />
field over the target area, with respect<br />
to a monetary measure, provides the<br />
expected value <strong>of</strong> a target, relative to the<br />
available data. Follow-up exploration<br />
costs can be roughly estimated from a<br />
target’s spatial extent. Since targets are<br />
usually no more than a few square kilometers<br />
in area, large expected returns<br />
on investment can be achieved.<br />
To explain how statistical data mining<br />
works in more detail, we now discuss<br />
a particular case study in Western<br />
Australia which serves to illustrate all<br />
aspects <strong>of</strong> the approach.<br />
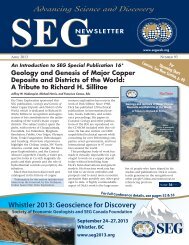
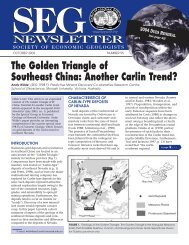
EASTERN GOLDFIELDS NORTH<br />
The Yilgarn craton is so extensive that<br />
we chose to limit this study to an area<br />
that we call the Eastern Goldfields North<br />
(EGN) (see Fig. 1, p. 1). This area falls<br />
between longitudes 120°–123°E and latitudes<br />
25°–30°, and extends 300 km<br />
east-west by 550 km north-south, making<br />
a total <strong>of</strong> 165,000 km 2 (to put this<br />
in perspective, this is roughly equal to<br />
the landmass <strong>of</strong> the country <strong>of</strong> Uruguay<br />
or the state <strong>of</strong> Wisconsin). The choice<br />
<strong>of</strong> this particular area was based on various<br />
factors—notably, the high concentration<br />
<strong>of</strong> known deposits, the availability<br />
<strong>of</strong> modern exploration data sets, and<br />
a stable political environment in which<br />
mineral exploration and mining are<br />
actively encouraged.<br />
We also deliberately chose to exclude<br />
the Super Pit at Kalgoorlie as this deposit<br />
is almost 10 times larger than any other<br />
deposit in the district. This might dominate<br />
the study and overshadow the patterns<br />
<strong>of</strong> some <strong>of</strong> the smaller but still<br />
very significant deposits that occur, and<br />
which remain more likely to be found,<br />
in this mature district. The EGN contains<br />
a known gold endowment <strong>of</strong> 70<br />
Moz and also provides a large collection<br />
<strong>of</strong> modern exploration data sets. These<br />
two critical ingredients make the EGN<br />
an excellent candidate for a successful<br />
data mining study.<br />
The data sets incorporated in this<br />
study were the known gold deposits,<br />
regolith mapping, Landsat TM, SRTM<br />
elevation, digital geology (lithology and<br />
structure), gravity, airborne magnetics<br />
and radiometrics, and biogeochemistry.<br />
The raw material for all these data sets<br />
are in the public domain, so no private<br />
or proprietary corporate data sets were<br />
used for this data mining study.<br />
Geologic setting<br />
The Eastern Goldfields <strong>of</strong> Western<br />
Australia cover an area <strong>of</strong> Archean rocks<br />
which form part <strong>of</strong> the Yilgarn craton<br />
(see Fig. 1). The major deposits are generally<br />
hosted in the greenstone part <strong>of</strong><br />
granite-greenstone terrane, particularly<br />
in linear belts. They occur in areas <strong>of</strong><br />
subgreenschist to granulite facies metamorphism,<br />
although most significant<br />
deposits are in areas <strong>of</strong> greenschist<br />
facies. They occupy diverse structural<br />
settings, but are common near major<br />
regional shear zones, in secondary<br />
faults, and near hinge areas <strong>of</strong> gently<br />
plunging upright antiforms (Cassidy<br />
and Hagemann, 2001).<br />
The regolith<br />
A serious impediment to exploration in<br />
Western Australia is the regolith, a layer<br />
<strong>of</strong> weathered rock that covers most <strong>of</strong><br />
the Yilgarn and in particular the EGN<br />
study area. It is derived from the chemical<br />
and physical weathering <strong>of</strong> the<br />
bedrock over many millions <strong>of</strong> years,<br />
and it can vary from zero or only a few<br />
meters to over 150 m thick.<br />
The Geological Survey <strong>of</strong> Western<br />
Australia has produced a seamless<br />
regolith map encompassing the entire<br />
state (Marnham and Morris, 2003).<br />
There are six divisions, ranging from<br />
exposed rock to lacustrine deposits. The<br />
outcrop areas in the EGN amount to<br />
less than 10% <strong>of</strong> the surface area, so<br />
there is little direct geological evidence<br />
<strong>of</strong> the bedrock. However, where the<br />
soils appear to be residual rather than<br />
widely transported, it is possible to use<br />
careful and selective geochemical methods,<br />
as we shall see below, to detect<br />
mineralization beneath the regolith.<br />
Eastern<br />
Goldfields<br />
North<br />
Solid<br />
Geology<br />
Subcrop geology<br />
interpreted largely<br />
from geophysics<br />
and Landsat data.<br />
Map published by<br />
Liu et al., 2000,<br />
Geoscience<br />
Australia<br />
100 km<br />
100 km<br />
FIGURE 2. Interpreted solid geology (refer to<br />
Fig. 1; inset).