Converging gender roles Katherine Marshall
Converging gender roles Katherine Marshall
Converging gender roles Katherine Marshall

You also want an ePaper? Increase the reach of your titles
YUMPU automatically turns print PDFs into web optimized ePapers that Google loves.
<strong>Converging</strong> <strong>gender</strong> <strong>roles</strong><br />
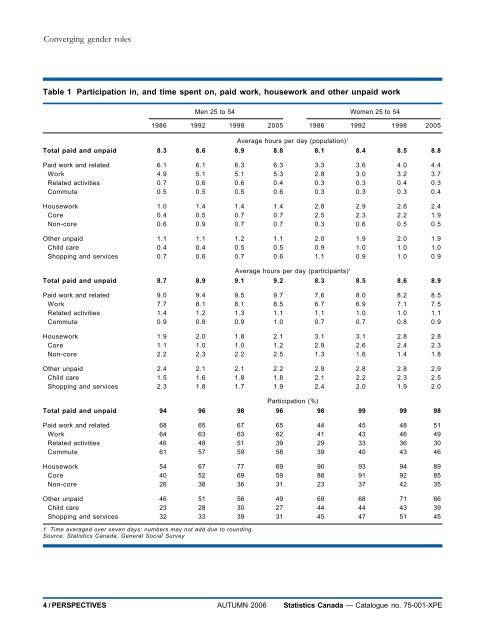
Table 1 Participation in, and time spent on, paid work, housework and other unpaid work<br />
Men 25 to 54 Women 25 to 54<br />
1986 1992 1998 2005 1986 1992 1998 2005<br />
Average hours per day (population) 1<br />
Total paid and unpaid 8.3 8.6 8.9 8.8 8.1 8.4 8.5 8.8<br />
Paid work and related 6.1 6.1 6.3 6.3 3.3 3.6 4.0 4.4<br />
Work 4.9 5.1 5.1 5.3 2.8 3.0 3.2 3.7<br />
Related activities 0.7 0.6 0.6 0.4 0.3 0.3 0.4 0.3<br />
Commute 0.5 0.5 0.5 0.6 0.3 0.3 0.3 0.4<br />
Housework 1.0 1.4 1.4 1.4 2.8 2.9 2.6 2.4<br />
Core 0.4 0.5 0.7 0.7 2.5 2.3 2.2 1.9<br />
Non-core 0.6 0.9 0.7 0.7 0.3 0.6 0.5 0.5<br />
Other unpaid 1.1 1.1 1.2 1.1 2.0 1.9 2.0 1.9<br />
Child care 0.4 0.4 0.5 0.5 0.9 1.0 1.0 1.0<br />
Shopping and services 0.7 0.6 0.7 0.6 1.1 0.9 1.0 0.9<br />
Average hours per day (participants) 1<br />
Total paid and unpaid 8.7 8.9 9.1 9.2 8.3 8.5 8.6 8.9<br />
Paid work and related 9.0 9.4 9.5 9.7 7.6 8.0 8.2 8.5<br />
Work 7.7 8.1 8.1 8.5 6.7 6.9 7.1 7.5<br />
Related activities 1.4 1.2 1.3 1.1 1.1 1.0 1.0 1.1<br />
Commute 0.9 0.8 0.9 1.0 0.7 0.7 0.8 0.9<br />
Housework 1.9 2.0 1.8 2.1 3.1 3.1 2.8 2.8<br />
Core 1.1 1.0 1.0 1.2 2.9 2.6 2.4 2.3<br />
Non-core 2.2 2.3 2.2 2.5 1.3 1.6 1.4 1.8<br />
Other unpaid 2.4 2.1 2.1 2.2 2.9 2.8 2.8 2.9<br />
Child care 1.5 1.6 1.8 1.8 2.1 2.2 2.3 2.5<br />
Shopping and services 2.3 1.8 1.7 1.9 2.4 2.0 1.9 2.0<br />
Participation (%)<br />
Total paid and unpaid 94 96 98 96 98 99 99 98<br />
Paid work and related 68 65 67 65 44 45 48 51<br />
Work 64 63 63 62 41 43 46 49<br />
Related activities 46 48 51 39 29 33 36 30<br />
Commute 61 57 59 58 39 40 43 46<br />
Housework 54 67 77 69 90 93 94 89<br />
Core 40 52 69 59 88 91 92 85<br />
Non-core 26 38 36 31 23 37 42 35<br />
Other unpaid 46 51 56 49 69 68 71 66<br />
Child care 23 28 30 27 44 44 43 39<br />
Shopping and services 32 33 39 31 45 47 51 45<br />
1 Time averaged over seven days; numbers may not add due to rounding.<br />
Source: Statistics Canada, General Social Survey<br />
4 / PERSPECTIVES AUTUMN 2006 Statistics Canada — Catalogue no. 75-001-XPE