Converging gender roles Katherine Marshall
Converging gender roles Katherine Marshall
Converging gender roles Katherine Marshall

Create successful ePaper yourself
Turn your PDF publications into a flip-book with our unique Google optimized e-Paper software.
<strong>Converging</strong> <strong>gender</strong> <strong>roles</strong><br />
<strong>Katherine</strong> <strong>Marshall</strong><br />
Families are the cornerstone of any society. Their<br />
supply of paid labour is vital to the economy, as<br />
is their unpaid labour in raising the next generation.<br />
The dynamics of who does which type of labour<br />
within families continue to change. Women’s expanding<br />
economic role has been the main impetus for eroding<br />
the cultural idea that men should be primarily<br />
responsible for paid work while women look after<br />
unpaid household and family duties. Today’s couples<br />
have a much more equal partnership in the sharing of<br />
financial, child care and household responsibilities.<br />
Understanding the changing division of labour within<br />
families is crucial in developing effective policies.<br />
Employers may be well over the idea that women’s<br />
earnings are simply pin money for the family, but<br />
accepting that men’s work schedules are increasingly<br />
affected by home responsibilities, such as picking up<br />
children from daycare, staying home with a sick child,<br />
or taking parental leave, is relatively new. Changing<br />
workplace practices, such as on-site daycare and flexible<br />
work arrangements, as well as labour legislation<br />
such as parental, maternity and compassionate care<br />
leave confirm that “WLB (work–life balance) has<br />
emerged as a critical public policy issue in Canada”<br />
(HRSDC 2005). The increasing number of dual-earner<br />
families and a heavier overall workload make balancing<br />
a job and home life that much more difficult.<br />
The division of labour within families is also of interest<br />
from a sociological point of view. Women’s<br />
entrenched participation in the labour market was<br />
expected to launch “a revolution in the <strong>gender</strong>ed division<br />
of labor,” but the rate of change has been slow<br />
(Cooke 2004). Tension from multiple daily demands<br />
and a longer workday can arise when ‘second-shift’<br />
duties are discussed and divided. An imbalance in the<br />
division of household labour has been linked to marital<br />
conflict, reduced physical and mental well-being,<br />
and lower wages (Cooke 2004; Coverman 1983).<br />
<strong>Katherine</strong> <strong>Marshall</strong> is with the Labour and Household Surveys<br />
Analysis Division. She can be reached at 613 951-6890 or<br />
katherine.marshall@statcan.ca.<br />
Time-use surveys can illuminate overall trends in the<br />
hours men and women spend on paid work and housework,<br />
as well as on child care and other unpaid household<br />
labour. Time-use diaries permit analysis of the<br />
types of activities done on a daily basis, and for how<br />
long. The study targets those aged 25 to 54 as they are<br />
the most likely to be employed and have dependent<br />
children at home, leaving them challenged for time.<br />
The latter part of the article focuses on the hours of<br />
work, the division of labour, and the well-being of<br />
dual-earner families (see Data sources and definitions).<br />
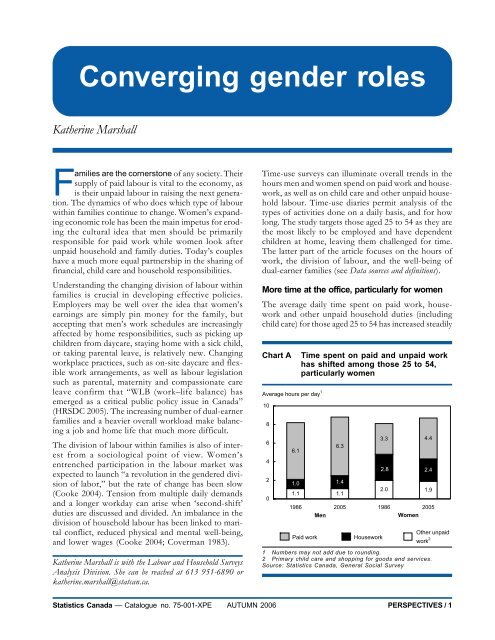
More time at the office, particularly for women<br />
The average daily time spent on paid work, housework<br />
and other unpaid household duties (including<br />
child care) for those aged 25 to 54 has increased steadily<br />
Chart A<br />
Average hours per day 1<br />
10<br />
8<br />
6<br />
4<br />
2<br />
0<br />
6.1<br />
Time spent on paid and unpaid work<br />
has shifted among those 25 to 54,<br />
particularly women<br />
6.3<br />
1.0 1.4<br />
1.1 1.1<br />
3.3 4.4<br />
2.0 1.9<br />
1 Numbers may not add due to rounding.<br />
2 Primary child care and shopping for goods and services.<br />
Source: Statistics Canada, General Social Survey<br />
2.4<br />
1986 2005 1986 2005<br />
Men<br />
Women<br />
Paid work<br />
Housework<br />
2.8<br />
Other unpaid<br />
work 2<br />
Statistics Canada — Catalogue no. 75-001-XPE AUTUMN 2006 PERSPECTIVES / 1
<strong>Converging</strong> <strong>gender</strong> <strong>roles</strong><br />
Data sources and definitions<br />
Every year since 1985, the General Social Survey (GSS)<br />
has interviewed Canadians aged 15 and over living in the<br />
10 provinces on a wide range of social issues. Using a<br />
24-hour diary, the GSS collected detailed information on<br />
time use in four different years using varying sample sizes:<br />
1986 (16,400), 1992 (9,800), 1998 (10,700) and 2005<br />
(19,600). Individual activities were recorded sequentially<br />
throughout the day and subsequently coded to an international<br />
listing. Each day of the week is sampled. Therefore,<br />
calculations are usually averaged over a 7-day period<br />
(see below). While the 1986 survey collected data during<br />
the months of November and December, the remaining<br />
cycles covered a 12-month period. Most time-use surveys<br />
include sections on the perception of time and indicators<br />
of well-being.<br />
The Labour Force Survey (LFS) collects information on<br />
labour market activity every month during a one-week<br />
period from all persons 15 years and over. It includes questions<br />
about the usual and actual weekly hours spent at a<br />
person’s main job and any other job. The LFS participation<br />
rate for a particular group (for example, women aged<br />
25 to 54) is the labour force in that group expressed as<br />
a percentage of the population for that group.<br />
Replacing the Family Expenditure Survey in 1997, the<br />
annual Survey of Household Spending (SHS) collects<br />
data on the expenditures, income and characteristics of<br />
families and individuals living in private households. The<br />
SHS category ‘domestic help’ includes, for example, housekeepers,<br />
cleaners, paid companions and housesitters.<br />
Paid work (time use) includes the work activities of all jobs<br />
or businesses, while related paid activities include looking<br />
for work, delays at work, and coffee breaks. Commute<br />
to work is the total time spent travelling to and from the<br />
workplace. Total paid work covers paid work, related paid<br />
activities, and commuting.<br />
Core housework (time use) includes meal preparation,<br />
meal clean-up, indoor cleaning, and laundry. Core activities<br />
are those that are most likely done on a daily basis<br />
and generally demand the most time. Non-core housework<br />
includes things such as outdoor cleaning, mending<br />
or sewing, interior or exterior maintenance and repair,<br />
gardening, pet and plant care, household paperwork, or<br />
unpacking groceries. Total housework consists of core<br />
and non-core activities.<br />
Primary child care (time use) consists of activities directly<br />
involving children, such as feeding, helping, teaching,<br />
reading to, talking or playing with, medical care, and any<br />
related travel such as taking children to school or driving<br />
them to sports or other activities.<br />
Average time spent on activities (time use) of the population<br />
or a sub-population refers to the total time all<br />
respondents reported spending on a given activity divided<br />
by the population, and averaged over a seven-day week.<br />
The time spent by participants refers to only those who<br />
participated in that activity on diary day, but again averaged<br />
over seven days.<br />
Dual-earners are defined here as married or common-law<br />
couples in which the main activity of both partners in the<br />
previous seven days was ‘employed.’ Both partners had<br />
to be currently living in the same household and not on<br />
vacation from their job during the previous week. Since the<br />
analysis focuses on the division of labour by sex, samesex<br />
couples were excluded.<br />
Total paid work and housework time within couples<br />
is the sum of minutes both partners spent on paid work<br />
and related paid activities, and on core and non-core<br />
housework, on diary day. This calculation uses the 24-hour<br />
diary reporting for the respondent’s time, and the timerelated<br />
questions asked of the respondent for their partner’s<br />
time. For example, if the respondent reported that<br />
their partner worked on diary day, a follow-up question<br />
asked the exact start and end times of all shifts worked<br />
on that day. (Since respondents were not asked to report<br />
any commute time for their partners, commute time for both<br />
partners is excluded from the total paid work calculation.)<br />
Respondents were also asked to estimate the total number<br />
of hours their partner spent on core and non-core housework<br />
in the previous week. Therefore, average daily time<br />
spent on housework by the partner was calculated by<br />
adding the total weekly core and non-core hours, dividing<br />
this amount by 7, and then (based on established<br />
housework activity patterns), multiplying by 0.11 if diary<br />
day was a weekday, and 0.22 if diary day was a Saturday<br />
or Sunday. Calculations of the average time both<br />
partners spent on paid and unpaid work at the household<br />
level are very consistent with individual level data—that<br />
is, using only diary data for respondents by sex. Knowing<br />
the work dynamic within a couple is important for<br />
understanding the individual work pattern and well-being<br />
of each of the partners.<br />
The target population includes all respondents aged<br />
25 to 54 at the time of the survey. This is the core<br />
working-age group and also the group most likely to have<br />
dependent children living at home, thus increasing the likelihood<br />
of their having significant employment and home<br />
responsibilities. In order to clearly examine the amount of<br />
paid and unpaid labour done by those living alone or in a<br />
couple, households with extra members, such as grandmothers<br />
or boarders, were excluded.<br />
Activity participation rate (time use) indicates the proportion<br />
of the population (or sub-population) that reported<br />
spending some time on the activity on diary day. The<br />
participation rate is a daily rate and, unless otherwise<br />
specified, is an average over a seven-day week.<br />
2 / PERSPECTIVES AUTUMN 2006 Statistics Canada — Catalogue no. 75-001-XPE
<strong>Converging</strong> <strong>gender</strong> <strong>roles</strong><br />
over the past two decades, rising from 8.2 hours in<br />
1986 to 8.8 hours in 2005. All of the increase comes<br />
from paid labour, which rose from an average of 4.7<br />
hours per day in 1986 to 5.4 hours in 2005, while<br />
unpaid work dropped slightly. These findings refute<br />
the theories that advanced technology and growth in<br />
productivity capacity would invariably lead to increased<br />
leisure time. 1<br />
Both men and women have added to their overall<br />
workday since 1986 (Chart A). Most of the 0.6 hour<br />
increase for men has come from unpaid work, rising<br />
from 2.1 to 2.5 hours, although their paid labour also<br />
rose (from 6.1 to 6.3 hours). The 0.7 hour increase for<br />
women has come entirely from paid work (3.3 to 4.4<br />
hours), despite a half hour drop in unpaid work (4.8<br />
to 4.3 hours). Although <strong>gender</strong> differences in the division<br />
of labour are still evident, they are slowly breaking<br />
down.<br />
<strong>Converging</strong> labour force participation rates<br />
The jump in the average time women spend in paid<br />
labour is attributable not only to time spent on the<br />
job, but also to an increase in their participation rate.<br />
Canadian women have one of the highest participation<br />
rates in the world, a rate that is converging with<br />
men’s. For example, while the difference in labour<br />
force participation rates for men and women aged 25<br />
to 54 was 24 percentage points in 1986 (94% for men<br />
versus 70% for women), in 2005 it stood at 10 points<br />
(91% versus 81%) (Chart B). Time-use data on average<br />
daily participation rates show a similar trend,<br />
with the women’s rate rising from 44% in 1986 to<br />
51% in 2005, and men’s decreasing from 68% to 65%<br />
(Table 1). 2<br />
Men’s participation in housework up,<br />
women’s down<br />
The proportion of those doing some housework daily,<br />
be it making sandwiches for lunch, vacuuming, or taking<br />
out the garbage, increased from 72% in 1986 to<br />
79% in 2005. However, this increase is entirely attributable<br />
to men, whose participation rose from 54% to<br />
69%, while women’s remained steady at around 90%.<br />
Changes in the daily participation rate for core housework<br />
(meal preparation, meal clean-up, indoor cleaning,<br />
and laundry) are the most noticeable—40% to<br />
59% for men, and 88% to 85% for women.<br />
Even though the proportion of people doing housework<br />
of some kind has increased, the amount of time<br />
spent at it has decreased (from an average of 2.7 hours<br />
per day in 1986 to 2.5 hours per day in 2005) (Chart<br />
C). All of the decrease comes from core housework.<br />
Labour-saving devices such as dishwashers, and semiprepared<br />
or pre-packaged food items (such as prewashed<br />
bags of salad, already peeled carrots, or frozen<br />
dinners) as well as numerous take-out options, may be<br />
helping to cut down the time spent in kitchens.<br />
Still, given the trend toward ever bigger homes, 3 it<br />
seems puzzling to witness a reduction in time spent on<br />
housework. Canadians are not alone in this; a remarkably<br />
similar trend has been observed in the United<br />
Chart B Women have increased their labour force participation dramatically, but men still put in<br />
more hours on the job<br />
%<br />
100<br />
In the labour force<br />
Hours<br />
45<br />
Usual weekly time at job<br />
90<br />
80<br />
70<br />
60<br />
Men<br />
Women<br />
43<br />
41<br />
39<br />
37<br />
35<br />
Men<br />
Women<br />
50<br />
1976 1981 1986 1991 1996 2001<br />
2005<br />
33<br />
1976 1981 1986 1991 1996 2001<br />
2005<br />
Source: Statistics Canada, Labour Force Survey<br />
Statistics Canada — Catalogue no. 75-001-XPE AUTUMN 2006 PERSPECTIVES / 3
<strong>Converging</strong> <strong>gender</strong> <strong>roles</strong><br />
Table 1 Participation in, and time spent on, paid work, housework and other unpaid work<br />
Men 25 to 54 Women 25 to 54<br />
1986 1992 1998 2005 1986 1992 1998 2005<br />
Average hours per day (population) 1<br />
Total paid and unpaid 8.3 8.6 8.9 8.8 8.1 8.4 8.5 8.8<br />
Paid work and related 6.1 6.1 6.3 6.3 3.3 3.6 4.0 4.4<br />
Work 4.9 5.1 5.1 5.3 2.8 3.0 3.2 3.7<br />
Related activities 0.7 0.6 0.6 0.4 0.3 0.3 0.4 0.3<br />
Commute 0.5 0.5 0.5 0.6 0.3 0.3 0.3 0.4<br />
Housework 1.0 1.4 1.4 1.4 2.8 2.9 2.6 2.4<br />
Core 0.4 0.5 0.7 0.7 2.5 2.3 2.2 1.9<br />
Non-core 0.6 0.9 0.7 0.7 0.3 0.6 0.5 0.5<br />
Other unpaid 1.1 1.1 1.2 1.1 2.0 1.9 2.0 1.9<br />
Child care 0.4 0.4 0.5 0.5 0.9 1.0 1.0 1.0<br />
Shopping and services 0.7 0.6 0.7 0.6 1.1 0.9 1.0 0.9<br />
Average hours per day (participants) 1<br />
Total paid and unpaid 8.7 8.9 9.1 9.2 8.3 8.5 8.6 8.9<br />
Paid work and related 9.0 9.4 9.5 9.7 7.6 8.0 8.2 8.5<br />
Work 7.7 8.1 8.1 8.5 6.7 6.9 7.1 7.5<br />
Related activities 1.4 1.2 1.3 1.1 1.1 1.0 1.0 1.1<br />
Commute 0.9 0.8 0.9 1.0 0.7 0.7 0.8 0.9<br />
Housework 1.9 2.0 1.8 2.1 3.1 3.1 2.8 2.8<br />
Core 1.1 1.0 1.0 1.2 2.9 2.6 2.4 2.3<br />
Non-core 2.2 2.3 2.2 2.5 1.3 1.6 1.4 1.8<br />
Other unpaid 2.4 2.1 2.1 2.2 2.9 2.8 2.8 2.9<br />
Child care 1.5 1.6 1.8 1.8 2.1 2.2 2.3 2.5<br />
Shopping and services 2.3 1.8 1.7 1.9 2.4 2.0 1.9 2.0<br />
Participation (%)<br />
Total paid and unpaid 94 96 98 96 98 99 99 98<br />
Paid work and related 68 65 67 65 44 45 48 51<br />
Work 64 63 63 62 41 43 46 49<br />
Related activities 46 48 51 39 29 33 36 30<br />
Commute 61 57 59 58 39 40 43 46<br />
Housework 54 67 77 69 90 93 94 89<br />
Core 40 52 69 59 88 91 92 85<br />
Non-core 26 38 36 31 23 37 42 35<br />
Other unpaid 46 51 56 49 69 68 71 66<br />
Child care 23 28 30 27 44 44 43 39<br />
Shopping and services 32 33 39 31 45 47 51 45<br />
1 Time averaged over seven days; numbers may not add due to rounding.<br />
Source: Statistics Canada, General Social Survey<br />
4 / PERSPECTIVES AUTUMN 2006 Statistics Canada — Catalogue no. 75-001-XPE
<strong>Converging</strong> <strong>gender</strong> <strong>roles</strong><br />
Chart C Overall, more people are doing some daily housework, but they are spending less time at it<br />
%<br />
100<br />
Daily housework<br />
Hours<br />
3.5<br />
Average time 1<br />
80<br />
3.0<br />
2.5<br />
60<br />
2.0<br />
40<br />
1.5<br />
20<br />
1.0<br />
0.5<br />
0<br />
Both sexes Men Women<br />
0.0<br />
Both sexes Men Women<br />
1986 2005<br />
1986 2005<br />
1 By those who did some housework.<br />
Source: Statistics Canada, General Social Survey<br />
States. Between 1975 and 1995 the average weekly<br />
hours Americans spent on housework dropped from<br />
15.5 to 13.7. Furthermore, “women’s and men’s hours<br />
spent in housework have converged over the period,<br />
primarily due to the steep decline in women’s hours<br />
of housework” (Bianchi et al. 2000). One reason for<br />
the overall decline could be today’s service-oriented<br />
economy. From take-out meals to snow removal,<br />
groundskeeping and housecleaning, people buy many<br />
goods and services once produced in the home.<br />
Housework standards may also be falling and people<br />
are less bothered if their house fails the ‘white-glove’<br />
dust test. In the same vein, people’s priorities may have<br />
changed as to how they want to spend their time<br />
(Bianchi et al. 2000).<br />
Overall, participation rates for other types of unpaid<br />
labour—primary child care and shopping for goods<br />
and services—have remained relatively stable over the<br />
past 20 years. The average time spent has trended<br />
upward for child care and downward for shopping.<br />
However, the participation rate and time spent on child<br />
care for those with children at home shows a more<br />
noticeable increase, particularly among men (see Sharing<br />
the caring).<br />
Marriage today less likely to alter women’s<br />
labour market behaviour<br />
In both 1986 and 2005, married men with children<br />
had appreciably higher daily participation rates for paid<br />
labour than men living alone—roughly 70% versus<br />
60% (Chart D). 5 On the other hand, in 1986, married<br />
women (with or without children) were significantly<br />
less likely to participate in paid labour (39% and 49%<br />
respectively) than those living alone (60%). By 2005,<br />
however, no statistically significant difference was seen<br />
between married women without children and those<br />
living alone. And while the difference between married<br />
women with children and those living alone was<br />
21 percentage points in 1986, the difference in 2005<br />
was down to 12 points.<br />
Similar patterns emerge for daily hours spent on paid<br />
work. While married men with children spent significantly<br />
more time on paid work than men living alone<br />
in both 1986 and 2005, women with children spent<br />
significantly less than their counterparts living alone.<br />
However, while paid work hours were significantly<br />
different in 1986 for women living alone and married<br />
women without children (5.0 and 3.9 respectively), no<br />
significant difference was evident in 2005 (5.0 and 4.8).<br />
Married women, with or without children, significantly<br />
increased the average time they spent at paid labour<br />
between 1986 and 2005. Therefore, although married<br />
men (with or without children) still spent more time at<br />
paid work than women in the same circumstances, the<br />
difference has narrowed. For example, married men<br />
without children spent an average of 2.2 hours more<br />
time at paid labour than women in 1986 (6.1 versus<br />
3.9 hours), but by 2005 the difference had dropped to<br />
1.4 hours (6.2 versus 4.8).<br />
Statistics Canada — Catalogue no. 75-001-XPE AUTUMN 2006 PERSPECTIVES / 5
<strong>Converging</strong> <strong>gender</strong> <strong>roles</strong><br />
Chart D Daily participation in, and time spent on, paid work and housework, by living arrangements<br />
% Paid work<br />
% Housework<br />
80<br />
70<br />
Participation<br />
100<br />
90<br />
Participation<br />
60<br />
80<br />
50<br />
70<br />
40<br />
60<br />
30<br />
Men Women Men Women Men Women<br />
50<br />
Men Women Men Women Men Women<br />
Living<br />
alone<br />
Married<br />
no children<br />
Married<br />
with children<br />
Living<br />
alone<br />
Married<br />
no children<br />
Married<br />
with children<br />
Hours<br />
Hours<br />
8<br />
7<br />
6<br />
Time<br />
4<br />
3<br />
Time<br />
5<br />
2<br />
4<br />
3<br />
1<br />
2<br />
Men Women Men Women Men Women<br />
0<br />
Men Women Men Women Men Women<br />
Living<br />
alone<br />
Married<br />
no children<br />
Married<br />
with children<br />
Living<br />
alone<br />
Married<br />
no children<br />
Married<br />
with children<br />
1986 2005<br />
Note: Except paid work for those living alone, all other differences between men and women are statistically significant.<br />
Source: Statistics Canada, General Social Survey<br />
More married men now doing housework<br />
In all family types, daily participation rates for housework<br />
continue to be significantly higher for women<br />
than for men. However, the gap is narrowing. For<br />
example, among married men with children, the participation<br />
rate rose from 54% to 71%. Furthermore,<br />
while the presence of a wife lessened men’s involvement<br />
in housework in 1986 (single men had a participation<br />
rate of 61%, and married men 53%), 2005 saw<br />
roughly 7 in 10 married men, both with and without<br />
children, participating in housework. The increase in<br />
husbands’ participation is a logical reaction to the reality<br />
that most wives are now engaged in paid labour,<br />
and for longer hours, and therefore have less time to<br />
do housework. The significant increase in participation<br />
among men living alone may be partly attributable<br />
to changing cultural norms, whereby both men<br />
and women have been taught life skills formerly<br />
reserved for the opposite sex. “It is likely more<br />
acceptable for men to cook and clean, indeed, welcomed,<br />
for men to show competence at making a<br />
home-cooked meal, for example” (Bianchi et al. 2000).<br />
From the standpoint of time, married women, particularly<br />
those with children, continue to do significantly<br />
more housework than married men, but the overall<br />
difference has lessened. In 1986, women with children<br />
did 2.2 hours more per day than their male counterparts<br />
(3.3 versus 1.1 hours), with the difference<br />
6 / PERSPECTIVES AUTUMN 2006 Statistics Canada — Catalogue no. 75-001-XPE
<strong>Converging</strong> <strong>gender</strong> <strong>roles</strong><br />
Sharing the caring<br />
As the <strong>roles</strong> of men and women with<br />
respect to paid labour and household<br />
maintenance continue to converge,<br />
so too does the responsibility<br />
for nurturing children. Once excluded<br />
from delivery rooms, men<br />
are now not only labour coaches,<br />
but active participants in the multitude<br />
of tasks associated with caring<br />
for babies and young children.<br />
As with housework, a key impetus<br />
behind men’s increasing role in<br />
child care is the increasing participation<br />
of women in the labour<br />
force. In 1976, 36% of couples with<br />
dependent children at home were<br />
dual-earner families; by 2005 the<br />
proportion had increased to 69%<br />
(Table A). Greater sharing of financial<br />
responsibility has led to “a<br />
pattern of convergence whereby<br />
women and men increasingly come<br />
to see themselves not only as<br />
co-parents but as co-providers for<br />
their children.” (Daly 2004, p. 7). To some extent this attitude<br />
has become reality. Although still less involved in<br />
primary child care than women, men have significantly increased<br />
their participation. Primary care includes direct<br />
Table B<br />
Average time 1 spent on primary<br />
child care by married persons<br />
aged 25 to 54<br />
Men<br />
Table A Husband–wife families with children under 16<br />
at home<br />
1976 1986 1992 2005<br />
’000 % ’000 % ’000 % ’000 %<br />
Total 5,663 100 5,473 100 5,532 100 5,485 100<br />
Dual-earner 2,041 36 2,905 53 3,190 58 3,758 69<br />
Single-earner 1 3,041 54 1,796 33 1,397 25 1,147 21<br />
Mother at home 2,991 98 1,720 96 1,278 91 1,022 89<br />
Father at home 49 2 76 4 119 9 125 11<br />
Other 2 581 10 772 14 945 17 580 11<br />
1 Stay-at-home parent must not be looking for work, but must be able to work and not<br />
attending school.<br />
2 Includes no-earner families and single-earner families with an unemployed spouse.<br />
Source: Statistics Canada, Labour Force Survey<br />
Women<br />
1986 2005 1986 2005<br />
With children under 19<br />
Hours<br />
at home 0.6(*) 1.0*(*) 1.4 2.0*<br />
At least one child under 5 1.0(*) 1.6*(*) 2.6 3.4*<br />
All children 5 to 18 0.3(*) 0.6*(*) 0.7 1.2*<br />
With children under 19<br />
Participation rate (%)<br />
at home 38(*) 52*(*) 67 72*<br />
At least one child under 5 57(*) 73*(*) 92 94<br />
All children 5 to 18 25(*) 40*(*) 52 60*<br />
1 Population.<br />
* Significant difference with 1986 at the .05 level or less.<br />
(*) Significant difference between men and women at the .05 level<br />
or less.<br />
Source: Statistics Canada, General Social Survey<br />
involvement such as reading to children, taking them to<br />
the park, helping with homework, or driving them to activities<br />
(see Data sources and definitions). For example,<br />
while just over 90% of women with pre-school children reported<br />
doing primary child care in both 1986 and 2005,<br />
men’s involvement jumped from 57% to 73%. However,<br />
unlike housework where the average time spent has<br />
increased for men but dropped for women, time spent on<br />
child care has increased for both sexes. Overall, in 2005,<br />
fathers with children under 19 at home spent about 1.0<br />
hour per day on child care (up from 0.6 in 1986) and<br />
mothers 2.0 hours (up from 1.4 hours) (Table B). 4 Despite<br />
the increasing time spent on paid labour, both have also<br />
increased their direct involvement with their children. However,<br />
studies have suggested that fathers and mothers<br />
provide different types of care. While “there is a trend of<br />
convergence in the amount of time” mothers and fathers<br />
are involved with their children, “women continue to carry<br />
most of the responsibility dimension that involves the<br />
planning, scheduling, orchestrating and coordination of<br />
family activities” (Daly 2004, p. 12).<br />
Another indication of change is the number of families with<br />
a stay-at-home father. Although families with a stayat-home<br />
parent have declined substantially since 1986,<br />
the proportion with a father in this role has increased from<br />
4% in 1986 to 11% in 2005 (Table A). Furthermore, since<br />
an amendment to the Employment Insurance Act in 2000<br />
increased the length of paid parental leave from 10 to 35<br />
weeks, fathers’ participation in the program has risen from<br />
3% to 11%. The more than 1 in 10 fathers now taking a<br />
formal employment leave to be home with their newborn<br />
is not only a “statistically significant increase, but also a<br />
socially significant one” (<strong>Marshall</strong> 2003).<br />
Statistics Canada — Catalogue no. 75-001-XPE AUTUMN 2006 PERSPECTIVES / 7
<strong>Converging</strong> <strong>gender</strong> <strong>roles</strong><br />
decreasing to 1.3 hours by 2005 (2.8 versus 1.5 hours).<br />
This narrowing is the result of married men with children<br />
spending significantly more time on housework,<br />
and married women spending significantly less.<br />
Dual-earners<br />
The steady rise in women’s labour force participation<br />
means that in most couples, even those with dependent<br />
children at home, both spouses are now employed.<br />
The proportion of dual-earners among husbandand-wife<br />
families with children under 16 at home rose<br />
from 36% in 1976, to 58% in 1992, to 69% in 2005<br />
(see Sharing the caring). Without a doubt, juggling home<br />
and work responsibilities is more challenging when<br />
both parents are employed. Society has a vested interest<br />
in ensuring that these individuals are able to meet<br />
this challenge, since the consequences of being overburdened<br />
affect not only the health and well-being of<br />
individuals and their family, but also the ability to be<br />
effective in the workplace. Unmanageable responsibilities<br />
in either sphere can have negative spillover<br />
effects, such as inattentiveness at home or lack of productivity<br />
at the workplace (Daly 2004).<br />
Not only has the number of dual-earners increased<br />
since 1992, so too has the average daily amount of<br />
time these couples spend on paid work and housework<br />
combined (up 0.5 hours per day, a result of 0.7<br />
hours more paid work but 0.2 hours less housework)<br />
(Table 2). 6 This net change within couples was due to<br />
an increase in husbands’ paid work and housework<br />
(0.3 hours and 0.1 hours respectively), and an increase<br />
in wives’ paid work and decrease in housework (0.4<br />
hours and -0.2 hours respectively). 7<br />
In both 1992 and 2005, each partner in dual-earner<br />
couples did 50% of the combined paid work and<br />
housework each day (Table 3). However, wives did<br />
45% of total paid work but 65% of housework in<br />
1992. By 2005 these proportions stood at 46% and<br />
62%.<br />
As in the general population, men in dual-earner families<br />
have increased their participation in housework<br />
(from 70% in 1992 to 74% in 2005), while the women’s<br />
rate has dropped (from 94% to 90%).<br />
Children widen the gap...<br />
Several factors are associated with who does what in a<br />
dual-earner family, and how much time they spend.<br />
For example, school-aged children at home add an<br />
average of 1.2 hours to a family’s workday, pushing it<br />
to more than 8 hours for both parents (Table 3).<br />
However, fathers tend to add both paid work and<br />
housework (0.4 and 0.3 hours respectively) compared<br />
with men without children at home, whereas women<br />
add only housework (0.6 hours more than women<br />
without children).<br />
… and education narrows it<br />
When only the wife in a couple has a university degree,<br />
her share of housework decreases to 59%, compared<br />
with 62% overall. Although not a strong finding, this<br />
is consistent with other studies, which have found that<br />
“increases in wife’s education, as a proxy for wage<br />
rate, tend to be associated with an increased share of<br />
housework for the husband” (Anxo and Carlin 2004,<br />
p. 30). Also, lower levels of education for both partners<br />
add to the length of the total workday (paid work<br />
and housework). Families in which neither partner<br />
graduated from university worked an average 16.3<br />
Table 2 Participation in, and time spent on,<br />
paid work and housework in dualearner<br />
families<br />
Participation Time per day 1<br />
1992 2005 1992 2005<br />
% Hours<br />
Total<br />
Both 99 99 15.3 15.8<br />
Husband 99 98 7.7 7.9<br />
Wife 100 99 7.6 7.8<br />
Paid work<br />
Both 72 72 11.5 12.2*<br />
Husband 71 73 6.3 6.6<br />
Wife 72 70 5.2 5.6<br />
Housework<br />
Both 82 82 3.8 3.6<br />
Husband 70 74 1.3 1.4<br />
Wife 94 90* 2.4 2.2<br />
Wife's share 50 50<br />
Paid work 45 46<br />
Housework 65 62*<br />
1 Figures may not add due to rounding. Based on household<br />
reporting; participation based on respondent reporting.<br />
* Significantly different from 1992 at the .05 level or less.<br />
Source: Statistics Canada, General Social Survey<br />
8 / PERSPECTIVES AUTUMN 2006 Statistics Canada — Catalogue no. 75-001-XPE
<strong>Converging</strong> <strong>gender</strong> <strong>roles</strong><br />
Table 3 Total average time spent on paid work and housework within dual-earner couples<br />
Total paid<br />
Wife's<br />
and housework Paid Housework proportion of time<br />
Hus- Hus- Hus- House-<br />
Both band Wife Both band Wife Both band Wife Total Paid work<br />
Hours %<br />
Total dual-earners 15.8 7.9 7.8 12.2 6.6 5.6 3.6 1.4 2.2 50 46 62<br />
No children under 19<br />
at home (ref) 15.2 7.6 7.6 12.1 6.4 5.7 3.1 1.2 1.9 50 47 61<br />
At least one under 5 15.3 7.7 7.6 11.8 6.4 5.5 3.5* 1.3 2.1* 50 46 62<br />
All between 5 and 18 16.4* 8.3* 8.2* 12.5 6.8* 5.7 4.0* 1.5* 2.5* 50 45 63<br />
Both have university<br />
degree (ref) 15.2 7.6 7.6 12.2 6.4 5.8 3.1 1.2 1.9 50 47 60<br />
Wife only 15.0 7.6 7.4 11.5 6.2 5.3 3.5* 1.4 2.1 49 46 59<br />
Husband only 14.9 7.5 7.3 11.6 6.3 5.3 3.3 1.2 2.1 49 46 62<br />
Neither have a degree 16.3* 8.2* 8.1* 12.5 6.8 5.7 3.8* 1.4* 2.4* 50 46 62<br />
Wife’s income 1<br />
Less than $30,000 (ref) 16.4 8.3 8.1 12.5 7.0 5.5 3.9 1.2 2.7 50 44 68<br />
$30,000 - $59,999 15.4* 7.6 7.7 12.1 6.4 5.6 3.3* 1.2 2.1* 50 47 64*<br />
$60,000 - $99,999 15.6 7.9 7.7 11.9 6.4 5.5 3.6 1.5 2.2* 49 46 60*<br />
$100,000 or more 16.3 8.3 8.1 13.2 6.7 6.5 3.2 E 1.6 E 1.6* E 49 49* 50*<br />
Husband’s income 1<br />
Less than $30,000 (ref) 16.0 8.4 7.6 12.1 6.5 5.6 3.9 1.9 2.1 47 46 52<br />
$30,000 - $59,999 15.9 8.0 7.9 12.3 6.5 5.8 3.6 1.5 2.1 50 47 59<br />
$60,000 - $99,999 15.5 7.9 7.6 11.7 6.2 5.5 3.8 1.7 2.1 49 47 55<br />
$100,000 or more 16.1 8.1 8.0 12.6 6.8 5.9 3.5 1.4 2.1 50 47 61<br />
Both full-time (ref) 16.1 8.0 8.1 12.5 6.6 5.9 3.5 1.4 2.1 50 47 60<br />
Husband full-time,<br />
wife part-time 14.1* 8.0 6.1* 10.3* 6.9 3.4* 3.9 1.1* 2.7* 43* 33* 71*<br />
Husband part-time,<br />
wife full-time 12.2* 4.2* 8.0 8.7* 2.7* E 6.0 3.5 1.5 2.0 E 66* 69* 58<br />
1 Based on respondent information only as the income of the spouse was not collected.<br />
* Significantly different from reference group (indicated by ‘ref’) at the .05 level or less.<br />
Source: Statistics Canada, General Social Survey, 2005<br />
hours per day compared with 15.2 hours for those in<br />
which both had a university degree. Most of the added<br />
time came from housework.<br />
Parity in labour when wives have high<br />
income<br />
High personal income, for either sex, is associated with<br />
spending more time at a job and less on housework.<br />
For example, compared with women whose annual<br />
income was less than $30,000, those with $100,000 or<br />
more did one hour more of paid work, and one hour<br />
less of housework per day. (Both did an average of<br />
8.1 hours of total work per day.)<br />
Longer job hours often bring higher earnings, which<br />
in turn can offer some relief from housework by providing<br />
the means to hire someone else to do it. In 2004,<br />
only 7% of households with income less than $40,000<br />
paid for domestic help, spending an average of $813.<br />
This compared with 43% of households with $160,000<br />
or more, who spent $2,150 (Chart E).<br />
When wives have an income of $100,000 or more, the<br />
division of paid labour and housework between partners<br />
is more likely to be split equally. In these couples,<br />
each partner spent about 6.5 hours per day on paid<br />
work and 1.5 hours on housework.<br />
Statistics Canada — Catalogue no. 75-001-XPE AUTUMN 2006 PERSPECTIVES / 9
<strong>Converging</strong> <strong>gender</strong> <strong>roles</strong><br />
Chart E<br />
50<br />
40<br />
30<br />
20<br />
10<br />
0<br />
Less<br />
than 40<br />
Higher income households are more likely to hire<br />
domestic help<br />
40-59 60-79 80-99 100-119 120-139 140-159 160<br />
and over<br />
&KDUW( &KD<br />
% $<br />
Purchasers (left scale)<br />
Average annual expenditure<br />
(right scale)<br />
Household income ('000 $)<br />
Source: Statistics Canada, Survey of Household Spending, 2004<br />
2,500<br />
2,000<br />
1,500<br />
1,000<br />
Furthermore, a wife’s income is likely to influence the husband’s time spent<br />
on housework as well as her own. For him, time spent doing housework<br />
rises along with her income, while for her, the time falls. On the other<br />
500<br />
0<br />
hand, regardless of her husband’s<br />
income level, a wife’s time spent on<br />
housework stays the same. These<br />
findings partly support the ‘relative<br />
resources’ theory of the division of<br />
housework, which suggests that<br />
partners with relatively high education<br />
and income have more power<br />
to get out of doing housework<br />
(Bianchi et al. 2000). Other research<br />
has shown that high-income households<br />
are more likely to buy domestic<br />
help, especially if the wife is<br />
the primary earner. The latter are<br />
twice as likely to hire help than highincome<br />
households in which the<br />
husband is the main earner<br />
(Palameta 2003).<br />
Finally, even though dual-earner<br />
partners working full time both<br />
contribute 8 hours of total labour<br />
each day, husbands are more likely<br />
than wives to spend more time at a<br />
job (6.6 versus 5.9 hours) and less<br />
time on housework (1.4 versus 2.1<br />
hours). Past research has found that<br />
Table 4 Indicators of well-being for couples aged 25 to 54<br />
Satisfied with work– Not time Satisfied with<br />
life balance stressed life generally<br />
Men Women Men Women Men Women<br />
%<br />
Husband sole earner<br />
No children under 19 78 … 64(*) 75 84 85<br />
At least one under 19 69 * … 61 55* 82 85<br />
Wife sole earner<br />
No children under 19 … 82 79(*) 58 74 83<br />
At least one under 19 … 73 77(*) 59 80 81<br />
Dual-earners<br />
No children under 19 78 76 62(*) 53 88 88<br />
At least one under 19 77(*) 67* 58(*) 45* 87 86<br />
Both full-time 77(*) 69 60(*) 45 87 87<br />
Husband full-time, wife part-time 78 86 57 65 89 88<br />
Wife full-time, husband part-time F 61 F F F 88<br />
* Significant difference between those with and without children at the .05 level or less.<br />
(*) Significant difference between men and women at the .05 level or less.<br />
Source: Statistics Canada, General Social Survey, 2005<br />
10 / PERSPECTIVES AUTUMN 2006 Statistics Canada — Catalogue no. 75-001-XPE
<strong>Converging</strong> <strong>gender</strong> <strong>roles</strong><br />
not only are wives in these families more likely to do<br />
most of the housework, but they also feel most<br />
responsible for anticipating, planning and organizing<br />
what needs to be done (<strong>Marshall</strong> 1993). Findings show<br />
that husbands or wives who work part time and have<br />
a spouse working full time have a shorter overall workday<br />
(paid work and housework) than their spouse.<br />
However, many are likely spending a considerable<br />
amount of time on child care.<br />
Although time-stressed, employed parents<br />
satisfied with life overall<br />
Both children and work arrangements within families<br />
influence work–life balance (WLB) satisfaction and<br />
stress caused by lack of time. Sole earners in couples<br />
with children at home had some of the lowest WLB<br />
satisfaction rates (69% for sole-earner fathers and 73%<br />
for mothers) (Table 4). Dual-earner fathers reported<br />
the highest satisfaction rate (77%), significantly higher<br />
than dual-earner mothers, who had the lowest (67%).<br />
Men and women in dual-earning families, with and<br />
without children, feel most stressed about not having<br />
enough time. Given that children require a great deal<br />
of time and energy, it is not surprising to find that<br />
when both parents are employed, only 58% of fathers<br />
and 45% of mothers did not feel stressed for lack of<br />
time. Except in couples with dependent children and<br />
the husband as sole earner, women reported being significantly<br />
more stressed for time than men.<br />
Interestingly, compared with other women, those in<br />
dual-earner couples and working part time express the<br />
highest WLB satisfaction (86%), are some of the least<br />
time-stressed (65%), and have a high overall life satisfaction<br />
rate (88%). On the other hand, women in dualearner<br />
couples and working full time are much less<br />
likely to feel satisfied with their WLB (69%) and more<br />
likely to feel pressed for time (only 45% did not feel<br />
time-stressed). However, despite the pressure of having<br />
children at home and each partner having a paid<br />
job, dual-earner men and women are the most likely<br />
to report high levels of satisfaction with their life as a<br />
whole.<br />
Parenting and long hours more burdensome<br />
for women<br />
Not surprisingly, the longer a couple spends on an<br />
average weekday working at their jobs and doing<br />
housework, the more difficult it is to find balance in<br />
life with time enough to accomplish everything. 8<br />
Women generally tend to feel more time-stressed than<br />
men, regardless of length of workday or presence of<br />
children (Table 5). For example, among couples with<br />
the longest workday and children at home, two-thirds<br />
of the women felt time-stressed compared with onehalf<br />
of the men. Research has found that mothers, regardless<br />
of employment status, consistently feel more<br />
time-crunched than fathers (Zukewich 2003).<br />
Longer workdays and the presence of children also<br />
affect women more than men in terms of WLB satisfaction.<br />
Only 52% of women with children in couples<br />
with long hours felt satisfied with their WLB, the lowest<br />
rate overall. In contrast, 71% of their male counterparts<br />
were satisfied. However, although overall life<br />
satisfaction fell somewhat as the workday lengthened<br />
Table 5 Indicators of well-being for dual-earners by combined length of workday<br />
Satisfied with work– Not time- Satisfied with<br />
life balance stressed life generally<br />
Men Women Men Women Men Women<br />
No children under 19 at home %<br />
Less than 18 hours 77 74 69 51 (*) 90 85<br />
18.0 to 21.9 78 79 64 53 87 89<br />
22 or more 77 66 50* 50 83 84<br />
With children under 19 at home<br />
Less than 18 hours 80 73 61 49 (*) 95 89<br />
18.0 to 21.9 80 68 (*) 61 42 (*) 86 85<br />
22 or more 71 52*(*) 49* 36*(*) 86 80<br />
* Significantly different from couples with less than 18 hour day and no children at the .05 level or less.<br />
(*) Significantly different from men at the .05 level or less.<br />
Source: Statistic Canada, General Social Survey, 2005<br />
Statistics Canada — Catalogue no. 75-001-XPE AUTUMN 2006 PERSPECTIVES / 11
<strong>Converging</strong> <strong>gender</strong> <strong>roles</strong><br />
for both men and women in dual-earner families (with<br />
or without children), the difference was not significant,<br />
and the vast majority (80% or more) felt satisfied<br />
with their life as a whole.<br />
Conclusion<br />
While women’s entry into the job market has been dramatic,<br />
men’s entry into housework has been gradual,<br />
prompting some to call the latter a ‘stalled revolution’<br />
(Cooke 2004). However, this study shows that,<br />
although <strong>gender</strong> differences persist in the division of<br />
labour, they are steadily diminishing. Since 1986, of<br />
the total time spent on paid and unpaid work, women<br />
aged 25 to 54 have proportionally increased their<br />
average daily time at a job (4.4 hours of 8.8 in 2005),<br />
while men have increased their time on housework<br />
(1.4 of 8.8 hours in 2005). As women’s job attachment<br />
has increased, so too has men’s involvement in<br />
housework and child care. Women’s increasing hours<br />
in paid labour (and thus income), combined with “normative<br />
changes in the direction of equality and sharing”<br />
(Beaujot 2006, p. 24) is likely to further reduce<br />
<strong>gender</strong> differences in the division of labour in the<br />
future .<br />
However, not only are more men and women sharing<br />
the economic and domestic responsibilities in families,<br />
but most are also increasing the length of their paid<br />
workday. This has helped position work–life balance<br />
among the top 10 issues in collective bargaining. It has<br />
risen in importance because of the “increased recognition<br />
of the costs of work–life imbalance in terms of<br />
workplace injury rates and the general health of workers,<br />
as well as the development and well-being of children<br />
and aging parents” (Canadian Association of<br />
Administrators of Labour Legislation 2002, p. 4).<br />
Dual-earner couples who worked long days doing their<br />
job plus housework and who had dependent children<br />
at home were less satisfied with their work–life balance.<br />
They also felt more time-stressed, particularly<br />
women. However, despite these stage-of-life pressures,<br />
the majority of dual-earner husbands and wives<br />
felt satisfied with their life as a whole.<br />
Increasingly, employees are legally entitled to various<br />
kinds of paid and unpaid leave for family responsibilities.<br />
As well, more workplaces are offering flexible<br />
work arrangements, health promotion and employee<br />
assistance programs, and other family support such as<br />
on-site child care. It has been shown that employees<br />
with flextime arrangements feel considerably less timestressed<br />
than those without this benefit (Fast and<br />
Frederick 1996). In short, changing work arrangements<br />
in the home are inspiring alternative work arrangements<br />
at the office.<br />
• Notes<br />
Perspectives<br />
1 For a discussion of the different theories of leisure, see<br />
Gershuny and Fisher (2000).<br />
2 While both the GSS and the LFS show women’s average<br />
hours at paid work increasing, the LFS shows men’s hours<br />
falling but the GSS shows them increasing. It is difficult to<br />
explain this difference, but some of it may be due to the<br />
different collection methods of the two surveys (see Data<br />
sources and definitions).<br />
3 According to the census, the average number of rooms<br />
per dwelling increased from 5.8 in 1986 to 6.3 in 2001.<br />
Although square footage is not collected, this increase does<br />
suggest larger homes.<br />
4 Average daily time spent on primary child care for<br />
participants has also steadily increased.<br />
5 Married couples also include common-law couples.<br />
6 A comparison of dual-earners couples from the first time<br />
use survey in 1986 was not possible since information about<br />
spouse’s main activity was not collected.<br />
7 The increase in paid work between 1992 and 2005 would<br />
have been larger if commuting to work had been included.<br />
This activity increased during this time but was not part<br />
of the calculation of work time within dual-earner couples<br />
(see Data sources and definitions).<br />
8 This section looks at the total paid work and housework<br />
time couples do on an average weekday (Monday through<br />
Friday). This is arguably the most hectic part of the week.<br />
Women’s total labour as a proportion of the couple’s total<br />
work day (paid work and housework combined) was around<br />
50% for all lengths of days (6 hours of a 12-hour day, or 10<br />
hours of a 20-hour day).<br />
• References<br />
Anxo, Dominique and Paul Carlin. 2004. “Intra-family time<br />
allocation to housework: French evidence.” International<br />
Journal of Time Use Research 1, no. 1 (August): 14-36.<br />
12 / PERSPECTIVES AUTUMN 2006 Statistics Canada — Catalogue no. 75-001-XPE
<strong>Converging</strong> <strong>gender</strong> <strong>roles</strong><br />
Beaujot, Roderic. 2006. “Gender models for family and<br />
Work.” Horizons 8, no. 3 (April): 24-26.<br />
Bianchi, Suzanne M., Melissa A. Milkie, Liana C. Sayer<br />
and John P. Robinson. 2000. “Is anyone doing the<br />
housework? Trends in the <strong>gender</strong> division of household<br />
labor.” Social Forces 79, no.1 (September): 191-228.<br />
Canadian Association of Administrators of Labour Legislation<br />
(CAALL). 2002. Work-Life Balance: A Report to<br />
Ministers Responsible for Labour in Canada. Gatineau,<br />
Quebec: CAALL.<br />
Cooke, Lynn Prince. 2004. “The <strong>gender</strong>ed division of<br />
labor and family outcomes in Germany.” Journal of<br />
Marriage and Family 66 (December): 1246-1259.<br />
Coverman, Shelley. 1983. “Gender, domestic labor time,<br />
and wage inequality.” American Sociological Review 48,<br />
no. 5 (October): 623-637.<br />
Daly, Kerry. 2004. The Changing Culture of Parenting.<br />
Contemporary Family Trends series. Ottawa: The Vanier<br />
Institute of the Family.<br />
Fast, Janet E. and Judith A. Frederick. 1996. “Working<br />
arrangements and time stress.” Canadian Social Trends (Statistics<br />
Canada, catalogue no. 11-008-XPE) (Winter): 14-19.<br />
Gershuny, Jonathan and Kimberly Fisher. 2000. “Leisure.”<br />
In Twentieth-Century British Social Trends, 3 rd edition.<br />
Edited by A.H. Halsey with Josephine Webb.<br />
pp. 620-649. London: Macmillan.<br />
Human Resources and Social Development Canada<br />
(HRSDC). 2005. Addressing Work-Life Balance in Canada.<br />
<strong>Marshall</strong>, <strong>Katherine</strong>. 1993. “Employed parents and the<br />
division of housework.” Perspectives on Labour and Income<br />
(Statistics Canada, catalogue no. 75-001-XPE) 5, no. 3<br />
(Autumn): 23-30.<br />
---. 2003. “Benefiting from extended parental leave.”<br />
Perspectives on Labour and Income (Statistics Canada, catalogue<br />
no. 75-001-XIE). March 2003 online edition.<br />
Palameta, Boris. 2003. “Who pays for domestic help?”<br />
Perspectives on Labour and Income (Statistics Canada, catalogue<br />
no. 75-001-XIE). August 2003 online edition.<br />
Zukewich, Nancy. 2003. Work, parenthood and the experience<br />
of time scarcity. Days of our Lives series. Catalogue<br />
no. 89-584-XIE. Ottawa: Statistics Canada.<br />
The author would like to thank David Paton for his<br />
methodology assistance.<br />
Statistics Canada — Catalogue no. 75-001-XPE AUTUMN 2006 PERSPECTIVES / 13