Energy Use for Cooking and Other Stages in the Life Cycle of Food
Energy Use for Cooking and Other Stages in the Life Cycle of Food
Energy Use for Cooking and Other Stages in the Life Cycle of Food

Create successful ePaper yourself
Turn your PDF publications into a flip-book with our unique Google optimized e-Paper software.
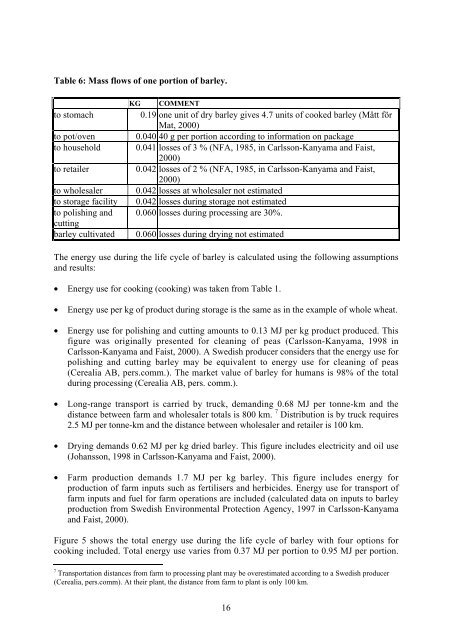
Table 6: Mass flows <strong>of</strong> one portion <strong>of</strong> barley.<br />
to stomach<br />
to pot/oven<br />
to household<br />
to retailer<br />
to wholesaler<br />
to storage facility<br />
to polish<strong>in</strong>g <strong>and</strong><br />
cutt<strong>in</strong>g<br />
barley cultivated<br />
KG COMMENT<br />
0.19 one unit <strong>of</strong> dry barley gives 4.7 units <strong>of</strong> cooked barley (Mått för<br />
Mat, 2000)<br />
0.040 40 g per portion accord<strong>in</strong>g to <strong>in</strong><strong>for</strong>mation on package<br />
0.041 losses <strong>of</strong> 3 % (NFA, 1985, <strong>in</strong> Carlsson-Kanyama <strong>and</strong> Faist,<br />
2000)<br />
0.042 losses <strong>of</strong> 2 % (NFA, 1985, <strong>in</strong> Carlsson-Kanyama <strong>and</strong> Faist,<br />
2000)<br />
0.042 losses at wholesaler not estimated<br />
0.042 losses dur<strong>in</strong>g storage not estimated<br />
0.060 losses dur<strong>in</strong>g process<strong>in</strong>g are 30%.<br />
0.060 losses dur<strong>in</strong>g dry<strong>in</strong>g not estimated<br />
The energy use dur<strong>in</strong>g <strong>the</strong> life cycle <strong>of</strong> barley is calculated us<strong>in</strong>g <strong>the</strong> follow<strong>in</strong>g assumptions<br />
<strong>and</strong> results:<br />
• <strong>Energy</strong> use <strong>for</strong> cook<strong>in</strong>g (cook<strong>in</strong>g) was taken from Table 1.<br />
• <strong>Energy</strong> use per kg <strong>of</strong> product dur<strong>in</strong>g storage is <strong>the</strong> same as <strong>in</strong> <strong>the</strong> example <strong>of</strong> whole wheat.<br />
• <strong>Energy</strong> use <strong>for</strong> polish<strong>in</strong>g <strong>and</strong> cutt<strong>in</strong>g amounts to 0.13 MJ per kg product produced. This<br />
figure was orig<strong>in</strong>ally presented <strong>for</strong> clean<strong>in</strong>g <strong>of</strong> peas (Carlsson-Kanyama, 1998 <strong>in</strong><br />
Carlsson-Kanyama <strong>and</strong> Faist, 2000). A Swedish producer considers that <strong>the</strong> energy use <strong>for</strong><br />
polish<strong>in</strong>g <strong>and</strong> cutt<strong>in</strong>g barley may be equivalent to energy use <strong>for</strong> clean<strong>in</strong>g <strong>of</strong> peas<br />
(Cerealia AB, pers.comm.). The market value <strong>of</strong> barley <strong>for</strong> humans is 98% <strong>of</strong> <strong>the</strong> total<br />
dur<strong>in</strong>g process<strong>in</strong>g (Cerealia AB, pers. comm.).<br />
• Long-range transport is carried by truck, dem<strong>and</strong><strong>in</strong>g 0.68 MJ per tonne-km <strong>and</strong> <strong>the</strong><br />
distance between farm <strong>and</strong> wholesaler totals is 800 km. 7 Distribution is by truck requires<br />
2.5 MJ per tonne-km <strong>and</strong> <strong>the</strong> distance between wholesaler <strong>and</strong> retailer is 100 km.<br />
• Dry<strong>in</strong>g dem<strong>and</strong>s 0.62 MJ per kg dried barley. This figure <strong>in</strong>cludes electricity <strong>and</strong> oil use<br />
(Johansson, 1998 <strong>in</strong> Carlsson-Kanyama <strong>and</strong> Faist, 2000).<br />
• Farm production dem<strong>and</strong>s 1.7 MJ per kg barley. This figure <strong>in</strong>cludes energy <strong>for</strong><br />
production <strong>of</strong> farm <strong>in</strong>puts such as fertilisers <strong>and</strong> herbicides. <strong>Energy</strong> use <strong>for</strong> transport <strong>of</strong><br />
farm <strong>in</strong>puts <strong>and</strong> fuel <strong>for</strong> farm operations are <strong>in</strong>cluded (calculated data on <strong>in</strong>puts to barley<br />
production from Swedish Environmental Protection Agency, 1997 <strong>in</strong> Carlsson-Kanyama<br />
<strong>and</strong> Faist, 2000).<br />
Figure 5 shows <strong>the</strong> total energy use dur<strong>in</strong>g <strong>the</strong> life cycle <strong>of</strong> barley with four options <strong>for</strong><br />
cook<strong>in</strong>g <strong>in</strong>cluded. Total energy use varies from 0.37 MJ per portion to 0.95 MJ per portion.<br />
7 Transportation distances from farm to process<strong>in</strong>g plant may be overestimated accord<strong>in</strong>g to a Swedish producer<br />
(Cerealia, pers.comm). At <strong>the</strong>ir plant, <strong>the</strong> distance from farm to plant is only 100 km.<br />
16