Energy Use for Cooking and Other Stages in the Life Cycle of Food
Energy Use for Cooking and Other Stages in the Life Cycle of Food
Energy Use for Cooking and Other Stages in the Life Cycle of Food

Create successful ePaper yourself
Turn your PDF publications into a flip-book with our unique Google optimized e-Paper software.
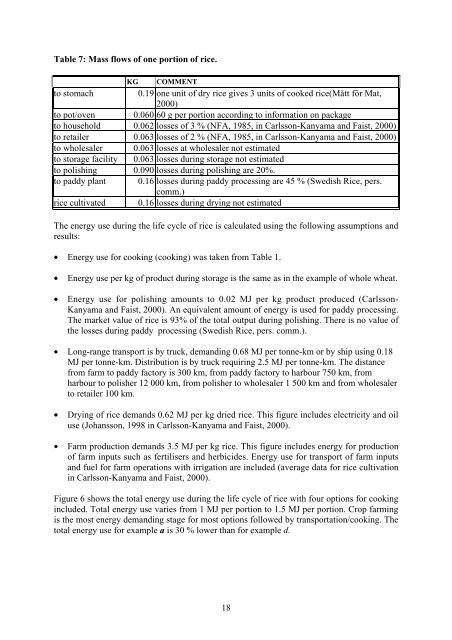
Table 7: Mass flows <strong>of</strong> one portion <strong>of</strong> rice.<br />
KG<br />
COMMENT<br />
to stomach 0.19 one unit <strong>of</strong> dry rice gives 3 units <strong>of</strong> cooked rice(Mått för Mat,<br />
2000)<br />
to pot/oven 0.060 60 g per portion accord<strong>in</strong>g to <strong>in</strong><strong>for</strong>mation on package<br />
to household 0.062 losses <strong>of</strong> 3 % (NFA, 1985, <strong>in</strong> Carlsson-Kanyama <strong>and</strong> Faist, 2000)<br />
to retailer 0.063 losses <strong>of</strong> 2 % (NFA, 1985, <strong>in</strong> Carlsson-Kanyama <strong>and</strong> Faist, 2000)<br />
to wholesaler 0.063 losses at wholesaler not estimated<br />
to storage facility 0.063 losses dur<strong>in</strong>g storage not estimated<br />
to polish<strong>in</strong>g 0.090 losses dur<strong>in</strong>g polish<strong>in</strong>g are 20%.<br />
to paddy plant 0.16 losses dur<strong>in</strong>g paddy process<strong>in</strong>g are 45 % (Swedish Rice, pers.<br />
comm.)<br />
rice cultivated 0.16 losses dur<strong>in</strong>g dry<strong>in</strong>g not estimated<br />
The energy use dur<strong>in</strong>g <strong>the</strong> life cycle <strong>of</strong> rice is calculated us<strong>in</strong>g <strong>the</strong> follow<strong>in</strong>g assumptions <strong>and</strong><br />
results:<br />
• <strong>Energy</strong> use <strong>for</strong> cook<strong>in</strong>g (cook<strong>in</strong>g) was taken from Table 1.<br />
• <strong>Energy</strong> use per kg <strong>of</strong> product dur<strong>in</strong>g storage is <strong>the</strong> same as <strong>in</strong> <strong>the</strong> example <strong>of</strong> whole wheat.<br />
• <strong>Energy</strong> use <strong>for</strong> polish<strong>in</strong>g amounts to 0.02 MJ per kg product produced (Carlsson-<br />
Kanyama <strong>and</strong> Faist, 2000). An equivalent amount <strong>of</strong> energy is used <strong>for</strong> paddy process<strong>in</strong>g.<br />
The market value <strong>of</strong> rice is 93% <strong>of</strong> <strong>the</strong> total output dur<strong>in</strong>g polish<strong>in</strong>g. There is no value <strong>of</strong><br />
<strong>the</strong> losses dur<strong>in</strong>g paddy process<strong>in</strong>g (Swedish Rice, pers. comm.).<br />
• Long-range transport is by truck, dem<strong>and</strong><strong>in</strong>g 0.68 MJ per tonne-km or by ship us<strong>in</strong>g 0.18<br />
MJ per tonne-km. Distribution is by truck requir<strong>in</strong>g 2.5 MJ per tonne-km. The distance<br />
from farm to paddy factory is 300 km, from paddy factory to harbour 750 km, from<br />
harbour to polisher 12 000 km, from polisher to wholesaler 1 500 km <strong>and</strong> from wholesaler<br />
to retailer 100 km.<br />
• Dry<strong>in</strong>g <strong>of</strong> rice dem<strong>and</strong>s 0.62 MJ per kg dried rice. This figure <strong>in</strong>cludes electricity <strong>and</strong> oil<br />
use (Johansson, 1998 <strong>in</strong> Carlsson-Kanyama <strong>and</strong> Faist, 2000).<br />
• Farm production dem<strong>and</strong>s 3.5 MJ per kg rice. This figure <strong>in</strong>cludes energy <strong>for</strong> production<br />
<strong>of</strong> farm <strong>in</strong>puts such as fertilisers <strong>and</strong> herbicides. <strong>Energy</strong> use <strong>for</strong> transport <strong>of</strong> farm <strong>in</strong>puts<br />
<strong>and</strong> fuel <strong>for</strong> farm operations with irrigation are <strong>in</strong>cluded (average data <strong>for</strong> rice cultivation<br />
<strong>in</strong> Carlsson-Kanyama <strong>and</strong> Faist, 2000).<br />
Figure 6 shows <strong>the</strong> total energy use dur<strong>in</strong>g <strong>the</strong> life cycle <strong>of</strong> rice with four options <strong>for</strong> cook<strong>in</strong>g<br />
<strong>in</strong>cluded. Total energy use varies from 1 MJ per portion to 1.5 MJ per portion. Crop farm<strong>in</strong>g<br />
is <strong>the</strong> most energy dem<strong>and</strong><strong>in</strong>g stage <strong>for</strong> most options followed by transportation/cook<strong>in</strong>g. The<br />
total energy use <strong>for</strong> example a is 30 % lower than <strong>for</strong> example d.<br />
18