Measuring Bathymetric Uncertainty of the ... - UT Proceedings
Measuring Bathymetric Uncertainty of the ... - UT Proceedings
Measuring Bathymetric Uncertainty of the ... - UT Proceedings

Create successful ePaper yourself
Turn your PDF publications into a flip-book with our unique Google optimized e-Paper software.
<strong>Measuring</strong> <strong>Bathymetric</strong> <strong>Uncertainty</strong> <strong>of</strong> <strong>the</strong> EdgeTech 4600 Sonar<br />
Thomas HILLER, Thurne Hydrographic Ltd, Norwich, UK<br />
Lisa Nicole BRISSON, Project Engineer, EdgeTech, Boca Raton, Florida<br />
Steve WRIGHT, Director <strong>of</strong> Technology Development, EdgeTech, Boca Raton, Florida<br />
Topic A: innovations in acquisition techniques<br />
Introduction<br />
High frequency (100kHz to 600kHz) sonar ‘interferometers’ (phase measuring bathymetric sonars or<br />
bathymetric side scans) have recently become a popular tool for shallow water swath surveys, and<br />
now form an integral part <strong>of</strong> <strong>the</strong> surveyors toolkit. The interferometric sonar can be considered as a<br />
multi-stave side scan, collecting a wide swath <strong>of</strong> bathymetry and sonar amplitude data, with <strong>the</strong> angle<br />
<strong>of</strong> arrival <strong>of</strong> <strong>the</strong> seabed returns determined by phase comparisons between <strong>the</strong> receive staves.<br />
A-priori <strong>the</strong>oretical error models <strong>of</strong> interferometric systems are complex and have been difficult to<br />
reconcile with observed system performance. A reliable system error model is required in order to<br />
apply sophisticated postprocessing techniques, for example <strong>the</strong> CUBE algorithms developed at UNH,<br />
and to determine <strong>the</strong> uncertainty indications to use on data sets and charts. Direct empirical<br />
measurements <strong>of</strong> system uncertainty can be used to refine and verify <strong>the</strong> sonar models and ensure<br />
that <strong>the</strong> Total Propagated <strong>Uncertainty</strong> (TPU) applied in <strong>the</strong> data processing is consistent with real data<br />
as collected.<br />
Statistical techniques for analysing and optimising <strong>the</strong> performance <strong>of</strong> swath bathymetry systems have<br />
been used for several decades (for example de Moustier 2001), especially in <strong>the</strong> analysis <strong>of</strong><br />
beamforming multibeam systems. A well-used technique is to compare a single line <strong>of</strong> test data<br />
against a reference surface to determine <strong>the</strong> sonar depth repeatability and consistency across <strong>the</strong><br />
swath. While an independently surveyed reference surface with a higher accuracy than <strong>the</strong> system<br />
under test would be desirable, this is not <strong>of</strong>ten available and in practice is difficult to obtain when<br />
testing state-<strong>of</strong>-<strong>the</strong>-art survey systems (Whittaker et al., 2011). It has become accepted practice to<br />
test a system against itself, creating a reference surface using multiple passes in different directions,<br />
with tight data filtering, to create a very high data density which will average out errors. While this<br />
has limitations with regard to systematic <strong>of</strong>fsets, <strong>the</strong> two effects <strong>of</strong> tight filtering to limit <strong>the</strong> reference<br />
surface data to <strong>the</strong> most accurate part <strong>of</strong> <strong>the</strong> swath, and <strong>the</strong> averaging <strong>of</strong> errors from multiple passes,<br />
will create a reference surface with a significantly higher accuracy and repeatability than obtainable<br />
from a single pass <strong>of</strong> <strong>the</strong> sonar.<br />
Once a reference surface has been generated a separate survey line is recorded over <strong>the</strong> test area<br />
and <strong>the</strong> two data sets can be compared. Statistical analysis <strong>of</strong> <strong>the</strong> difference will give a good<br />
indication <strong>of</strong> <strong>the</strong> accuracy and repeatability <strong>of</strong> <strong>the</strong> sonar system in a single pass as a function <strong>of</strong><br />
position across <strong>the</strong> swath. In early 2012 <strong>the</strong>se techniques were applied to analyse <strong>the</strong> performance<br />
<strong>of</strong> a boat-mounted EdgeTech 4600 sonar system when used for shallow water surveys, with data<br />
collected <strong>of</strong>f West Palm Beach FL, USA.<br />
Methods<br />
The EdgeTech 4600 is a combined, fully integrated, swath bathymetry and side scan sonar system<br />
that produces real-time high resolution three dimensional (3D) maps <strong>of</strong> <strong>the</strong> sea floor while providing<br />
co-registered simultaneous side scan and bathymetric data. The 4600 uses eight receive element<br />
transducers and one discrete transmit element in a pair <strong>of</strong> transducer heads. The high number <strong>of</strong><br />
channels enables enhanced rejection <strong>of</strong> multi-path effects, reverberation and acoustic noise, and<br />
EdgeTech’s Full Spectrum® processing techniques also provide a denser data set in <strong>the</strong> nadir region<br />
1/6
compared to o<strong>the</strong>r interferometric systems, meeting IHO SP-44, NOAA and USACE specifications for<br />
feature detection.<br />
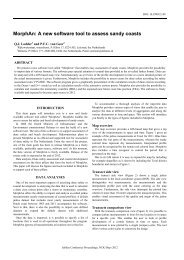
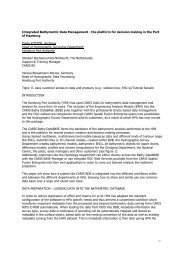
On 17th-19th January 2012 a survey data set was collected using a 540 kHz EdgeTech 4600 deployed<br />
on a retractable bow pole mount on <strong>the</strong> US Army Corps <strong>of</strong> Engineers trailerable Survey Boat SB-32.<br />
Figure1 : Survey vessel and bow mount EdgeTech 4600 (left: retracted for transport, right: deployed<br />
for survey).<br />
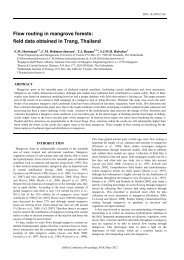
Repeat surveys were run over a dredged navigation depth (~10m) area in <strong>the</strong> intercoastal waterway<br />
near Lake Worth Inlet, Palm Beach FL, with <strong>the</strong> aim <strong>of</strong> generating reference bathymetric surfaces and<br />
reference test lines. The area chosen was <strong>the</strong> nominally flat turning basin <strong>of</strong> Palm Beach Harbour in<br />
West Palm Beach, Florida, which was sheltered from swell and wea<strong>the</strong>r and was <strong>of</strong> sufficient size to<br />
allow orthogonal sets <strong>of</strong> 200 meter lines at 30m spacing. A patch test area to <strong>the</strong> SW <strong>of</strong> <strong>the</strong> survey<br />
area was identified which had a flat area and a channel edge to enable roll, pitch, yaw and latency<br />
calibrations.<br />
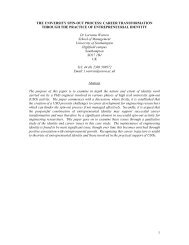
When setting up <strong>the</strong> data collection for <strong>the</strong> reference surface it is important to pay meticulous<br />
attention to detail, measuring accurate equipment <strong>of</strong>fsets and system calibrations. Accurate and<br />
frequent sound velocity pr<strong>of</strong>iles are also important to minimise raybending errors in <strong>the</strong> final surface,<br />
and repeated patch tests were carried out to check <strong>the</strong> consistency <strong>of</strong> <strong>the</strong> system calibrations.<br />
Figure 2: The survey area showing <strong>the</strong> reference surface lines (30m spacing) and SV dips.<br />
2/6
The sonar electronics and arrays for <strong>the</strong> 4600 were mounted onto a streamlined tow body that was<br />
deployed over <strong>the</strong> bow <strong>of</strong> <strong>the</strong> survey vessel via a pole. Alternatively, <strong>the</strong> sonar can be hull-mounted,<br />
mounted on a side pole, used as a towed system, or configured for ROV or AUV deployment. The<br />
standard configuration for <strong>the</strong> 4600 includes an integrated sound velocity sensor and <strong>the</strong>re are<br />
interfaces for standard GPS, MRU, SVP, CTD, Altimeters and Gyros. Data is transferred from <strong>the</strong><br />
transceiver at <strong>the</strong> sonar head to <strong>the</strong> processing unit in <strong>the</strong> survey cabin via E<strong>the</strong>rnet. In <strong>the</strong> Palm<br />
Beach tests a POS-MV from Applanix was used for position and attitude, with <strong>the</strong> POS applying leverarm<br />
corrections from <strong>the</strong> GPS and IMU to <strong>the</strong> transducer head. While <strong>the</strong> real-time survey data was<br />
collected using predicted tides, <strong>the</strong> height control in final processing was achieved using POSPac PPK<br />
(postprocessed kinematic) GPS data (supplied by Kevin Smith <strong>of</strong> US Army Corps <strong>of</strong> Engineers).<br />
The data was collected using EdgeTech’s Discover 4600 s<strong>of</strong>tware and Hypack Hysweep Multibeam,<br />
which has a real-time interface for collecting 4600 inteferometric data. Postprocessing was carried<br />
out in <strong>the</strong> <strong>of</strong>fice using Hypack Hysweep Editor (also known and MBMax). The 4600 also interfaces to<br />
many o<strong>the</strong>r 3rd party acquisition and processing s<strong>of</strong>tware packages.<br />
The data from each survey line was processed and filtered separately to remove outliers and water<br />
column hits (for example wakes and fish). Although <strong>the</strong> system is capable <strong>of</strong> collecting data from a<br />
swath <strong>of</strong> over 12 times water depth, <strong>the</strong> total swath width for <strong>the</strong> reference surface was limited to 6<br />
times water depth in order to retain only <strong>the</strong> cleanest data. Care was taken to visually inspect <strong>the</strong><br />
lines to check for outliers, blunders and bad data, and cross-check lines against each o<strong>the</strong>r to identify<br />
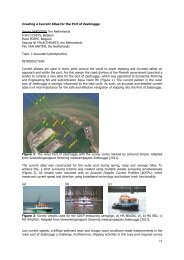
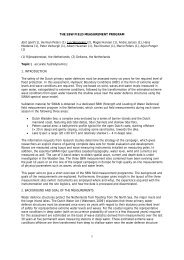
and eliminate calibration and <strong>of</strong>fset errors. The full filtered data from all <strong>the</strong> reference lines were <strong>the</strong>n<br />
combined to create a cleaned reference surface. This was binned by averaging to a cell size <strong>of</strong> 0.5m x<br />
0.5m for export as a final digital terrain model (DTM).<br />
Figure 3: The reference surface (250m x 250m), 0.5m bins (0.5m contours shown).<br />
3/6
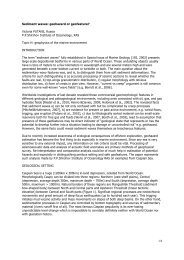
The same data collection and processing was carried out for <strong>the</strong> individual test lines and again <strong>the</strong>se<br />
were binned to 0.5m x 0.5m for comparison with <strong>the</strong> reference surface. A grid <strong>of</strong> <strong>the</strong> differences<br />
between <strong>the</strong> reference surface depths and <strong>the</strong> test line depths was created, and multiple cross pr<strong>of</strong>iles<br />
were taken orthogonal to <strong>the</strong> boat heading along this line. Cross pr<strong>of</strong>iles were spaced by 5m and over<br />
40 pr<strong>of</strong>iles were taken in order to generate <strong>the</strong> statistics for analysis.<br />
Figure 4: 3D sun-illuminated view <strong>of</strong> a 250m test line (filtered to 60m swath), colour scale as Fig.3<br />
Results<br />
The above process gave a set <strong>of</strong> pr<strong>of</strong>iles across <strong>the</strong> test swath which showed <strong>the</strong> difference between<br />
<strong>the</strong> test line depth and <strong>the</strong> reference surface. These pr<strong>of</strong>iles were analysed to find <strong>the</strong> mean and<br />
standard deviation <strong>of</strong> <strong>the</strong> differences between <strong>the</strong> test line and reference surface as a function <strong>of</strong><br />
position across <strong>the</strong> swath. The mean difference shows <strong>the</strong> depth residual, or static <strong>of</strong>fset, and <strong>the</strong><br />
standard deviation is a measure <strong>of</strong> <strong>the</strong> bin-to-bin repeatability <strong>of</strong> depths at that swath position. The<br />
plots are shown in Figure 5, for <strong>the</strong> centre portion <strong>of</strong> <strong>the</strong> swath limited to 6 x water depth (60m<br />
swath), and Figure 6, which shows a 150m swath, roughly <strong>the</strong> limit beyond which <strong>the</strong> signal<br />
amplitude is too small to reliably provide a bathymetric solution in <strong>the</strong> depths and environmental<br />
conditions found here. Note that in order to aid comparison with hydrographic standards <strong>the</strong> error<br />
bars show 2 standard deviations above and below <strong>the</strong> mean, which corresponds to <strong>the</strong> 95%<br />
confidence level.<br />
Figure 5: Mean depth residuals across <strong>the</strong> swath (60m swath), error bars show 95% confidence<br />
level.<br />
4/6
Figure 6: Mean depth residuals across a 150m swath. Error bars show 95% confidence level.<br />
Discussion<br />
The mean depth residuals are considered to represent systematic errors or biases in <strong>the</strong> depth results.<br />
The standard deviations are caused by random error sources from <strong>the</strong> sonar combined with o<strong>the</strong>r<br />
dynamic error sources which change rapidly over <strong>the</strong> time taken to collect <strong>the</strong> test line (~100s).<br />
Several features are apparent from <strong>the</strong> plots:<br />
(1) The depth consistency <strong>of</strong> <strong>the</strong> test line is within IHO special order standards (Total Vertical<br />
<strong>Uncertainty</strong> <strong>of</strong> 25cm at <strong>the</strong> 95% confidence level) out to a 50m swath, and only just exceeds this on<br />
<strong>the</strong> port side out to a 60m swath. It is within Order 1a (0.5m) out to a 100m swath (10 x water<br />
depth).<br />
(2) The mean depth residual in Figure 5 is in places greater than <strong>the</strong> random errors, showing that<br />
<strong>the</strong>re are consistent systematic variations in depth across <strong>the</strong> swath. The variation in <strong>the</strong> mean depth<br />
residual is smoothly varying over <strong>the</strong> swath. This error is likely to be from minor deviations <strong>of</strong> <strong>the</strong><br />
stave spacings in <strong>the</strong> transducer head from <strong>the</strong> calibrated values used in <strong>the</strong> angle determination<br />
algorithms, and could be improved in future. It is worth noting here that <strong>the</strong> EdgeTech 4600 system<br />
used to acquire <strong>the</strong> data was an early prototype model. The asymmetrical results presented in<br />
Figures 5 and 6 led to an extensive study on both <strong>the</strong> port and starboard transducers. The results<br />
proved that <strong>the</strong> port transducer had one displaced element among <strong>the</strong> eight, which contributed to <strong>the</strong><br />
increase in mean depth residuals across <strong>the</strong> swath.<br />
(3) The centre <strong>of</strong> <strong>the</strong> swath shows a distinct ridge at nadir, which results in a ’track’ in <strong>the</strong> survey<br />
(visible in Figure 4). This is suspected to be an effect <strong>of</strong> multipath as <strong>the</strong> sea was calm during <strong>the</strong><br />
survey and <strong>the</strong> transducers were mounted near <strong>the</strong> surface.<br />
(4) The outer edges <strong>of</strong> <strong>the</strong> swath (beyond about 60m, or a total <strong>of</strong> 12 x water depth) show systematic<br />
deviation below (port) and above (starboard) <strong>the</strong> mean. This is probably caused by a combination <strong>of</strong><br />
two factors: limits in <strong>the</strong> accuracy <strong>of</strong> <strong>the</strong> roll calibration and errors in <strong>the</strong> sound velocity ray-bending<br />
corrections at extreme shallow angles.<br />
(5) Beyond about 70m from nadir <strong>the</strong> random error (at <strong>the</strong> 95% confidence level) rises to over 1m,<br />
showing <strong>the</strong> limits <strong>of</strong> swath width achievable using <strong>the</strong> 4600 technology in this environment.<br />
The data used to generate <strong>the</strong> above plots will have many sources <strong>of</strong> error included, both from <strong>the</strong><br />
sonar and <strong>the</strong> ancillary equipment, so can be considered as a reasonable proxy for <strong>the</strong> total<br />
5/6
propagated errors <strong>of</strong> <strong>the</strong> survey system. These plots will be expected to overestimate <strong>the</strong> TVU<br />
contribution from <strong>the</strong> sonar alone. However some static and slowly varying errors will be common to<br />
both <strong>the</strong> reference surface and <strong>the</strong> test line; <strong>the</strong>se will be invisible to <strong>the</strong> above analysis. These will<br />
include errors in <strong>the</strong> static vertical <strong>of</strong>fset from <strong>the</strong> GPS antenna to transducers and slowly varying GPS<br />
height and position errors. Comparison with reference surfaces collected using different equipment<br />
would be useful in estimating <strong>the</strong>se errors.<br />
Conclusion<br />
The Edgetech 4600 sonar system was tested in 10m water depth and <strong>the</strong> data consistency between a<br />
reference surface and a test line was within IHO Special Order specifications to a swath width <strong>of</strong> 5 x<br />
water depth. The data was within IHO Order 1a specifications to 10 x water depth, and useful 0.5m<br />
binned survey data was available to 12 x water depth. The shape <strong>of</strong> <strong>the</strong> mean depth residuals<br />
compared with <strong>the</strong> magnitude <strong>of</strong> <strong>the</strong> random errors indicates that more could be done to reduce<br />
systematic error sources, including a displaced element that was later found in one <strong>of</strong> <strong>the</strong> transducers,<br />
showing that this technology could achieve greater accuracy in future. The statistical analysis<br />
techniques applied here provided valuable information about sonar performance and helped measure<br />
<strong>the</strong> data quality that can be obtained from <strong>the</strong> sonar system. The total vertical uncertainty values<br />
obtained will help inform sonar use and aid in <strong>the</strong> use <strong>of</strong> advanced postprocessing algorithms with this<br />
data.<br />
References<br />
de Moustier, C., (2001). ”Field Evaluation <strong>of</strong> Sounding Accuracy in Deep Water Multi-Beam Swath<br />
Bathymetry”, MTS Oceans Conference 2001.<br />
Wittaker, C., Sebastian, S., Fabre, D.H., (2011). ”Multibeam Sonar Performance Analysis Value and<br />
Use <strong>of</strong> Statistical Techniques”, International Hydrographic Review, No 5, pps 52-65, May 2011.<br />
Author Biographies<br />
Dr. Thomas Hiller obtained his PhD in experimental physics in <strong>the</strong> semiconductor sector, becoming<br />
involved with marine sonars in 1998 at Submetrix Ltd. He has managed interferometric sonar product<br />
lines at three different sonar manufacturers, including six years as Advanced Products Manager at<br />
GeoAcoustics Ltd. In 2011 Tom set up Thurne Hydrographic Limited to provide engineering<br />
consultancy, marketing representation, and survey support to <strong>the</strong> worldwide hydrographic industry.<br />
Ms. Lisa N. Brisson is a Project Engineer at EdgeTech with experience in Underwater Acoustics and<br />
Hydrographic Surveying. Lisa graduated with a B.S. in Ocean Engineering in 2009 from Florida<br />
Atlantic University. After graduation, she continued her studies <strong>the</strong>re and developed a detection and<br />
classification algorithm for forward look sonars, and later graduated with a M.S. in Ocean Engineering<br />
in 2010. Following that she joined EdgeTech and was involved in <strong>the</strong> design and development <strong>of</strong> an<br />
interferometric side scan sonar. Currently, she has been installing, testing, and providing training for<br />
hydrographic systems.<br />
Wright, Steven – Director <strong>of</strong> Technology Development: Mr. Steven Wright holds a Bachelor <strong>of</strong> Science<br />
degree in Electronic Engineering with 30 years experience in sonar systems development. He has<br />
managed <strong>the</strong> development <strong>of</strong> Airborne SAR and Radarsat data processors while at MacDonald<br />
Detwiler and Associates in Canada. He has overseen new product R&D and sonar technology<br />
development at Kongsberg Mesotech in Canada, and he has been working at EdgeTech for <strong>the</strong> last 12<br />
years. He also has over 28 years <strong>of</strong> technical management experience in both small and large<br />
companies. Most recently, he has been involved in <strong>the</strong> development <strong>of</strong> compact sonar systems<br />
electronics, transducer arrays and swath bathymetry sonars.<br />
6/6