Determining rock quantities using swathe ... - UT Proceedings
Determining rock quantities using swathe ... - UT Proceedings
Determining rock quantities using swathe ... - UT Proceedings

You also want an ePaper? Increase the reach of your titles
YUMPU automatically turns print PDFs into web optimized ePapers that Google loves.
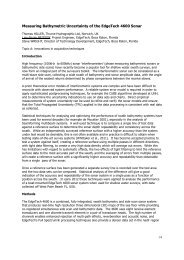
<strong>Determining</strong> <strong>rock</strong> <strong>quantities</strong> <strong>using</strong> <strong>swathe</strong> techniques on Maasvlakte 2<br />
Marnix KOL 1 , Huibert-Jan LEKKERKERK 2 , Eric PEETERS 1 , René ROELS 1 , Tjebbe WESTERBEEK 2<br />
1: PUMA, the Netherlands; 2: Port of Rotterdam, the Netherlands<br />
Topic: Hydrography in te Benelux<br />
INTRODUCTION<br />
For the Maasvlakte 2 extension of the Port of Rotterdam a large amount of <strong>rock</strong> has to be placed<br />
underwater under tight specifications in relatively thin layers. The <strong>rock</strong> is placed both under water as<br />
well as above water. In general measurements above water are performed <strong>using</strong> land survey<br />
equipment and are relatively simple and reliable provided a clear reference level is used. The standard<br />
method for surveying <strong>rock</strong> levels is described in CUR 154 [1991] and requires the use of a semispherical<br />
foot as a reference.<br />
As the semi-spherical foot staff is unusable under water or in the surf zone, echo-sounders are<br />
commonly used here. Experience from various projects has shown that the application of modern<br />
systems for monitoring dumped <strong>rock</strong>, however, can be accompanied by problems. Above water the<br />
application of laser-based techniques is now starting to be used whilst crane measurement systems<br />
are used as an on-the-spot alternative for more advanced survey systems. Each of these systems has<br />
its own specific advantages and disadvantages.<br />
Errors in determining <strong>rock</strong> quantity<br />
One of the most important factors in the construction at Maasvlakte 2 was the determination of the<br />
layer thickness. Possible errors in the surveyed thickness are determined by the following factors:<br />
• Definition of the level of the upper surface of the bed / dumped <strong>rock</strong> to be surveyed in<br />
relation to the (mean) level as measured by the surveying system.<br />
• Influence of settling and compression of the ground and penetration of the dumped materials<br />
into the ground.<br />
• Inaccuracies in the surveying system.<br />
It is important when discussing results to define a reference level to which the results obtained can be<br />
compared. Two (potential) reference levels can be defined: the plane passing through the tops of the<br />
stones and the level as obtained by a semi-sphere survey complying to CUR 154 [1991]. CUR 154<br />
specifies a semi-sphere diameter of 0.5 Dn50 (nominal average stone diameter) and measurements in<br />
1x1 m raster. In general the semi-spherical foot is stated to give a reference level of about 10-15%<br />
below the tops of the stones.<br />
Available research<br />
In an effort to find out more about the interaction between survey systems and the observed bottom,<br />
trials were held in 1999 in Dock VI of the Verolme company in the Botlek at Rotterdam. Initial<br />
conclusions pointed towards lower volumes being detected <strong>using</strong> multibeam surveys than with the<br />
semi-spherical foot [VBKO et al, 1999].<br />
As the <strong>rock</strong> gradations tested in earlier studies were limited and survey techniques have advanced, it<br />
was deemed necessary for the Maasvlakte 2 project to extend these studies. Therefore a test-pit was<br />
constructed at the Maasvlakte 2 where various stone gradations were surveyed <strong>using</strong> a wide variety of<br />
survey methods [Lekkerkerk and Kol, 2011].<br />
SET-UP OF TEST PIT TRIALS<br />
The methodology used in the test-pit trials of 2010 was essentially the same as that of the dock trials<br />
from 1999. The main differences were the stone gradations, scale and survey systems used. The<br />
1/6
dumped <strong>rock</strong> in the dock trials consisted of a layer of 10 - 60 kg <strong>rock</strong> and a layer of40 -200 kg <strong>rock</strong><br />
whereas in the test pit trials layers of 20-135 mm, 5-70 kg, 150-800 kg and 1-10 t of <strong>rock</strong> were<br />
surveyed.<br />
Layers were applied in the dry to a minimum thickness of about 2- 2.5 times the nominal stone<br />
diameter of the gradation concerned. In the dock trials the layers were smoothed; in the test pit trials<br />
the roughness of the bed as expected from dumping (about 2 times the nominal stone diameter) was<br />
simulated <strong>using</strong> a crane. In both situations ‘clean’ <strong>rock</strong> (no foreign inclusions) was used. In the test-pit<br />
four different slopes were created (1:1.5; 1:2; 1:7.5 and ‘flat’ – i.e. < 1:10).<br />
Figure 1: Trial set-up in the test-pit at the Maasvlakte port extension with 20-135 mm (including 4<br />
objects), 5-70kg, 150-800 kg and 1-10t gradations. Inset: Trial set-up in the Verolme dock (1999).<br />
Survey systems used<br />
After construction, the stone layers were surveyed <strong>using</strong> a variety of dry survey techniques. The<br />
following survey systems were used for the dry surveys:<br />
- land survey point measurements with level pole<br />
- semi-spherical foot staff. Diameter calculated from CUR 154 [CUR/CIRIA, 1991] based on<br />
nominal stone gradation.<br />
- plate measurements with a minimum dimension of around 4xDn50 2 resulting in a 1x1 m plate<br />
for all gradations except 1-10 t and a 2x2 m plate for 1-10 t.<br />
- crane monitoring measurements <strong>using</strong> a variety of grabs and buckets fitted to the crane<br />
- static laser measurements (single system) from a total of six positions around the test pit<br />
- mobile laser measurements from both a crane <strong>using</strong> an inexpensive type of industrial laser as<br />
well as from a helicopter <strong>using</strong> the Fli-map system<br />
Subsequently the test-pit was flooded and surveyed <strong>using</strong> ‘wet’ equipment mounted on a small survey<br />
vessel. The wet surveys were performed with the equipment at a height of around 4 and 6 meters<br />
above the test beds. The following systems were tested:<br />
- single-beam system with different beam angles. Long- and cross line pattern with line spacing<br />
of 5 meters.<br />
- multi-beam with most common shallow water systems. Swath reduced to 45° either side of<br />
the normal (90° in total). Lines sailed with 100% overlap [Lekkerkerk and Theijs, 2011].<br />
- echoscope with 50° x 50° swath angles at both normal and high frequency<br />
Processing<br />
The data from the swath systems (full coverage) was averaged in a regular 1x1 m grid aligned with<br />
the test pit. The resulting average is then compared with the point survey result taken at the centre of<br />
that same grid cell. This results in a deviation between the two survey results which is then<br />
statistically processed.<br />
2/6
RESULTS<br />
The results from the test pit surveys can be described in a qualitative as well as a quantitative<br />
manner. In practice the qualitative results need to be translated into survey procedures where the<br />
quantitative results result in corrections to the surveyed levels.<br />
Quantitative results<br />
Table 1 shows the results of the test pit trials in relation to the semi-spherical foot as reference. The<br />
results were surveyed and computed in 1x1 m 2 grid cells to allow for direct comparisons between the<br />
systems. The results shown are the average for those obtained from the horizontal and 1:7.5 slope.<br />
Table 1: Results obtained in the test pit trials with the semi-sphere as reference (1x1 m grid)., All<br />
values in [m], a negative systematic error denotes that the measured value is below the reference<br />
level. Note 1: Values for 2x1.2 m bucket with bucket closed and edge parallel to plane of slope. Note<br />
2: grab Ø 2.5 m and grab closed<br />
Survey System Sand 20-135 mm 5 - 70 kg 150 - 800 kg 1 - 10 t<br />
Systematic<br />
Error<br />
Precision<br />
Systematic<br />
Error<br />
Precision<br />
Systematic<br />
Error<br />
Precision<br />
Systematic<br />
Error<br />
Precision<br />
Systematic<br />
Error<br />
Precision<br />
Total station – plate n.a. n.a. 0.07 0.08 0.12 0.09 0.14 0.15 0.11 0.17<br />
Total station – point n.a. n.a. n.a. n.a. -0.07 0.07 -0.13 0.19 -0.27 0.51<br />
Excavator – bucket 1 n.a. n.a. 0.17 0.13 0.14 0.15 0.34 0.27 0.32 0.40<br />
Excavator - orange peel 2 n.a. n.a. 0.17 n.a. 0.08 0.11 0.18 0.21 0.20 0.36<br />
Excavator – sorting n.a. n.a. n.a. n.a. n.a. n.a. 0.14 0.22 0.18 0.32<br />
Single-beam 0.01 0.03 0.08 0.08 0.08 0.11 0.09 0.18 0.06 0.26<br />
Multi-beam / Echo-scope -0.01 0.02 -0.03 0.06 -0.11 0.09 -0.19 0.15 -0.38 0.26<br />
Static laser -0.01 0.05 -0.01 0.06 -0.04 0.10 -0.05 0.15 -0.18 0.23<br />
Crane based laser 0.02 0.05 0.04 0.07 -0.01 0.10 -0.08 0.15 -0.25 0.24<br />
Fli-map laser 0.00 0.06 -0.06 0.09 -0.12 0.10 -0.17 0.18 -0.36 0.27<br />
The measurements as presented in Table 1 were also computed with a 1x1 plate as reference. Figure<br />
2 allows the determination of the systematic error for the plate as well as for the semi-spherical foot.<br />
Standard deviation when <strong>using</strong> the plate as reference was found to be smaller than with the semispherical<br />
foot.<br />
Figure 2: Systematic errors for the non-excavator systems based on Table 1.<br />
3/6
Qualitative results<br />
Besides the quantitative results from the table, the following qualitative results were also found and<br />
need to be taken into account when surveying stones:<br />
- When <strong>using</strong> a crane monitoring system, special attention should be given to bucket size and<br />
shape as well as to a well-defined measurement protocol resulting in the bucket / grab always<br />
being placed in the same orientation (longest dimension transverse to average slope<br />
direction) and in the same condition (opened / closed)<br />
- Surveys on the stones done <strong>using</strong> either multibeam or laser systems require a certain degree<br />
of (manual) editing and filtering as a high number of spikes may exist in the data when<br />
compared to surveys on sand / filter layers<br />
- The precision of some multibeam systems degrades in very shallow water (< 2 meter below<br />
the transducer); it is suggested that this is a result of the beam forming processes which<br />
requires a minimum water depth to take place fully. The effect becomes more pronounced<br />
with a greater stone diameter<br />
- Surveys with the crane monitoring system produced each time the largest mean layer<br />
thickness as well as the largest values for the precision. The mean bed level surveyed by this<br />
system lies above both references when <strong>using</strong> a bucket as crane tool. Results vary with the<br />
size and type of bucket / grab used.<br />
- Surveys with the multibeam and laser systems, on average, produced the lowest layer<br />
thicknesses.<br />
Multibeam reults in more detail<br />
The results of both the dock and test pit trials for the multibeam system in a 1x1 meter cell size are<br />
displayed in Figure 3 and show a good comparison between both trials. The graphs for the dock trials<br />
and test pit trials show a deviation from the trend line established at around a Dn50 of 0.25 meter.<br />
0.2<br />
confidence level 2.5% (m) = -0.03Dn50 + 0.114<br />
0.0<br />
Hemisphere - multibeam (1x1 m grid, m)<br />
-0.2<br />
-0.4<br />
-0.6<br />
-0.8<br />
Dock trials<br />
average systematic error<br />
2σ + = 0.27Dn50 + 0.114<br />
2σ - = -0.33Dn50 - 0.164<br />
test pit trials<br />
average systematic error (m) = -0.30Dn50<br />
confidence level 97.5% (m) = -0.63 Dn50 - 0.164<br />
-1.0<br />
0.0 0.2 0.4 0.6 0.8 1.0 1.2 1.4<br />
Dn50 (m)<br />
Figure 3: Results of systematic error and precision resulting from both dock and test pit trials in a<br />
1x1 m grid.<br />
4/6
DISCUSSION OF RESULTS<br />
Based on the accumulated data both systematic error and precision for a multi-beam system seem to<br />
behave according to a common formula which depends on the stone diameter, slope and reference<br />
method. It should be specifically noted that the formula's given below are only valid for surveys with a<br />
high quality survey system (both good quality for the sounding system as well as good quality of<br />
operations) and are valid for clean stone (no foreign inclusions). In the situation where different<br />
conditions are found, additional tests are required to establish the correct values.<br />
Systematic error<br />
Based on the results from both the test-pit and the dock trials formula 1 is proposed for the<br />
computation of the systematic error of multi beam <strong>swathe</strong> systems.<br />
Esyst = -s1 * D N50 - 0.01 * (10 - sg) * D N50 (1)<br />
with:<br />
Esyst Systematic error between average level as determined by reference survey and multi<br />
beam echo-sounder survey [m]<br />
D N50 Nominal stone diameter for the 50% mass fraction [m]<br />
s1 Error factor.<br />
sg Slope gradient (e.g. 2 in a 1 vertical :2 horizontal slope) for slopes steeper than 1:10<br />
The error factor depends on reference level and survey system used; as a rule of thumb, for multi<br />
beam systems this varies between 0.29 and 0.33 for the semi-sphere as reference and around 0.52<br />
for a plate reference as derived from the tests. Based on these results the systematic error is relatively<br />
large in comparison to generally accepted construction accuracies for the placement <strong>rock</strong> under water.<br />
Around a Dn50 of 0.25 meter (10 - 60 / 5 - 70 kg) an interaction between the multi beam and the<br />
stone layer seems to be occurring which has not yet been explained but could be the result of an<br />
interaction with the beam angle of the systems.<br />
Precision<br />
The precision expressed as the standard deviation of the layer thicknesses measured with the various<br />
survey systems appears to show a linear relationship with the D N50 of the sounded crushed stone.<br />
Formula 2 is proposed as a generic formula for computing the precision.<br />
σ = ±1/√N . (1 + 2 ∗ ) (2)<br />
with:<br />
σ N precision at 68% confidence limits in a N m 2 gridcell [m]<br />
p1 1 basic precision of the survey system in a 1x1 meter grid [m]<br />
p2 1 precision influence due to roughness of the bed in a 1x1 m grid [m]<br />
D N50 Nominal stone diameter for the 50% mass fraction [m]<br />
N number of 1x1 m 2 cells in a N m 2 grid cell (i.e. 4 for a 2x2 m grid cell)<br />
For multibeam systems p1 can be determined during calibration measurements on a flat, smooth<br />
bottom such as a dock floor or flat sandy bottom. For various multibeam systems this constant was<br />
found to be around 0.03 m. For laser systems the results can, in general, be expected to be better.<br />
The value p2 was derived in the tests and was found to be between 0.26 and 0.33 for multibeam<br />
systems when <strong>using</strong> the semi-sphere as a reference level.<br />
The values of p2 are relatively large compared to generally accepted construction accuracies. During<br />
surveys with multibeam systems not only the systematic survey error, but also the random survey<br />
error can have a role of great significance upon the determination of <strong>rock</strong> levels.<br />
5/6
CONCLUSION<br />
It may be deduced from the results of both trials that the use of echo-sounding systems when<br />
surveying underwater dumped stone areas will be accompanied by relatively large systematic and<br />
random survey errors. This applies particularly to surveys with multi beam systems. The errors can be<br />
so large that actual construction inaccuracies on the micro level cannot be directly shown and that<br />
corrections need to be applied for showing construction inaccuracies on the macro level.<br />
In general it can be said that the errors will increase with increasing nominal stone diameter. The<br />
systematic error when <strong>using</strong> the top of the stones (plate) is larger than when <strong>using</strong> the semi-sphere<br />
as a reference. The precision of plate measurements was however found to be better when <strong>using</strong> the<br />
plate as reference.<br />
More background as well as the results presented in this article as well as more details on the<br />
surveying of <strong>rock</strong> <strong>quantities</strong> in general is to be published as a CUR / CIRIA report.<br />
REFERENCES<br />
CUR/CIRIA. 1991. Manual on Use of Rock in Coastal Engineering. Gouda: CUR / CIRIA.<br />
Lekkerkerk, H-J., and M.J.Theijs. 2011. Handbook of Offshore Surveying volumes 1-3. Voorschoten:<br />
Skilltrade.<br />
Lekkerkerk, H-J., and M. Kol. 2011. Onderzoeksrapport testgoot MV2. Rotterdam: Port of Rotterdam /<br />
PUMA.<br />
VBKO et al. 1999. Een onderzoek naar hoogteligging breuksteen met multi- en singlebeam echosounders.<br />
Gemeentewerken Rotterdam / Baggermaatschappij Boskalis / Rijkswaterstaat / Vereniging<br />
van waterbouwers in bagger-, kust- en oeverwerken.<br />
BIOGRAPHIES<br />
Marnix Kol received his degree in Hydrography (A) from the Nautical College in Amsterdam. He has<br />
worked van Oord on various international projects as a hydrographic surveyor.<br />
Huibert-Jan Lekkerkerk received his degrees in both Hydrography (A) and Maritime Electronics from<br />
Nautical College in Amsterdam. He has worked as client representative / consultant on various large<br />
projects, is author of a number of surveying books and teaches hydrography at Skilltrade.<br />
Eric Peeters received his degree in Hydrography (A) from the Nautical College in Amsterdam. He has<br />
worked van Oord on various international projects as a hydrographic surveyor.<br />
René Roels is employed by van Oord and has worked as civil engeineer specializing in <strong>rock</strong> placement<br />
on a number of projects including the Maasvlakte 2 extension and the <strong>rock</strong> layer St. Andries.<br />
Tjebbe Westerbeek works as a hydrographic surveyor / client representative for the Port of<br />
Rotterdam. He received his degree in Hydrography (B) from Skilltrade.<br />
CONTACT DETAILS (of corresponding author only)<br />
Huibert-Jan LEKKERKERK<br />
Institution: Port of Rotterdam<br />
Address: p/a Galjoen 01-34; 8243 MJ; Lelystad; the Netherlands<br />
Tel.: +31653747717 / Email: h.lekkerkerk@portofrotterdam.com<br />
Web site: www.portofrotterdam.com / LinkedIn account: www.linkedin.com/in/hydrografie<br />
6/6