Determining rock quantities using swathe ... - UT Proceedings
Determining rock quantities using swathe ... - UT Proceedings
Determining rock quantities using swathe ... - UT Proceedings

Create successful ePaper yourself
Turn your PDF publications into a flip-book with our unique Google optimized e-Paper software.
dumped <strong>rock</strong> in the dock trials consisted of a layer of 10 - 60 kg <strong>rock</strong> and a layer of40 -200 kg <strong>rock</strong><br />
whereas in the test pit trials layers of 20-135 mm, 5-70 kg, 150-800 kg and 1-10 t of <strong>rock</strong> were<br />
surveyed.<br />
Layers were applied in the dry to a minimum thickness of about 2- 2.5 times the nominal stone<br />
diameter of the gradation concerned. In the dock trials the layers were smoothed; in the test pit trials<br />
the roughness of the bed as expected from dumping (about 2 times the nominal stone diameter) was<br />
simulated <strong>using</strong> a crane. In both situations ‘clean’ <strong>rock</strong> (no foreign inclusions) was used. In the test-pit<br />
four different slopes were created (1:1.5; 1:2; 1:7.5 and ‘flat’ – i.e. < 1:10).<br />
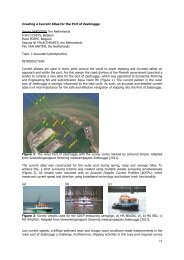
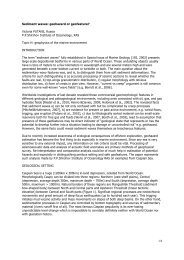
Figure 1: Trial set-up in the test-pit at the Maasvlakte port extension with 20-135 mm (including 4<br />
objects), 5-70kg, 150-800 kg and 1-10t gradations. Inset: Trial set-up in the Verolme dock (1999).<br />
Survey systems used<br />
After construction, the stone layers were surveyed <strong>using</strong> a variety of dry survey techniques. The<br />
following survey systems were used for the dry surveys:<br />
- land survey point measurements with level pole<br />
- semi-spherical foot staff. Diameter calculated from CUR 154 [CUR/CIRIA, 1991] based on<br />
nominal stone gradation.<br />
- plate measurements with a minimum dimension of around 4xDn50 2 resulting in a 1x1 m plate<br />
for all gradations except 1-10 t and a 2x2 m plate for 1-10 t.<br />
- crane monitoring measurements <strong>using</strong> a variety of grabs and buckets fitted to the crane<br />
- static laser measurements (single system) from a total of six positions around the test pit<br />
- mobile laser measurements from both a crane <strong>using</strong> an inexpensive type of industrial laser as<br />
well as from a helicopter <strong>using</strong> the Fli-map system<br />
Subsequently the test-pit was flooded and surveyed <strong>using</strong> ‘wet’ equipment mounted on a small survey<br />
vessel. The wet surveys were performed with the equipment at a height of around 4 and 6 meters<br />
above the test beds. The following systems were tested:<br />
- single-beam system with different beam angles. Long- and cross line pattern with line spacing<br />
of 5 meters.<br />
- multi-beam with most common shallow water systems. Swath reduced to 45° either side of<br />
the normal (90° in total). Lines sailed with 100% overlap [Lekkerkerk and Theijs, 2011].<br />
- echoscope with 50° x 50° swath angles at both normal and high frequency<br />
Processing<br />
The data from the swath systems (full coverage) was averaged in a regular 1x1 m grid aligned with<br />
the test pit. The resulting average is then compared with the point survey result taken at the centre of<br />
that same grid cell. This results in a deviation between the two survey results which is then<br />
statistically processed.<br />
2/6