RACING PIGEONS â IMPACT OF RAPTOR PREDATION
RACING PIGEONS â IMPACT OF RAPTOR PREDATION
RACING PIGEONS â IMPACT OF RAPTOR PREDATION

Create successful ePaper yourself
Turn your PDF publications into a flip-book with our unique Google optimized e-Paper software.
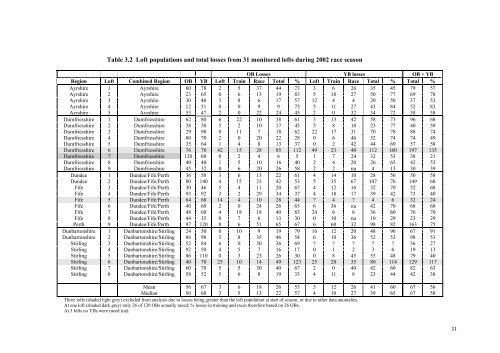
Table 3.2 Loft populations and total losses from 31 monitored lofts during 2002 race season<br />
OB Losses YB losses OB + YB<br />
Region Loft Combined Region OB YB Loft Train Race Total % Loft Train Race Total % Total %<br />
Ayrshire 1 Ayrshire 60 78 2 5 37 44 73 3 6 26 35 45 79 57<br />
Ayrshire 2 Ayrshire 23 65 0 6 13 19 83 5 18 27 50 77 69 78<br />
Ayrshire 3 Ayrshire 30 40 3 8 6 17 57 12 4 4 20 50 37 53<br />
Ayrshire 4 Ayrshire 12 51 0 0 9 9 75 5 11 27 43 84 52 83<br />
Ayrshire 5 Ayrshire 53 47 2 0 22 24 45 2 0 32 34 72 58 58<br />
Dumfriesshire 1 Dumfriesshire 62 80 6 22 10 38 61 3 13 42 58 73 96 68<br />
Dumfriesshire 2 Dumfriesshire 38 30 5 2 10 17 45 5 8 10 23 77 40 59<br />
Dumfriesshire 3 Dumfriesshire 29 90 0 11 7 18 62 22 17 31 70 78 88 74<br />
Dumfriesshire 4 Dumfriesshire 80 70 2 0 20 22 28 0 6 46 52 74 74 49<br />
Dumfriesshire 5 Dumfriesshire 35 64 1 4 8 13 37 0 2 42 44 69 57 58<br />
Dumfriesshire 6 Dumfriesshire 76 70 42 15 28 85 112 49 23 40 112 160 197 135<br />
Dumfriesshire 7 Dumfriesshire 120 60 0 2 4 6 5 1 7 24 32 53 38 21<br />
Dumfriesshire 8 Dumfriesshire 40 40 1 5 10 16 40 2 4 20 26 65 42 53<br />
Dumfriesshire 9 Dumfriesshire 45 32 0 6 20 26 58 2 2 na 4 13 30 39<br />
Dundee 1 Dundee/Fife/Perth 36 50 3 6 13 22 61 4 14 10 28 56 50 58<br />
Dundee 2 Dundee/Fife/Perth 80 140 4 15 23 42 53 5 35 67 107 76 149 68<br />
Fife 3 Dundee/Fife/Perth 30 46 5 4 11 20 67 4 12 16 32 70 52 68<br />
Fife 4 Dundee/Fife/Perth 93 92 3 2 29 34 37 4 18 17 39 42 73 40<br />
Fife 5 Dundee/Fife/Perth 64 68 14 4 10 28 44 ? 4 ? 4 6 32 24<br />
Fife 6 Dundee/Fife/Perth 40 60 2 0 24 26 65 6 36 na 42 70 68 68<br />
Fife 7 Dundee/Fife/Perth 48 60 4 18 18 40 83 24 6 6 36 60 76 70<br />
Fife 8 Dundee/Fife/Perth 44 35 0 7 6 13 30 0 10 na 10 29 23 29<br />
Perth 9 Dundee/Fife/Perth 97 120 8 6 51 65 67 6 60 32 98 82 163 75<br />
Dunbartonshire 1 Dunbartonshire/Stirling 24 50 0 10 9 19 79 16 12 20 48 96 67 91<br />
Dunbartonshire 2 Dunbartonshire/Stirling 86 98 3 8 35 46 54 6 10 36 52 53 98 53<br />
Stirling 3 Dunbartonshire/Stirling 52 84 6 0 30 36 69 ? ? ? ? ? 36 27<br />
Stirling 4 Dunbartonshire/Stirling 92 50 4 5 7 16 17 0 1 2 3 6 19 13<br />
Stirling 5 Dunbartonshire/Stirling 86 110 0 3 23 26 30 0 8 45 53 48 79 40<br />
Stirling 6 Dunbartonshire/Stirling 40 70 25 10 14 49 123 25 20 35 80 114 129 117<br />
Stirling 7 Dunbartonshire/Stirling 60 70 5 5 30 40 67 2 0 40 42 60 82 63<br />
Stirling 8 Dunbartonshire/Stirling 58 52 5 6 8 19 33 4 11 8 23 44 42 38<br />
Mean 56 67 3 6 18 26 53 5 12 26 41 60 67 56<br />
Median 50 60 3 5 13 22 57 4 10 27 39 65 67 58<br />
Three lofts (shaded light grey) excluded from analysis due to losses being greater than the loft population at start of season, or due to other data anomalies.<br />
At one loft (shaded dark grey) only 26 of 120 OBs actually raced; % losses in training and races therefore based on 26 OBs.<br />
At 3 lofts no YBs were raced (na).<br />
31