NetArch - Lab nË5 - LIP6
NetArch - Lab nË5 - LIP6
NetArch - Lab nË5 - LIP6

You also want an ePaper? Increase the reach of your titles
YUMPU automatically turns print PDFs into web optimized ePapers that Google loves.
Master Informatique <strong>NetArch</strong> Network Architecture<br />
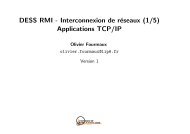
<strong>NetArch</strong> - <strong>Lab</strong> n˚5<br />
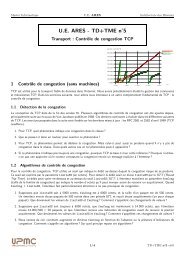
Transport Layer (2) : TCP Congestion Control<br />
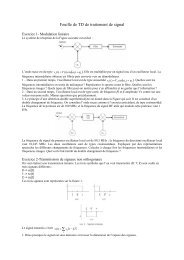
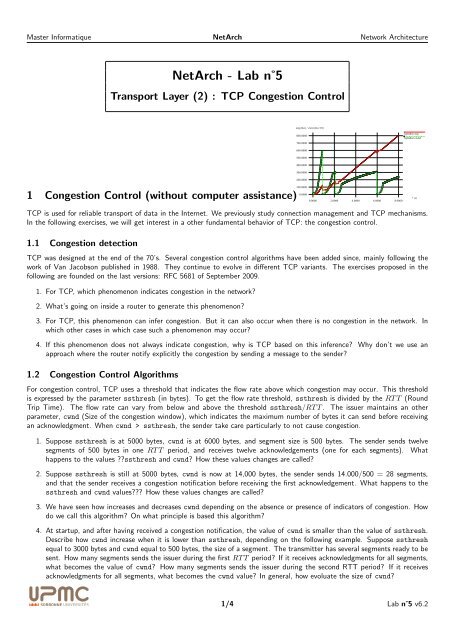
seq (Ko) / cwin (Ko/10)<br />
800.0000<br />
700.0000<br />
tcptahoe.seq<br />
tcptahoe.cwnd<br />
600.0000<br />
500.0000<br />
400.0000<br />
300.0000<br />
200.0000<br />
1 Congestion Control (without computer assistance)<br />
100.0000<br />
0.0000<br />
0.0000 2.0000 4.0000 6.0000 8.0000<br />
t<br />
(s)<br />
TCP is used for reliable transport of data in the Internet. We previously study connection management and TCP mechanisms.<br />
In the following exercises, we will get interest in a other fundamental behavior of TCP: the congestion control.<br />
1.1 Congestion detection<br />
TCP was designed at the end of the 70’s. Several congestion control algorithms have been added since, mainly following the<br />
work of Van Jacobson published in 1988. They continue to evolve in different TCP variants. The exercises proposed in the<br />
following are founded on the last versions: RFC 5681 of September 2009.<br />
1. For TCP, which phenomenon indicates congestion in the network?<br />
2. What’s going on inside a router to generate this phenomenon?<br />
3. For TCP, this phenomenon can infer congestion. But it can also occur when there is no congestion in the network. In<br />
which other cases in which case such a phenomenon may occur?<br />
4. If this phenomenon does not always indicate congestion, why is TCP based on this inference? Why don’t we use an<br />
approach where the router notify explicitly the congestion by sending a message to the sender?<br />
1.2 Congestion Control Algorithms<br />
For congestion control, TCP uses a threshold that indicates the flow rate above which congestion may occur. This threshold<br />
is expressed by the parameter ssthresh (in bytes). To get the flow rate threshold, ssthresh is divided by the RT T (Round<br />
Trip Time). The flow rate can vary from below and above the threshold ssthresh/RT T . The issuer maintains an other<br />
parameter, cwnd (Size of the congestion window), which indicates the maximum number of bytes it can send before receiving<br />
an acknowledgment. When cwnd > ssthresh, the sender take care particularly to not cause congestion.<br />
1. Suppose ssthresh is at 5000 bytes, cwnd is at 6000 bytes, and segment size is 500 bytes. The sender sends twelve<br />
segments of 500 bytes in one RT T period, and receives twelve acknowledgements (one for each segments). What<br />
happens to the values ??ssthresh and cwnd? How these values changes are called?<br />
2. Suppose ssthresh is still at 5000 bytes, cwnd is now at 14,000 bytes, the sender sends 14.000/500 = 28 segments,<br />
and that the sender receives a congestion notification before receiving the first acknowledgement. What happens to the<br />
ssthresh and cwnd values??? How these values changes are called?<br />
3. We have seen how increases and decreases cwnd depending on the absence or presence of indicators of congestion. How<br />
do we call this algorithm? On what principle is based this algorithm?<br />
4. At startup, and after having received a congestion notification, the value of cwnd is smaller than the value of ssthresh.<br />
Describe how cwnd increase when it is lower than ssthresh, depending on the following example. Suppose ssthresh<br />
equal to 3000 bytes and cwnd equal to 500 bytes, the size of a segment. The transmitter has several segments ready to be<br />
sent. How many segments sends the issuer during the first RT T period? If it receives acknowledgments for all segments,<br />
what becomes the value of cwnd? How many segments sends the issuer during the second RTT period? If it receives<br />
acknowledgments for all segments, what becomes the cwnd value? In general, how evoluate the size of cwnd?<br />
1/4 <strong>Lab</strong> n˚5 v6.2
Master Informatique <strong>NetArch</strong> Network Architecture<br />
5. How is called the period during which cwnd is smaller than ssthresh?<br />
6. What happens to the value ssthresh if the sender receives a congestion notification while cwnd is smaller ssthresh<br />
that?<br />
1.3 Average bandwidth of a TCP connection<br />
Suppose we wish to perform a large data transfer through a TCP connection<br />
1. By neglecting the period during which cwnd is smaller than ssthresh, show that d, the average flow rate associates to<br />
a TCP connexion, is equal to:<br />
d = 3 W ∗ MSS<br />
4 RT T<br />
where W is the size of the window (in segments) at the time of congestion, MSS the size of segment (assumed to<br />
maximum), and RT T is the round trip delay (assumed constant during the period of transmission).<br />
2. Show that the loss rate p is equal to:<br />
1<br />
p =<br />
3<br />
8 W 2 + 3 4 W<br />
3. Show that if the loss rate observed by a TCP connection is p, then d, the average flow rate, could be approximated by:<br />
d =<br />
1, 22 ∗ MSS<br />
RT T √ p<br />
4. What other parameters can affect the throughput of a TCP connection?<br />
5. What utility do you see to the relation calculated in the last formula of d?<br />
2 Study of the latency of a web server (without computer assistance)<br />
We would like to study the latency bound to the answer to an HTTP request 1 We make the following simplifying assumptions:<br />
• The network is not congested (no losses or retransmissions);<br />
• The receiver has infinite reception buffer (transmitter only limitation is due to the congestion window);<br />
• The size of the object to receive the server is O, an integer multiple of MSS (MSS size is S bits);<br />
• Throughput of the link connecting the client to the server is R (bps) and we neglected the size of all headers (TCP, IP<br />
and Link layer). Only the segments carrying data have a significant transmission time. The transmission time of control<br />
segments (ACK, SYN ...) is negligible;<br />
• The value of the initial threshold of congestion control is never reached;<br />
• The value of the round trip time delay is RT T .<br />
1. Initially, we assume that we have no congestion control window. In this case, justify the following expression of L, the<br />
latency:<br />
L = 2RT T + O/R<br />
2. We now assume a static congestion window of fixed size fixe W . Calculate the latency in this first case:<br />
W S/R < RT T + S/R<br />
1 Latency of an HTTP request: the time for creating the connection and the receiving of the complete application object.<br />
2/4 <strong>Lab</strong> n˚5 v6.2
Master Informatique <strong>NetArch</strong> Network Architecture<br />
3. We still assume a static congestion window of fixed size W . Calculate the latency in the second cases:<br />
W S/R > RT T + S/R<br />
4. Compare the latency with a dynamic congestion control window (slow start) with the one without congestion control.<br />
5. Numerical implementation:<br />
R O/R L (without slow start) K ′ L (TCP global latency)<br />
56 Kbps<br />
512 Kbps<br />
8 Mbps<br />
100 Mbps<br />
K ′ is the number of windows sent before starting the second case (log2(1 + RT T ∗ R/S)). Consider three cases:<br />
(a) S= 512 octets, RT T = 100 msec, O=100 Koctets (=200S);<br />
(b) S= 512 octets, RT T = 100 msec, O=5 Koctets (=10S);<br />
(c) S= 512 octets, RT T = 1 seconde, O=5 Koctets (=10S).<br />
3 Analysis of TCP mechanisms<br />
Here are four HTTP traffic captures. The first three are pre-recorded and are on long distance client and server. (All three<br />
are made using a probe close to the client). You will realize by yourself the last one in a local environment (on the networking<br />
testbed). For each one, draw the chronogram and study the congestion control mechanisms put-in-work. Discuss particular of<br />
the following:<br />
1. What is the average RT T ?<br />
2. Do you recognize the congestion control mechanisms?<br />
3. Up to how many segments are transmitted by RT T ?<br />
4. What is the average throughput achieved then?<br />
5. A continuous sending it appears?<br />
6. Is their any disturbances (desequencement, retransmission ...)?<br />
3.1 HTTP Traffic Paris-Brisbane (WAN Intercontinental: 17000km)<br />
One your ARI host, use the wireshark tool (without needing administrator rights) for this first trace. Download the trace<br />
tme5-wau.dmp either from the directory /Infos/lmd/2012/master/ue/ares-2012oct, or from the web page http://<br />
www-rp.lip6.fr/~fourmaux/Traces/labV6.html.<br />
3.2 HTTP Trafficrafic HTTP Paris-Budapest (WAN Continental : 1200km)<br />
One your ARI host, use the wireshark tool (without needing administrator rights) for this trace.<br />
tme5-whu.dmp from the previous locations.<br />
Download the trace<br />
3.3 HTTP Trafficrafic HTTP Paris-Evry (MAN : 36km)<br />
One your ARI host, use the wireshark tool (without needing administrator rights) for this trace. Download the last trace<br />
tme5-man.dmp from the previous locations.<br />
3/4 <strong>Lab</strong> n˚5 v6.2
Master Informatique <strong>NetArch</strong> Network Architecture<br />
3.4 Local HTTP Traffic (LAN)<br />
3.4.1 Capturing TCP traffic resulting from local HTTP exchange<br />
First, you will capture some TCP traffic inside a LAN in order to understand its basic characteristics. Topology 1 (with client<br />
and server on the same LAN, as described in <strong>Lab</strong> n˚1) is available to you on the networking testbed. Capture traffic using<br />
wireshark, as follows:<br />
• From ARI PC N, connect to the three corresponding VMs of the testbed from three separate terminal windows<br />
– in the “client” VM (window 1), type: ssh -X etudiant@10.0.7.N1<br />
– in the “monitor” VM (window 2), type: ssh -X root@10.0.7.N2 (beware, you are administrator)<br />
– in the “server” VM (window 3), type: ssh -X etudiant@10.0.7.N3<br />
• Verify a large file is reachable from the directory public html of account etudiant (to create with public access rights)<br />
and the HTTP server is running on VM 10.0.7.N3 (windows 3)<br />
– generate a large file, type: dd if=/dev/zero of=public_html/fichier100Mo bs=1M count=100<br />
– verify the public access of the file(-rw-r--r--), type: ls -l public_html/fichier100Mo<br />
– look for the HTTP server process (apache2)<br />
– query the VM about its network interfaces, look at the information regarding the interface to the experimental LAN<br />
and verify that its IP address is 10.N.1.N3<br />
• Start the capture by running the sniffer on the monitor VM (window 2)<br />
– run the sniffer by typing: wireshark<br />
– initiate the capture on interface eth1, as described in <strong>Lab</strong> n˚1<br />
• Start a HTTP client on the client VM (window 1)<br />
– start the HTTP client of your choice (firefox...)<br />
– type the following URL http://10.N.1.N3/~etudiant/fichier100Mo<br />
• Observe the trace being captured in the wireshark window<br />
• Complete the capture, then filter the traffic to keep only TCP (filter = tcp). Save the filtered trace for later reuse.<br />
Keep the application running and answer to the same questions than for the three previous traces.<br />
3.4.2 Without the testbed. . .<br />
If you have difficulty accessing the networking testbed, or you would simply prefer to work from another machine, you can<br />
download the trace tme5-lan.dmp (similar to the one previously captured) either from the directory /Infos/lmd/2012/<br />
master/ue/ares-2012oct, or from the web page http://www-rp.lip6.fr/~fourmaux/Traces/labV6.html, and then<br />
analyze it with wireshark (without needing administrator rights).<br />
4 Before leaving the room<br />
• Remove the large file (rm public html/fichier100Mo).<br />
• If you have saved some traces on the monitor VM, do not forget to transfer them back to your ARI user account. Type:<br />
scp root@10.0.7.N2: .<br />
• Before closing your connections to the virtual machines, be sure to restore them to the state in which you found them,<br />
removing any modifications you might have made.<br />
4/4 <strong>Lab</strong> n˚5 v6.2