No Slide Title - Umicore
No Slide Title - Umicore
No Slide Title - Umicore

You also want an ePaper? Increase the reach of your titles
YUMPU automatically turns print PDFs into web optimized ePapers that Google loves.
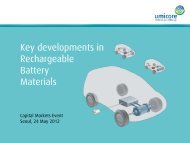
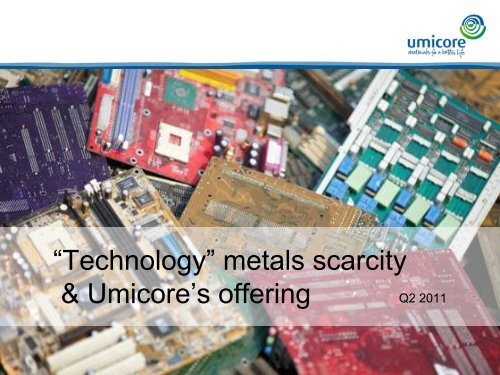
“Technology”<br />
metals scarcity<br />
& <strong>Umicore</strong>’s offering Q2 2011
Overview<br />
•<br />
•<br />
•<br />
Increasing need for metals<br />
Metal scarcity issues<br />
Urban mining potential<br />
• <strong>Umicore</strong>’s involvement
View of Guaralhos, Brazil<br />
Increasing need for metals
Increasing need for metals<br />
especially with emerging markets growing<br />
4<br />
Source: BHP Billiton, 2011<br />
Increasing metals need<br />
•<br />
•<br />
•<br />
With growth of<br />
population<br />
With increasing GDP<br />
per capita<br />
Consumption per<br />
capita tapers off in<br />
Western countries
Increasing need for “technology”<br />
metals metals<br />
Driven by technological evolution and environmental issues<br />
5<br />
H<br />
hydrogen<br />
Li<br />
lithium<br />
Na<br />
sodium<br />
K<br />
potassium<br />
Be<br />
beryllium<br />
Mg<br />
magnesium<br />
Ca<br />
calcium<br />
Sc<br />
scandium<br />
Ti<br />
titanium<br />
B C N O F Ne<br />
Al Si P S Cl Ar<br />
V Cr Mn Fe Co Ni Cu Zn Ga Ge As Se Br Kr<br />
vanadium chromium manganese iron cobalt nickel copper zinc gallium germanium arsenic selenium bromine krypton<br />
Rb Sr Y Zr Nb Mo Tc Ru Rh Pd Ag Cd In Sn Sb Te I Xe<br />
Cs Ba La-Lu Hf Ta W Re Os Ir Pt Au Hg Tl Pb Bi Po At Rn<br />
Fr Ra Ac-Lr Rf Db Sg Bh Hs Mt Uun Uuu Uub Uuq<br />
He<br />
helium<br />
boron carbon nitrogen oxygen fluorine neon<br />
aluminium silicon phosphorus sulphur chlorine argon<br />
rubidium strontium yttrium zirconium niobium molybdenum technetium ruthenium rhodium palladium silver cadmium indium tin antimony tellurium iodine xenon<br />
caesium barium lanthanides hafnium tantalum tungsten rhenium osmium iridium platinum gold mercury thallium lead bismuth polonium astatine radon<br />
francium radium actinides rutherfordium dubnium seaborgium bohrium hassium meitnerium ununnilum unununium ununbium<br />
ununquadium<br />
Technology metals
Increasing need for “technology” metals<br />
Reflected in recent mine production<br />
6<br />
100%<br />
90%<br />
80%<br />
70%<br />
60%<br />
50%<br />
40%<br />
30%<br />
20%<br />
10%<br />
0%<br />
Mine production since 1900<br />
%<br />
mined<br />
mined<br />
in<br />
in<br />
1980-2010<br />
1980-2010<br />
% mined in 1900-1980<br />
% mined in 1900-1980<br />
Re Ga In Ru Pd Rh Ir REE Si Pt Ta Li Se Ni Co Ge Cu Bi Ag Au<br />
REE = Rare Earth Elements
Russia planting flag on <strong>No</strong>rth pole in August 2007<br />
“claiming”<br />
land for its resources<br />
Metal scarcity<br />
issues
Metal scarcity issues<br />
Absolute metal scarcity<br />
Earth crust is limited<br />
Gradual depletion of<br />
“economically” mineable<br />
resources<br />
Limited number of highly<br />
concentrated sources<br />
Some misconceptions on<br />
absolute scarcity of certain<br />
metals, e.g.:<br />
8<br />
•<br />
•<br />
•<br />
Lithium<br />
Rare earths<br />
Precious Metals<br />
Source: US Geological Survey, 2002
Metal scarcity issues<br />
Limited substitution possibilities<br />
Challenge to maintain performance which<br />
is often based on specific criticalchemical<br />
substance properties<br />
Potential substitute often comes from<br />
same metal family:<br />
9<br />
Can you substitute scarce indium<br />
by scarce Gallium?<br />
Consider side effect of substitution<br />
•<br />
•<br />
•<br />
Toxicity<br />
Recyclability<br />
Price effects<br />
Example: Opto-electric applications
Metal scarcity issues<br />
Temporary metal scarcity<br />
Temporary supply-demand imbalances<br />
10<br />
•<br />
•<br />
•<br />
Investments in mining capacity requires cash<br />
and time<br />
Creates spikes and collapses in metal prices<br />
Speculation on the commodities markets<br />
enhances the effects<br />
Geo-political issues, based on concentrated<br />
sources, similar to oil, e.g.:<br />
•<br />
•<br />
•<br />
•<br />
•<br />
Rare Earth Elements (REE) in China<br />
Platinum in Southern Africa<br />
Palladium in Russia<br />
Lithium in the Andes<br />
Cobalt in DRC (Congo)<br />
1,250<br />
1,000<br />
750<br />
500<br />
250<br />
0<br />
1,250<br />
1,000<br />
750<br />
500<br />
250<br />
0<br />
1988<br />
1988<br />
1990<br />
1990<br />
1992<br />
1992<br />
1994<br />
1994<br />
Ru price<br />
1996<br />
$ / tr. oz.<br />
New application in<br />
hard disc drives<br />
Hoarding<br />
in Russia<br />
1998<br />
2001<br />
2003<br />
Pd price<br />
1996<br />
$ / tr.oz<br />
1998<br />
2001<br />
2003<br />
2005<br />
2005<br />
2007<br />
2007<br />
2009<br />
2009
Metal scarcity issues<br />
Structural scarcity for “technology”<br />
Many “technology” metals come as<br />
a by-product from primary mining<br />
for “base” metals<br />
Supply of many “technology metals”<br />
is price-inelastic<br />
11<br />
•<br />
•<br />
Increased demand can only be met<br />
by primary production if demand for<br />
major metal rises accordingly<br />
Short term demand surges lead to<br />
price peaks<br />
metals<br />
Source: C. Hagelüken, C.E.M. Meskers: Complex lifecycles of precious and<br />
special metals in Linkages of Sustainability. Strüngmann Forum<br />
Report vol. 4. T. Graedel, E. van der Voet (eds.) Cambridge, MA,<br />
MIT Press 2009.
Urban mining potential
Urban mining potential<br />
“Deposits” can be much richer than primary mining ores<br />
Primary mining<br />
13<br />
•<br />
•<br />
~5 g/t Au in ore<br />
Similar for PGMs<br />
Urban mining<br />
•<br />
•<br />
•<br />
200-250 g/t Au in PC circuit boards<br />
300-350 g/t Au in cell phones<br />
2000 g/t PGM in automotive<br />
catalysts
Urban mining potential<br />
Low loadings/unit but volume counts, e.g. in electronics<br />
14<br />
X250<br />
a) Mobile phones<br />
1300 M units/ year<br />
mg<br />
Ag<br />
≈<br />
X 24 mg Au ≈<br />
X 9 mg Pd ≈<br />
X 9 g Cu ≈<br />
325 t<br />
31 t<br />
12 t<br />
12,000 t<br />
Ag<br />
Au<br />
Pd<br />
Cu<br />
1300 M Li-Ion batteries<br />
X 3.8<br />
g<br />
Co<br />
≈<br />
4900 t<br />
Co<br />
Global sales, 2009<br />
X1000mg<br />
b) PCs & laptops<br />
300 M units/year<br />
Ag<br />
≈<br />
X 220 mg Au ≈<br />
X 80 mg Pd ≈<br />
X~500<br />
g<br />
Cu<br />
300 t<br />
66 t<br />
24 t<br />
Ag<br />
Au<br />
Pd<br />
≈150,000 t Cu<br />
~140 M Li-ion batteries<br />
X 65 g Co ≈<br />
9100 t<br />
a+b) Urban mine<br />
Versus primary production<br />
= 625 t Ag ≈<br />
= 97 t Au ≈<br />
= 36 t Pd ≈<br />
= 162,000 t Cu ≈<br />
= 14,000 t Co ≈<br />
Tiny metal content per piece → Significant total demand<br />
Other electronic devices add even more to these figures<br />
Co<br />
3%<br />
4%<br />
16%<br />
1%<br />
19%
Urban mining<br />
Low loadings/unit but volume counts, e.g. in cars<br />
Large total volumes<br />
15<br />
•<br />
•<br />
Global sales in 2010 of ~70 million cars<br />
Current car fleet of some1.3 billion<br />
Demand for “technology metals” rises in<br />
modern vehicles<br />
•<br />
•<br />
•<br />
Car electronics<br />
EV/HEV<br />
etc.<br />
Metal demand in automotive<br />
in 1000<br />
t/a<br />
Share* of<br />
primary<br />
production<br />
steel 100,000 10 %<br />
Al 7 300 30 %<br />
Pb** 7 000 170 %<br />
Cu 1 900 12 %<br />
Ni 140 10 %<br />
…<br />
Pt*** 0.12 65 %<br />
Pd*** 0.14 > 60 %<br />
Rh*** 0.03 110 %<br />
2008 data (rounded)<br />
* >100% → additional supply from recycling<br />
** Pb use in batteries (mainly automotive)<br />
*** Pt, Pd, Rh mainly in autocatalysts
Urban mining potential<br />
Offers significant environmental and ethical advantages<br />
Urban mining prevents impact from non-recycling,<br />
such as hazardous emissions and use on land<br />
Recycling mitigates environmental impacts of<br />
mining<br />
16<br />
•<br />
•<br />
Less land & water use, less pressure on ecosystem<br />
Lower energy consumption and lower CO2 footprint<br />
for majority of metals<br />
<strong>Umicore</strong> Hoboken produces 70,000 t metals/year<br />
emitting theoretically ~1M t CO 2 less than primary<br />
metal production<br />
Recycling also offers ethical sourcing possibilities<br />
•<br />
Supply chain transparency can be increased<br />
tonne CO 2 /<br />
tonne primary<br />
metal<br />
10,000<br />
200<br />
10<br />
0<br />
≈<br />
≈<br />
Pt<br />
In<br />
Cu<br />
Au<br />
Pd<br />
Sn<br />
Ru<br />
Ag<br />
Co<br />
Source:Ecoinvent 2.0, EMPA/ETH-<br />
Zürich, 2007
<strong>Umicore</strong> flagship recycling plant<br />
in Hoboken, Belgium<br />
<strong>Umicore</strong>’s involvement
<strong>Umicore</strong>’s involvement<br />
Key growth axes aligned with global megatrends<br />
Resource scarcity<br />
Market position<br />
<strong>Umicore</strong> is the largest recycler of precious<br />
metals, able to recycle up to 20 different<br />
metals<br />
Growth opportunity<br />
Expand recycling through UHT technology<br />
Market position<br />
<strong>Umicore</strong> supplies key innovative materials for<br />
high-efficiency solar cells and other<br />
photovoltaic applications<br />
Growth opportunity<br />
Develop <strong>Umicore</strong>’s presence in PV materials<br />
18<br />
More stringent emission control<br />
Market position<br />
<strong>Umicore</strong> provides catalysts for 1 out of 3 cars<br />
in the world, with smaller position for trucks &<br />
non-road vehicles<br />
Growth opportunity<br />
Expand autocat activity into new segments<br />
Renewable energy Electrification of the automobile<br />
Market position<br />
<strong>Umicore</strong> is a leading producer of key<br />
materials for rechargeable batteries for<br />
portable electronics<br />
Growth opportunity<br />
Expand battery materials activity into (H)EVs
<strong>Umicore</strong>’s involvement<br />
Exposed to global markets<br />
64 production sites<br />
+ 34 other sites/offices<br />
14,386 employees worldwide,<br />
of which 4,828 in associated companies<br />
19<br />
South<br />
America<br />
7%<br />
Turnover by destination<br />
Asia<br />
Pacific<br />
17%<br />
<strong>No</strong>rth<br />
America<br />
8%<br />
Africa<br />
5%<br />
Europe<br />
63%<br />
Direct customer exposure mostly to<br />
Europe<br />
End-user market exposure worldwide
<strong>Umicore</strong>’s involvement<br />
Business model based on efficient use of resources<br />
(Precious) metals price passed through to customer<br />
Reducing metal content, while improving product performance, creates win-win<br />
Recycling (own) production scrap and end-of-life materials allows to close the loop,<br />
thereby aiming to minimize environmental impact<br />
20<br />
Total value<br />
recovered<br />
Recycling cost<br />
Focus<br />
on<br />
Metals<br />
Application<br />
know-how<br />
Chemistry<br />
material<br />
Material science<br />
solutions<br />
Metallurgy<br />
Recycling<br />
Material<br />
solutions<br />
Focus<br />
on<br />
End product<br />
performance<br />
Material cost
<strong>Umicore</strong>’s involvement<br />
Recovery of “critical” “technology”<br />
21<br />
H<br />
hydrogen<br />
Li<br />
Li<br />
lithium<br />
Na<br />
sodium<br />
K<br />
potassium<br />
Be<br />
beryllium<br />
beryllium<br />
Mg<br />
magnesium<br />
Ca<br />
calcium<br />
Sc<br />
scandium<br />
Ti<br />
titanium<br />
metals<br />
B C N O F Ne<br />
Al Si P S Cl Ar<br />
V Cr Mn<br />
Mn Fe Co Co Ni Ni Cu<br />
Cu Zn Zn Ga Ge As As Se Br Kr<br />
vanadium chromium manganese<br />
iron cobalt nickel copper<br />
zinc gallium germanium arsenic selenium bromine<br />
krypton<br />
Rb Sr Y Zr Nb Mo Tc Ru Ru Rh Rh Pd Pd Ag<br />
Ag Cd In In Sn Sn Sb Sb Te I Xe<br />
Cs Ba La-Lu Hf Ta W Re Os Ir Ir Pt Pt Au<br />
Au Hg Tl Pb Pb Bi Bi Po At Rn<br />
Fr Ra Ac-Lr Rf Db Sg Bh Hs Mt Uun Uuu Uub Uuq<br />
He<br />
helium<br />
boron carbon nitrogen oxygen fluorine<br />
neon<br />
aluminium silicon phosphorus sulphur chlorine<br />
argon<br />
rubidium strontium yttrium<br />
zirconium niobium molybdenum technetium<br />
ruthenium rhodium palladium silver<br />
cadmium indium tin antimony tellurium iodine<br />
xenon<br />
caesium barium lanthanides<br />
hafnium tantalum tungsten rhenium<br />
osmium iridium platinum gold<br />
mercury thallium lead bismuth polonium astatine<br />
radon<br />
francium radium actinides<br />
rutherfordium dubnium seaborgium bohrium<br />
hassium meitnerium ununnilum unununium<br />
ununbium<br />
ununquadium<br />
Technology metals<br />
Zn<br />
refiners<br />
Industrial residues<br />
Electronic scrap,<br />
rechargeable batteries<br />
& other Automotive &<br />
process catalysts<br />
EU critical metals<br />
(Raw Materials Initiative)<br />
<strong>Umicore</strong>’s recycled metals<br />
(partially recycled)
<strong>Umicore</strong>’s involvement<br />
Capacity to grow<br />
Materials technology company<br />
focused on Cleantech applications<br />
Growth takes environmental, social and<br />
stakeholder aspects into account<br />
Key figures<br />
(in million €) 2008 2009 2010<br />
Turnover 9,124.0 6,937.4 9,691.1<br />
Revenues 2,100.3 1,723.2 1,999.7<br />
REBIT 354.6 146.4 342.5<br />
R&D 165.0 135.7 135.0<br />
Capex 216.0 190.5 172.0<br />
ROCE 17.8% 8.1% 17.5%<br />
22<br />
Growth based on Cleantech<br />
•<br />
•<br />
60% of revenues already in Cleantech<br />
85% of R&D focused on Cleantech<br />
Targets set for period 2015-2020<br />
•<br />
•<br />
Organic revenue growth potential of<br />
10%+ on average<br />
Goal to generate average ROCE of<br />
15%+<br />
Means to finance growth available<br />
•<br />
•<br />
Gearing ratio (ND/ND+E)
Conclusions<br />
•<br />
•<br />
•<br />
•<br />
Increasing need for metals, especially “technology”<br />
Metal scarcity issues, especially for “technology”<br />
Urban mining offers a solution and has potential<br />
metals<br />
metals<br />
<strong>Umicore</strong>’s product/service exposure and its business model<br />
well aligned with these issues
Forward-looking statements<br />
This presentation contains forward-looking information that involves risks and<br />
uncertainties, including statements about <strong>Umicore</strong>’s plans, objectives, expectations and<br />
intentions.<br />
Readers are cautioned that forward-looking statements include known and unknown<br />
risks and are subject to significant business, economic and competitive uncertainties<br />
and contingencies, many of which are beyond the control of <strong>Umicore</strong>.<br />
Should one or more of these risks, uncertainties or contingencies materialize, or should<br />
any underlying assumptions prove incorrect, actual results could vary materially from<br />
those anticipated, expected, estimated or projected.<br />
As a result, neither <strong>Umicore</strong> nor any other person assumes any responsibility for the<br />
accuracy of these forward-looking statements.<br />
24