Solar cell generations over 40% efficiency - Spectrolab
Solar cell generations over 40% efficiency - Spectrolab
Solar cell generations over 40% efficiency - Spectrolab

You also want an ePaper? Increase the reach of your titles
YUMPU automatically turns print PDFs into web optimized ePapers that Google loves.
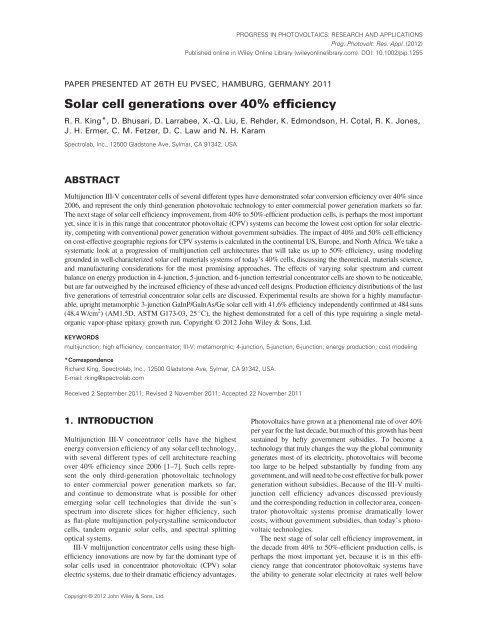
PROGRESS IN PHOTOVOLTAICS: RESEARCH AND APPLICATIONS<br />
Prog. Photovolt: Res. Appl. (2012)<br />
Published online in Wiley Online Library (wileyonlinelibrary.com). DOI: 10.1002/pip.1255<br />
PAPER PRESENTED AT 26TH EU PVSEC, HAMBURG, GERMANY 2011<br />
<strong>Solar</strong> <strong>cell</strong> <strong>generations</strong> <strong>over</strong> <strong>40%</strong> <strong>efficiency</strong><br />
R. R. King*, D. Bhusari, D. Larrabee, X.-Q. Liu, E. Rehder, K. Edmondson, H. Cotal, R. K. Jones,<br />
J. H. Ermer, C. M. Fetzer, D. C. Law and N. H. Karam<br />
<strong>Spectrolab</strong>, Inc., 12500 Gladstone Ave, Sylmar, CA 91342, USA<br />
ABSTRACT<br />
Multijunction III-V concentrator <strong>cell</strong>s of several different types have demonstrated solar conversion <strong>efficiency</strong> <strong>over</strong> <strong>40%</strong> since<br />
2006, and represent the only third-generation photovoltaic technology to enter commercial power generation markets so far.<br />
The next stage of solar <strong>cell</strong> <strong>efficiency</strong> improvement, from <strong>40%</strong> to 50%-efficient production <strong>cell</strong>s, is perhaps the most important<br />
yet, since it is in this range that concentrator photovoltaic (CPV) systems can become the lowest cost option for solar electricity,<br />
competing with conventional power generation without g<strong>over</strong>nment subsidies. The impact of <strong>40%</strong> and 50% <strong>cell</strong> <strong>efficiency</strong><br />
on cost-effective geographic regions for CPV systems is calculated in the continental US, Europe, and North Africa. We take a<br />
systematic look at a progression of multijunction <strong>cell</strong> architectures that will take us up to 50% <strong>efficiency</strong>, using modeling<br />
grounded in well-characterized solar <strong>cell</strong> materials systems of today’s <strong>40%</strong> <strong>cell</strong>s, discussing the theoretical, materials science,<br />
and manufacturing considerations for the most promising approaches. The effects of varying solar spectrum and current<br />
balance on energy production in 4-junction, 5-junction, and 6-junction terrestrial concentrator <strong>cell</strong>s are shown to be noticeable,<br />
but are far outweighed by the increased <strong>efficiency</strong> of these advanced <strong>cell</strong> designs. Production <strong>efficiency</strong> distributions of the last<br />
five <strong>generations</strong> of terrestrial concentrator solar <strong>cell</strong>s are discussed. Experimental results are shown for a highly manufacturable,<br />
upright metamorphic 3-junction GaInP/GaInAs/Ge solar <strong>cell</strong> with 41.6% <strong>efficiency</strong> independently confirmed at 484 suns<br />
(48.4 W/cm 2 ) (AM1.5D, ASTM G173-03, 25 C), the highest demonstrated for a <strong>cell</strong> of this type requiring a single metalorganic<br />
vapor-phase epitaxy growth run. Copyright © 2012 John Wiley & Sons, Ltd.<br />
KEYWORDS<br />
multijunction; high <strong>efficiency</strong>; concentrator; III-V; metamorphic; 4-junction, 5-junction, 6-junction; energy production; cost modeling<br />
*Correspondence<br />
Richard King, <strong>Spectrolab</strong>, Inc., 12500 Gladstone Ave, Sylmar, CA 91342, USA.<br />
E-mail: rking@spectrolab.com<br />
Received 2 September 2011; Revised 2 November 2011; Accepted 22 November 2011<br />
1. INTRODUCTION<br />
Multijunction III-V concentrator <strong>cell</strong>s have the highest<br />
energy conversion <strong>efficiency</strong> of any solar <strong>cell</strong> technology,<br />
with several different types of <strong>cell</strong> architecture reaching<br />
<strong>over</strong> <strong>40%</strong> <strong>efficiency</strong> since 2006 [1–7]. Such <strong>cell</strong>s represent<br />
the only third-generation photovoltaic technology<br />
to enter commercial power generation markets so far,<br />
and continue to demonstrate what is possible for other<br />
emerging solar <strong>cell</strong> technologies that divide the sun’s<br />
spectrum into discrete slices for higher <strong>efficiency</strong>, such<br />
as flat-plate multijunction polycrystalline semiconductor<br />
<strong>cell</strong>s, tandem organic solar <strong>cell</strong>s, and spectral splitting<br />
optical systems.<br />
III-V multijunction concentrator <strong>cell</strong>s using these high<strong>efficiency</strong><br />
innovations are now by far the dominant type of<br />
solar <strong>cell</strong>s used in concentrator photovoltaic (CPV) solar<br />
electric systems, due to their dramatic <strong>efficiency</strong> advantages.<br />
Photovoltaics have grown at a phenomenal rate of <strong>over</strong> <strong>40%</strong><br />
per year for the last decade, but much of this growth has been<br />
sustained by hefty g<strong>over</strong>nment subsidies. To become a<br />
technology that truly changes the way the global community<br />
generates most of its electricity, photovoltaics will become<br />
too large to be helped substantially by funding from any<br />
g<strong>over</strong>nment, and will need to be cost effective for bulk power<br />
generation without subsidies. Because of the III-V multijunction<br />
<strong>cell</strong> <strong>efficiency</strong> advances discussed previously<br />
and the corresponding reduction in collector area, concentrator<br />
photovoltaic systems promise dramatically lower<br />
costs, without g<strong>over</strong>nment subsidies, than today’s photovoltaic<br />
technologies.<br />
The next stage of solar <strong>cell</strong> <strong>efficiency</strong> improvement, in<br />
the decade from <strong>40%</strong> to 50%-efficient production <strong>cell</strong>s, is<br />
perhaps the most important yet, because it is in this <strong>efficiency</strong><br />
range that concentrator photovoltaic systems have<br />
the ability to generate solar electricity at rates well below<br />
Copyright © 2012 John Wiley & Sons, Ltd.
<strong>Solar</strong> <strong>cell</strong> <strong>generations</strong> <strong>over</strong> <strong>40%</strong> <strong>efficiency</strong><br />
R. R. King et al.<br />
0.10 €/kWh 0.14 $/kWh <strong>over</strong> wide geographic areas.<br />
This allows CPV systems with <strong>40%</strong>–50% <strong>cell</strong> efficiencies<br />
to compete effectively with conventional forms of power<br />
production, even without g<strong>over</strong>nment subsidies.<br />
Though multijunction <strong>cell</strong> efficiencies are still far from<br />
their theoretical efficiencies of <strong>over</strong> 70%, the effects of<br />
those physical limits can be felt in today’s <strong>cell</strong>s, and the rate<br />
of <strong>efficiency</strong> increase has begun to lessen. As 3-junction<br />
concentrator solar <strong>cell</strong> technology becomes more highly<br />
evolved, it has become increasingly evident that the next<br />
steps in <strong>efficiency</strong> will need to come from qualitatively<br />
new <strong>cell</strong> structures, rather than from iterative improvements<br />
of the existing 3-junction technology.<br />
In this paper, we take a systematic look at the most promising<br />
multijunction <strong>cell</strong> architectures that will take us up to<br />
50% <strong>efficiency</strong>, using empirically-based modeling grounded<br />
in well-characterized solar <strong>cell</strong> materials systems, discussing<br />
the theoretical, materials science, and manufacturing considerations<br />
for the most promising approaches.<br />
2. GEOGRAPHIC AND ECONOMIC<br />
IMPACT OF HIGH EFFICIENCY<br />
Sunlight is one of the most plentiful energy resources on<br />
earth. The amount of energy from the sun striking the planet<br />
is <strong>over</strong> 1.5 10 22 J (15,000 EJ) each day, more than 10 4<br />
times the 1.3 EJ daily energy consumption by human activity<br />
[8]. Clearly, solar energy is a sustainable resource, with energy<br />
input far exceeding the rate it is consumed. It is also,<br />
however, a dilute source of energy, requiring relatively large<br />
collector areas to generate solar electricity compared with,<br />
say, the lighting, appliances, vehicles, and manufacturing<br />
processes that use it. The large areas required are at the heart<br />
of the cost of solar electricity. The large collector area must<br />
be encapsulated and supported by a certain amount of glass,<br />
metal, and plastic, to protect against the elements for many<br />
years and provide mechanical stability, whether the photovoltaic<br />
collector is a flat-plate panel or a CPV module.<br />
Although these are relatively inexpensive materials on a<br />
per-unit-weight basis, and module manufacturing methods<br />
are fairly straightforward, their cost places a lower limit on<br />
how inexpensive photovoltaic electricity can become for a<br />
given collector area, without even considering the cost of<br />
the particular photovoltaic <strong>cell</strong> technology used.<br />
High <strong>efficiency</strong> is one of the few effective ways to<br />
reduce these fundamental module packaging and support<br />
costs of solar electricity. A 10%-efficient module technology<br />
requires 10 m 2 worth of materials and manufacturing<br />
for module packaging and support to generate 1 kW of<br />
electricity under 1000 W/m 2 incident intensity, whereas a<br />
25%-efficient module requires 2.5 times less, or only<br />
4m 2 . As a result and somewhat counter-intuitively, more<br />
complicated and expensive PV <strong>cell</strong> technologies that also<br />
confer higher <strong>efficiency</strong> can frequently be less expensive<br />
at the module or full PV system level than modules based<br />
on lower <strong>efficiency</strong> <strong>cell</strong>s.<br />
The lower costs of PV systems with higher <strong>efficiency</strong><br />
greatly expand the geographic regions in which they are<br />
cost-effective. Figure 1 is a map of the continental United<br />
States, with filled contours indicating the intensity of<br />
direct normal solar radiation, or direct normal irradiance,<br />
in units of kWh/(m 2 day) for each geographic location.<br />
Superimposed on this map are line contours indicating<br />
regions of cost effectiveness for three different <strong>cell</strong><br />
<strong>efficiency</strong> and system optical <strong>efficiency</strong> cases. Here, cost<br />
Figure 1. Map of the continental United States, with filled contours indicating annual average direct normal solar radiation, in units of<br />
kWh/(m 2 day), as well as colored line contours indicating regions of cost effectiveness (0.14 $/kWh 0.10 €/kWh of generated electricity)<br />
for three cases of concentrator photovoltaic (CPV) systems<br />
Case 1 (purple) <strong>40%</strong> <strong>cell</strong> and 80% optical eff., 50 W/cm 2 on <strong>cell</strong> ! 5.8 kWh/(m 2 day)<br />
Case 2 (orange) 50% <strong>cell</strong> and 80% optical eff., 50 W/cm 2 on <strong>cell</strong> ! 4.8 kWh/(m 2 day)<br />
Case 3 (red) 50% <strong>cell</strong> and 85% optical eff., 85 W/cm 2 on <strong>cell</strong> ! 4.1 kWh/(m 2 day).<br />
Prog. Photovolt: Res. Appl. (2012) © 2012 John Wiley & Sons, Ltd.<br />
DOI: 10.1002/pip
R. R. King et al.<br />
<strong>Solar</strong> <strong>cell</strong> <strong>generations</strong> <strong>over</strong> <strong>40%</strong> <strong>efficiency</strong><br />
effectiveness is taken to mean that solar electricity can be<br />
generated by a given concentrator photovoltaic technology<br />
for 0.14 $/kWh 0.10 €/kWh, in 2011 currency, as<br />
an illustrative example. The cost per unit energy of conventional<br />
electricity generation is highly variable,<br />
depending on supply and demand in a given geographic<br />
and political region, but also on the structure of subsidies<br />
for conventional power generation, and the assumptions<br />
made about long-term costs of energy security, climate<br />
change, and other environmental effects for a given<br />
energy technology; no one energy cost value fits all markets.<br />
The value of 0.14 $/kWh 0.10 €/kWh provides a<br />
benchmark in this study, and the results may be scaled<br />
up or down for other values of present non-PV energy<br />
costs, as appropriate for different assumption sets and<br />
different energy markets.<br />
Figure 2 is a similar figure showing direct normal solar<br />
radiation and cost-effectiveness contours for the European<br />
continent and North Africa. For both Figures 1 and 2, the<br />
direct normal irradiance at each latitude and longitude<br />
point is from the National Aeronautics and Space Administration<br />
Atmospheric Science Data Center Surface meteorology<br />
and <strong>Solar</strong> Energy (SSE) database [9], which<br />
provides solar resource data for the entire globe, and which<br />
shows similar geographic trends in the continental United<br />
States as National Renewable Energy Laboratory solar<br />
resource databases, such as [10].<br />
Three different sets of CPV <strong>cell</strong> and system <strong>efficiency</strong><br />
are represented in Figures 1 and 2 by the colored, bold line<br />
contours:<br />
(i) <strong>40%</strong> CPV <strong>cell</strong> <strong>efficiency</strong> measured under standard<br />
test conditions (STC), 80% system optical <strong>efficiency</strong>,<br />
and 50.0 W/cm 2 (500 suns) incident on the<br />
<strong>cell</strong>s;<br />
(ii) 50% <strong>cell</strong> <strong>efficiency</strong> under STC, 80% system<br />
optical <strong>efficiency</strong>, and 50 W/cm 2 on the <strong>cell</strong>s;<br />
and<br />
(iii) 50% <strong>cell</strong> <strong>efficiency</strong> under STC, 85% system optical<br />
<strong>efficiency</strong>, and 85 W/cm 2 (850 suns) incident on<br />
the <strong>cell</strong>s.<br />
In Figure 1, one can see that the range of cost effectiveness<br />
with today’s <strong>40%</strong>-efficient CPV <strong>cell</strong>s is broadened<br />
from the desert southwest US in Case 1, to a<br />
much larger portion of the American midwest, Florida,<br />
and parts of the southeastern US for Case 2 which is<br />
the same in all respects except for the increase of <strong>cell</strong><br />
<strong>efficiency</strong> to 50% at STC, for the cost parameters used<br />
in this study. For the European continent in Figure 2,<br />
the transition from <strong>40%</strong> to 50%-efficient CPV <strong>cell</strong>s at<br />
STC causes the cost effective region to encompass most<br />
of the Iberian Peninsula, Turkey, and coastal regions<br />
throughout Europe.<br />
Figure 2. Map of the European continent and North Africa, with filled contours indicating annual average direct normal solar radiation, in<br />
units of kWh/(m 2 day), as well as colored line contours indicating regions of cost effectiveness (0.14 $/kWh 0.10 €/kWh of generated<br />
electricity) for three cases of concentrator photovoltaic (CPV) systems<br />
Case 1 (purple) <strong>40%</strong> <strong>cell</strong> and 80% optical eff., 50 W/cm 2 on <strong>cell</strong> ! 5.8 kWh/(m 2 day)<br />
Case 2 (orange) 50% <strong>cell</strong> and 80% optical eff., 50 W/cm 2 on <strong>cell</strong> ! 4.8 kWh/(m 2 day)<br />
Case 3 (red) 50% <strong>cell</strong> and 85% optical eff., 85 W/cm 2 on <strong>cell</strong> ! 4.1 kWh/(m 2 day).<br />
Prog. Photovolt: Res. Appl. (2012) © 2012 John Wiley & Sons, Ltd.<br />
DOI: 10.1002/pip
<strong>Solar</strong> <strong>cell</strong> <strong>generations</strong> <strong>over</strong> <strong>40%</strong> <strong>efficiency</strong><br />
R. R. King et al.<br />
If the increase in <strong>cell</strong> <strong>efficiency</strong> to 50% can be coupled<br />
with ambitious improvements in CPV system optical <strong>efficiency</strong><br />
as in Case 3, most of the contiguous 48 states of<br />
the US are in the cost effective region for CPV deployment<br />
as shown in Figure 1, including the southeastern US and<br />
eastern US seaboard, without g<strong>over</strong>nment subsidies. In<br />
Europe, the region of cost effectiveness for CPV systems<br />
expands to include southern France, and all of Italy and<br />
Greece, as plotted in Figure 2.<br />
The cost accounting for CPV systems is straightforward<br />
in principle. In a simplified approach, the system cost per<br />
unit of generated energy, (C/E) system , is the system cost<br />
per unit module aperture area, divided by the energy per<br />
area generated <strong>over</strong> a given payback time<br />
<br />
C<br />
E<br />
system<br />
C mod þ C BOS þ C pwr cond<br />
¼<br />
(1)<br />
A mod Int annual avg AC;system T payback<br />
where<br />
C mod cost of module (<strong>cell</strong>s, <strong>cell</strong> packaging, and<br />
module packaging)<br />
C BOS cost of balance-of-system (BOS) (e.g.,<br />
support structures, wiring, installation,<br />
operations and maintenance, financing),<br />
excluding power conditioning<br />
C pwr cond cost of power conditioning unit (inverter)<br />
for system<br />
A mod aperture area of modules in system<br />
Int annual avg annual average intensity of solar resource<br />
(direct normal for concentrator, global for<br />
flat-plate) in a given geographic location,<br />
in units of kWh/(m 2 day)<br />
AC,system total <strong>efficiency</strong> of PV system, from sunlight<br />
to AC power<br />
T payback time allotted to payback capital cost of<br />
system, from power generated.<br />
The cost effectiveness contours in Figures 1 and 2 were<br />
found by noting that for a given cost per unit generated energy<br />
(C/E) system , taken to be 0.14 $/kWh 0.10 €/kWh in<br />
this study, the annual average intensity of sunlight Int annual avg<br />
that can support this cost is<br />
Int annual avg ¼<br />
C mod þ C BOS þ C pwr cond<br />
system (2)<br />
AC;system T payback<br />
A mod<br />
C<br />
E<br />
The greatest uncertainty in this analysis is in the cost of<br />
the non-<strong>cell</strong> components of the CPV module, and in the<br />
CPV system BOS costs. To provide a systematic estimate<br />
of these costs, US Department of Energy (DOE) current<br />
“Business as Usual” 2016 cost projections for utility scale<br />
PV systems were used [11], for module, BOS, and power<br />
electronics costs in all three cases. Using estimated III-V<br />
multijunction CPV <strong>cell</strong> costs of 7.50 $/cm 2 of <strong>cell</strong> aperture<br />
area plus 2.50 $/cm 2 <strong>cell</strong> packaging costs, for a round<br />
number of 10 $/cm 2 for CPV <strong>cell</strong>s plus <strong>cell</strong> packaging, the<br />
non-<strong>cell</strong> module costs can be extracted from the total module<br />
cost and are 122 $/m 2 for all three cases as described in more<br />
detail in Appendix A. The DOE balance of system costs<br />
without tracking are 260 $/m 2 , to which the extra costs of<br />
the tracking mechanism for CPV systems are added. The<br />
resulting total CPV system cost per unit module aperture area<br />
(C system /A mod ) calculated in this way is 597 to 654 $/m 2 .Asa<br />
check, this is well within the range between high and lowcost<br />
estimates in [12].<br />
The <strong>efficiency</strong> of the <strong>over</strong>all CPV system starts with<br />
the <strong>cell</strong> <strong>efficiency</strong> at STC, but also includes: the CPV system<br />
optical <strong>efficiency</strong>; power conditioning <strong>efficiency</strong>;<br />
fraction of power at STC remaining at operating temperature;<br />
fraction of power remaining because of the difference<br />
between the standard design solar spectrum and<br />
average actual spectrum; fraction of energy production<br />
remaining because of changes in the actual spectrum <strong>over</strong><br />
the day and year with respect to the average actual<br />
spectrum; and fraction of energy production remaining<br />
because of tracking errors, as detailed in Appendix B.<br />
Total system efficiencies are 26.8%, 33.5%, and 35.6%<br />
for Cases 1, 2, and 3, respectively. The payback period<br />
T payback is chosen to be 8 years.<br />
With these cost and <strong>efficiency</strong> parameters, the threshold direct<br />
normal solar radiation level for cost effective CPV energy<br />
production at 0.14 $/kWh 0.10 €/kWh are the following:<br />
a total of 5.8 kWh/(m 2 day) for Case 1 (<strong>40%</strong> <strong>cell</strong> and<br />
80% optical <strong>efficiency</strong>, 50 W/cm 2 on <strong>cell</strong>);<br />
a total of 4.8 kWh/(m 2 day) for Case 2 (50% <strong>cell</strong> and<br />
80% optical <strong>efficiency</strong>, 50 W/cm 2 on <strong>cell</strong>); and<br />
a total of 4.1 kWh/(m 2 day) for Case 3 (50% <strong>cell</strong> and<br />
85% optical <strong>efficiency</strong>, 85 W/cm 2 on <strong>cell</strong>),<br />
as shown in the contours in Figures 1 and 2. For comparison,<br />
using the same cost parameters for a Case 4 using silicon<br />
CPV <strong>cell</strong>s with 26% <strong>efficiency</strong> under STC at 50.0 W/cm 2 ,<br />
with 2.50 $/cm 2 <strong>cell</strong> packaging cost as before, but optimistically<br />
assuming zero cost for the Si <strong>cell</strong>s, leads to a total CPV<br />
system <strong>efficiency</strong> of 16.5% for Case 4, confining the region<br />
of cost effectiveness to the limited areas with direct normal<br />
solar radiation greater than 7.5 kWh/(m 2 day).<br />
Because of the uncertainty in cost inputs, these cost<br />
projections are meant to be only illustrative; actual energy<br />
costs may be higher—or lower—depending on specifics of<br />
the CPV system. The trends are clear, however, the high<br />
<strong>efficiency</strong> of <strong>40%</strong> III-V multijunction CPV <strong>cell</strong>s, and<br />
ultimately increasing <strong>efficiency</strong> to 50% are vitally important<br />
for reducing the area of non-<strong>cell</strong> module components and<br />
support structures, as well as the required area of CPV <strong>cell</strong>s<br />
themselves, thereby expanding the range of cost effectiveness<br />
of photovoltaics. It is significant that large geographic<br />
regions can support economically viable solar electricity<br />
generation, even with the “Business as Usual” cost<br />
parameters used here. With further reductions in the cost<br />
of module, BOS, and power electronics components,<br />
CPV systems could push into even higher latitudes with<br />
lower direct normal irradiance and still remain cost<br />
effective.<br />
Prog. Photovolt: Res. Appl. (2012) © 2012 John Wiley & Sons, Ltd.<br />
DOI: 10.1002/pip
R. R. King et al.<br />
<strong>Solar</strong> <strong>cell</strong> <strong>generations</strong> <strong>over</strong> <strong>40%</strong> <strong>efficiency</strong><br />
3. HIGH-EFFICIENCY MULTIJUNCTION<br />
CELL STRUCTURES<br />
<strong>Solar</strong> <strong>cell</strong> efficiencies can be dramatically improved by dividing<br />
the broad solar spectrum up into smaller wavelength ranges,<br />
each of which can be converted more efficiently, through the<br />
use of multijunction <strong>cell</strong>s. Multijunction CPV solar <strong>cell</strong>s are<br />
the only third-generation photovoltaic technology—<strong>cell</strong>s with<br />
double or triple the 15%–20% efficiencies targeted by first<br />
and second generation PV <strong>cell</strong>s [13] and able to <strong>over</strong>come the<br />
Shockley–Queisser <strong>efficiency</strong> limit for single-junction <strong>cell</strong>s—<br />
that are now in commercial production. A large measure of<br />
success has been achieved with 3-junction GaInP/GaInAs/Ge<br />
concentrator solar <strong>cell</strong>s operating on this principle, the first<br />
solar <strong>cell</strong> technology of any type to reach <strong>over</strong> <strong>40%</strong> <strong>efficiency</strong><br />
[1], and which is now the baseline technology for<br />
<strong>40%</strong> production CPV <strong>cell</strong>s [14]. As efficient as they are,<br />
however, this baseline 3-junction design is still far from<br />
the optimum combination of sub<strong>cell</strong> bandgaps, and far from<br />
its <strong>efficiency</strong> potential.<br />
Ideal efficiencies of <strong>over</strong> 59% are possible for 4-junction<br />
<strong>cell</strong>s, and for 5-junction and 6-junction terrestrial concentrator<br />
<strong>cell</strong>s, efficiencies <strong>over</strong> 60% are achievable in principle [15,16].<br />
By providing a higher theoretical <strong>efficiency</strong>, solar <strong>cell</strong> architectures<br />
with 4-junction, 5-junction, and 6-junction offer a route<br />
to greater average efficiencies in high-volume manufacturing<br />
as well. Significantly, energy production modeling for<br />
4-junction, 5-junction, and 6-junction CPV <strong>cell</strong>s with the<br />
changing terrestrial spectrum that occurs with changing sun angle<br />
<strong>over</strong> the course of the day indicates that such <strong>cell</strong>s have<br />
much greater energy production than 3-junction <strong>cell</strong>s, retaining<br />
most of their advantage in <strong>efficiency</strong> at the design point for<br />
production of kilowatt hours in the field [16].<br />
Because the <strong>efficiency</strong> range from <strong>40%</strong> to 50% is so leveraging,<br />
spanning a tipping point for which vast geographic<br />
regions become available for economic CPV plant operation<br />
without g<strong>over</strong>nment subsidies, it is important to examine the<br />
variety of multijunction <strong>cell</strong> configurations that can take us<br />
well beyond <strong>40%</strong>, even though these structures are generally<br />
more complex and technologically challenging than today’s<br />
3-junction <strong>cell</strong>s. A progression of sample high-<strong>efficiency</strong><br />
concentrator solar <strong>cell</strong> structures is shown in Figure 3, beginning<br />
with 3-junction <strong>cell</strong>s of today and the near future, and<br />
advancing through 4-junction, 5-junction, and 6-junction<br />
<strong>cell</strong>s with a variety of technologies. These include upright<br />
metamorphic (MM) <strong>cell</strong>s, inverted metamorphic (IMM) <strong>cell</strong>s<br />
with single, double, and triple (MMX3) graded buffer layers,<br />
epitaxial Ge and SiGe sub<strong>cell</strong>s, semiconductor bonding technology,<br />
and dilute nitride GaInNAsSb sub<strong>cell</strong>s.<br />
Projected average efficiencies in production are shown<br />
beneath each example <strong>cell</strong> type in Figure 3. The efficiencies<br />
are calculated using <strong>cell</strong> parameters—such as the series resistance,<br />
sub<strong>cell</strong> bandgap-voltage offsets, diode ideality factors,<br />
reflectance, grid shadowing, and other non-ideal current<br />
losses—that are consistent with the nominal <strong>40%</strong> production<br />
average <strong>efficiency</strong> of <strong>Spectrolab</strong> C4MJ <strong>cell</strong>s, shown second<br />
from the left in Figure 3(b). So, provided that the new semiconductor<br />
materials involved can reach the required material<br />
quality, the calculated efficiencies in Figure 3 are the potential<br />
average efficiencies in manufacturing based on the<br />
various multijunction <strong>cell</strong> bandgap combinations; champion<br />
<strong>cell</strong> efficiencies can be still higher.<br />
Figure 3. Progression of various terrestrial concentrator solar <strong>cell</strong> designs, beginning with today’s 3-junction C3MJ+ and <strong>40%</strong> C4MJ<br />
<strong>cell</strong>s, and increasing <strong>efficiency</strong> to <strong>over</strong> 50% under the concentrated AM1.5D spectrum.<br />
Prog. Photovolt: Res. Appl. (2012) © 2012 John Wiley & Sons, Ltd.<br />
DOI: 10.1002/pip
<strong>Solar</strong> <strong>cell</strong> <strong>generations</strong> <strong>over</strong> <strong>40%</strong> <strong>efficiency</strong><br />
R. R. King et al.<br />
The <strong>cell</strong> designs in Figure 3 represent only a few of the possible<br />
<strong>cell</strong> architectures leading to efficiencies from <strong>40%</strong> to<br />
50% but each serves as an example of the design considerations,<br />
some positive, some negative, that must be contended<br />
with on this path. Beginning toward the left, Figure 3(b) shows<br />
a 3-junction upright MM <strong>cell</strong> structure. A larger schematic<br />
cross-section of this <strong>cell</strong> design, which corresponds to the<br />
<strong>40%</strong> production average <strong>efficiency</strong> C4MJ <strong>cell</strong>, is shown in<br />
Figure 4(a). Calculated light I–V curves for each sub<strong>cell</strong> and<br />
the integrated 3 J <strong>cell</strong> are plotted in Figure 4(b). Such 3-junction<br />
upright metamorphic GaInP/GaInAs/Ge concentrator <strong>cell</strong>s<br />
[1,3,4,17] have higher <strong>efficiency</strong> in principle than their latticematched<br />
(LM) counterparts, because the larger lattice constant<br />
in the metamorphic upper sub<strong>cell</strong>s (sub<strong>cell</strong>s 1 and 2) allows<br />
their bandgap to be lowered. For the wavelength distribution<br />
of the solar spectrum, the tradeoff between current and voltage<br />
is favorable for the lower bandgaps of the metamorphic upper<br />
sub<strong>cell</strong>s. This tradeoff results in maximum <strong>efficiency</strong> for an<br />
MM GaInAs sub<strong>cell</strong> 2 composition of around 16%–17%<br />
indium in 3-junction GaInP/GaInAs/Ge <strong>cell</strong>s [1,17,18], and<br />
with the composition of the MM GaInP sub<strong>cell</strong> 1 at the same<br />
lattice constant. Figure 3(c) shows a schematic cross-section<br />
of this <strong>cell</strong> type, with 40.5% projected production average <strong>efficiency</strong><br />
under the AM1.5D solar spectrum. The lower lattice<br />
mismatch and sub<strong>cell</strong> 2 composition of 5%-In GaInAs in<br />
<strong>40%</strong>-efficient C4MJ <strong>cell</strong>s represent a more robust, lower manufacturing<br />
cost approach than <strong>cell</strong>s with higher indium content<br />
and lattice mismatch in the upper sub<strong>cell</strong>s, that still delivers<br />
substantial gain in <strong>cell</strong> <strong>efficiency</strong>, as well as providing the first<br />
step for commercial solar <strong>cell</strong>s on the technology path to metamorphic<br />
<strong>cell</strong> architectures.<br />
Continuing in the family of upright metamorphic <strong>cell</strong>s,<br />
4-junction AlGaInP/AlGaInAs/GaInAs/Ge upright metamorphic<br />
<strong>cell</strong>s as shown in Figure 3(e) and Figure 5 are<br />
attractive candidates for the next generation of concentrator<br />
solar <strong>cell</strong>s, because they have a projected average <strong>efficiency</strong><br />
<strong>over</strong> 44%, well in excess of the nominal <strong>40%</strong> production <strong>efficiency</strong><br />
of present C4MJ <strong>cell</strong>s; they require only a single<br />
growth run and a single metamorphic buffer; they utilize<br />
upright layer growth, avoiding thermal budget and dopant<br />
memory issues that can occur in inverted growth; and avoid<br />
the extra process complexity, cost, and yield loss associated<br />
with handle bonding and substrate removal for inverted<br />
metamorphic <strong>cell</strong>s. However, questions remain about<br />
whether the highly lattice-mismatched AlGaInP and<br />
AlGaInAs sub<strong>cell</strong>s, at around 1.5% mismatch to the lattice<br />
constant of the Ge growth substrate, corresponding to<br />
Figure 4. (a) Cross-sectional diagram and (b) illuminated I–V<br />
curves for sub<strong>cell</strong>s and the full multijunction <strong>cell</strong> for a 3-junction,<br />
upright metamorphic (MM) GaInP/GaInAs/Ge concentrator solar<br />
<strong>cell</strong> (C4MJ), with modeled production average <strong>efficiency</strong> of<br />
40.0% at 500 suns (50.0 W/cm 2 ).<br />
Figure 5. (a) Cross-sectional diagram and (b) illuminated I–V<br />
curves for sub<strong>cell</strong>s and the full multijunction <strong>cell</strong> for a 4-junction,<br />
upright metamorphic (MM) AlGaInP/AlGaInAs/GaInAs/Ge concentrator<br />
solar <strong>cell</strong>, with modeled production average <strong>efficiency</strong><br />
of 44.4% at 500 suns (50.0 W/cm 2 ).<br />
Prog. Photovolt: Res. Appl. (2012) © 2012 John Wiley & Sons, Ltd.<br />
DOI: 10.1002/pip
R. R. King et al.<br />
<strong>Solar</strong> <strong>cell</strong> <strong>generations</strong> <strong>over</strong> <strong>40%</strong> <strong>efficiency</strong><br />
22%-In GaInAs, and with substantial Al content, can have<br />
the required minority-carrier lifetimes and mobilities.<br />
In another example, 5-junction <strong>cell</strong>s with a dual-junction<br />
Ge/Ge sub<strong>cell</strong> combination for the lower two sub<strong>cell</strong>s [19],<br />
using an epitaxially-grown Ge sub<strong>cell</strong> 4, with an AlGaInP/<br />
AlGaInAs/GaInAs/Ge/Ge LM 5-junction structure as shown<br />
in Figure 3(g) and Figure 6, also has an attractive projected<br />
43.2% average <strong>efficiency</strong>. Other metamorphic variations using<br />
an epitaxial SiGe or SiGeSn sub<strong>cell</strong> with higher bandgap than<br />
Ge can have still higher <strong>efficiency</strong>. The <strong>cell</strong> shown in Figure 6<br />
is fully lattice-matched, simplifying manufacturing and<br />
avoiding the time and materials associated with growth of a<br />
metamorphic buffer. The upright structure of the 5-junction<br />
Ge/Ge <strong>cell</strong> also has the significant reduced thermal budget,<br />
reduced dopant memory, and reduced processing cost advantages<br />
described in the last paragraph, compared with inverted<br />
metamorphic structures. However, questions remain about<br />
the material quality, minority-carrier properties, and high degree<br />
of transparency needed for the epitaxial Ge, SiGe, or<br />
SiGeSn sub<strong>cell</strong>s.<br />
The need for a semiconductor with ~1-eV bandgap at or<br />
near the lattice constant of Ge or GaAs can be satisfied in<br />
principle using dilute nitride semiconductors such as GaInNAs<br />
Figure 6. (a) Cross-sectional diagram and (b) illuminated I–V<br />
curves for sub<strong>cell</strong>s and the full multijunction <strong>cell</strong> for a 5-junction,<br />
lattice-matched AlGaInP/AlGaInAs/GaInAs/epitaxial Ge/Ge concentrator<br />
solar <strong>cell</strong>, with modeled production average <strong>efficiency</strong><br />
of 43.2% at 500 suns (50.0 W/cm 2 ).<br />
or GaInNAsSb, with compositions around just 0.5% to 3%<br />
nitrogen [20–27]. GaInNAs sub<strong>cell</strong>s grown by molecular<br />
beam epitaxy have demonstrated the necessary level of current<br />
density to be current matched in a 3-junction GaInP/GaAs/<br />
GaInNAs or 4-junction GaInP/GaAs/GaInNAs/Ge solar <strong>cell</strong><br />
[28]. Recently, a 3-junction <strong>cell</strong> using a dilute nitride bottom<br />
sub<strong>cell</strong> was independently measured to have a record<br />
<strong>efficiency</strong> of 43.5% [7]. Doping control and long minoritycarrier<br />
diffusion lengths have historically been challenging to<br />
achieve in GaInNAs sub<strong>cell</strong>s grown by low cost, high<br />
throughput metal-organic vapor-phase epitaxy (MOVPE),<br />
though rich opportunities exist for growing these highly<br />
versatile ~1-eV GaInNAs(Sb) materials by low-cost growth<br />
methods.<br />
Given the challenges in achieving high current densities in<br />
dilute nitride GaInNAs(Sb) materials, it can be advantageous<br />
to divide the solar spectrum more finely with the multijunction<br />
<strong>cell</strong> structure, such as a 5-junction or 6-junction <strong>cell</strong>, resulting<br />
in a high-voltage, lower-current multijunction <strong>cell</strong> for which<br />
the GaInNAs(Sb) <strong>cell</strong> can be current matched [19]. MOVPE<br />
GaInNAs <strong>cell</strong>s were monolithically integrated into the first<br />
6-junction <strong>cell</strong>s in 2004 [29], and improved external quantum<br />
efficiencies were demonstrated in [30]. GaInNAs <strong>cell</strong>s<br />
with 1.168-eV bandgap have been grown at <strong>Spectrolab</strong> on<br />
100-mm-diameter Ge wafers, in production-scale MOVPE<br />
reactors capable of growing 12 wafers per run at rates of<br />
15–30 mm per hour, with open-circuit voltage V oc of 684 mV<br />
at 1 sun. This bandgap-voltage offset (E g /q) V oc of 484 mV<br />
can be improved upon with further work and can already<br />
support many of the high-<strong>efficiency</strong> multijunction <strong>cell</strong> architectures<br />
envisioned with dilute nitride sub<strong>cell</strong>s. A 5-junction<br />
AlGaInP/AlGaInAs/GaInAs/GaInNAs(Sb)/Ge upright LM<br />
<strong>cell</strong> structure and projected average <strong>efficiency</strong> are shown in<br />
Figure 3(h) and Figure 7, with a projected production average<br />
<strong>efficiency</strong> of 47.4%. Again, the upright, LM structure of this<br />
design carries the formidable advantages of reduced thermal<br />
budget and dopant memory issues, and avoidance of the extra<br />
process complexity, cost, and yield loss associated with handle<br />
bonding and substrate removal, compared with inverted metamorphic<br />
<strong>cell</strong>s. Integrated 4-junction <strong>cell</strong>s with a similar sub<strong>cell</strong><br />
bandgap combination as the 5-junction <strong>cell</strong>, but with the dilute<br />
nitride sub<strong>cell</strong> 4 absent, have been built and have reached<br />
measured efficiencies of 36.9% at 500 suns (50.0 W/cm 2 )with<br />
relatively little optimization to date [31].<br />
In spite of the greater expense and complexity associated<br />
with handle bonding and substrate removal for IMM <strong>cell</strong><br />
structures, their ability to combine high bandgap, LM <strong>cell</strong>s<br />
with low bandgap, metamorphic <strong>cell</strong>s, with a high degree<br />
of bandgap flexibility, allows for very high efficiencies in<br />
practice. An example of a 6-junction AlGaInP/AlGaAs/<br />
AlGaAs/GaInAs/GaInAs/GaInAs IMM <strong>cell</strong> with an<br />
MMX3 buffer structure is shown in Figure 3(j) and Figure 8.<br />
The inverted metamorphic structure allows the bandgap<br />
combination needed for a projected 50.9% production<br />
average <strong>efficiency</strong> to be grown in a single growth run, albeit<br />
one with three metamorphic buffers. Questions about the<br />
achievable electronic properties of these new solar <strong>cell</strong> compositions<br />
and structures need to be answered experimentally,<br />
Prog. Photovolt: Res. Appl. (2012) © 2012 John Wiley & Sons, Ltd.<br />
DOI: 10.1002/pip
<strong>Solar</strong> <strong>cell</strong> <strong>generations</strong> <strong>over</strong> <strong>40%</strong> <strong>efficiency</strong><br />
R. R. King et al.<br />
Figure 7. (a) Cross-sectional diagram and (b) illuminated I–V curves<br />
for sub<strong>cell</strong>s and the full multijunction <strong>cell</strong> for a 5-junction, latticematched<br />
AlGaInP/AlGaInAs/GaInAs/dilute nitride GaInNAs(Sb)/Ge<br />
concentrator solar <strong>cell</strong>, with modeled production average <strong>efficiency</strong><br />
of 47.4% at 500 suns (50.0 W/cm 2 ).<br />
and these empirical studies will show which of the many<br />
promising theoretical solar <strong>cell</strong> designs are best suited to<br />
high-volume production.<br />
4. ENERGY PRODUCTION<br />
As for all solar <strong>cell</strong>s, energy production <strong>over</strong> the course of the<br />
day and year is of great interest, in addition to the <strong>efficiency</strong><br />
under standard conditions [16,32–3]. These two figures of<br />
merit are naturally very strongly correlated, but it is energy<br />
production that directly impacts the revenue, and therefore<br />
the cost-effectiveness, of a photovoltaic system.<br />
The energy production of 4-junction, 5-junction, and 6-<br />
junction <strong>cell</strong>s was modeled in detail in [16], showing that the<br />
effects of varying current balance in 4-junction, 5-junction,<br />
and 6-junction terrestrial concentrator <strong>cell</strong>s with changes in<br />
incident spectrum are noticeable, but are far outweighed by<br />
the increased <strong>efficiency</strong> of these advanced <strong>cell</strong> designs. The<br />
similarity in the 4-junction and 5-junction efficiencies in<br />
Figure 9 is due to the specific sub<strong>cell</strong> bandgaps chose for these<br />
cases, as given in [16]; for other bandgap choices, 5-junction<br />
<strong>cell</strong>s may show a larger <strong>efficiency</strong> advantage <strong>over</strong> 4-junction<br />
<strong>cell</strong>s. Figure 9(a) below from [16] shows that by 7.50 h<br />
Figure 8. (a) Cross-sectional diagram and (b) illuminated I–V<br />
curves for sub<strong>cell</strong>s and the full multijunction <strong>cell</strong> for a 6-junction,<br />
inverted metamorphic (IMM) <strong>cell</strong> and three transparent graded<br />
buffer regions (MMX3), with an AlGaInP/AlGaAs/AlGaAs/GaInAs/GaInAs/GaInAs<br />
structure, and with modeled production average<br />
<strong>efficiency</strong> of 50.9% at 500 suns (50.0 W/cm 2 ).<br />
(7:30 AM) on a representative day (the autumnal equinox),<br />
the 6-junction <strong>cell</strong> <strong>efficiency</strong> exceeds that of the 3-junction,<br />
4-junction, and 5-junction <strong>cell</strong>s, and thereafter is the highest<br />
<strong>efficiency</strong> <strong>cell</strong> type <strong>over</strong> the most significant energy-producing<br />
hours of the day. The 6-junction <strong>cell</strong> has higher total energy<br />
production <strong>over</strong> this typical day than designs with fewer<br />
sub<strong>cell</strong>s, as shown in Figure 9(b), including conventional<br />
LM 3-junction <strong>cell</strong>s, owing to the higher <strong>efficiency</strong> design,<br />
lower carrier thermalization losses, and lower series resistance<br />
losses of the 6-junction <strong>cell</strong>. Table I from [16] shows that the<br />
effect of changing solar spectrum <strong>over</strong> the course of the day<br />
lowers energy production by only ~1.1% relative in going<br />
from 3-junction to 6-junction <strong>cell</strong>s, whereas the <strong>efficiency</strong><br />
of 6-junction <strong>cell</strong>s under STC is <strong>over</strong> 23% higher on a<br />
relative basis (>23% higher power) than the 3-junction <strong>cell</strong>s<br />
Prog. Photovolt: Res. Appl. (2012) © 2012 John Wiley & Sons, Ltd.<br />
DOI: 10.1002/pip
R. R. King et al.<br />
<strong>Solar</strong> <strong>cell</strong> <strong>generations</strong> <strong>over</strong> <strong>40%</strong> <strong>efficiency</strong><br />
Figure 9. (a) Multijunction <strong>cell</strong> <strong>efficiency</strong> <strong>over</strong> the course of the day, modeled for 3-junction, 4-junction, 5-junction, and 6-junction <strong>cell</strong>s<br />
on the autumnal equinox and (b) modeled cumulative energy produced per unit area <strong>over</strong> the day, clearly showing that the higher <strong>efficiency</strong><br />
4-junction and 5-junction <strong>cell</strong> designs produce more energy than conventional 3-junction <strong>cell</strong>s, and 6-junction <strong>cell</strong>s produce<br />
more than any of the other <strong>cell</strong> designs by the end of the day (from [16]).<br />
in Table I. Thus, having greater than three junctions is not an<br />
<strong>over</strong>all impediment to the energy production of a multijunction<br />
<strong>cell</strong>, and because a greater number of junctions also<br />
allow for higher <strong>efficiency</strong>, such <strong>cell</strong>s with 4-junction,<br />
5-junction, and 6-junction are actually a route toward higher<br />
energy production that is difficult to avoid.<br />
5. EXPERIMENTAL RESULTS<br />
Experimental results are given in this section for some of<br />
today’s state-of-the-art multijunction <strong>cell</strong>s. Figure 10 charts <strong>efficiency</strong><br />
distributions for the last five <strong>generations</strong> of <strong>Spectrolab</strong><br />
production terrestrial concentrator <strong>cell</strong>s at 500 suns (50.0 W/<br />
cm 2 ): the C1MJ, C2MJ, C3MJ, C3MJ+, and C4MJ <strong>cell</strong>s.<br />
Upright metamorphic 3-junction GaInP/GaInAs/Ge concentrator<br />
<strong>cell</strong>s, of the type that were first to reach <strong>over</strong> the <strong>40%</strong><br />
<strong>efficiency</strong> milestone, have now entered manufacturing<br />
production as the C4MJ <strong>cell</strong>. As shown in Figure 10, manufacturing<br />
production of the C4MJ terrestrial concentrator <strong>cell</strong> has<br />
demonstrated an average <strong>efficiency</strong> of 39.8% to date and is<br />
expected climb to the nominal <strong>40%</strong> average <strong>efficiency</strong> for<br />
C4MJ as production continues.<br />
Measurements are shown here for the first time of an<br />
upright metamorphic 3-junction GaInP/GaInAs/Ge solar<br />
<strong>cell</strong> with independently-confirmed 41.6% <strong>efficiency</strong> at<br />
484 suns (48.4 W/cm 2 ) (AM1.5D, ASTM G173-03,<br />
25 C), the highest yet demonstrated for an upright<br />
metamorphic solar <strong>cell</strong> of this highly manufacturable<br />
type, requiring a single MOVPE growth run. This<br />
metamorphic <strong>cell</strong> result matches the earlier record<br />
<strong>efficiency</strong> of 41.6% on a LM 3-junction GaInP/GaInAs/<br />
Ge <strong>cell</strong> [5]. The present metamorphic <strong>cell</strong> result is<br />
particularly remarkable because it was achieved at the<br />
Prog. Photovolt: Res. Appl. (2012) © 2012 John Wiley & Sons, Ltd.<br />
DOI: 10.1002/pip
<strong>Solar</strong> <strong>cell</strong> <strong>generations</strong> <strong>over</strong> <strong>40%</strong> <strong>efficiency</strong><br />
R. R. King et al.<br />
Table I. Comparison of key energy production parameters of: Peak multijunction solar <strong>cell</strong> <strong>efficiency</strong> during the day; Efficiency <strong>over</strong><br />
the day; and Spectrum utilization <strong>efficiency</strong> <strong>over</strong> the day as defined in the table, calculated for 3, 4, 5, and 6-junction <strong>cell</strong>s, from [16].<br />
3-junction 4-junction 5-junction 6-junction<br />
Peak multijunction solar <strong>cell</strong> <strong>efficiency</strong> during day 40.5% 47.2% 47.7% 50.5%<br />
Efficiency <strong>over</strong> day = 38.6% 45.1% 45.1% 47.7%<br />
Cell output energy during day/<br />
Energy in incident spectrum during day<br />
Spectrum utilization factor <strong>over</strong> day = 0.954 0.956 0.944 0.943<br />
Efficiency <strong>over</strong> day/<br />
Peak multijunction solar <strong>cell</strong> <strong>efficiency</strong><br />
Figure 10. Efficiency histograms of the last five <strong>generations</strong> of <strong>Spectrolab</strong> terrestrial concentrator <strong>cell</strong> products, from the C1MJ <strong>cell</strong><br />
with 36.9% average production <strong>efficiency</strong>, C2MJ with 37.7%, C3MJ with 38.8%, C3MJ+ with 39.3%, and production data for the<br />
newly introduced upright metamorphic C4MJ solar <strong>cell</strong> at 39.8% to date. Average <strong>efficiency</strong> for the C4MJ <strong>cell</strong> is anticipated to reach<br />
<strong>40%</strong> with continued refinement of production processes.<br />
relatively high concentration of 484 suns (48.4 W/cm 2 ),<br />
and on a fairly large concentrator <strong>cell</strong> with 1.0 cm 2 aperture<br />
area. The measured light I–V curve for this <strong>cell</strong> is<br />
shown in Figure 11(a), and the dependence of measured<br />
<strong>efficiency</strong> as a function of incident intensity is plotted<br />
in Figure 11(b). The <strong>efficiency</strong> of this metamorphic 3-<br />
junction <strong>cell</strong> is still <strong>over</strong> 41% for incident intensities<br />
above 740 suns (74.0 W/cm 2 ).<br />
6. SUMMARY<br />
The current path from <strong>40%</strong> to 50% terrestrial concentrator <strong>cell</strong><br />
<strong>efficiency</strong> is shown to markedly widen the geographic areas<br />
for which solar electricity can be generated cost effectively<br />
in the US and Europe. A progression of future multijunction<br />
<strong>cell</strong> structures is shown and modeled, with efficiencies ranging<br />
from the present-day C3MJ+ and <strong>40%</strong> C4MJ 3-junction <strong>cell</strong>s,<br />
to <strong>cell</strong> designs with <strong>over</strong> 50% projected average <strong>efficiency</strong>.<br />
The <strong>efficiency</strong> advantage of <strong>cell</strong> architectures with 4, 5, and<br />
6 junctions—as many <strong>cell</strong> designs on the path to 50%<br />
<strong>efficiency</strong> are—far outweighs the current balance effects of<br />
variable spectrum <strong>over</strong> the course of a typical day, giving<br />
such <strong>cell</strong>s greater energy production than for conventional 3-<br />
junction <strong>cell</strong>s. Efficiency distributions for the type of upright<br />
metamorphic 3-junction concentrator <strong>cell</strong> that first exceeded<br />
the <strong>40%</strong> <strong>efficiency</strong> milestone, now in production as the<br />
C4MJ <strong>cell</strong>, average 39.8% at 500 suns (50.0 W/cm 2 ).<br />
Independently confirmed light I–V measurements are given<br />
for a metamorphic 3-junction GaInP/GaInAs/Ge solar <strong>cell</strong> of<br />
41.6% at 484 suns (48.4 W/cm 2 ), the highest <strong>efficiency</strong> yet<br />
demonstrated for this type of <strong>cell</strong> using a single MOVPE<br />
growth run. If minority-carrier properties comparable with<br />
those in today’s 3-junction <strong>cell</strong>s can be maintained, the new<br />
solar <strong>cell</strong> materials and structures described here ranging up<br />
to 50% projected average <strong>efficiency</strong> promise to open wide<br />
Prog. Photovolt: Res. Appl. (2012) © 2012 John Wiley & Sons, Ltd.<br />
DOI: 10.1002/pip
R. R. King et al.<br />
<strong>Solar</strong> <strong>cell</strong> <strong>generations</strong> <strong>over</strong> <strong>40%</strong> <strong>efficiency</strong><br />
Figure 11. (a) Light I–V characteristic of a metamorphic 3-<br />
junction <strong>Spectrolab</strong> <strong>cell</strong> with 41.6% <strong>efficiency</strong> at 484 suns<br />
(48.4 W/cm 2 ), the highest yet achieved for a solar <strong>cell</strong> using a<br />
single MOVPE growth run; and (b) measured <strong>efficiency</strong> as a function<br />
of incident intensity, or concentration, for the 41.6%-efficient<br />
metamorphic 3-junction <strong>Spectrolab</strong> <strong>cell</strong>. The results were independently<br />
confirmed by the Fraunhofer Institute for <strong>Solar</strong> Energy (ISE)<br />
solar <strong>cell</strong> calibration lab.<br />
geographic regions in the United States, Europe, and North<br />
Africa, for cost-effective concentrator photovoltaic power.<br />
ACKNOWLEDGEMENTS<br />
The authors would like to thank Daryl Myers at NREL for<br />
help with the wide array of solar resource databases<br />
available, Gerald Siefer and the photovoltaic calibration<br />
laboratory (CalLab) at Fraunhofer Institute for <strong>Solar</strong> Energy<br />
(ISE) for calibrated solar <strong>cell</strong> measurements, Omar Al-Taher,<br />
Pete Hebert, Randy Brandt, Peichen Pien, Shoghig<br />
Mesropian, Dimitri Krut, Kent Barbour, Mark Takahashi,<br />
Andrey Masalykin, John Frost, and the entire multijunction<br />
solar <strong>cell</strong> team at <strong>Spectrolab</strong>.<br />
REFERENCES<br />
1. King RR, Law DC, Edmondson KM, Fetzer CM,<br />
Kinsey GS, Yoon H, Sherif RA, Karam NH. <strong>40%</strong><br />
efficient metamorphic GaInP/GaInAs/Ge multijunction<br />
solar <strong>cell</strong>s. Applied Physics Letters 2007; 90: 183516,<br />
doi: 10.1063/1.2734507.<br />
2. Geisz JF, Friedman DJ, Ward JS, Duda A, Olavarria WJ,<br />
Moriarty TE, Kiehl JT, Romero MJ, Norman AG, Jones KM.<br />
40.8% efficient inverted triple-junction solar <strong>cell</strong> with two<br />
independently metamorphic junctions. Applied Physics<br />
Letters 2008; 93: 123505, doi:10.1063/1.2988497.<br />
3. Dimroth F, Guter W, Schone J, Welser E, Steiner M,<br />
Oliva E, Wekkeli A, Siefer G, Philipps SP, Bett AW.<br />
Metamorphic GaInP/GaInAs/Ge triple-junction solar<br />
<strong>cell</strong>s with > 41% <strong>efficiency</strong>. 34th IEEE Photovoltaic<br />
Specialists Conf. (PVSC), Philadelphia, PA 2009;<br />
1038, doi: 10.1109/PVSC.2009.5411199.<br />
4. Guter W, Schone J, Philipps SP, Steiner M, Siefer G,<br />
Wekkeli A, Welser E, Oliva E, Bett AW, Dimroth F.<br />
Current-matched triple-junction solar <strong>cell</strong> reaching<br />
41.1% conversion <strong>efficiency</strong> under concentrated<br />
sunlight. Applied Physics Letters 2009; 94: 223504,<br />
doi: 10.1063/1.3148341.<br />
5. King RR, Boca A, Hong W, Liu X-Q, Bhusari D,<br />
Larrabee D, Edmondson KM, Law DC, Fetzer CM,<br />
Mesropian S, Karam NH. Band-Gap-Engineered<br />
Architectures for High-Efficiency Multijunction<br />
Concentrator <strong>Solar</strong> Cells. 24th European Photovoltaic<br />
<strong>Solar</strong> Energy Conference (EU PVSEC), Hamburg,<br />
Germany 2009; 55, ISBN 3-936338-25-6.<br />
6. Wojtczuk S, Chiu P, Zhang X, Derkacs D, Harris C,<br />
Pulver D, Timmons M. InGaP/GaAs/InGaAs<br />
Concentrators Using Bi-Facial Epigrowth. 35th IEEE Photovoltaic<br />
Specialists Conf. (PVSC), Honolulu, HI 2010.<br />
7. <strong>Solar</strong> Junction press release, April 14, 2011, Diandra<br />
Weldon, http://www.sjsolar.com/downloads/<strong>Solar</strong>_<br />
Junction_World_Record_%20Efficiency_14April11.pdf .<br />
8. U.S. Energy Information Administration, International<br />
Energy Annual 2004, released May-July 2006, http://<br />
www.eia.doe.gov/iea/<strong>over</strong>view.html.<br />
9. National Aeronautics and Space Administration (NASA)<br />
Atmospheric Science Data Center, Surface meteorology<br />
and <strong>Solar</strong> Energy (SSE), Release 6.0, Meteorology and<br />
<strong>Solar</strong> Energy, Regional data subsets, http://eosweb.larc.<br />
nasa.gov/cgi-bin/sse/sse.cgi?+s01#s01 .<br />
10. National Renewable Energy Laboratory (NREL),<br />
Dynamic Maps, GIS Data, & Analysis Tools, Concentrating<br />
<strong>Solar</strong> Power Radiation (10 km)—Static Maps,<br />
Annual, February 2009, http://www.nrel.gov/gis/<br />
images/map_csp_us_10km_annual_feb2009.jpg .<br />
11. U.S. Dept. of Energy, Energy Efficiency and Renewable<br />
Energy (EERE), Funding Opportunity Exchange,<br />
DE-FOA-0000492: Foundational Program to Advance<br />
Cell Efficiency (F-PACE), FULL TEXT, PDF:<br />
Amendment 002 - Foundational Program to Advance<br />
Cell Efficiency, June 1, 2011, https://eere-exchange.<br />
Prog. Photovolt: Res. Appl. (2012) © 2012 John Wiley & Sons, Ltd.<br />
DOI: 10.1002/pip
<strong>Solar</strong> <strong>cell</strong> <strong>generations</strong> <strong>over</strong> <strong>40%</strong> <strong>efficiency</strong><br />
R. R. King et al.<br />
energy.gov/Default.aspx#1767d3fc-9c9e-4c93-bb3e-<br />
6d93ecf0105f .<br />
12. Swanson RM. The Promise of Concentrators. Progress<br />
in Photovoltaics: Research and Applications 2000; 8:<br />
93–111.<br />
13. Green MA. Third generation photovoltaics: ultra-high<br />
conversion <strong>efficiency</strong> at low cost. Progress in Photovoltaics:<br />
Research and Applications 2001; 9: 123,<br />
doi: 10.1002/pip.360.<br />
14. Ermer JH, Jones RK, Hebert P, Pien P, King RR,<br />
Bhusari D, Brandt R, Al-Taher O, Fetzer C, Kinsey GS,<br />
Karam N. Status of C3MJ + and C4MJ Production<br />
Concentrator <strong>Solar</strong> Cells at <strong>Spectrolab</strong>. 37th IEEE Photovoltaic<br />
Specialists Conf. (PVSC), Seattle, Washington<br />
2011.<br />
15. King RR, Law DC, Edmondson KM, Fetzer CM,<br />
Kinsey GS, Yoon H, Sherif RA, Krut DD, Ermer JH,<br />
Hebert P, Pien P, Karam NH. Multijunction <strong>Solar</strong><br />
Cells with Over <strong>40%</strong> Efficiency and Future Directions<br />
in Concentrator PV. 22nd European Photovoltaic<br />
<strong>Solar</strong> Energy Conf., Milan, Italy 2007; 11–15.<br />
16. King RR, Bhusari D, Boca A, Larrabee D, Liu X-Q,<br />
Hong W, Fetzer CM, Law DC, Karam NH. Band<br />
gap-voltage offset and energy production in nextgeneration<br />
multijunction solar <strong>cell</strong>s. Progress in<br />
Photovoltaics: Research and Applications 2011; 19:<br />
797–812, doi: 10.1002/pip.1044, and 5th World Conf.<br />
on Photovoltaic Energy Conversion and 25th European<br />
Photovoltaic <strong>Solar</strong> Energy Conf., Valencia,<br />
Spain, Sep. 2010, pp. 33–46.<br />
17. King RR, Haddad M, Isshiki T, Colter P, Ermer J,<br />
Yoon H, Joslin DE, Karam NH. Metamorphic<br />
GaInP/GaInAs/Ge <strong>Solar</strong> Cells. 28th IEEE Photovoltaic<br />
Specialists Conf. (PVSC), Anchorage, Alaska<br />
2000; 982–985.<br />
18. King RR, Sherif RA, Law DC, Yen JT, Haddad M,<br />
Fetzer CM, Edmondson KM, Kinsey GS, Yoon H,<br />
Joshi M, Mesropian S, Cotal HL, Krut DD, Ermer<br />
JH, Karam NH. New Horizons in III-V Multijunction<br />
Terrestrial Concentrator Cell Research. 21st European<br />
Photovoltaic <strong>Solar</strong> Energy Conf., Dresden, Germany<br />
2006; 124–128.<br />
19. U.S. Pat. No. 6,316,715, Multijunction Photovoltaic<br />
Cell with Thin 1st (Top) Sub<strong>cell</strong> and Thick 2nd<br />
Sub<strong>cell</strong> of Same or Similar Semiconductor Material.<br />
R. R. King, D. E. Joslin, N. H. Karam, filed Mar. 15,<br />
2000, issued Nov. 13, 2001.<br />
20. Geisz JF, Friedman DJ, Olson JM, Kurtz SR,<br />
Keyes BM, Journal of Crystal Growth 1998; 195: 401.<br />
21. Kurtz SR, Allerman AA, Seager CH, Sieg RM,<br />
Jones ED, Applied Physics Letters 2000; 77: 400.<br />
22. Kurtz SR, Allerman AA, Jones ED, Gee JM, Banas JJ,<br />
Hammons BE, Applied Physics Letters 1999; 74: 729.<br />
23. Li JZ, Lin JY, Jiang HX, Geisz JF, Kurtz SR, Applied<br />
Physics Letters 1999; 75: 1899.<br />
24. Kurtz S, Geisz JF, Friedman DJ, Metzger WK,<br />
King RR, Karam NH, Journal of Applied Physics<br />
2004; 95: 2505.<br />
25. Kurtz S, Geisz JF, Keyes BM, Metzger WK, Friedman DJ,<br />
Olson JM, Ptak AJ, King RR, Karam NH, Applied Physics<br />
Letters 2003; 82: 2634.<br />
26. Volz K, Torunski T, Lackner D, Rubel O, Stolz W,<br />
Baur C, Muller S, Dimroth F, Bett AW. Material development<br />
for improved 1 eV (GaIn)(NAs) solar <strong>cell</strong><br />
structures. Transaction of the ASME 2007; 129: 266.<br />
27. Volz K, Lackner D, Nemeth I, Kunert B, Stolz W, Baur C,<br />
Dimroth F, Bett AW. Optimization of annealing<br />
conditions of (GaIn)(NAs) for solar <strong>cell</strong> applications.<br />
Journal of Crystal Growth 2008; 310: 2222.<br />
28. Jackrel DB, Bank SR, Yuen HB, Wistey MA,<br />
Harris JS, Jr., Ptak AJ, Johnston SW, Friedman DJ,<br />
Kurtz SR, Journal of Applied Physics 2007; 101: 114916.<br />
29. King RR, Fetzer CM, Edmondson KM, Law DC,<br />
Colter PC, Cotal HL, Sherif RA, Yoon H, Isshiki T,<br />
Krut DD, Kinsey GS, Ermer JH, Kurtz S, Moriarty T,<br />
Kiehl J, Emery K, Metzger WK, Ahrenkiel RK,<br />
Karam NH. Metamorphic III-V Materials, Sublattice<br />
Disorder, and Multijunction <strong>Solar</strong> Cell Approaches<br />
with Over 37% Efficiency. Proc. 19th European<br />
Photovoltaic <strong>Solar</strong> Energy Conf., Paris, France, June<br />
7–11, 2004; 3587–3593.<br />
30. King RR, Law DC, Fetzer CM, Sherif RA,<br />
Edmondson KM, Kurtz S, Kinsey GS, Cotal HL,<br />
Krut DD, Ermer JH, Karam NH. Pathways to<br />
<strong>40%</strong>-Efficient Concentrator Photovoltaics. Proc.<br />
20th European Photovoltaic <strong>Solar</strong> Energy Conf.,<br />
Barcelona, Spain, June 6–10, 2005; 118–123.<br />
31. King RR, Boca A, Hong W, Liu X-Q, Bhusari D,<br />
Larrabee D, Edmondson KM, Law DC, Fetzer CM,<br />
Mesropian S, Karam NH.. Band-Gap-Engineered<br />
Architectures for High-Efficiency Multijunction Concentrator<br />
<strong>Solar</strong> Cells. 24th European Photovoltaic<br />
<strong>Solar</strong> Energy Conf., Hamburg, Germany, Sep. 21–25,<br />
2009; 55–61.<br />
32. Létay G, Baur C, Bett AW. Theoretical Investigations<br />
of III-V Multi-junction Concentrator Cells Under<br />
Realistic Spectral Conditions. 19th European Photovoltaic<br />
<strong>Solar</strong> Energy Conf. 2004; 187–190.<br />
33. King RR, Sherif RA, Law DC, Yen JT, Haddad M,<br />
Fetzer CM, Edmondson KM, Kinsey GS, Yoon H,<br />
Joshi M, Mesropian S, Cotal HL, Krut DD, Ermer JH,<br />
Karam NH. New Horizons in III-V Multijunction<br />
Terrestrial Concentrator Cell Research. 21st European<br />
Photovoltaic <strong>Solar</strong> Energy Conference<br />
(EU PVSEC), Dresden, Germany 2006; 124, ISBN<br />
3-936338-20-5.<br />
Prog. Photovolt: Res. Appl. (2012) © 2012 John Wiley & Sons, Ltd.<br />
DOI: 10.1002/pip
R. R. King et al.<br />
<strong>Solar</strong> <strong>cell</strong> <strong>generations</strong> <strong>over</strong> <strong>40%</strong> <strong>efficiency</strong><br />
34. Kinsey GS, Edmondson KM. Spectral response and<br />
energy output of concentrator multijunction solar <strong>cell</strong>s.<br />
Progress in Photovoltaics: Research and Applications<br />
2009; 17: 279–288, doi: 10.1002/pip.<br />
35. Newman F, Aiken D, Patel P, Chumney D, Aeby I,<br />
Hoffman R, Sharps P. Optimization of inverted metamorphic<br />
multijunction solar <strong>cell</strong>s for field-deployed<br />
concentrating PV systems. 34th IEEE Photovoltaic<br />
Specialists Conference (PVSC) 2009; 1611–1616, doi:<br />
10.1109/PVSC.2009.5411385<br />
36. Philipps SP, Peharz G, Hoheisel R, Hornung T,<br />
Al-Abbadi NM, Dimroth F, Bett AW. Energy harvesting<br />
<strong>efficiency</strong> of III-V triple-junction concentrator solar <strong>cell</strong>s<br />
under realistic spectral conditions. <strong>Solar</strong> Energy Materials<br />
and <strong>Solar</strong> Cells 2010; 94: 869–877, ISSN 0927–<br />
0248, doi: 10.1016/j.solmat.2010.01.010.<br />
37. Dimroth F, Philipps SP, Peharz G, Welser E, Kellenbenz R,<br />
Roesener T, Klinger V, Oliva E, Steiner M, Meusel M,<br />
Guter W, Bett AW. Promises of Advanced Multijunction<br />
<strong>Solar</strong> Cells for the Use in CPV Systems. 35th<br />
IEEE Photovoltaic Specialists Conf. (PVSC), Honolulu,<br />
HI 2010.<br />
38. <strong>Spectrolab</strong> data sheet, CPV Point Focus <strong>Solar</strong> Cells,<br />
C4MJ Metamorphic Fourth Generation CPV Technology,<br />
July 12, 2011, http://www.spectrolab.com/Data-<br />
Sheets/PV/CPV/C4MJ_40Percent_<strong>Solar</strong>_Cell.pdf.<br />
39. Verlinden PJ, Lewandowski A, Bingham C, Kinsey GS,<br />
Sherif RA, Lasich JB. Performance and Reliability of<br />
Multijunction III-V Modules for Concentrator Dish and<br />
Central Receiver Applications. 4th World Conf. on<br />
Photovoltaic Energy Conversion (WCPEC), Waikoloa,<br />
Hawaii 2006.<br />
APPENDIX A<br />
The economic benefits of high-<strong>efficiency</strong> are straightforward<br />
to calculate. In a simplified approach, the system cost<br />
per unit of generated energy, (C/E) system , is the cost of the<br />
system per unit module aperture area, divided by the<br />
energy per area generated <strong>over</strong> a given payback time:<br />
and:<br />
P system; rated ¼ Int inc;rated Z AC;system A mod<br />
(A3)<br />
C <strong>cell</strong> = cost of solar <strong>cell</strong>s in system<br />
C <strong>cell</strong> pkg = cost of <strong>cell</strong> packaging (excl. <strong>cell</strong>), e.g.,<br />
ceramic mount, electrical interconnects,<br />
bypass diode, secondary concentrator,<br />
other elements of receiver package<br />
C mod pkg = cost of module packaging (excl. <strong>cell</strong>s and<br />
<strong>cell</strong> packaging), e.g., glazing, lenses or<br />
mirrors of primary concentrator, encapsulation,<br />
module housing, etc.<br />
C tracking = cost of tracking mechanism<br />
C BOS, area = cost of area-related balance-of-system (BOS)<br />
hardware (excl. tracking and power<br />
conditioning), e.g., support structures, wiring<br />
C IMF = cost of installation, operations and<br />
maintenance, and financing<br />
C pwr cond /<br />
P system,rated =<br />
cost of power conditioning unit (inverter)<br />
for system, divided by rated power<br />
output of system<br />
aperture area of <strong>cell</strong>s in system<br />
aperture area of modules in system<br />
A <strong>cell</strong> =<br />
A mod =<br />
R geo = geometric concentration ratio of<br />
system A mod /A <strong>cell</strong><br />
Int inc,rated = incident intensity of sunlight at which<br />
system power is rated, typically 1000 W/m 2<br />
Int annual avg = intensity of solar resource (direct normal for<br />
concentrator system, global for flat-plate<br />
system) in a given geographic location,<br />
typically in units of kWh/(m 2 day)<br />
T payback = time allotted to pay back capital cost of<br />
system, using revenue from power generated<br />
AC, system = total <strong>efficiency</strong> of PV system, from<br />
sunlight to AC power.<br />
Equation A1 is the same as Eqn. 1 discussed earlier, but<br />
with greater detail in the costs shown, because C BOS in Eqn<br />
<br />
C mod<br />
þ C tracking<br />
C A<br />
¼ mod A mod<br />
E<br />
system<br />
<br />
<br />
C <strong>cell</strong> þ C <strong>cell</strong> pkg<br />
¼<br />
A <strong>cell</strong><br />
1<br />
R geo<br />
þ C BOS; area<br />
A mod<br />
Int annual avg Z AC;system T payback<br />
þ C mod pkg<br />
A mod<br />
þ C IMF<br />
A mod<br />
þ C pwr cond<br />
A mod<br />
þ C tracking<br />
A mod<br />
þ C BOS; area<br />
A mod<br />
Int annual avg Z AC;system T payback<br />
þ C <br />
IMF<br />
þ<br />
C <br />
pwr cond<br />
Int inc;rated Z AC;system<br />
A mod P system; rated<br />
(A1)<br />
in units of $/kWh of generated electricity, where:<br />
C mod<br />
¼ C <br />
<br />
<strong>cell</strong> þ C <strong>cell</strong> pkg 1<br />
þ C mod pkg<br />
A mod A <strong>cell</strong> R geo A mod<br />
(A2)<br />
1isdefined to be C tracking + C BOS, area + C IMF . For a fixed,<br />
non-tracking PV system C tracking =0.<br />
In terms of cost per watt, or $/W, the system cost per<br />
unit rated power is:<br />
Prog. Photovolt: Res. Appl. (2012) © 2012 John Wiley & Sons, Ltd.<br />
DOI: 10.1002/pip
<strong>Solar</strong> <strong>cell</strong> <strong>generations</strong> <strong>over</strong> <strong>40%</strong> <strong>efficiency</strong><br />
<br />
C<br />
¼ C mod þ C tracking þ C BOS; area þ C IMF þ C pwr cond<br />
P<br />
system<br />
P system; rated<br />
C mod<br />
þ C tracking<br />
þ C BOS; area<br />
þ C IMF<br />
þ C pwr cond<br />
A<br />
¼ mod A mod A mod A mod A mod<br />
Int inc; rated Z AC;system<br />
such that:<br />
(A4)<br />
<br />
C<br />
¼ C <br />
<br />
Int annual avg T payback<br />
P<br />
system<br />
E<br />
system<br />
Int inc; rated<br />
(A5)<br />
R. R. King et al.<br />
include land costs, because the cost of land is highly variable<br />
dependingonspecific location. Land costs may be folded<br />
into C BOS, area if desired, because it is an area-related cost.<br />
The cost of land for photovoltaic systems is often smaller<br />
than one might expect, especially for remote desert areas<br />
used for some utility-scale PV fields, or essentially free on<br />
flat commercial rooftops or buildings already owned by the<br />
PV customer. Additional costs associated with tracking<br />
mechanisms for concentrator photovoltaic systems are<br />
included and are also tabulated below in Table II.<br />
in units of $/W.<br />
For the four cases discussed in the text, the cost parameters<br />
consistent with the US Department of Energy<br />
current “Business as Usual” 2016 cost projections for<br />
utility scale PV systems [11] that were used in this study<br />
are tabulated below in Table II. These costs do not explicitly<br />
APPENDIX B<br />
The total system <strong>efficiency</strong> is the product of <strong>cell</strong>,STC , the<br />
solar <strong>cell</strong> <strong>efficiency</strong> at standard test conditions (STC), and<br />
several other efficiencies<br />
Z AC;system ¼ Z <strong>cell</strong>;STC Z optical Z pwr cond f temp f current mismatch; f current mismatch;<br />
design vs:avg:spectrum changing spectrum<br />
f tracking error<br />
(B1)<br />
Table II. Economic and performance input parameters, and the calculated cost-effectiveness threshold for Int annual avg in units of<br />
(kWh/(m 2 day)), shown in bold, for the four CPV system cases discussed in the paper.<br />
CPV system costs Case 1 Case 2 Case 3 Case 4<br />
Cell technology III-V MJ III-V MJ III-V MJ Silicon CPV<br />
Cell eff. at STC <strong>40%</strong> 50% 50% 26%<br />
Optical <strong>efficiency</strong> of CPV system 80% 80% 85% 80%<br />
Intensity on <strong>cell</strong> (W/cm 2 ) 50.0 50.0 85.0 50.0<br />
Given (C/E) system = 0.14<br />
$/kWh,<br />
threshold for cost effectiveness occurs at<br />
Int annual avg (kWh/(m 2 day)) 5.84 4.76 4.10 7.46<br />
C pwr cond /P system,rated ($/W) 0.18 0.18 0.18 0.18<br />
(C BOS + C IMF )/P system,rated ($/W) 0.97 0.78 0.73 1.58<br />
C tracking /P system,rated ($/W) 0.19 0.15 0.14 0.31<br />
C mod /P system,rated ($/W) 1.05 0.84 0.62 0.98<br />
C system /P system,rated ($/W) 2.39 1.95 1.68 3.05<br />
C <strong>cell</strong> /A <strong>cell</strong> ($/cm 2 ) 7.50 7.50 7.50 0.00<br />
C <strong>cell</strong> pkg /A <strong>cell</strong> ($/cm 2 ) 2.50 2.50 2.50 2.50<br />
<strong>cell</strong>, STC (%) <strong>40%</strong> 50% 50% 26%<br />
R geo (unit less) 625 625 1000 625<br />
optical (%) 80% 80% 85% 80%<br />
Intensity on <strong>cell</strong> (W/cm 2 ) 50.0 50.0 85.0 50.0<br />
AC,system (%) 26.8% 33.5% 35.6% 16.5%<br />
Int inc,rated (W/m 2 ) 1000 1000 1000 1000<br />
T payback (years) 8 8 8 8<br />
C <strong>cell</strong> /A mod ($/m 2 ) 120 120 75 0<br />
C <strong>cell</strong> pkg /A mod ($/m 2 ) 40 40 25 40<br />
C mod pkg /A mod ($/m 2 ) 122 122 122 122<br />
C pwr cond /A mod ($/m 2 ) 48 60 64 30<br />
(C BOS + C IMF )/A mod ($/m 2 ) 260 260 260 260<br />
C tracking /A mod ($/m 2 ) 51 51 51 51<br />
C mod /A mod ($/m 2 ) 282 282 222 162<br />
C system /A mod ($/m 2 ) 642 654 597 503<br />
STC, standard test conditions; CPV, concentrator photovoltaic or concentrator photovoltaics.<br />
Prog. Photovolt: Res. Appl. (2012) © 2012 John Wiley & Sons, Ltd.<br />
DOI: 10.1002/pip
R. R. King et al.<br />
<strong>Solar</strong> <strong>cell</strong> <strong>generations</strong> <strong>over</strong> <strong>40%</strong> <strong>efficiency</strong><br />
Table III. Efficiency and performance factors contributing to <strong>over</strong>all CPV system <strong>efficiency</strong>, shown in bold, for the four CPV system<br />
cases described in the text.<br />
CPV system <strong>efficiency</strong><br />
Cell<br />
technology<br />
Cell<br />
eff. at<br />
(STC)<br />
Optical<br />
<strong>efficiency</strong><br />
of CPV<br />
system<br />
Intensity<br />
on <strong>cell</strong><br />
(W/cm 2 )<br />
AC,<br />
system<br />
f current mismatch,<br />
<strong>cell</strong>, pwr<br />
design vs.<br />
STC optical cond f temp<br />
avg. spectrum<br />
f current mismatch,<br />
changing spectrum<br />
f tracking<br />
error<br />
Case 1 III-V MJ <strong>40%</strong> 80% 50.0 26.8% <strong>40%</strong> 80% 97% 0.925 0.99 0.954 0.99<br />
Case 2 III-V MJ 50% 80% 50.0 33.5% 50% 80% 98% 0.925 0.99 0.944 0.99<br />
Case 3 III-V MJ 50% 85% 85.0 35.6% 50% 85% 98% 0.925 0.99 0.944 0.99<br />
Case 4 Silicon CPV 26% 80% 50.0 16.5% 26% 80% 97% 0.825 1.0 1.0 0.99<br />
STC, standard test conditions; CPV, concentrator photovoltaic or concentrator photovoltaics.<br />
where:<br />
optical =<br />
<strong>efficiency</strong> of system optics (e.g.,<br />
primary and secondary concentrators)<br />
pwr cond = <strong>efficiency</strong> of power conditioning<br />
unit<br />
f temp =<br />
fraction of power at STC remaining<br />
at operating temperature<br />
f current mismatch, = fraction of power remaining<br />
design vs. avg. spectrum because of the difference<br />
between the standard design solar<br />
spectrum and average actual<br />
spectrum<br />
f current mismatch, = fraction of energy production<br />
changing spectrum remaining because of changes in<br />
the actual spectrum <strong>over</strong> the day<br />
and year, with respect to the<br />
average actual spectrum<br />
f tracking error = fraction of energy production<br />
remaining because of tracking errors<br />
For the four cases discussed in the text, the various<br />
contributions to concentrator photovoltaic (CPV) system <strong>efficiency</strong><br />
that were used in this study are tabulated below in<br />
Table III:<br />
For the temperature dependence, a temperature delta of<br />
50 C was assumed between an operating temperature of<br />
75 C and the temperature at STC of 25 C. The power<br />
temperature coefficient used was 0.15 relative%/ C<br />
for III-V multijunction <strong>cell</strong>s ( 0.06 absolute%/ C in<br />
<strong>efficiency</strong>) [4], and 0.35 relative%/ C for high-<strong>efficiency</strong><br />
silicon back contact CPV <strong>cell</strong>s [5]. In practical applications,<br />
the spectrum for which the sub<strong>cell</strong>s in a multijunction <strong>cell</strong><br />
are designed to be current matched, the design spectrum,<br />
may be somewhat different than the average spectrum<br />
under actual operating conditions, as discussed in [14]. This<br />
can reduce the energy production of the multijunction <strong>cell</strong> and<br />
is accounted for in Eqn B1 with the factor<br />
f current mismatch;<br />
design vs: avg: spectrum<br />
. Additionally, the actual spectrum at<br />
any given time is typically different than the average actual<br />
spectrum, contributing to current mismatch among sub<strong>cell</strong>s,<br />
and reducing the <strong>over</strong>all energy production of the<br />
multijunction <strong>cell</strong>. This effect is quantified by the factor<br />
f current mismatch;<br />
changing spectrum<br />
in Eqn B1 and was modeled as the<br />
spectrum utilization factor <strong>over</strong> day in [16], as shown in<br />
Table I. The modeled values for this spectrum utilization factor<br />
of 0.954 for a 3-junction <strong>cell</strong> were used in Case 1 for a <strong>40%</strong><br />
efficient <strong>cell</strong>, and 0.944 for a 5-junction <strong>cell</strong> was used for<br />
Cases 2 and 3 for 50% efficient <strong>cell</strong>s, as shown in Table III.<br />
Prog. Photovolt: Res. Appl. (2012) © 2012 John Wiley & Sons, Ltd.<br />
DOI: 10.1002/pip