S T A Y I N G A H E A D O F T H E G A M E - Singapore Press Holdings
S T A Y I N G A H E A D O F T H E G A M E - Singapore Press Holdings
S T A Y I N G A H E A D O F T H E G A M E - Singapore Press Holdings

You also want an ePaper? Increase the reach of your titles
YUMPU automatically turns print PDFs into web optimized ePapers that Google loves.
FINANCIAL REVIEW (CONT’D)<br />
FINANCIAL REVIEW (CONT’D)<br />
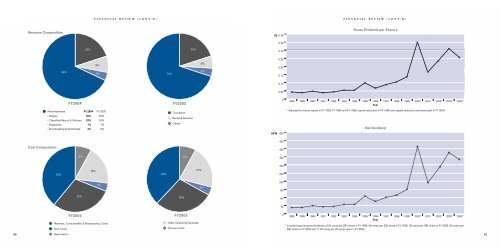
Revenue Composition<br />
S$ 0.40<br />
Gross Dividend per Share #<br />
0.35<br />
20%<br />
20%<br />
0.30<br />
0.25<br />
68%<br />
8%<br />
4%<br />
70%<br />
6%<br />
4%<br />
0.20<br />
0.15<br />
0.10<br />
0.05<br />
FY2004<br />
FY2003<br />
0<br />
1988 1989 1990 1991 1992 1993 1994 1995* 1996 1997 1998 1999 2000* 2001 2002* 2003* 2004*<br />
Year<br />
Advertisements FY 2004 FY 2003<br />
– Display 40% 40%<br />
– Classified,Recruit & Notices 23% 24%<br />
– Magazines 1% 1%<br />
– Broadcasting & Multimedia 4% 5%<br />
Circulation<br />
Rental & Services<br />
Others<br />
* Adjusted for bonus issues in FY 1993, FY 1995 and FY 1998, capital reduction in FY 1999 and capital reduction and share split in FY 2004.<br />
Net Dividend<br />
S$’M<br />
500<br />
450<br />
Cost Composition<br />
400<br />
8%<br />
8%<br />
350<br />
300<br />
39%<br />
19%<br />
38%<br />
21%<br />
250<br />
4%<br />
4%<br />
200<br />
150<br />
30%<br />
29%<br />
100<br />
50<br />
FY2004<br />
Materials, Consumables & Broadcasting Costs<br />
Staff Costs<br />
FY2003<br />
Other Operating Expenses<br />
Finance Costs<br />
0<br />
1988 1989 1990 1991 1992 1993 1994 1995* 1996 1997 1998 1999 2000* 2001 2002* 2003* 2004*<br />
Year<br />
* Included special gross dividends of 20 cents per S$1 share in FY 1995, 80 cents per S$1 share in FY 2000, 30 cents per S$1 share in FY 2002, 60 cents per<br />
S$1 share in FY 2003 and 11.25 cents per 20 cents share in FY 2004.<br />
80<br />
Depreciation<br />
81