S T A Y I N G A H E A D O F T H E G A M E - Singapore Press Holdings
S T A Y I N G A H E A D O F T H E G A M E - Singapore Press Holdings
S T A Y I N G A H E A D O F T H E G A M E - Singapore Press Holdings

You also want an ePaper? Increase the reach of your titles
YUMPU automatically turns print PDFs into web optimized ePapers that Google loves.
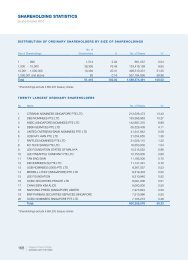
SHAREHOLDING STATISTICS<br />
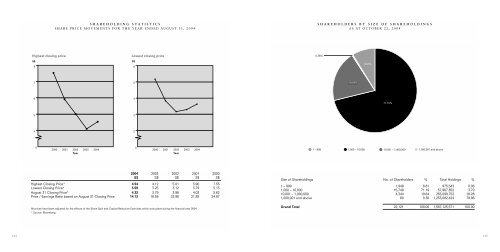
SHARE PRICE MOVEMENTS FOR THE YEAR ENDED AUGUST 31, 2004<br />
SHAREHOLDERS BY SIZE OF SHAREHOLDINGS<br />
AS AT OCTOBER 22, 2004<br />
Highest closing price<br />
Lowest closing price<br />
0.36%<br />
S$<br />
8<br />
S$<br />
6<br />
8.81%<br />
5.5<br />
7<br />
5<br />
5.0<br />
19.64%<br />
4.5<br />
6<br />
4<br />
4.0<br />
3.5<br />
71.19%<br />
5<br />
3<br />
3.0<br />
2.5<br />
4<br />
2<br />
0<br />
0<br />
2000 2001 2002 2003 2004 2000 2001 2002 2003 2004<br />
Year<br />
Year<br />
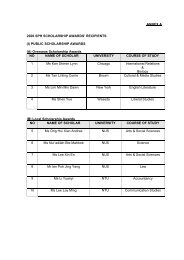
1 – 999<br />
1,000 – 10,000 10,001 – 1,000,000 1,000,001 and above<br />
2004 2003 2002 2001 2000<br />
S$ S$ S$ S$ S$<br />
Highest Closing Price* 4.54 4.12 5.01 5.90 7.55<br />
Lowest Closing Price* 3.59 3.25 3.12 3.79 5.13<br />
August 31 Closing Price* 4.32 3.79 3.98 4.02 5.62<br />
Price / Earnings Ratio based on August 31 Closing Price 14.12 18.58 23.98 21.85 24.87<br />
All prices have been adjusted for the effects of the Share Split and Capital Reduction Exercises which took place during the financial year 2004.<br />
* Source: Bloomberg<br />
Size of Shareholdings No. of Shareholders % Total <strong>Holdings</strong> %<br />
1 – 999 1,948 8.81 975,543 0.06<br />
1,000 – 10,000 15,749 71.19 57,967,852 3.70<br />
10,001 – 1,000,000 4,344 19.64 255,099,752 16.28<br />
1,000,001 and above 80 0.36 1,253,082,424 79.96<br />
Grand Total 22,121 100.00 1,567,125,571 100.00<br />
144<br />
145