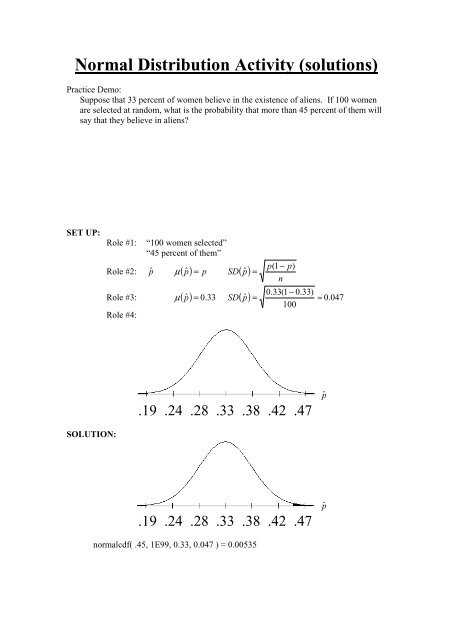
Normal Distribution Activity (solutions)
Normal Distribution Activity (solutions)
Normal Distribution Activity (solutions)

You also want an ePaper? Increase the reach of your titles
YUMPU automatically turns print PDFs into web optimized ePapers that Google loves.
<strong>Normal</strong> <strong>Distribution</strong> <strong>Activity</strong> (<strong>solutions</strong>)<br />
Practice Demo:<br />
Suppose that 33 percent of women believe in the existence of aliens. If 100 women<br />
are selected at random, what is the probability that more than 45 percent of them will<br />
say that they believe in aliens?<br />
SET UP:<br />
Role #1:<br />
“100 women selected”<br />
“45 percent of them”<br />
Role #2: pˆ µ ( p ˆ ) = p SD( pˆ<br />
)<br />
=<br />
p(1<br />
− p)<br />
n<br />
0.33(1 − 0.33)<br />
SD ˆp<br />
0.047<br />
100<br />
Role #3: µ ( pˆ ) = 0.33 ( ) =<br />
≈<br />
Role #4:<br />
.19 .24 .28 .33 .38 .42 .47<br />
pˆ<br />
SOLUTION:<br />
.19 .24 .28 .33 .38 .42 .47<br />
pˆ<br />
normalcdf( .45, 1E99, 0.33, 0.047 ) = 0.00535
<strong>Normal</strong> <strong>Distribution</strong> <strong>Activity</strong> (<strong>solutions</strong>)<br />
1. Suppose family incomes in a town are normally distributed with a mean of $1,200<br />
and a standard deviation of $600 per month. What is the probability that a family<br />
has an income between $1,400 and $2,250?<br />
SET UP:<br />
Role #1: No sample of size greater than one was taken.<br />
Family incomes are the population.<br />
Role #2: X µ σ<br />
Role #3: µ = 1200 σ = 600<br />
Role #4:<br />
-600 0 600 1200 1800 2400 3000<br />
X<br />
SOLUTION:<br />
-600 0 600 1200 1800 2400 3000<br />
X<br />
normalcdf( 1400, 2250, 1200, 600 ) = 0.3294
<strong>Normal</strong> <strong>Distribution</strong> <strong>Activity</strong> (<strong>solutions</strong>)<br />
2. An opinion poll asks, “Are you afraid to go outside at night within a mile of your<br />
home because of crime?” Suppose that the proportion of all adults who would say<br />
“Yes” to this question is 0.4. Assume that the poll obtained 20 answers randomly.<br />
What percent of such polls with 20 responses have 10 or more say “Yes.”<br />
SET UP:<br />
Role #1:<br />
“20 responses”<br />
“10 or more say ‘Yes’”<br />
“proportion of all adults”<br />
Role #2: pˆ µ ( p ˆ ) = p SD( pˆ<br />
)<br />
=<br />
p(1<br />
− p)<br />
n<br />
0.4(1 − 0.4)<br />
SD ˆp<br />
0.110<br />
20<br />
Role #3: µ ( pˆ ) = 0.4 ( ) =<br />
≈<br />
Role #4:<br />
.07 .18 .29 .4 .51 .62 .73<br />
pˆ<br />
SOLUTION:<br />
Having 10 or more out of a sample of 20 say “Yes” is equivalent to having<br />
10<br />
p ˆ ≥ . In other words, p ˆ ≥ 0. 5 .<br />
20<br />
.07 .18 .29 .4 .51 .62 .73<br />
pˆ<br />
normalcdf( 0.5, 1E99, 0.4, 0.110 ) = 0.180655 or about 18.1% of such polls
<strong>Normal</strong> <strong>Distribution</strong> <strong>Activity</strong> (<strong>solutions</strong>)<br />
3. Find the area under the curve between the z-scores of -2 and 1.<br />
SET UP:<br />
Role #1: No sample of size greater than one was taken.<br />
“z-scores”<br />
Role #2: z µ = 0 σ = 1<br />
Role #3: µ = 0 σ = 1<br />
Role #4:<br />
-3 -2 -1 0 1 2 3<br />
Z<br />
SOLUTION:<br />
-3 -2 -1 0 1 2 3<br />
Z<br />
normalcdf( -2, 1, 0, 1 ) = 0.81859
<strong>Normal</strong> <strong>Distribution</strong> <strong>Activity</strong> (<strong>solutions</strong>)<br />
4. Adult nose length is normally distributed with mean 45mm and standard deviation<br />
6mm. Find the probability that the sample mean nose length is between 44mm<br />
and 46mm for random samples of 36 adults.<br />
SET UP:<br />
Role #1:<br />
“samples of 36 adults”<br />
“sample mean nose length”<br />
Role #2: x µ ( x ) = µ SD( x)<br />
Role #3: ( x) =<br />
=<br />
σ<br />
n<br />
SD x =<br />
6<br />
36<br />
1<br />
µ 45 ( ) =<br />
Role #4:<br />
42 43 44 45 46 47 48<br />
x<br />
SOLUTION:<br />
42 43 44 45 46 47 48<br />
x<br />
By the Empirical Rule we see that the answer is about 68% because 44mm and<br />
46mm is exactly one standard deviation each way on the sample mean nose<br />
length distribution ( x distribution). More precisely we have<br />
normalcdf( 44, 46, 45, 1 ) = 0.68269 or 68.269%
<strong>Normal</strong> <strong>Distribution</strong> <strong>Activity</strong> (<strong>solutions</strong>)<br />
5. The weight of a particular brand of cookies has a normal distribution with a mean<br />
weight of 32 ounces and a standard deviation of 0.3 ounces. When we look at the<br />
mean weight of 20 packages, 68% of them will be between what two values?<br />
SET UP:<br />
Role #1:<br />
“mean weight of 20 packages”<br />
σ<br />
=<br />
n<br />
0. 3<br />
SD x = 0.067<br />
20<br />
Role #2: x µ ( x ) = µ SD( x)<br />
Role #3: ( x) =<br />
µ 32 ( ) ≈<br />
Role #4:<br />
SOLUTION:<br />
31.80 31.87 31.93 32 32.07 32.13 32.20<br />
x<br />
x<br />
31.80 31.87 31.93 32 32.07 32.13 32.20<br />
Similar to the previous problem where we used the Empirical Rule, we see that<br />
the answer is:<br />
When we look at the mean weight of 20 packages ( x values) about 68%<br />
of them will be between 31.93 ounces and 32.07 ounces.
<strong>Normal</strong> <strong>Distribution</strong> <strong>Activity</strong> (<strong>solutions</strong>)<br />
6. A restaurateur anticipates serving about 180 people on a Friday evening, and<br />
believes that about 20% of the patrons will order the chef’s steak special. How<br />
many of those meals should he plan on serving in order to be pretty sure of having<br />
enough steaks on hand to meet customer demand? Justify your answer, including<br />
an explanation of what “pretty sure” means to you.<br />
SET UP:<br />
Role #1:<br />
“serving about 180 people”<br />
“20% of the patrons”<br />
Role #2: pˆ µ ( p ˆ ) = p SD( pˆ<br />
)<br />
=<br />
p(1<br />
− p)<br />
n<br />
0.2(1 − 0.2)<br />
SD ˆp<br />
0.030<br />
180<br />
Role #3: µ ( pˆ ) = 0.2 ( ) =<br />
≈<br />
Role #4:<br />
.11 .14 .17 .2 .23 .26 .29<br />
pˆ<br />
SOLUTION:<br />
Here the population is all patrons that eat at that particular restaurant on Friday<br />
nights. The 180 people on this Friday evening is a sample (although not SRS!).<br />
The proportion of those 180 people ordering the chef’s steak special is the sample<br />
proportion or pˆ value. What could this value be? According to the Empirical<br />
Rule, we know that about 99.7% of all pˆ values occur between 0.11 and 0.29. It<br />
is highly unlikely that pˆ is greater than 0.29 since this happens only about 0.15%<br />
of the time ( 0 .3% = 0.15% ). Therefore, we would expect that the proportion of<br />
2<br />
the 180 patrons that order the chef’s steak would be no more than 0.29. Since<br />
29% of 180 people is 52.2 people, we conclude that the restaurateur should plan<br />
on serving 53 of those meals. That way the restaurateur can be “pretty sure” that<br />
orders of chef’s steak on Friday evenings can be filled (about 99.7% of Friday<br />
evenings).
<strong>Normal</strong> <strong>Distribution</strong> <strong>Activity</strong> (<strong>solutions</strong>)<br />
7. In this example we will be interested in the heights of northern European males.<br />
We take such a person and reduce him to a single number via the usual operations<br />
for measuring someone's height. Then we model the height of northern European<br />
males as a normal population with mu = 150 cm and sigma = 30 cm. If we<br />
sample one northern European male, what's the probability that his height will fall<br />
outside of 140 and 170? In other words, what are the chances that he'll be either<br />
below 140, or he'll be above 170 in height? That's what we mean by the word<br />
"outside."<br />
SET UP:<br />
Role #1: “sample one northern European”<br />
Heights of northern European males are the population.<br />
Role #2: X µ σ<br />
Role #3: µ = 150 σ = 30<br />
Role #4:<br />
60 90 120 150 180 210 240<br />
X<br />
SOLUTION:<br />
60 90 120 150 180 210 240<br />
X<br />
normalcdf( -1E99, 140, 150, 30 ) = 0.36944<br />
normalcdf( 170, 1E99, 150, 30 ) = 0.25249<br />
The probability that his height will fall outside 140 cm and 170 cm is<br />
0.36944 + 0.25249 = 0.62193 or about 62.2% of the time.
<strong>Normal</strong> <strong>Distribution</strong> <strong>Activity</strong> (<strong>solutions</strong>)<br />
8. Find the proportion of observations from the Standard <strong>Normal</strong> <strong>Distribution</strong> which<br />
are below 2.45.<br />
SET UP:<br />
Role #1: No sample of size greater than one was taken.<br />
“Standard <strong>Normal</strong> <strong>Distribution</strong>”<br />
Role #1: z µ = 0 σ = 1<br />
Role #2: µ = 0 σ = 1<br />
Role #3:<br />
-3 -2 -1 0 1 2 3<br />
Z<br />
SOLUTION:<br />
-3 -2 -1 0 1 2 3<br />
Z<br />
The word “proportion” is this exercise can be misleading since it is referring to<br />
the percentage (in decimal form) of z-scores less than 2.45. Here the proportion<br />
value is equivalent to the shaded area of the curve.<br />
normalcdf( -1E99, 2.45, 0, 1 ) = 0.99286