Per Capita Consumption of Fish and Fishery Products
Per Capita Consumption of Fish and Fishery Products
Per Capita Consumption of Fish and Fishery Products
Create successful ePaper yourself
Turn your PDF publications into a flip-book with our unique Google optimized e-Paper software.
<strong>Per</strong> <strong>Capita</strong> <strong>Consumption</strong><br />
The NMFS calculation <strong>of</strong> per capita consumption is<br />
based on a “disappearance” model. The total U.S.<br />
supply <strong>of</strong> imports <strong>and</strong> l<strong>and</strong>ings is converted to edible<br />
weight, <strong>and</strong> decreases in supply such as exports <strong>and</strong><br />
inventories are subtracted out. The remaining total is<br />
divided by a population value to estimate per capita<br />
consumption. Data for the model are derived<br />
primarily from secondary sources <strong>and</strong> are subject to<br />
incomplete reporting; changes in source data or<br />
invalid model assumptions may each have a significant<br />
effect on the resulting calculation.<br />
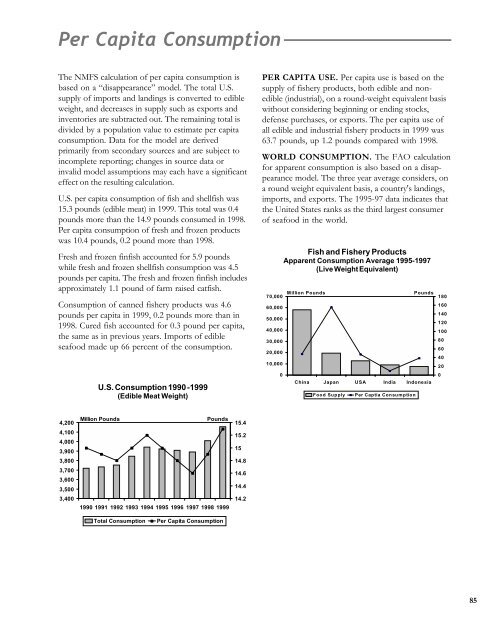
U.S. per capita consumption <strong>of</strong> fish <strong>and</strong> shellfish was<br />
15.3 pounds (edible meat) in 1999. This total was 0.4<br />
pounds more than the 14.9 pounds consumed in 1998.<br />
<strong>Per</strong> capita consumption <strong>of</strong> fresh <strong>and</strong> frozen products<br />
was 10.4 pounds, 0.2 pound more than 1998.<br />
Fresh <strong>and</strong> frozen finfish accounted for 5.9 pounds<br />
while fresh <strong>and</strong> frozen shellfish consumption was 4.5<br />
pounds per capita. The fresh <strong>and</strong> frozen finfish includes<br />
approximately 1.1 pound <strong>of</strong> farm raised catfish.<br />
<strong>Consumption</strong> <strong>of</strong> canned fishery products was 4.6<br />
pounds per capita in 1999, 0.2 pounds more than in<br />
1998. Cured fish accounted for 0.3 pound per capita,<br />
the same as in previous years. Imports <strong>of</strong> edible<br />
seafood made up 66 percent <strong>of</strong> the consumption.<br />
U.S. <strong>Consumption</strong> 1990 -1999<br />
(Edible Meat Weight)<br />
PER CAPITA USE. <strong>Per</strong> capita use is based on the<br />
supply <strong>of</strong> fishery products, both edible <strong>and</strong> nonedible<br />
(industrial), on a round-weight equivalent basis<br />
without considering beginning or ending stocks,<br />
defense purchases, or exports. The per capita use <strong>of</strong><br />
all edible <strong>and</strong> industrial fishery products in 1999 was<br />
63.7 pounds, up 1.2 pounds compared with 1998.<br />
WORLD CONSUMPTION. The FAO calculation<br />
for apparent consumption is also based on a disappearance<br />
model. The three year average considers, on<br />
a round weight equivalent basis, a country's l<strong>and</strong>ings,<br />
imports, <strong>and</strong> exports. The 1995-97 data indicates that<br />
the United States ranks as the third largest consumer<br />
<strong>of</strong> seafood in the world.<br />
70,000<br />
60,000<br />
50,000<br />
40,000<br />
30,000<br />
20,000<br />
10,000<br />
0<br />
<strong>Fish</strong> <strong>and</strong> <strong>Fish</strong>ery <strong>Products</strong><br />
Apparent <strong>Consumption</strong> Average 1995-1997<br />
(Live Weight Equivalent)<br />
Million Pounds<br />
China Japan USA India Indonesia<br />
Food Supply<br />
<strong>Per</strong> Captia <strong>Consumption</strong><br />
Pounds<br />
180<br />
160<br />
140<br />
120<br />
100<br />
80<br />
60<br />
40<br />
20<br />
0<br />
4,200<br />
4,100<br />
4,000<br />
3,900<br />
3,800<br />
3,700<br />
3,600<br />
3,500<br />
3,400<br />
Million Pounds<br />
Pounds<br />
1990 1991 1992 1993 1994 1995 1996 1997 1998 1999<br />
15.4<br />
15.2<br />
15<br />
14.8<br />
14.6<br />
14.4<br />
14.2<br />
Total <strong>Consumption</strong><br />
<strong>Per</strong> <strong>Capita</strong> <strong>Consumption</strong><br />
85
<strong>Per</strong> <strong>Capita</strong> <strong>Consumption</strong><br />
Total U.S. <strong>Consumption</strong><br />
Annual per capita consumption <strong>of</strong> seafood products represents the pounds <strong>of</strong> edible meat consumed from<br />
domestically-caught <strong>and</strong> imported fish <strong>and</strong> shellfish adjusted for beginning <strong>and</strong> ending inventories <strong>and</strong> exports,<br />
divided by the civilian population <strong>of</strong> the United States as <strong>of</strong> July 1 <strong>of</strong> each year.<br />
U.S. ANNUAL PER CAPITA CONSUMPTION OF COMMERCIAL FISH AND SHELLFISH, 1910-1999<br />
Year<br />
Civilian<br />
<strong>Per</strong> capita consumption<br />
resident<br />
population Fresh <strong>and</strong> Canned Cured<br />
Total<br />
July 1 (1) frozen (2) (3) (4)<br />
Million<br />
persons - - - - - - - -Pounds, edible meat- - - - - - - -<br />
1910 92.2 4.5 2.8 3.9 11.2<br />
1920 106.5 6.3 3.2 2.3 11.8<br />
1930 122.9 5.8 3.4 1.0 10.2<br />
1940 132.1 5.7 4.6 0.7 11.0<br />
1950 150.8 6.3 4.9 0.6 11.8<br />
1960 178.1 5.7 4.0 0.6 10.3<br />
1970 201.9 6.9 4.5 0.4 11.8<br />
1980 225.6 7.9 4.3 0.3 12.5<br />
1981 227.8 7.8 4.6 0.3 12.7<br />
1982 230.0 7.9 4.3 0.3 12.5<br />
1983 232.1 8.4 4.7 0.3 13.4<br />
1984 234.1 9.0 4.9 0.3 14.2<br />
1985 236.2 9.8 5.0 0.3 15.1<br />
1986 238.4 9.8 5.4 0.3 15.5<br />
1987 240.6 10.7 5.2 0.3 16.2<br />
1988 242.8 10.0 4.9 0.3 15.2<br />
1989 245.1 10.2 5.1 0.3 15.6<br />
1990 247.8 9.6 5.1 0.3 15.0<br />
1991 250.5 9.7 4.9 0.3 14.9<br />
1992 253.5 9.9 4.6 0.3 14.8<br />
1993 256.4 10.2 4.5 0.3 15.0<br />
1994 259.2 10.4 4.5 0.3 15.2<br />
1995 261.4 10.0 4.7 0.3 15.0<br />
1996 264.0 10.0 4.5 0.3 14.8<br />
1997 266.4 9.9 4.4 0.3 14.6<br />
1998 269.1 10.2 4.4 0.3 14.9<br />
1999 271.5 10.4 4.6 0.3 15.3<br />
(1) Resident population for 1910 <strong>and</strong> 1920 <strong>and</strong> civilian resident population for 1930 to date.<br />
(2) Fresh <strong>and</strong> frozen fish consumption for 1910 <strong>and</strong> 1920 is estimated. Beginning in 1973, data include consumption <strong>of</strong><br />
artificially cultivated catfish.<br />
(3) Canned fish consumption for 1920 is estimated. Beginning in 1921, it is based on production reports,<br />
packer stocks, <strong>and</strong> foreign trade statistics for individual years.<br />
(4) Cured fish consumption for 1910 <strong>and</strong> 1920 is estimated.<br />
*Record years: Fresh <strong>and</strong> Frozen--10.7 lb, 1987; Canned--5.8, 1936; Cured--4.0, 1909; <strong>and</strong> Total--16.2 lb, 1987.<br />
86
<strong>Per</strong> <strong>Capita</strong> <strong>Consumption</strong><br />
U.S. <strong>Consumption</strong><br />
U.S. ANNUAL PER CAPITA CONSUMPTION OF CANNED FISHERY PRODUCTS, 1980-99<br />
Year Salmon Sardines Tuna Shellfish Other Total<br />
- - - - - - - - - - - - - - - - - - - - - - - - - - - - - - - Pounds - - - - - - - - - - - - - - - - - - - - - - - - - - - - - - - -<br />
1980 0.5 0.3 3.0 0.4 0.1 4.3<br />
1981 0.5 0.4 3.0 0.4 0.3 4.6<br />
1982 0.5 0.3 2.8 0.4 0.3 4.3<br />
1983 0.5 0.2 3.2 0.4 0.4 4.7<br />
1984 0.6 0.2 3.2 0.4 0.5 4.9<br />
1985 0.5 0.3 3.3 0.5 0.4 5.0<br />
1986 0.5 0.3 3.6 0.5 0.5 5.4<br />
1987 0.4 0.3 3.5 0.5 0.5 5.2<br />
1988 0.3 0.3 3.6 0.4 0.3 4.9<br />
1989 0.3 0.3 3.9 0.4 0.2 5.1<br />
1990 0.4 0.3 3.7 0.3 0.4 5.1<br />
1991 0.5 0.2 3.6 0.4 0.2 4.9<br />
1992 0.5 0.2 3.5 0.3 0.1 4.6<br />
1993 0.4 0.2 3.5 0.3 0.1 4.5<br />
1994 0.4 0.2 3.3 0.3 0.3 4.5<br />
1995 0.5 0.2 3.4 0.3 0.3 4.7<br />
1996 0.5 0.2 3.2 0.3 0.3 4.5<br />
1997 0.4 0.2 3.1 0.3 0.4 4.4<br />
1998 0.3 0.2 3.4 0.3 0.2 4.4<br />
1999 0.3 0.2 3.4 0.4 0.3 4.6<br />
U.S. ANNUAL PER CAPITA CONSUMPTION OF CERTAIN FISHERY ITEMS, 1980-99<br />
Fillets Sticks Shrimp<br />
Year<br />
<strong>and</strong> <strong>and</strong> all<br />
steaks (1) portions preparation<br />
- - - - - - - - - - - - - - - - - - - - - - - - - - - - - - Pounds (2) - - - - - - - - - - - - - - - - - - - - - - - - - - - - - - -<br />
1980 2.4 2.0 1.4<br />
1981 2.4 1.8 1.5<br />
1982 2.5 1.7 1.5<br />
1983 2.7 1.8 1.7<br />
1984 3.0 1.8 1.9<br />
1985 3.2 1.8 2.0<br />
1986 3.4 1.8 2.2<br />
1987 * 3.6 1.7 2.4<br />
1988 3.2 1.5 2.4<br />
1989 3.1 1.5 2.3<br />
1990 3.1 1.5 2.2<br />
1991 3.0 1.2 2.4<br />
1992 2.9 0.9 2.5<br />
1993 2.9 1.0 2.5<br />
1994 3.1 0.9 2.6<br />
1995 2.9 1.2 2.5<br />
1996 3.0 1.0 2.5<br />
1997 3.0 1.0 2.7<br />
1998 3.2 0.9 2.8<br />
1999 3.2 1.0 * 3.0<br />
(1) Data include groundfish <strong>and</strong> other species. Data do not include blocks, but fillets could be made into<br />
blocks from which sticks <strong>and</strong> portions could be produced.<br />
(2) Product weight <strong>of</strong> fillets <strong>and</strong> steaks, sticks <strong>and</strong> portions; edible (meat) weight <strong>of</strong> shrimp.<br />
*Record<br />
87
<strong>Per</strong> <strong>Capita</strong> <strong>Consumption</strong><br />
World <strong>Consumption</strong><br />
ANNUAL PER CAPITA CONSUMPTION OF FISH AND SHELLFISH FOR HUMAN FOOD,<br />
BY REGION AND COUNTRY, 1995-97 AVERAGE<br />
Region Estimated live weight Region Estimated live weight<br />
<strong>and</strong> equivalent <strong>and</strong> equivalent<br />
Country Kilograms Pounds Country Kilograms Pounds<br />
North America:<br />
Europe - Continued:<br />
Canada 22.2 48.9 Bosnia-Hercegovina 1.2 2.6<br />
Greenl<strong>and</strong> 84.1 185.4 Bulgaria 2.0 4.4<br />
St. Pierre <strong>and</strong> Croatia 3.6 7.9<br />
Miquelon 68.6 151.2 Czech Republic 8.6 19.0<br />
United States 20.9 46.1 Denmark 23.6 52.0<br />
Estonia 20.4 45.0<br />
Faeroe Isl<strong>and</strong> 86.1 189.8<br />
Caribbean: Finl<strong>and</strong> 32.8 72.3<br />
France 28.4 62.6<br />
Antigua 23.9 52.7 Georgia 1.6 3.5<br />
Aruba 7.6 16.8 Germany 12.4 27.3<br />
Bahamas 22.0 48.5 Greece 25.4 56.0<br />
Barbados 30.4 67.0 Hungary 4.0 8.8<br />
Bermuda 37.9 83.6 Icel<strong>and</strong> 91.1 200.8<br />
Cayman Isl<strong>and</strong>s 13.3 29.3 Irel<strong>and</strong> 16.8 37.0<br />
Cuba 12.4 27.3 Italy 22.0 48.5<br />
Dominica 29.6 65.3 Kazakhstan 2.6 5.7<br />
Dominican Republic 8.1 17.9 Kyrgyzstan 0.4 0.9<br />
Grenada 23.8 52.5 Latvia 21.8 48.1<br />
Guadeloupe 40.5 89.3 Lithuania 16.9 37.3<br />
Haiti 2.6 5.7 Macedonia 4.3 9.5<br />
Jamaica 15.4 34.0 Malta 27.4 60.4<br />
Martinique 37.6 82.9 Moldova 1.3 2.9<br />
Netherl<strong>and</strong> Antilles 18.8 41.4 Netherl<strong>and</strong>s 15.4 34.0<br />
Saint Lucia 22.0 48.5 Norway 50.1 110.5<br />
St. Vincent 15.3 33.7 Pol<strong>and</strong> 10.5 23.1<br />
Trinidad-Tobago 12.2 26.9 Portugal 59.8 131.8<br />
Turks & Caicos 40.2 88.6 Romania 2.3 5.1<br />
Russian Federation 19.5 43.0<br />
Slovakia 7.1 15.7<br />
Latin America: Slovenia 6.9 15.2<br />
Spain 40.5 89.3<br />
Argentina 11.1 24.5 Sweden 26.1 57.5<br />
Belize 6.7 14.8 Switzerl<strong>and</strong> 13.8 30.4<br />
Bolivia 1.4 3.1 Tajikistan 0.1 0.2<br />
Brazil 6.9 15.2 Turkmenistan 2.2 4.9<br />
Chile 22.3 49.2 Ukraine 6.8 15.0<br />
Colombia 4.5 9.9 United Kingdom 20.1 44.3<br />
Costa Rica 5.2 11.5 Uzbekistan 0.5 1.1<br />
Ecuador 7.2 15.9 Yugoslavia 2.1 4.6<br />
El Salvador 2.5 5.5<br />
French Guiana 32.5 71.6<br />
Guatemala 1.1 2.4 Near East:<br />
Guyana 55.3 121.9<br />
Honduras 3.0 6.6 Afghanistan 0.1 0.2<br />
Mexico 10.5 23.1 Bahrain 16.2 35.7<br />
Nicaragua 1.3 2.9 Cyprus 21.0 46.3<br />
Panama 14.6 32.2 Egypt 9.3 20.5<br />
Paraguay 5.1 11.2 Iran 5.0 11.0<br />
<strong>Per</strong>u 25.4 56.0 Iraq 1.6 3.5<br />
Suriname 24.4 53.8 Israel 22.6 49.8<br />
Uruguay 7.1 15.7 Jordan 4.3 9.5<br />
Venezuela 20.1 44.3 Kuwait 12.5 27.6<br />
Lebanon 6.0 13.2<br />
Libya 6.5 14.3<br />
Europe: Oman 24.0 52.9<br />
Qatar 12.3 27.1<br />
Albania 1.3 2.9 Saudi Arabia 6.5 14.3<br />
Armenia 1.2 2.6 Sudan 1.7 3.7<br />
Austria 10.6 23.4 Syria 1.0 2.2<br />
Azerbaijan 1.2 2.6 Turkey 8.3 18.3<br />
Belarus 1.0 2.2 United Arab Emirates 27.4 60.4<br />
Belgium <strong>and</strong> Luxembourg 19.6 43.2 Yemen Republic 7.0 15.4<br />
See note at end <strong>of</strong> table.<br />
(Continued on next page)<br />
88
<strong>Per</strong> <strong>Capita</strong> <strong>Consumption</strong><br />
World <strong>Consumption</strong><br />
ANNUAL PER CAPITA CONSUMPTION OF FISH AND SHELLFISH FOR HUMAN FOOD,<br />
BY REGION AND COUNTRY, 1995-97 AVERAGE<br />
Region Estimated live weight Region Estimated live weight<br />
<strong>and</strong> equivalent <strong>and</strong> equivalent<br />
Country Kilograms Pounds Country Kilograms Pounds<br />
Far East:<br />
Africa - Continued:<br />
Bangladesh 10.1 22.3 Liberia 5.0 11.0<br />
Brunei 28.6 63.1 Madagascar 6.4 14.1<br />
Burma 16.9 37.3 Malawi 5.9 13.0<br />
Cambodia 9.1 20.1 Mali 11.3 24.9<br />
China 24.1 53.1 Mauritania 10.1 22.3<br />
Hong Kong 56.6 124.8 Mauritius 21.8 48.1<br />
India 4.6 10.1 Morocco 7.4 16.3<br />
Indonesia 17.9 39.5 Mozambique 2.0 4.4<br />
Japan 69.0 152.1 Namibia 12.1 26.7<br />
Laos 8.9 19.6 Niger 0.7 1.5<br />
Macao 35.7 78.7 Nigeria 6.3 13.9<br />
Maldives 169.8 374.3 Reunion 19.3 42.5<br />
Malaysia 55.7 60.6 Rw<strong>and</strong>a 0.6 1.3<br />
Mongolia 0.1 0.2 Sao Tome 22.4 49.4<br />
Nepal 1.0 2.2 Senegal 32.5 71.6<br />
North Korea 16.9 37.3 Seychelles 64.9 143.1<br />
Pakistan 2.0 4.4 Sierra Leone 12.4 27.3<br />
Philippines 31.0 68.3 Somalia 1.4 3.1<br />
Singapore 32.4 71.4 South Africa 7.7 17.0<br />
South Korea 51.2 112.9 St. Helena 68.1 150.1<br />
Sri Lanka 18.8 41.4 Swazil<strong>and</strong> 0.2 0.4<br />
Taiwan 37.3 82.2 Tanzania 10.7 23.6<br />
Thail<strong>and</strong> 32.4 71.4 Togo 15.7 34.6<br />
Vietnam 16.9 37.3 Tunisia 9.3 20.5<br />
Ug<strong>and</strong>a 9.5 20.9<br />
Zambia 8.4 18.5<br />
Africa: Zimbabwe 3.5 7.7<br />
Algeria 3.7 8.2 Oceania:<br />
Angola 7.5 16.5<br />
Benin 9.2 20.3 Australia 19.1 42.1<br />
Botswana 5.0 11.0 Cook Isl<strong>and</strong> 54.1 119.3<br />
Burkina 1.2 2.6 Fiji 32.7 72.1<br />
Burundi 2.5 5.5 French Polynesia 63.4 139.8<br />
Cameroon 9.8 21.6 Kiribati 74.2 163.6<br />
Cape Verde 24.9 54.9 Marshall Isl<strong>and</strong>s 6.6 14.6<br />
Central African Rep 4.0 8.8 Micronesia 40.8 89.9<br />
Chad 6.8 15.0 Nauru 37.9 83.6<br />
Comoros 21.7 47.8 New Caledonia 22.1 48.7<br />
Congo (Brazzaville) 25.9 57.1 New Zeal<strong>and</strong> 22.4 49.4<br />
Congo (Kinshasa) 5.9 13.0 Niue 56.3 124.1<br />
Djibouti 2.0 4.4 Palau 102.4 225.8<br />
Equatorial Guinea 20.1 44.3 Papua New Guinea 14.8 32.6<br />
Eritrea 0.8 1.8 Solomon Isl<strong>and</strong>s 40.6 89.5<br />
Ethiopia 0.1 0.2 Tokelau 152.5 336.2<br />
Gabon 47.5 104.7 Tonga 33.4 73.6<br />
Gambia 22.4 49.4 Tuvalu 20.0 44.1<br />
Ghana 21.8 48.1 Vanuatu 26.1 57.5<br />
Guinea 14.1 31.1 Wallis <strong>and</strong> Futuna Isl<strong>and</strong>s 12.5 27.6<br />
Guinea-Bissau 3.3 7.3 Western Samoa 55.5 122.4<br />
Ivory Coast 11.6 25.6<br />
Kenya 5.3 11.7<br />
Lesotho 0.0 0.0<br />
World 15.7 34.6<br />
Note:--Data for most countries are tentative. Aquatic plants are included where applicable.<br />
Source:--Food <strong>and</strong> Agriculture Organization <strong>of</strong> the United Nations (FAO)<br />
89
<strong>Per</strong> <strong>Capita</strong> <strong>Consumption</strong><br />
U.S. Use<br />
<strong>Per</strong> capita use <strong>of</strong> commercial fish <strong>and</strong> shellfish is based on the supply <strong>of</strong> fishery products, both edible <strong>and</strong><br />
nonedible (industrial), on a round weight equivalent basis, without considering the beginning or ending stocks,<br />
defense purchases, or exported.<br />
<strong>Per</strong> capita use figures are not comparable with per capita consumption data. <strong>Per</strong> capita consumption figures<br />
represent edible (for human use) meat weight consumption rather than round weight consumption. In<br />
addition, per capita consumption includes allowances for beginning <strong>and</strong> ending stocks <strong>and</strong> exports, whereas<br />
the use does not include such allowances.<br />
<strong>Per</strong> capita use is derived by using total population including U.S. Armed Forces overseas. The per capita<br />
consumption is derived by using civilian resident population.<br />
U.S ANNUAL PER CAPITA USE OF COMMERCIAL FISH AND SHELLFISH, 1960-99 (1)<br />
Total population<br />
<strong>Per</strong> capita utilization<br />
including armed U.S.<br />
Year<br />
forces overseas supply Commercial<br />
Imports<br />
Total<br />
July 1<br />
l<strong>and</strong>ings<br />
Million<br />
Million<br />
- - - - - - - - - - - - - - - - - Pounds - - - - - - - - - - - - - - - - -<br />
persons pounds<br />
1960 180.7 8,223 27.3 18.2 45.5<br />
1961 183.7 9,570 28.2 23.9 52.1<br />
1962 186.5 10,408 28.7 27.1 55.8<br />
1963 189.2 11,434 25.6 34.8 60.4<br />
1964 191.9 12,031 23.7 39.0 62.7<br />
1965 194.3 10,535 24.6 29.6 54.2<br />
1966 196.6 12,469 22.2 41.2 63.4<br />
1967 198.7 13,991 20.4 50.0 70.4<br />
1968 200.7 17,381 20.7 65.9 86.6<br />
1969 202.7 11,847 21.4 37.0 58.4<br />
1970 205.1 11,474 24.0 31.9 55.9<br />
1971 207.7 11,804 24.1 32.7 56.8<br />
1972 209.9 13,849 22.9 43.1 66.0<br />
1973 211.9 10,378 22.9 26.1 49.0<br />
1974 213.9 9,875 23.2 23.0 46.2<br />
1975 216.0 10,164 22.6 24.5 47.1<br />
1976 218.0 11,593 24.7 28.5 53.2<br />
1977 220.2 10,652 23.9 24.4 48.3<br />
1978 222.6 11,509 27.1 24.6 51.7<br />
1979 225.1 11,831 27.9 24.7 52.6<br />
1980 227.7 11,357 28.5 21.4 49.9<br />
1981 230.0 11,353 26.0 23.4 49.4<br />
1982 232.2 12,011 27.4 24.3 51.7<br />
1983 234.3 12,352 27.5 25.2 52.7<br />
1984 236.3 12,552 27.3 25.8 53.1<br />
1985 238.5 15,150 26.2 37.3 63.5<br />
1986 240.7 14,368 25.1 34.6 59.7<br />
1987 242.8 15,744 28.4 36.4 64.8<br />
1988 245.0 14,628 29.3 30.4 59.7<br />
1989 247.3 15,485 34.2 28.4 62.6<br />
1990 249.9 16,349 37.6 27.8 65.4<br />
1991 252.7 16,363 37.5 27.3 64.8<br />
1992 255.5 16,106 37.7 25.3 63.0<br />
1993 258.2 20,334 40.6 38.2 78.8<br />
1994 260.7 19,309 40.1 34.0 74.1<br />
1995 263.0 16,484 37.2 25.5 62.7<br />
1996 265.3 16,474 36.1 26.0 62.1<br />
1997 268.2 17,132 36.7 27.2 63.9<br />
1998 270.6 16,897 34.0 28.5 62.5<br />
1999 272.9 17,378 34.2 29.5 63.7<br />
90<br />
(1) Data include U.S. commercial l<strong>and</strong>ings <strong>and</strong> imports <strong>of</strong> both edible <strong>and</strong> nonedible (industrial) fishery products on a<br />
round weight basis. "Total supply" is not adjusted for beginning <strong>and</strong> ending stocks, defense purchases, or exports.


