Per Capita Consumption of Fish and Fishery Products
Per Capita Consumption of Fish and Fishery Products
Per Capita Consumption of Fish and Fishery Products

You also want an ePaper? Increase the reach of your titles
YUMPU automatically turns print PDFs into web optimized ePapers that Google loves.
<strong>Per</strong> <strong>Capita</strong> <strong>Consumption</strong><br />
Total U.S. <strong>Consumption</strong><br />
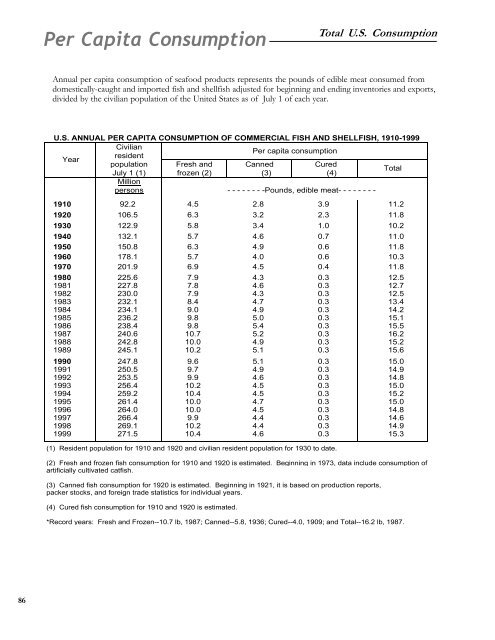
Annual per capita consumption <strong>of</strong> seafood products represents the pounds <strong>of</strong> edible meat consumed from<br />
domestically-caught <strong>and</strong> imported fish <strong>and</strong> shellfish adjusted for beginning <strong>and</strong> ending inventories <strong>and</strong> exports,<br />
divided by the civilian population <strong>of</strong> the United States as <strong>of</strong> July 1 <strong>of</strong> each year.<br />
U.S. ANNUAL PER CAPITA CONSUMPTION OF COMMERCIAL FISH AND SHELLFISH, 1910-1999<br />
Year<br />
Civilian<br />
<strong>Per</strong> capita consumption<br />
resident<br />
population Fresh <strong>and</strong> Canned Cured<br />
Total<br />
July 1 (1) frozen (2) (3) (4)<br />
Million<br />
persons - - - - - - - -Pounds, edible meat- - - - - - - -<br />
1910 92.2 4.5 2.8 3.9 11.2<br />
1920 106.5 6.3 3.2 2.3 11.8<br />
1930 122.9 5.8 3.4 1.0 10.2<br />
1940 132.1 5.7 4.6 0.7 11.0<br />
1950 150.8 6.3 4.9 0.6 11.8<br />
1960 178.1 5.7 4.0 0.6 10.3<br />
1970 201.9 6.9 4.5 0.4 11.8<br />
1980 225.6 7.9 4.3 0.3 12.5<br />
1981 227.8 7.8 4.6 0.3 12.7<br />
1982 230.0 7.9 4.3 0.3 12.5<br />
1983 232.1 8.4 4.7 0.3 13.4<br />
1984 234.1 9.0 4.9 0.3 14.2<br />
1985 236.2 9.8 5.0 0.3 15.1<br />
1986 238.4 9.8 5.4 0.3 15.5<br />
1987 240.6 10.7 5.2 0.3 16.2<br />
1988 242.8 10.0 4.9 0.3 15.2<br />
1989 245.1 10.2 5.1 0.3 15.6<br />
1990 247.8 9.6 5.1 0.3 15.0<br />
1991 250.5 9.7 4.9 0.3 14.9<br />
1992 253.5 9.9 4.6 0.3 14.8<br />
1993 256.4 10.2 4.5 0.3 15.0<br />
1994 259.2 10.4 4.5 0.3 15.2<br />
1995 261.4 10.0 4.7 0.3 15.0<br />
1996 264.0 10.0 4.5 0.3 14.8<br />
1997 266.4 9.9 4.4 0.3 14.6<br />
1998 269.1 10.2 4.4 0.3 14.9<br />
1999 271.5 10.4 4.6 0.3 15.3<br />
(1) Resident population for 1910 <strong>and</strong> 1920 <strong>and</strong> civilian resident population for 1930 to date.<br />
(2) Fresh <strong>and</strong> frozen fish consumption for 1910 <strong>and</strong> 1920 is estimated. Beginning in 1973, data include consumption <strong>of</strong><br />
artificially cultivated catfish.<br />
(3) Canned fish consumption for 1920 is estimated. Beginning in 1921, it is based on production reports,<br />
packer stocks, <strong>and</strong> foreign trade statistics for individual years.<br />
(4) Cured fish consumption for 1910 <strong>and</strong> 1920 is estimated.<br />
*Record years: Fresh <strong>and</strong> Frozen--10.7 lb, 1987; Canned--5.8, 1936; Cured--4.0, 1909; <strong>and</strong> Total--16.2 lb, 1987.<br />
86