Per Capita Consumption of Fish and Fishery Products
Per Capita Consumption of Fish and Fishery Products
Per Capita Consumption of Fish and Fishery Products

Create successful ePaper yourself
Turn your PDF publications into a flip-book with our unique Google optimized e-Paper software.
<strong>Per</strong> <strong>Capita</strong> <strong>Consumption</strong><br />
World <strong>Consumption</strong><br />
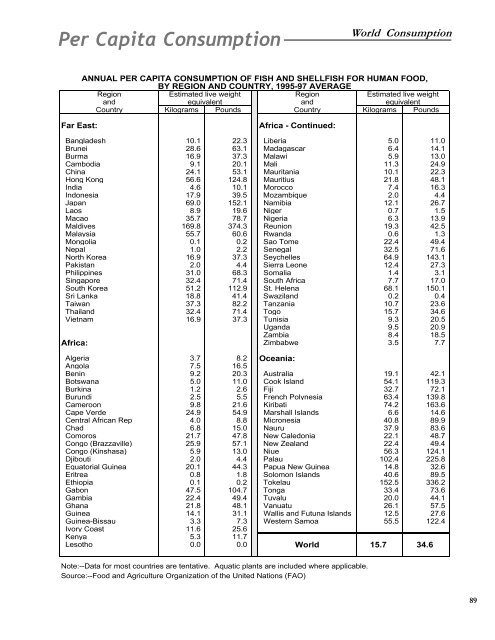
ANNUAL PER CAPITA CONSUMPTION OF FISH AND SHELLFISH FOR HUMAN FOOD,<br />
BY REGION AND COUNTRY, 1995-97 AVERAGE<br />
Region Estimated live weight Region Estimated live weight<br />
<strong>and</strong> equivalent <strong>and</strong> equivalent<br />
Country Kilograms Pounds Country Kilograms Pounds<br />
Far East:<br />
Africa - Continued:<br />
Bangladesh 10.1 22.3 Liberia 5.0 11.0<br />
Brunei 28.6 63.1 Madagascar 6.4 14.1<br />
Burma 16.9 37.3 Malawi 5.9 13.0<br />
Cambodia 9.1 20.1 Mali 11.3 24.9<br />
China 24.1 53.1 Mauritania 10.1 22.3<br />
Hong Kong 56.6 124.8 Mauritius 21.8 48.1<br />
India 4.6 10.1 Morocco 7.4 16.3<br />
Indonesia 17.9 39.5 Mozambique 2.0 4.4<br />
Japan 69.0 152.1 Namibia 12.1 26.7<br />
Laos 8.9 19.6 Niger 0.7 1.5<br />
Macao 35.7 78.7 Nigeria 6.3 13.9<br />
Maldives 169.8 374.3 Reunion 19.3 42.5<br />
Malaysia 55.7 60.6 Rw<strong>and</strong>a 0.6 1.3<br />
Mongolia 0.1 0.2 Sao Tome 22.4 49.4<br />
Nepal 1.0 2.2 Senegal 32.5 71.6<br />
North Korea 16.9 37.3 Seychelles 64.9 143.1<br />
Pakistan 2.0 4.4 Sierra Leone 12.4 27.3<br />
Philippines 31.0 68.3 Somalia 1.4 3.1<br />
Singapore 32.4 71.4 South Africa 7.7 17.0<br />
South Korea 51.2 112.9 St. Helena 68.1 150.1<br />
Sri Lanka 18.8 41.4 Swazil<strong>and</strong> 0.2 0.4<br />
Taiwan 37.3 82.2 Tanzania 10.7 23.6<br />
Thail<strong>and</strong> 32.4 71.4 Togo 15.7 34.6<br />
Vietnam 16.9 37.3 Tunisia 9.3 20.5<br />
Ug<strong>and</strong>a 9.5 20.9<br />
Zambia 8.4 18.5<br />
Africa: Zimbabwe 3.5 7.7<br />
Algeria 3.7 8.2 Oceania:<br />
Angola 7.5 16.5<br />
Benin 9.2 20.3 Australia 19.1 42.1<br />
Botswana 5.0 11.0 Cook Isl<strong>and</strong> 54.1 119.3<br />
Burkina 1.2 2.6 Fiji 32.7 72.1<br />
Burundi 2.5 5.5 French Polynesia 63.4 139.8<br />
Cameroon 9.8 21.6 Kiribati 74.2 163.6<br />
Cape Verde 24.9 54.9 Marshall Isl<strong>and</strong>s 6.6 14.6<br />
Central African Rep 4.0 8.8 Micronesia 40.8 89.9<br />
Chad 6.8 15.0 Nauru 37.9 83.6<br />
Comoros 21.7 47.8 New Caledonia 22.1 48.7<br />
Congo (Brazzaville) 25.9 57.1 New Zeal<strong>and</strong> 22.4 49.4<br />
Congo (Kinshasa) 5.9 13.0 Niue 56.3 124.1<br />
Djibouti 2.0 4.4 Palau 102.4 225.8<br />
Equatorial Guinea 20.1 44.3 Papua New Guinea 14.8 32.6<br />
Eritrea 0.8 1.8 Solomon Isl<strong>and</strong>s 40.6 89.5<br />
Ethiopia 0.1 0.2 Tokelau 152.5 336.2<br />
Gabon 47.5 104.7 Tonga 33.4 73.6<br />
Gambia 22.4 49.4 Tuvalu 20.0 44.1<br />
Ghana 21.8 48.1 Vanuatu 26.1 57.5<br />
Guinea 14.1 31.1 Wallis <strong>and</strong> Futuna Isl<strong>and</strong>s 12.5 27.6<br />
Guinea-Bissau 3.3 7.3 Western Samoa 55.5 122.4<br />
Ivory Coast 11.6 25.6<br />
Kenya 5.3 11.7<br />
Lesotho 0.0 0.0<br />
World 15.7 34.6<br />
Note:--Data for most countries are tentative. Aquatic plants are included where applicable.<br />
Source:--Food <strong>and</strong> Agriculture Organization <strong>of</strong> the United Nations (FAO)<br />
89