Klim, Denmark Case study. - EMD
Klim, Denmark Case study. - EMD
Klim, Denmark Case study. - EMD

Create successful ePaper yourself
Turn your PDF publications into a flip-book with our unique Google optimized e-Paper software.
<strong>Klim</strong>, <strong>Denmark</strong>, CASE - 01<br />
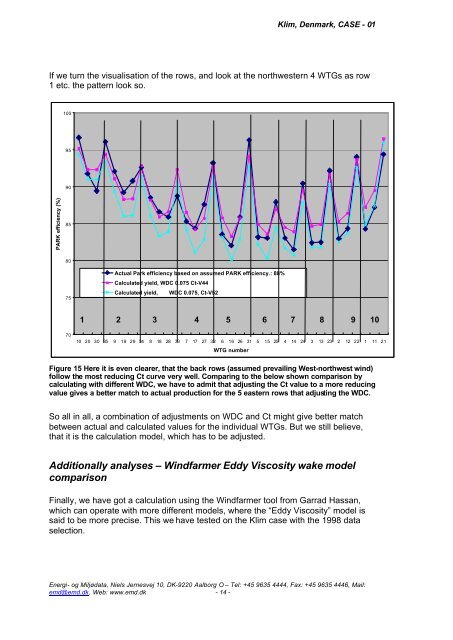
If we turn the visualisation of the rows, and look at the northwestern 4 WTGs as row<br />
1 etc. the pattern look so.<br />
100<br />
95<br />
90<br />
PARK efficiency (%)<br />
85<br />
80<br />
75<br />
Actual Park efficiency based on assumed PARK efficiency.: 88%<br />
Calculated yield, WDC 0.075 Ct-V44<br />
Calculated yield, WDC 0.075, Ct-V52<br />
1 2 3 4 5 6 7 8 9 10<br />
70<br />
10 20 30 35 9 19 29 34 8 18 28 33 7 17 27 32 6 16 26 31 5 15 25 4 14 24 3 13 23 2 12 22 1 11 21<br />
WTG number<br />
Figure 15 Here it is even clearer, that the back rows (assumed prevailing West-northwest wind)<br />
follow the most reducing Ct curve very well. Comparing to the below shown comparison by<br />
calculating with different WDC, we have to admit that adjusting the Ct value to a more reducing<br />
value gives a better match to actual production for the 5 eastern rows that adjusting the WDC.<br />
So all in all, a combination of adjustments on WDC and Ct might give better match<br />
between actual and calculated values for the individual WTGs. But we still believe,<br />
that it is the calculation model, which has to be adjusted.<br />
Additionally analyses – Windfarmer Eddy Viscosity wake model<br />
comparison<br />
Finally, we have got a calculation using the Windfarmer tool from Garrad Hassan,<br />
which can operate with more different models, where the “Eddy Viscosity” model is<br />
said to be more precise. This we have tested on the <strong>Klim</strong> case with the 1998 data<br />
selection.<br />
Energi- og Miljødata, Niels Jernesvej 10, DK-9220 Aalborg O – Tel: +45 9635 4444, Fax: +45 9635 4446, Mail:<br />
emd@emd.dk, Web: www.emd.dk - 14 -