Klim, Denmark Case study. - EMD
Klim, Denmark Case study. - EMD
Klim, Denmark Case study. - EMD

Create successful ePaper yourself
Turn your PDF publications into a flip-book with our unique Google optimized e-Paper software.
<strong>Klim</strong>, <strong>Denmark</strong>, CASE - 01<br />
<strong>Klim</strong>, <strong>Denmark</strong> – <strong>Case</strong> <strong>study</strong>.<br />
Abstract<br />
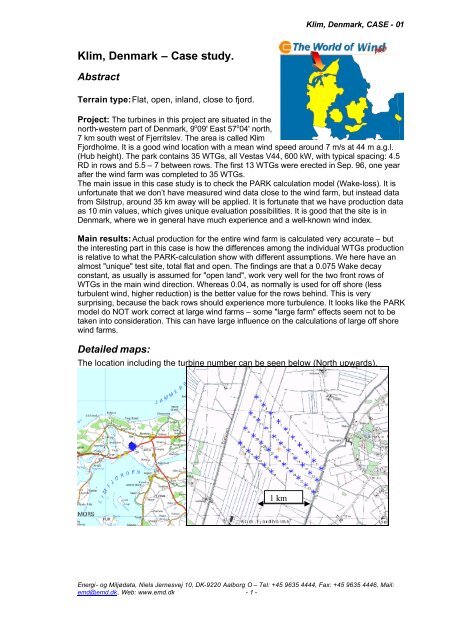
Terrain type: Flat, open, inland, close to fjord.<br />
Project: The turbines in this project are situated in the<br />
north-western part of <strong>Denmark</strong>, 9 o 09' East 57 o 04' north,<br />
7 km south west of Fjerritslev. The area is called <strong>Klim</strong><br />
Fjordholme. It is a good wind location with a mean wind speed around 7 m/s at 44 m a.g.l.<br />
(Hub height). The park contains 35 WTGs, all Vestas V44, 600 kW, with typical spacing: 4.5<br />
RD in rows and 5.5 – 7 between rows. The first 13 WTGs were erected in Sep. 96, one year<br />
after the wind farm was completed to 35 WTGs.<br />
The main issue in this case <strong>study</strong> is to check the PARK calculation model (Wake-loss). It is<br />
unfortunate that we don’t have measured wind data close to the wind farm, but instead data<br />
from Silstrup, around 35 km away will be applied. It is fortunate that we have production data<br />
as 10 min values, which gives unique evaluation possibilities. It is good that the site is in<br />
<strong>Denmark</strong>, where we in general have much experience and a well-known wind index.<br />
Main results: Actual production for the entire wind farm is calculated very accurate – but<br />
the interesting part in this case is how the differences among the individual WTGs production<br />
is relative to what the PARK-calculation show with different assumptions. We here have an<br />
almost "unique" test site, total flat and open. The findings are that a 0.075 Wake decay<br />
constant, as usually is assumed for "open land", work very well for the two front rows of<br />
WTGs in the main wind direction. Whereas 0.04, as normally is used for off shore (less<br />
turbulent wind, higher reduction) is the better value for the rows behind. This is very<br />
surprising, because the back rows should experience more turbulence. It looks like the PARK<br />
model do NOT work correct at large wind farms – some "large farm" effects seem not to be<br />
taken into consideration. This can have large influence on the calculations of large off shore<br />
wind farms.<br />
Detailed maps:<br />
The location including the turbine number can be seen below (North upwards).<br />
1 km<br />
Energi- og Miljødata, Niels Jernesvej 10, DK-9220 Aalborg O – Tel: +45 9635 4444, Fax: +45 9635 4446, Mail:<br />
emd@emd.dk, Web: www.emd.dk - 1 -
<strong>Klim</strong>, <strong>Denmark</strong>, CASE - 01<br />
Figure 1 The wind farm seen from southeast with an overlay from the WindPRO photomontage<br />
tool, which confirm that the positions of each WTG match exact.<br />
<strong>Klim</strong>, <strong>Denmark</strong> – <strong>Case</strong> <strong>study</strong>. ...........................................................................................1<br />
Abstract...........................................................................................................................1<br />
Detailed maps: ...............................................................................................................1<br />
Actual Energy production from the WTGs .......................................................................3<br />
Energy calculation assumptions – models and data.......................................................5<br />
Calculation models.........................................................................................................5<br />
Terrain assessment .......................................................................................................5<br />
Wind data........................................................................................................................6<br />
General wind statistic................................................................................................. 6<br />
Local wind data...........................................................................................................6<br />
WTG data .......................................................................................................................7<br />
Calculation results .............................................................................................................8<br />
Calculation based on "standard" DK wind statistics and WDC 0.075........................8<br />
Variation of WDC –Standard DK wind statistic ............................................................9<br />
Calculation based on parallel selection of Wind and WTG production data............10<br />
Main conclusion: ..............................................................................................................11<br />
Additional analyses – Ct curves..................................................................................12<br />
Additionally analyses – Windfarmer Eddy Viscosity wake model comparison........14<br />
Data delivery and acknowledgements ...........................................................................15<br />
Energi- og Miljødata, Niels Jernesvej 10, DK-9220 Aalborg O – Tel: +45 9635 4444, Fax: +45 9635 4446, Mail:<br />
emd@emd.dk, Web: www.emd.dk - 2 -
<strong>Klim</strong>, <strong>Denmark</strong>, CASE - 01<br />
Actual Energy production from the WTGs<br />
Production figures have been available in three variants:<br />
1. Monthly production data from the beginning (September 1996 up to May 2000)<br />
from the wind farm computer for each WTG<br />
2. The complete WTG computer registration set for 1998 (down to 10 min. values<br />
for each WTG of all parameters registered)<br />
3. The monthly energy production from the beginning until Sep. 2001 for the<br />
whole wind farm based on the utility reporting to the WTG owner association<br />
database<br />
Based on the last information source, it can be stated with correction indexes that the<br />
long term average production is estimated to 49 GWh/year (1400 MWh/WTG/year).<br />
The mean actual production 1998-2000 was 45.4 GWh, see print below.<br />
Figure 2 Data for the whole wind farm from the VINDSTAT database.<br />
For the individual WTGs there have been performed a cleaning up based on<br />
availability etc. which gives the below figure.<br />
It is seen in figure 3 and 4 how the configuration with 10 WTGs per row in the first 3<br />
rows and a 4’Th row with 5 WTGs gives the variations in the individual WTGs<br />
production. This is seen that the WTGs in middle of 3 first rows of 10 WTGs (5-6, 15-<br />
16, 25-26) have the lowest production figures. The same is seen for WTG 33 in<br />
middle of the row with 5 WTGs.<br />
Energi- og Miljødata, Niels Jernesvej 10, DK-9220 Aalborg O – Tel: +45 9635 4444, Fax: +45 9635 4446, Mail:<br />
emd@emd.dk, Web: www.emd.dk - 3 -
<strong>Klim</strong>, <strong>Denmark</strong>, CASE - 01<br />
1600<br />
Actual yield (all month mean *12)<br />
Long term corrected production (MWh/year)<br />
1500<br />
1400<br />
MWh/year/WTG<br />
1300<br />
1200<br />
1100<br />
1000<br />
MEAN 1 2 3 4 5 6 7 8 9 10 11 12 13 14 15 16 17 18 19 20 21 22 23 24 25 26 27 28 29 30 31 32 33 34 35<br />
WTG number<br />
Figure 3 Actual and long term corrected energy production for each WTG<br />
2500<br />
Actual production 1998-selection<br />
2400<br />
2300<br />
MWh/WTG/year<br />
2200<br />
2100<br />
2000<br />
1900<br />
1800<br />
MEAN 1 2 3 4 5 6 7 8 9 10 11 12 13 14 15 16 17 18 19 20 21 22 23 24 25 26 27 28 29 30 31 32 33 34 35<br />
WTG number<br />
Figure 4 Production for each WTG for the selected days with 100% availability used in parallel<br />
with Silstrup measure data for same days<br />
Finally based on the detailed database a selection of days with all WTGs in full<br />
operation from 1998 gives a more precise variation between each WTG. This is later<br />
used for parallel calculations with wind data for exact the same days.<br />
Energi- og Miljødata, Niels Jernesvej 10, DK-9220 Aalborg O – Tel: +45 9635 4444, Fax: +45 9635 4446, Mail:<br />
emd@emd.dk, Web: www.emd.dk - 4 -
<strong>Klim</strong>, <strong>Denmark</strong>, CASE - 01<br />
Energy calculation assumptions – models and data<br />
Calculation models<br />
WindPRO 2.2 is used with the WAsP model ver. 5.1 with standard settings<br />
(Parameters) for calculation of the wind statistics based on measurements and<br />
terrain description. From the terrain description and the wind statistics the wind<br />
distributions are calculated for each of 12 directional sectors for each WTG position.<br />
WindPRO's PARK model (N.O.Jensen) and power curve calculation interface<br />
converts the wind distributions to expected annual energy yield.<br />
Terrain assessment<br />
The nearest 3 km in all directions are very open farmland. Further to the south the<br />
fjord begins and further to the north there is forest. Below a map shows how the<br />
roughness has been digitised from land use maps, which were the basis for<br />
generating the wind resource map of <strong>Denmark</strong>. Each 1 x 1 km 2 has been given a<br />
roughness value based on information on windbreaks etc. and the whole "patchwork"<br />
has been glued together with information on the large forests, city and water regions.<br />
Figure 5 Roughness map, each square represent 1 km x 1 km.<br />
Energi- og Miljødata, Niels Jernesvej 10, DK-9220 Aalborg O – Tel: +45 9635 4444, Fax: +45 9635 4446, Mail:<br />
emd@emd.dk, Web: www.emd.dk - 5 -
As the region is totally flat, height contour line have not been taken into<br />
consideration, and local obstacles are not included.<br />
<strong>Klim</strong>, <strong>Denmark</strong>, CASE - 01<br />
Wind data<br />
General wind statistic<br />
Practically all calculations in <strong>Denmark</strong> are made with the wind statistic "<strong>Denmark</strong><br />
'92", which is the wind statistic for Beldringe from the EU Wind atlas, combined with a<br />
set or regional correction factors. This wind statistic has been used for the preliminary<br />
calculations.<br />
The energy rose for this wind statistic are shown below. We are aware that this wind<br />
rose probably holds too much energy in WSW and to little in W – NNW directions,<br />
when we are in the north western part of <strong>Denmark</strong>.<br />
Figure 6 <strong>Denmark</strong> '92 energy rose, where the square marks refer to adjustments for the <strong>Klim</strong><br />
site. But due to <strong>Klim</strong> is almost roughness class 1 (reference), there is almost no difference<br />
between <strong>Klim</strong> and reference.<br />
Local wind data<br />
For performing more detailed investigations on array loss calculations, there has<br />
been established a wind statistic from a wind measurement at a mast 35 km away -<br />
called Silstrup. The wind data and measurements mast is treated in the <strong>Case</strong> report<br />
“07 Silstrup". Here only the special treatment relative to this case is described.<br />
Based on all days of 1998, with full WTG operation and fully operating measurement<br />
equipment in the wind farm (89 days in total), these days are selected in the 1998-<br />
hour value data set from Silstrup. Based on this selection of data a wind statistic is<br />
generated. Below the energy rose is shown. It can be seen that mainly the energy is<br />
associated with southwest winds in this period – but the important thing is that it<br />
represent an exact parallel period to very well verified WTG production data.<br />
Energi- og Miljødata, Niels Jernesvej 10, DK-9220 Aalborg O – Tel: +45 9635 4444, Fax: +45 9635 4446, Mail:<br />
emd@emd.dk, Web: www.emd.dk - 6 -
<strong>Klim</strong>, <strong>Denmark</strong>, CASE - 01<br />
Number of days used in Silstrup selection per month<br />
Days used<br />
14<br />
12<br />
10<br />
8<br />
6<br />
4<br />
2<br />
0<br />
jan feb mar apr may jun jul aug sep oct nov dec<br />
Figure 7 As well summer as winter months is included fairly equal in the 1998 Silstrup<br />
selection<br />
Figure 8 Silstrup 1998-selection (89 days) energy rose.<br />
WTG data<br />
Energi- og Miljødata, Niels Jernesvej 10, DK-9220 Aalborg O – Tel: +45 9635 4444, Fax: +45 9635 4446, Mail:<br />
emd@emd.dk, Web: www.emd.dk - 7 -
<strong>Klim</strong>, <strong>Denmark</strong>, CASE - 01<br />
Figure 9 The V44 power curve has a pessimistic power curve according to HP-values + 6 at 7<br />
m/s. But due to the single generator and the fact that the V44 only operates up to 20 m/s, the<br />
HP value should be high for this WTG. We estimate mainly based on case 08 Göteborg, where<br />
the WTG can be compared with others, that + 2 % is a reasonable value.<br />
The 35 turbines in the project are manufactured by Vestas. The type is V44, with a<br />
rotor diameter of 44 m and hub height of 44 m. The turbine has one generator. The<br />
power curve is – according to HP-curves – a bit pessimistic, around 6% within the<br />
mean speed (7 m/s), where the WTGs operate. But while it is a 1-generator WTG,<br />
only operating up to 20 m/s (Where HP-corrections in general assume 2-generator<br />
operating up to 25 m/s), the + 6% is reduced to +2%.<br />
Calculation results<br />
With the data described in the previously chapter, the Energy production is<br />
calculated.<br />
First the calculation is based on the "standard" wind statistic used for <strong>Denmark</strong>, next<br />
with a wind statistic based on a measurement mast 35 km away, where a selection of<br />
89 days are taken based on the days where very reliable WTG production figures are<br />
available.<br />
Calculation results follow in comparison with the actual normalised production data.<br />
Calculation based on "standard" DK wind statistics and WDC 0.075<br />
Energi- og Miljødata, Niels Jernesvej 10, DK-9220 Aalborg O – Tel: +45 9635 4444, Fax: +45 9635 4446, Mail:<br />
emd@emd.dk, Web: www.emd.dk - 8 -
<strong>Klim</strong>, <strong>Denmark</strong>, CASE - 01<br />
1600<br />
1500<br />
Long term corrected production (MWh/year)<br />
Calculated yield, WDC 0.075<br />
1400<br />
MWh/WTG/year<br />
1300<br />
1200<br />
1100<br />
1000<br />
MEAN 1 2 3 4 5 6 7 8 9 10 11 12 13 14 15 16 17 18 19 20 21 22 23 24 25 26 27 28 29 30 31 32 33 34 35<br />
WTG number<br />
Figure 10 The "first shot" calculation simply hit the actual value. Calculation is 2 % lower than<br />
actual, before power curve correction. Power curve corrected with 2% add on to calculation,<br />
there will be exact match. So for the result as a whole the match cannot be expected better.<br />
Also the variations within the WTGs seem fairly well.<br />
Variation of WDC –Standard DK wind statistic<br />
100<br />
<strong>Klim</strong> Fjordholme, <strong>Denmark</strong><br />
35 Vestas 600 kW, based on 32 months production<br />
95<br />
PARK efficiency (%)<br />
90<br />
85<br />
80<br />
75<br />
Actual Park efficiency based on assumed PARK efficiency.: 89%<br />
Calc Park eff. WDC 0,075 (Standard)<br />
Calc Park eff. WDC 0,04 (less turbulent)<br />
Calc Park eff. WDC 0,1 (more turbulent)<br />
70<br />
MEAN 1 2 3 4 5 6 7 8 9 10 11 12 13 14 15 16 17 18 19 20 21 22 23 24 25 26 27 28 29 30 31 32 33 34 35<br />
WTG-number<br />
Figure 11 Varying the Wake Decay Constant (WDC) gives quite large changes. With WDC = 0.1<br />
the PARK efficiency increase from 0.885 to 0.905 – 2 %. But at 0.04, which normally is<br />
recommended for offshore, the park efficiency decrease to 0.845, which is 4% lower than<br />
standard. From the figure above, it is difficult clearly to see what the correct value will be. We<br />
therefore continue with a shorter, but more reliable data period.<br />
Energi- og Miljødata, Niels Jernesvej 10, DK-9220 Aalborg O – Tel: +45 9635 4444, Fax: +45 9635 4446, Mail:<br />
emd@emd.dk, Web: www.emd.dk - 9 -
<strong>Klim</strong>, <strong>Denmark</strong>, CASE - 01<br />
Calculation based on parallel selection of Wind and WTG<br />
production data<br />
2,600<br />
Actual production selected days<br />
Calc.Silstrup 98-selection- WDC = 0.075<br />
2,400<br />
2,200<br />
MWh/WTG/year<br />
2,000<br />
1,800<br />
1,600<br />
1,400<br />
1,200<br />
1,000<br />
MEAN 1 2 3 4 5 6 7 8 9 10 11 12 13 14 15 16 17 18 19 20 21 22 23 24 25 26 27 28 29 30 31 32 33 34 35<br />
WTG number<br />
Figure 12 Here we see a much more "soft" set of graphs. But we also se a clear tendency in<br />
that the higher WTG number (more south-west), the higher production relative to calculation.<br />
To <strong>study</strong> this more close, see nest figure.<br />
Note that the calculated production is much higher than in previous calculation, this is<br />
due to the selection of the more windy days in 1998. But there is still good correlation<br />
between calculation with the 98 selection and actual wind data based on Silstrup. But<br />
do not put to much importance in the absolute values – the measured wind data are<br />
35 km away in a region with relative high changes in geotrophic wind. The main task<br />
here is to look at the variations in-between the individual WTGs.<br />
Energi- og Miljødata, Niels Jernesvej 10, DK-9220 Aalborg O – Tel: +45 9635 4444, Fax: +45 9635 4446, Mail:<br />
emd@emd.dk, Web: www.emd.dk - 10 -
<strong>Klim</strong>, <strong>Denmark</strong>, CASE - 01<br />
<strong>Klim</strong> Fjordholme, <strong>Denmark</strong><br />
35 Vestas 600 kW, based on 89 days production<br />
100<br />
95<br />
PARK efficiency (%)<br />
90<br />
85<br />
80<br />
75<br />
70<br />
Actual 98-selection Park efficiency based on assumed PARK efficiency.: 89%<br />
Calc.Silstrup 98-selection, WDC = 0.04 (less turbolent)<br />
Calc.Silstrup 98-selection- WDC = 0.075<br />
MEAN 1 2 3 4 5 6 7 8 9 10 11 12 13 14 15 16 17 18 19 20 21 22 23 24 25 26 27 28 29 30 31 32 33 34 35<br />
WTG-number<br />
Here it seem quite clear, that at the northeastern rows (WTG 1-20), use of WDC =<br />
0.04 match very well, while use of WDC = 0.075 mach very well at the southwest<br />
rows.<br />
This is a surprising result. The main wind is from southwest, which means that the<br />
northeast WTGs most of the time are the back row, with most turbulence and<br />
therefore a higher WDC should be a better choice.<br />
The explanation although speculative is probably that there is physics lacks in the<br />
PARK model. That the wind disturbed by the first rows holds less energy than the<br />
model predict – and by coincidence it just match lowering the WDC.<br />
Main conclusion:<br />
Actual production for the entire wind farm is calculated very accurate – but the<br />
interesting part in this case is how the differences among the individual WTGs<br />
production is relative to what the PARK-calculation show with different assumptions.<br />
We here have an almost "unique" test site, total flat and open. The findings are that a<br />
0.075 Wake decay constant, as usually is assumed for "open land", work very well for<br />
the two front rows of WTGs in the main wind direction. Whereas 0.04, as normally is<br />
used for off shore (less turbulent wind, higher reduction) is the better value for the<br />
rows behind. This is very surprising, because the back rows should experience more<br />
turbulence. It looks like the PARK model do NOT work correct at large wind farms –<br />
some "large farm" effects seem not to be taken into consideration. This can have<br />
large influence on the calculations of large off shore wind farms.<br />
Energi- og Miljødata, Niels Jernesvej 10, DK-9220 Aalborg O – Tel: +45 9635 4444, Fax: +45 9635 4446, Mail:<br />
emd@emd.dk, Web: www.emd.dk - 11 -
<strong>Klim</strong>, <strong>Denmark</strong>, CASE - 01<br />
Additional analyses – Ct curves<br />
Having so good data for a large wind farm in very simple terrain, gives good<br />
opportunities to check the influence of the selection of Ct curves. Normally the<br />
selection is limited to a standard stall or standard pitch. But it has the recent years<br />
become more common, that actual calculated or measured Ct curves are used.<br />
Below we look at a few examples.<br />
1<br />
0.9<br />
0.8<br />
0.7<br />
0.6<br />
0.5<br />
0.4<br />
0.3<br />
0.2<br />
0.1<br />
0<br />
Ct-curves<br />
4 5 6 7 8 9 10 11 12 13 14 15 16 17 18 19 20 21 22 23 24 25<br />
Wind speed (m/s)<br />
"Reel" Vestas V52<br />
Std. Stall<br />
Std. Pitch<br />
"Reel" NEG-750stall<br />
"Reel" Vestas V44<br />
The "real" Vestas V44 is very close to the "Standard pitch" (which are found in the<br />
WindPRO WTG catalogue, and which is based on measurements back in the early<br />
90'ties). But the V52 has much higher values for 8-12 m/s – even higher than the<br />
Stall curves.<br />
The Standard Stall is compared with the NEG Micon 750 kW. These are almost<br />
identical, except from the region 4-8 m/s, where the 2-generator system makes the<br />
real curve toggle more.<br />
When we bring in these curves in the calculation, following results appear.<br />
Energi- og Miljødata, Niels Jernesvej 10, DK-9220 Aalborg O – Tel: +45 9635 4444, Fax: +45 9635 4446, Mail:<br />
emd@emd.dk, Web: www.emd.dk - 12 -
<strong>Klim</strong>, <strong>Denmark</strong>, CASE - 01<br />
Figure 13 It is seen that the "real" V44 Ct curve perform best relative to actual production, but<br />
this can be a coincidence since the differences are very small, far below the uncertainties.<br />
What is interesting to see is, that the V52 Ct gives calculated array losses that are<br />
even higher than the stall Ct curve. But we are talking of less than 1% and the total<br />
difference between highest and lowest calculated value are only 2.5% - at a wind<br />
farm with 35 WTGs with relatively close spacing.<br />
Below we look at the individual WTGs with different Ct curves.<br />
<strong>Klim</strong> Fjordholme, <strong>Denmark</strong><br />
35 Vestas 600 kW, based on 32 months production<br />
100<br />
95<br />
PARK efficiency (%)<br />
90<br />
85<br />
80<br />
75<br />
Actual Park efficiency based on assumed PARK efficiency.: 88%<br />
Calculated yield, WDC 0.075 Ct-V44<br />
Calculated yield, WDC 0.075, Ct-V52<br />
70<br />
MEAN 1 2 3 4 5 6 7 8 9 10 11 12 13 14 15 16 17 18 19 20 21 22 23 24 25 26 27 28 29 30 31 32 33 34 35<br />
WTG-number<br />
Figure 14 We se the same trends as by varying the WDC – the back rows, relative to main wind<br />
direction, WTG no. 1-20, follow the pattern from the most reducing Ct curves best, while the<br />
front rows relative to main wind direction follow the less reducing better.<br />
Energi- og Miljødata, Niels Jernesvej 10, DK-9220 Aalborg O – Tel: +45 9635 4444, Fax: +45 9635 4446, Mail:<br />
emd@emd.dk, Web: www.emd.dk - 13 -
<strong>Klim</strong>, <strong>Denmark</strong>, CASE - 01<br />
If we turn the visualisation of the rows, and look at the northwestern 4 WTGs as row<br />
1 etc. the pattern look so.<br />
100<br />
95<br />
90<br />
PARK efficiency (%)<br />
85<br />
80<br />
75<br />
Actual Park efficiency based on assumed PARK efficiency.: 88%<br />
Calculated yield, WDC 0.075 Ct-V44<br />
Calculated yield, WDC 0.075, Ct-V52<br />
1 2 3 4 5 6 7 8 9 10<br />
70<br />
10 20 30 35 9 19 29 34 8 18 28 33 7 17 27 32 6 16 26 31 5 15 25 4 14 24 3 13 23 2 12 22 1 11 21<br />
WTG number<br />
Figure 15 Here it is even clearer, that the back rows (assumed prevailing West-northwest wind)<br />
follow the most reducing Ct curve very well. Comparing to the below shown comparison by<br />
calculating with different WDC, we have to admit that adjusting the Ct value to a more reducing<br />
value gives a better match to actual production for the 5 eastern rows that adjusting the WDC.<br />
So all in all, a combination of adjustments on WDC and Ct might give better match<br />
between actual and calculated values for the individual WTGs. But we still believe,<br />
that it is the calculation model, which has to be adjusted.<br />
Additionally analyses – Windfarmer Eddy Viscosity wake model<br />
comparison<br />
Finally, we have got a calculation using the Windfarmer tool from Garrad Hassan,<br />
which can operate with more different models, where the “Eddy Viscosity” model is<br />
said to be more precise. This we have tested on the <strong>Klim</strong> case with the 1998 data<br />
selection.<br />
Energi- og Miljødata, Niels Jernesvej 10, DK-9220 Aalborg O – Tel: +45 9635 4444, Fax: +45 9635 4446, Mail:<br />
emd@emd.dk, Web: www.emd.dk - 14 -
<strong>Klim</strong>, <strong>Denmark</strong>, CASE - 01<br />
Wake loss (%)<br />
18<br />
16<br />
14<br />
12<br />
10<br />
8<br />
6<br />
4<br />
2<br />
0<br />
1<br />
Comparison WindPRO-Windfarmer based on Silstrup98 selection of wind data<br />
and <strong>Klim</strong> Fjordholme wind farm with 35 x 600 kW Vestas V44<br />
3<br />
5<br />
7<br />
9<br />
11<br />
13<br />
15<br />
17<br />
19<br />
21<br />
23<br />
WTG-number<br />
25<br />
27<br />
29<br />
31<br />
33<br />
35<br />
Avg<br />
Wake Loss, WindFarmer<br />
(Eddy Viscosity)<br />
Wake loss-WindPRO (WDC<br />
0,075)<br />
Actual array loss<br />
Figure 16 The Eddy Viscosity model in the standard set up perform poorer than the N. O.<br />
Jensen model (used in WindPRO and WAsP) in standard set-up based on the <strong>Klim</strong> test data. It<br />
calculates 1percent point less losses than WindPRO, where it is obvious that the real losses is<br />
higher eventhoug the wake losses not can be measured direct, the patterns gives a quite good<br />
idea. If the loss level were decreased 1 percent point, WTG 10 would have no Wake loss at all.<br />
Figure 17 The used set-up of the Eddy Viscosity model in Windfarmer. No parameter variations<br />
have been tested within this model.<br />
Data delivery and acknowledgements<br />
Thanks to Vestas and Nordjyllandsværket (Power plant for Northern Jutland which<br />
own and operate the wind farm) for being very helpful and for delivering data.<br />
Thanks to Kevin Romuld, EAPC, North Dakota for helping with Windfarmer<br />
calculations for comparison.<br />
Energi- og Miljødata, Niels Jernesvej 10, DK-9220 Aalborg O – Tel: +45 9635 4444, Fax: +45 9635 4446, Mail:<br />
emd@emd.dk, Web: www.emd.dk - 15 -
<strong>Klim</strong>, <strong>Denmark</strong>, CASE - 01<br />
Energi- og Miljødata, Niels Jernesvej 10, DK-9220 Aalborg O – Tel: +45 9635 4444, Fax: +45 9635 4446, Mail:<br />
emd@emd.dk, Web: www.emd.dk - 16 -