Klim, Denmark Case study. - EMD
Klim, Denmark Case study. - EMD
Klim, Denmark Case study. - EMD

Create successful ePaper yourself
Turn your PDF publications into a flip-book with our unique Google optimized e-Paper software.
As the region is totally flat, height contour line have not been taken into<br />
consideration, and local obstacles are not included.<br />
<strong>Klim</strong>, <strong>Denmark</strong>, CASE - 01<br />
Wind data<br />
General wind statistic<br />
Practically all calculations in <strong>Denmark</strong> are made with the wind statistic "<strong>Denmark</strong><br />
'92", which is the wind statistic for Beldringe from the EU Wind atlas, combined with a<br />
set or regional correction factors. This wind statistic has been used for the preliminary<br />
calculations.<br />
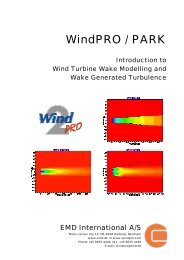
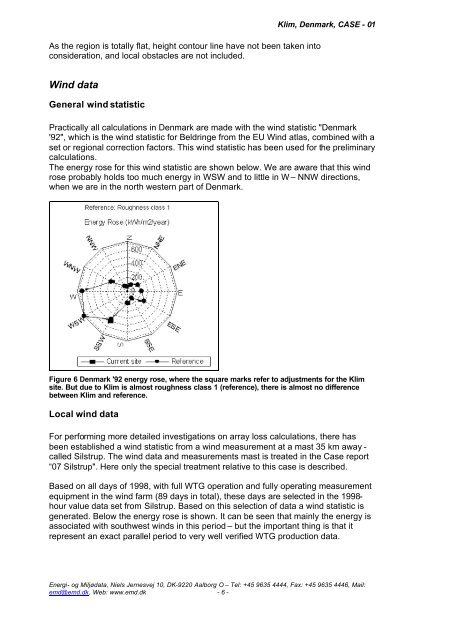
The energy rose for this wind statistic are shown below. We are aware that this wind<br />
rose probably holds too much energy in WSW and to little in W – NNW directions,<br />
when we are in the north western part of <strong>Denmark</strong>.<br />
Figure 6 <strong>Denmark</strong> '92 energy rose, where the square marks refer to adjustments for the <strong>Klim</strong><br />
site. But due to <strong>Klim</strong> is almost roughness class 1 (reference), there is almost no difference<br />
between <strong>Klim</strong> and reference.<br />
Local wind data<br />
For performing more detailed investigations on array loss calculations, there has<br />
been established a wind statistic from a wind measurement at a mast 35 km away -<br />
called Silstrup. The wind data and measurements mast is treated in the <strong>Case</strong> report<br />
“07 Silstrup". Here only the special treatment relative to this case is described.<br />
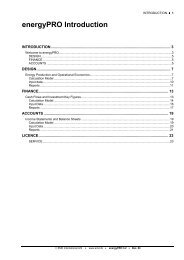
Based on all days of 1998, with full WTG operation and fully operating measurement<br />
equipment in the wind farm (89 days in total), these days are selected in the 1998-<br />
hour value data set from Silstrup. Based on this selection of data a wind statistic is<br />
generated. Below the energy rose is shown. It can be seen that mainly the energy is<br />
associated with southwest winds in this period – but the important thing is that it<br />
represent an exact parallel period to very well verified WTG production data.<br />
Energi- og Miljødata, Niels Jernesvej 10, DK-9220 Aalborg O – Tel: +45 9635 4444, Fax: +45 9635 4446, Mail:<br />
emd@emd.dk, Web: www.emd.dk - 6 -