Babyboomers in the Netherlands: What the statistics say - Cbs
Babyboomers in the Netherlands: What the statistics say - Cbs
Babyboomers in the Netherlands: What the statistics say - Cbs

Create successful ePaper yourself
Turn your PDF publications into a flip-book with our unique Google optimized e-Paper software.
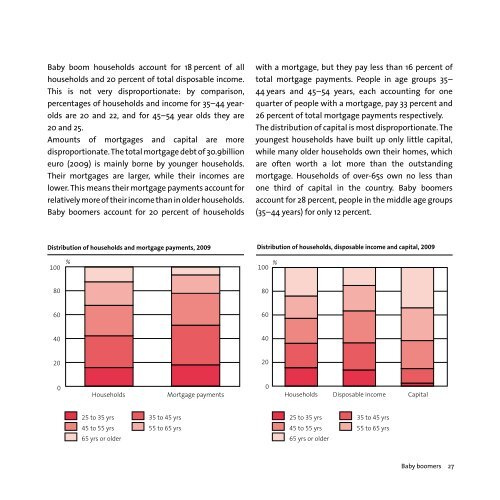
Baby boom households account for 18 percent of all<br />
households and 20 percent of total disposable <strong>in</strong>come.<br />
This is not very disproportionate: by comparison,<br />
percentages of households and <strong>in</strong>come for 35–44 yearolds<br />
are 20 and 22, and for 45–54 year olds <strong>the</strong>y are<br />
20 and 25.<br />
Amounts of mortgages and capital are more<br />
disproportionate. The total mortgage debt of 30.9billion<br />
euro (2009) is ma<strong>in</strong>ly borne by younger households.<br />
Their mortgages are larger, while <strong>the</strong>ir <strong>in</strong>comes are<br />
lower. This means <strong>the</strong>ir mortgage payments account for<br />
relatively more of <strong>the</strong>ir <strong>in</strong>come than <strong>in</strong> older households.<br />
Baby boomers account for 20 percent of households<br />
with a mortgage, but <strong>the</strong>y pay less than 16 percent of<br />
total mortgage payments. People <strong>in</strong> age groups 35–<br />
44 years and 45–54 years, each account<strong>in</strong>g for one<br />
quarter of people with a mortgage, pay 33 percent and<br />
26 percent of total mortgage payments respectively.<br />
The distribution of capital is most disproportionate. The<br />
youngest households have built up only little capital,<br />
while many older households own <strong>the</strong>ir homes, which<br />
are often worth a lot more than <strong>the</strong> outstand<strong>in</strong>g<br />
mortgage. Households of over-65s own no less than<br />
one third of capital <strong>in</strong> <strong>the</strong> country. Baby boomers<br />
account for 28 percent, people <strong>in</strong> <strong>the</strong> middle age groups<br />
(35–44 years) for only 12 percent.<br />
Distribution of households and mortgage payments, 2009<br />
Distribution of households, disposable <strong>in</strong>come and capital, 2009<br />
80<br />
80<br />
60<br />
60<br />
40<br />
40<br />
20<br />
20<br />
0<br />
100 % 25 to 35 yrs 35 to 45 yrs<br />
Households<br />
Mortgage payments<br />
0<br />
Households<br />
100 % 25 to 35 yrs 35 to 45 yrs<br />
Disposable <strong>in</strong>come<br />
Capital<br />
45 to 55 yrs<br />
65 yrs or older<br />
55 to 65 yrs<br />
45 to 55 yrs<br />
65 yrs or older<br />
55 to 65 yrs<br />
Baby boomers 27