Babyboomers in the Netherlands: What the statistics say - Cbs
Babyboomers in the Netherlands: What the statistics say - Cbs
Babyboomers in the Netherlands: What the statistics say - Cbs

Create successful ePaper yourself
Turn your PDF publications into a flip-book with our unique Google optimized e-Paper software.
… soon followed by a sibl<strong>in</strong>g<br />
The high fertility <strong>in</strong> marriage cohort 1944 is thus <strong>the</strong><br />
result of <strong>the</strong> quick birth of a child with<strong>in</strong> <strong>the</strong> first year<br />
of marriage, but also <strong>the</strong> rapid birth of a second child <strong>in</strong><br />
<strong>the</strong> second year of marriage. Statisticians cited <strong>the</strong><br />
prospect of ‘<strong>the</strong> war tak<strong>in</strong>g a turn for <strong>the</strong> better’ as <strong>the</strong><br />
reason for this fertility behaviour. In <strong>the</strong> first months of<br />
1945, <strong>in</strong> particular, many children were born <strong>in</strong> <strong>the</strong>se<br />
marriages.<br />
Couples who married <strong>in</strong> <strong>the</strong> years 1937–1945 ultimately<br />
produced 3.1 children on average. After three years of<br />
marriage, <strong>the</strong>y had 1.1 children on average. Couples<br />
marry<strong>in</strong>g <strong>in</strong> 1943–1945, were more fertile: <strong>the</strong>y already<br />
had 1.3 children on <strong>the</strong>ir third anniversary. Accord<strong>in</strong>g to<br />
Statistics Ne<strong>the</strong>rlands, this higher fertility was <strong>the</strong><br />
result of ‘a higher number of conceptions as a result of<br />
<strong>the</strong> favourable prospects offered by <strong>the</strong> <strong>in</strong>vasion <strong>in</strong><br />
June 1944’.<br />
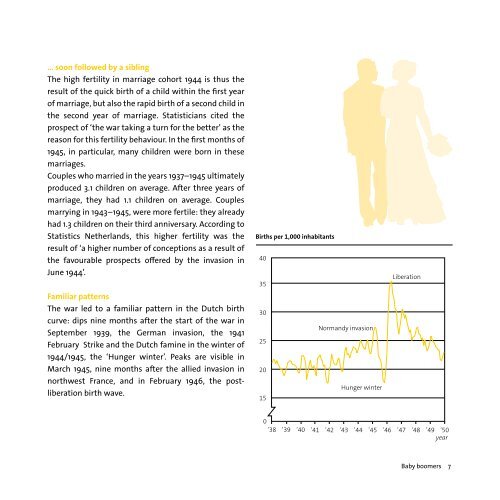
Familiar patterns<br />
The war led to a familiar pattern <strong>in</strong> <strong>the</strong> Dutch birth<br />
curve: dips n<strong>in</strong>e months after <strong>the</strong> start of <strong>the</strong> war <strong>in</strong><br />
September 1939, <strong>the</strong> German <strong>in</strong>vasion, <strong>the</strong> 1941<br />
February Strike and <strong>the</strong> Dutch fam<strong>in</strong>e <strong>in</strong> <strong>the</strong> w<strong>in</strong>ter of<br />
1944/1945, <strong>the</strong> ‘Hunger w<strong>in</strong>ter’. Peaks are visible <strong>in</strong><br />
March 1945, n<strong>in</strong>e months after <strong>the</strong> allied <strong>in</strong>vasion <strong>in</strong><br />
northwest France, and <strong>in</strong> February 1946, <strong>the</strong> postliberation<br />
birth wave.<br />
Births per 1,000 <strong>in</strong>habitants<br />
40<br />
35<br />
30<br />
Normandy <strong>in</strong>vasion<br />
25<br />
20<br />
Hunger w<strong>in</strong>ter<br />
15<br />
Liberation<br />
0<br />
’38<br />
’39<br />
’40<br />
’41<br />
’42<br />
’43 ’44 ’45 ’46 ’47 ’48 ’49 ’50<br />
year<br />
Baby boomers 7