Babyboomers in the Netherlands: What the statistics say - Cbs
Babyboomers in the Netherlands: What the statistics say - Cbs
Babyboomers in the Netherlands: What the statistics say - Cbs

Create successful ePaper yourself
Turn your PDF publications into a flip-book with our unique Google optimized e-Paper software.
migration. Demographic developments <strong>in</strong> <strong>the</strong><br />
Ne<strong>the</strong>rlands differ strongly from those <strong>in</strong> Germany for<br />
example, where deaths already started outnumber<strong>in</strong>g<br />
births <strong>in</strong> <strong>the</strong> 1970s. Positive net migration was not<br />
enough to prevent a decrease <strong>in</strong> <strong>the</strong> German population<br />
from 2003 onwards. Accord<strong>in</strong>g to <strong>the</strong> latest forecasts,<br />
<strong>in</strong> <strong>the</strong> Ne<strong>the</strong>rlands this process will only start <strong>in</strong> 2040.<br />
Perhaps most surpris<strong>in</strong>g are <strong>the</strong> demographic<br />
differences between <strong>the</strong> Dutch and <strong>the</strong> Belgians. In<br />
Belgium net migration was often higher than natural<br />
growth. Belgian natural growth was always lower than<br />
that <strong>in</strong> <strong>the</strong> Ne<strong>the</strong>rlands, which led to a noticeable<br />
difference <strong>in</strong> population growth between <strong>the</strong> two<br />
countries. In 1900 <strong>the</strong> Belgian population numbered<br />
6.7 million, 1.6 million more than <strong>the</strong> Ne<strong>the</strong>rlands. In<br />
<strong>the</strong> 1930s and 1940s <strong>the</strong> two populations were about<br />
<strong>the</strong> same size, but as a result of <strong>the</strong> consistently much<br />
higher Dutch natural growth, 5.7 million more people<br />
now live <strong>in</strong> <strong>the</strong> Ne<strong>the</strong>rlands than <strong>in</strong> Belgium. Indeed –<br />
unlike <strong>the</strong> Ne<strong>the</strong>rlands – <strong>the</strong> growth <strong>in</strong> Belgium was<br />
ma<strong>in</strong>ly <strong>the</strong> result of migration.<br />
Germany leads <strong>the</strong> way<br />
Historical birth rates, and – to a lesser extent – later<br />
migration rates, have been <strong>the</strong> ma<strong>in</strong> causes of large<br />
differences <strong>in</strong> population age<strong>in</strong>g with<strong>in</strong> Europe.<br />
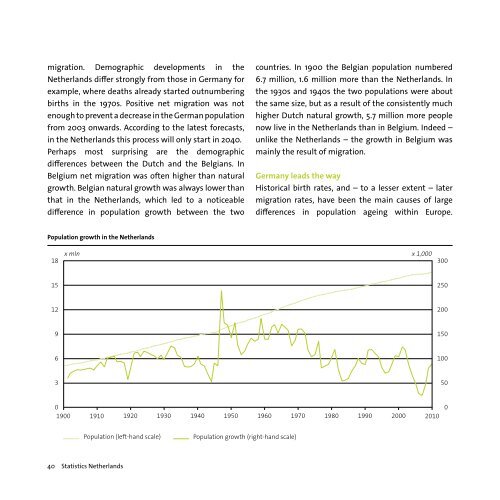
Population growth <strong>in</strong> <strong>the</strong> Ne<strong>the</strong>rlands<br />
18<br />
x mln<br />
x 1,000<br />
300<br />
15<br />
250<br />
12<br />
200<br />
9<br />
150<br />
6<br />
100<br />
3<br />
50<br />
0 0<br />
1900 1910 1920 1930 1940 1950 1960 1970 1980 1990 2000 2010<br />
Population (left-hand scale)<br />
Population growth (right-hand scale)<br />
40 Statistics Ne<strong>the</strong>rlands