modeling the growth of students' covariational reasoning during an ...
modeling the growth of students' covariational reasoning during an ...
modeling the growth of students' covariational reasoning during an ...

Create successful ePaper yourself
Turn your PDF publications into a flip-book with our unique Google optimized e-Paper software.
7<br />
MODELING THE GROWTH OF STUDENTS’<br />
COVARIATIONAL REASONING DURING AN<br />
INTRODUCTORY STATISTICS COURSE 4<br />
ANDREW S. ZIEFFLER<br />
University <strong>of</strong> Minnesota<br />
zief0002@umn.edu<br />
JOAN B. GARFIELD<br />
University <strong>of</strong> Minnesota<br />
jbg@umn.edu<br />
ABSTRACT<br />
This study examined students’ development <strong>of</strong> <strong>reasoning</strong> about qu<strong>an</strong>titative bivariate<br />
data <strong>during</strong> a one-semester university-level introductory statistics course. There were<br />
three research questions <strong>of</strong> interest: (1) What is <strong>the</strong> nature, or pattern <strong>of</strong> ch<strong>an</strong>ge in<br />
students’ development in <strong>reasoning</strong> throughout <strong>the</strong> course?; (2) Is <strong>the</strong> sequencing <strong>of</strong><br />
qu<strong>an</strong>titative bivariate data within <strong>the</strong> course associated with differences in <strong>the</strong><br />
pattern <strong>of</strong> ch<strong>an</strong>ge in <strong>reasoning</strong>?; <strong>an</strong>d (3) Are ch<strong>an</strong>ges in <strong>reasoning</strong> about<br />
foundational concepts <strong>of</strong> distribution associated with differences in <strong>the</strong> pattern <strong>of</strong><br />
ch<strong>an</strong>ge? Covariational <strong>an</strong>d distributional <strong>reasoning</strong> were measured four times <strong>during</strong><br />
<strong>the</strong> course, across four cohorts <strong>of</strong> students. A linear mixed-effects model was used to<br />
<strong>an</strong>alyze <strong>the</strong> data, revealing some interesting trends <strong>an</strong>d relationships regarding <strong>the</strong><br />
development <strong>of</strong> <strong>covariational</strong> <strong>reasoning</strong>.<br />
Keywords: Statistics education research; Growth <strong>modeling</strong>; Topic sequencing<br />
1. THE IMPORTANCE OF UNDERSTANDING COVARIATION<br />
Reasoning about association (or relationship) between two variables, also referred to<br />
as <strong>covariational</strong> <strong>reasoning</strong>, or <strong>reasoning</strong> about bivariate data, involves knowing how to<br />
judge <strong>an</strong>d interpret a relationship between two variables. Covariational <strong>reasoning</strong> has also<br />
been defined as <strong>the</strong> cognitive activities involved in coordinating two varying qu<strong>an</strong>tities<br />
while attending to <strong>the</strong> ways in which <strong>the</strong>y ch<strong>an</strong>ge in relation to each o<strong>the</strong>r (Carlson,<br />
Jacobs, Coe, Larsen, & Hsu, 2002). This type <strong>of</strong> <strong>reasoning</strong> may take a very ma<strong>the</strong>matical<br />
form (e.g., a linear function), a statistical form (<strong>reasoning</strong> about a scatterplot), or a more<br />
qualitative form (e.g., causal predictions about events, based on observed associations,<br />
such as spending more time studying seems to lead to better test grades, as described in<br />
causal model <strong>the</strong>ory in psychology). Covariational <strong>reasoning</strong> is also viewed as playing <strong>an</strong><br />
import<strong>an</strong>t role in scientific <strong>reasoning</strong> (Koslowski, 1996; Schauble, 1996). Although<br />
covariation between events is a necessary but not sufficient basis for inferring a causal<br />
relationship, it is a basis for making causal inductive inferences in science (Zimmerm<strong>an</strong>,<br />
2005).<br />
The concept <strong>of</strong> covariation may be unique in that it is <strong>an</strong> import<strong>an</strong>t concept in <strong>the</strong><br />
different fields <strong>of</strong> psychology, science, ma<strong>the</strong>matics, <strong>an</strong>d statistics, <strong>an</strong>d that <strong>covariational</strong><br />
<strong>reasoning</strong> is described somewhat differently in each discipline. Statistici<strong>an</strong>s may be<br />
Statistics Education Research Journal, 8(1), 7-31, http://www.stat.auckl<strong>an</strong>d.ac.nz/serj<br />
© International Association for Statistical Education (IASE/ISI), May, 2009
8<br />
surprised that <strong>reasoning</strong> about covariation, which <strong>the</strong>y think <strong>of</strong> as a statistical topic<br />
focusing on bivariate distributions <strong>of</strong> data, is much more complex th<strong>an</strong> <strong>the</strong> familiar<br />
caution that “correlation does not imply causation,” <strong>an</strong>d beyond <strong>reasoning</strong> about<br />
scatterplots, correlation, <strong>an</strong>d regression <strong>an</strong>alyses. Indeed, cognitive psychologists<br />
McKenzie <strong>an</strong>d Mikkelsen (2007) wrote that <strong>covariational</strong> <strong>reasoning</strong> is one <strong>of</strong> <strong>the</strong> most<br />
import<strong>an</strong>t cognitive activities that hum<strong>an</strong>s perform.<br />
Davis (1964) summed up <strong>the</strong> goal <strong>of</strong> education well when he wrote, “The primary<br />
object <strong>of</strong> teaching is to produce learning (that is, ch<strong>an</strong>ge), <strong>an</strong>d <strong>the</strong> amount <strong>an</strong>d kind <strong>of</strong><br />
learning that occur c<strong>an</strong> be ascertained only by comparing <strong>an</strong> individual’s or a group’s<br />
status before <strong>the</strong> learning period with what it is after <strong>the</strong> learning period” (p. 234). This<br />
idea <strong>of</strong> measuring “ch<strong>an</strong>ge” is even more salient in <strong>the</strong> current era <strong>of</strong> educational research<br />
(e.g., see No Child Left Behind Act <strong>of</strong> 2001; United States Department <strong>of</strong> Education,<br />
2005).<br />
The study described in this paper attempted to examine <strong>the</strong> development, or ch<strong>an</strong>ge,<br />
in students’ <strong>reasoning</strong> about qu<strong>an</strong>titative bivariate data over <strong>the</strong> sp<strong>an</strong> <strong>of</strong> <strong>an</strong> entire<br />
introductory statistics course. Fur<strong>the</strong>rmore, this study examined whe<strong>the</strong>r students’<br />
development <strong>of</strong> <strong>reasoning</strong> about qu<strong>an</strong>titative bivariate data c<strong>an</strong> be explained by o<strong>the</strong>r<br />
factors that have been identified in <strong>the</strong> research literature.<br />
2. REVIEW OF THE LITERATURE<br />
Because <strong>of</strong> its import<strong>an</strong>t role in so m<strong>an</strong>y disciplines, <strong>covariational</strong> <strong>reasoning</strong> has been<br />
<strong>the</strong> focus <strong>of</strong> research in psychology, science, <strong>an</strong>d ma<strong>the</strong>matics education, in addition to<br />
statistics education. The research studies related to <strong>covariational</strong> underst<strong>an</strong>ding <strong>an</strong>d<br />
<strong>reasoning</strong> are quite diverse, <strong>an</strong>d vary according to <strong>the</strong> disciplinary field <strong>of</strong> <strong>the</strong> researchers.<br />
Therefore, we summarize in <strong>the</strong> following section <strong>the</strong> main contributions from each <strong>of</strong><br />
<strong>the</strong>se different disciplines.<br />
2.1. RESEARCH STUDIES IN PSYCHOLOGY, MATHEMATICS EDUCATION,<br />
AND SCIENCE EDUCATION<br />
Research by psychologists provides much <strong>of</strong> <strong>the</strong> foundational work in <strong>covariational</strong><br />
<strong>reasoning</strong>. Since <strong>the</strong> early studies by Inhelder <strong>an</strong>d Piaget (1958), psychologists have<br />
documented <strong>the</strong> import<strong>an</strong>ce <strong>of</strong> <strong>covariational</strong> <strong>reasoning</strong> in <strong>the</strong> day-to-day lives <strong>of</strong> people.<br />
These studies document that people are surprisingly poor at assessing covariation <strong>an</strong>d that<br />
prior beliefs about <strong>the</strong> relationship between two variables have a great deal <strong>of</strong> influence<br />
on <strong>the</strong>ir judgments <strong>of</strong> <strong>the</strong> covariation between those variables (e.g., Jennings, Amabile, &<br />
Ross, 1982; Kuhn, Amsel, & O’Loughlin, 1988). The psychological research also shows<br />
that one particular shortcoming that people have when intuitively assessing covariation, is<br />
to believe that <strong>the</strong>re is a correlation between two uncorrelated events, because <strong>the</strong>y<br />
believe <strong>the</strong>y are related. Referred to as <strong>an</strong> illusory correlation, this phenomenon has been<br />
<strong>of</strong>fered as a cognitive expl<strong>an</strong>ation for stereotypic judgments (see Hamilton & Gifford,<br />
1976; McGah<strong>an</strong>, McDougal, Williamson, & Pryor, 2000).<br />
M<strong>an</strong>y <strong>of</strong> <strong>the</strong> psychology studies examined how people reason about covariation <strong>of</strong><br />
data in contingency tables (e.g., Kao & Wasserm<strong>an</strong>, 1993). Some <strong>of</strong> <strong>the</strong> results have<br />
found that people have difficulty when <strong>the</strong> relationship is negative (e.g., Beyth-Marom,<br />
1982), <strong>an</strong>d that peoples’ <strong>covariational</strong> judgment <strong>of</strong> <strong>the</strong> relationship between two variables<br />
tends to be less th<strong>an</strong> optimum (i.e., smaller th<strong>an</strong> <strong>the</strong> actual correlation presented in <strong>the</strong><br />
data or graph) especially when <strong>the</strong>y believe <strong>the</strong>re is a relationship between <strong>the</strong> two<br />
variables in question (e.g., Jennings et al., 1982). A consistent finding in several studies is
9<br />
that people have a tendency to form causal relationships based on a <strong>covariational</strong> <strong>an</strong>alysis<br />
in almost every situation where <strong>the</strong>y have prior beliefs about <strong>the</strong> relationship (e.g., Ross<br />
& Cousins, 1993).<br />
A different focus is found in studies conducted by ma<strong>the</strong>matics education researchers<br />
on <strong>covariational</strong> <strong>reasoning</strong>, which is used extensively in both algebra (Nemirovsky, 1996)<br />
<strong>an</strong>d calculus (Thompson, 1994). M<strong>an</strong>y <strong>of</strong> <strong>the</strong>se studies have examined students’<br />
underst<strong>an</strong>ding <strong>of</strong> functions, or aspects <strong>of</strong> bivariate <strong>reasoning</strong> that are commonly used in<br />
algebra <strong>an</strong>d calculus (e.g., Carlson et al., 2002). In particular, studies have suggested that<br />
this type <strong>of</strong> <strong>reasoning</strong> plays a major role in students’ underst<strong>an</strong>ding <strong>of</strong> <strong>the</strong> derivative, or<br />
rate <strong>of</strong> ch<strong>an</strong>ge (e.g., Carlson et al.), <strong>an</strong>d that this interpretation <strong>of</strong> covariation is slow to<br />
develop among students (e.g., Monk & Nemirovsky, 1994; Nemirovsky, 1996). Studies<br />
from ma<strong>the</strong>matics education have also shown that not only is students’ ability to interpret<br />
graphical <strong>an</strong>d functional information slow to develop, but that students tend not to see <strong>the</strong><br />
graph <strong>of</strong> a function as depicting covariation (Thompson, 1994).<br />
Research studies in science education research have examined aspects <strong>of</strong> covariation<br />
found in both <strong>the</strong> psychological studies (e.g., confusing correlation <strong>an</strong>d causation; e.g.,<br />
Adi, Karplus, Lawson, & Pulos, 1978) <strong>an</strong>d <strong>the</strong> ma<strong>the</strong>matical studies <strong>of</strong> covariation (e.g.,<br />
<strong>reasoning</strong> about lines <strong>an</strong>d functions in <strong>the</strong> context <strong>of</strong> science problems; e.g., Wavering,<br />
1989). A third type <strong>of</strong> science education study focuses on more <strong>of</strong> <strong>the</strong> statistical aspects<br />
<strong>of</strong> science. For example, K<strong>an</strong>ari <strong>an</strong>d Millar (2004) examined students’ approaches to data<br />
collection <strong>an</strong>d interpretation as <strong>the</strong>y investigated relationships between variables, as part<br />
<strong>of</strong> students’ ability to reason from data. The authors found that students <strong>of</strong> all ages had a<br />
much lower success rate in investigations where <strong>the</strong> dependent variable did not covary<br />
with <strong>the</strong> independent variable, th<strong>an</strong> in those where it did covary. They suggested that<br />
school science investigations should include both covariation <strong>an</strong>d non-covariation cases<br />
to develop students’ <strong>covariational</strong> <strong>reasoning</strong>.<br />
2.2. COVARIATIONAL REASONING AND JUDGMENTS IN STATISTICS<br />
EDUCATION RESEARCH<br />
The newly emerging field <strong>of</strong> statistics education research includes studies <strong>of</strong> students’<br />
<strong>covariational</strong> <strong>reasoning</strong> in <strong>the</strong> context <strong>of</strong> instruction in statistics. The impact <strong>of</strong> computers<br />
in developing students’ <strong>covariational</strong> <strong>reasoning</strong> was studied by Bat<strong>an</strong>ero, Estepa, Godino,<br />
<strong>an</strong>d Green (1996) <strong>an</strong>d Bat<strong>an</strong>ero, Estepa, <strong>an</strong>d Godino (1997). They identified several<br />
misconceptions <strong>an</strong>d errors students make when <strong>reasoning</strong> about covariation. For example,<br />
<strong>the</strong>se studies revealed <strong>the</strong> persistence <strong>of</strong> a unidirectional misconception, me<strong>an</strong>ing that<br />
students only perceive a relationship between two variables if it is positive.<br />
Both studies also showed that students maintained <strong>the</strong>ir causal misconception<br />
throughout <strong>the</strong> duration <strong>of</strong> <strong>the</strong> experiments, <strong>an</strong>d that students had problems with several<br />
aspects associated with <strong>covariational</strong> <strong>reasoning</strong>, such as distinguishing between <strong>the</strong> role<br />
<strong>of</strong> independent <strong>an</strong>d dependent variables <strong>an</strong>d <strong>reasoning</strong> about relationships that were<br />
negative. Finally, students realized that <strong>the</strong> absolute value <strong>of</strong> <strong>the</strong> correlation coefficient<br />
was related to <strong>the</strong> magnitude <strong>of</strong> <strong>the</strong> relationship, but did not relate that idea to <strong>the</strong> spread<br />
<strong>of</strong> scatter around <strong>the</strong> regression line.<br />
O<strong>the</strong>r studies have examined students’ <strong>covariational</strong> <strong>reasoning</strong> as <strong>the</strong>y study<br />
regression <strong>an</strong>d reported some <strong>of</strong> <strong>the</strong> difficulties associated with this topic including<br />
problems with interpretation (e.g., Sánchez, 1999), <strong>an</strong>d problems with <strong>the</strong> coefficient <strong>of</strong><br />
determination, or R 2 (Trur<strong>an</strong>, 1997). Konold (2002) presented a different view <strong>of</strong><br />
whe<strong>the</strong>r or not people c<strong>an</strong> make accurate <strong>covariational</strong> judgments when presented with<br />
contingency tables or scatterplots. He suggested that people are not poor at making <strong>the</strong>se
10<br />
judgments, but ra<strong>the</strong>r <strong>the</strong>y have trouble decoding <strong>the</strong> ways in which <strong>the</strong>se relationships<br />
are displayed (e.g., scatterplots or contingency tables).<br />
In a study <strong>of</strong> younger children, Moritz (2004) had students tr<strong>an</strong>slate verbal statements<br />
to graphs <strong>an</strong>d also tr<strong>an</strong>slate a scatterplot into a verbal statement. The students were also<br />
given a written survey that included six or seven open-ended tasks involving familiar<br />
variables. The variables were chosen so that students would expect a positive covariation,<br />
but <strong>the</strong> data given in <strong>the</strong> task represented a negative covariation. Moritz found m<strong>an</strong>y <strong>of</strong><br />
<strong>the</strong> same student difficulties as o<strong>the</strong>r studies have revealed: that students <strong>of</strong>ten focused on<br />
isolated data points ra<strong>the</strong>r th<strong>an</strong> on <strong>the</strong> global data set (e.g., Ben-Zvi & Arcavi, 2001); that<br />
students would <strong>of</strong>ten focus on a single variable ra<strong>the</strong>r th<strong>an</strong> <strong>the</strong> bivariate data; <strong>an</strong>d that<br />
several students had trouble h<strong>an</strong>dling negative covariations when <strong>the</strong>y are contradictory<br />
to <strong>the</strong>ir prior beliefs.<br />
Two design experiments investigated <strong>the</strong> role <strong>of</strong> technology in helping students<br />
reason about bivariate data, <strong>an</strong>d how students differentiate between local <strong>an</strong>d global<br />
variation in bivariate data. Gravemeijer’s (2000) results suggested that students need <strong>an</strong><br />
idea <strong>of</strong> <strong>the</strong> global trend (prior expectation) <strong>an</strong>d that students have a hard time<br />
distinguishing between arbitrary <strong>an</strong>d structural covariation. He suggested that students<br />
examine <strong>an</strong>d compare several univariate data sets (time series) as <strong>an</strong> introduction to<br />
examining bivariate data.<br />
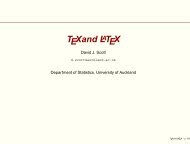
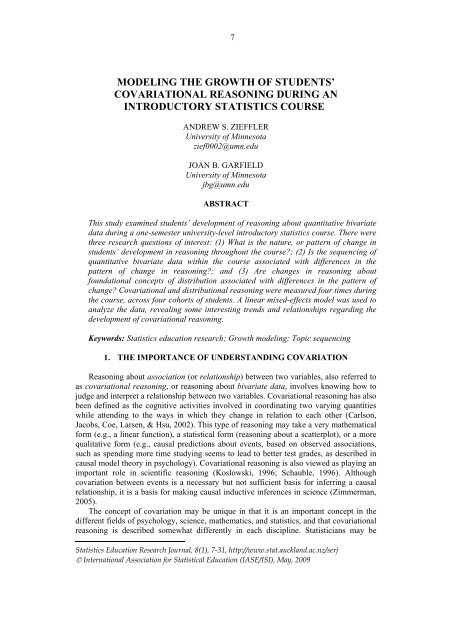
This approach was used by Cobb, McClain, <strong>an</strong>d Gravemeijer (2003) to help students<br />
view bivariate data as distributed in two-dimensional space, to see scatterplots as<br />
situational texts, <strong>an</strong>d to track <strong>the</strong> distribution <strong>of</strong> one variable across <strong>the</strong> o<strong>the</strong>r (sc<strong>an</strong><br />
vertically ra<strong>the</strong>r th<strong>an</strong> diagonally). Using <strong>the</strong> Minitools s<strong>of</strong>tware (Cobb, Gravemeijer,<br />
Bowers, & Doorm<strong>an</strong>, 1997) students examined <strong>the</strong> “vertical variation” across levels <strong>of</strong> x<br />
in graphs <strong>of</strong> bivariate data. Students were asked to compare differences in <strong>the</strong> distribution<br />
<strong>of</strong> <strong>the</strong> y-variable at different levels <strong>of</strong> <strong>the</strong> x-variable (see Figure 1).<br />
Figure 1. Minitools s<strong>of</strong>tware allows students to start looking at <strong>the</strong> local variation for<br />
different values on <strong>the</strong> x-axis in addition to <strong>the</strong> global trend<br />
The results <strong>of</strong> <strong>the</strong>ir study suggested that <strong>the</strong> shape <strong>of</strong> a distribution is a better place to<br />
start th<strong>an</strong> is variability <strong>an</strong>d that <strong>the</strong>re be a continued focus on relative density <strong>an</strong>d on <strong>the</strong><br />
shape <strong>of</strong> <strong>the</strong> data within vertical slices. They also suggested that <strong>an</strong> emphasis on shape<br />
could lead to a discussion <strong>of</strong> strength <strong>an</strong>d direction in a bivariate plot <strong>an</strong>d that <strong>the</strong> focus<br />
on vertical distribution could lead to a more intuitive idea <strong>of</strong> <strong>the</strong> line <strong>of</strong> best fit.
11<br />
2.3. UNIVARIATE DISTRIBUTION AS THE FOUNDATION FOR<br />
COVARIATIONAL REASONING<br />
Recent research has pointed to <strong>the</strong> import<strong>an</strong>ce <strong>of</strong> building up a foundation for<br />
covariation upon <strong>the</strong> building blocks <strong>of</strong> distribution (e.g., Cobb, 1998; Cobb et al., 2003;<br />
Gravemeijer, 2000; Konold, 2002; Konold & Higgins, 2003). Cobb et al. <strong>an</strong>d<br />
Gravemeijer (2000) have suggested that a deep underst<strong>an</strong>ding <strong>of</strong> characteristics <strong>of</strong><br />
distribution – such as shape, center <strong>an</strong>d variation – is import<strong>an</strong>t foundational knowledge<br />
in a complete underst<strong>an</strong>ding <strong>of</strong> bivariate data. Building on <strong>the</strong> ideas <strong>of</strong> distribution is also<br />
congruent with Ben-Zvi <strong>an</strong>d Garfield’s (2004) recommendation <strong>of</strong> focusing on big ideas<br />
to provide a foundation for course content <strong>an</strong>d develop <strong>the</strong> underpinnings <strong>of</strong> statistical<br />
<strong>reasoning</strong>.<br />
Cobb et al. (2003) have hypo<strong>the</strong>sized that a focus on graphs <strong>an</strong>d shape is <strong>an</strong> import<strong>an</strong>t<br />
piece <strong>of</strong> statistics students’ development. They suggested that a focus on shape will make<br />
it easier for students to tr<strong>an</strong>sition to reading a bivariate plot (scatterplot) because students<br />
were able to find it reasonable to talk about <strong>an</strong>d compare <strong>the</strong> distribution within different<br />
vertical slices <strong>of</strong> <strong>the</strong> bivariate distribution. This, in turn, will “provide a basis for a<br />
subsequent focus on trends <strong>an</strong>d patterns in <strong>an</strong> entire data set” (Cobb et al., p. 84).<br />
Gravemeijer (2000) also suggested that students begin by comparing univariate data sets,<br />
but instead <strong>of</strong> <strong>the</strong> focus on shape in <strong>the</strong> vertical slices, he posited that <strong>the</strong> medi<strong>an</strong> might<br />
be a better comparison. He purported that students c<strong>an</strong> <strong>the</strong>n focus on a global trend by<br />
examining <strong>the</strong> medi<strong>an</strong> <strong>of</strong> <strong>the</strong> vertical distribution across measures <strong>of</strong> <strong>the</strong> horizontal (x)<br />
variable. Still o<strong>the</strong>r statistics educators have suggested that variation might be <strong>the</strong> piece<br />
<strong>of</strong> pre-requisite knowledge that m<strong>an</strong>dates <strong>the</strong> most attention, pointing out that in fact,<br />
covariation concerns <strong>the</strong> correspondence <strong>of</strong> variation among two or more variables (e.g.,<br />
Moritz, 2004).<br />
2.4. SUMMARY OF THE RESEARCH<br />
Looking at <strong>the</strong> studies across <strong>the</strong> different disciplines, we note <strong>the</strong> following general<br />
findings:<br />
• Students’ prior beliefs about <strong>the</strong> relationship between two variables have a great<br />
deal <strong>of</strong> influence on <strong>the</strong>ir judgments <strong>of</strong> <strong>the</strong> covariation between those variables;<br />
• Students <strong>of</strong>ten believe <strong>the</strong>re is a correlation between two uncorrelated events<br />
(illusory correlation);<br />
• Students’ <strong>covariational</strong> judgments seem to be most influenced by <strong>the</strong> joint<br />
presence <strong>of</strong> variables <strong>an</strong>d least influenced by <strong>the</strong> joint absence <strong>of</strong> variables;<br />
• Students have difficulty <strong>reasoning</strong> about covariation when <strong>the</strong> relationship is<br />
negative;<br />
• Students’ <strong>covariational</strong> judgment <strong>of</strong> <strong>the</strong> relationship between two variables tends<br />
to be less th<strong>an</strong> optimum (i.e., smaller th<strong>an</strong> <strong>the</strong> actual correlation presented in <strong>the</strong><br />
data or graph); <strong>an</strong>d<br />
• Students have a tendency to form causal relationships based on a <strong>covariational</strong><br />
<strong>an</strong>alysis.<br />
Taken as a whole, <strong>the</strong> research on <strong>covariational</strong> <strong>reasoning</strong> has examined m<strong>an</strong>y<br />
questions about misconceptions <strong>an</strong>d difficulties that students have in <strong>reasoning</strong> about<br />
covariation, <strong>an</strong>d has suggested methods for introducing <strong>an</strong>d developing <strong>the</strong>se ideas.<br />
However, <strong>the</strong>re are m<strong>an</strong>y research questions yet un<strong>an</strong>swered. With enrollment in<br />
undergraduate statistics courses increasing (College Board, 2003) it is import<strong>an</strong>t that
12<br />
educators strive to underst<strong>an</strong>d <strong>an</strong>d improve students’ ability to reason with <strong>an</strong>d<br />
underst<strong>an</strong>d covariation.<br />
Although researchers have examined peoples’ <strong>covariational</strong> <strong>reasoning</strong> on both<br />
dichotomous <strong>an</strong>d continuous variables, <strong>the</strong>re have been few studies that have examined<br />
<strong>the</strong> development <strong>of</strong> students’ <strong>reasoning</strong> about covariation in <strong>an</strong> introductory statistics<br />
course <strong>an</strong>d <strong>the</strong> optimal placement <strong>of</strong> bivariate qu<strong>an</strong>titative data <strong>an</strong>alysis. The literature<br />
reviewed has suggested that students’ <strong>reasoning</strong> about covariation could be influenced by<br />
several factors, including students’ developing <strong>reasoning</strong> about univariate distribution.<br />
Therefore, three research questions were used to frame this study:<br />
1. What is <strong>the</strong> nature, or pattern <strong>of</strong> ch<strong>an</strong>ge in students’ development in <strong>reasoning</strong><br />
about qu<strong>an</strong>titative bivariate data throughout <strong>an</strong> introductory statistics course?<br />
2. Is <strong>the</strong> sequencing <strong>of</strong> qu<strong>an</strong>titative bivariate data within a course associated with<br />
differences in <strong>the</strong> pattern <strong>of</strong> ch<strong>an</strong>ge in students’ <strong>reasoning</strong> about qu<strong>an</strong>titative<br />
bivariate data?<br />
3. Are ch<strong>an</strong>ges in students’ <strong>reasoning</strong> about <strong>the</strong> foundational concepts <strong>of</strong><br />
distribution associated with differences in <strong>the</strong> pattern <strong>of</strong> ch<strong>an</strong>ge in students’<br />
<strong>reasoning</strong> about qu<strong>an</strong>titative bivariate data?<br />
3.1. OVERVIEW OF STUDY<br />
3. METHODOLOGY<br />
This study took place <strong>during</strong> <strong>the</strong> fall semester <strong>of</strong> <strong>the</strong> 2005/2006 school year. It<br />
involved four cohorts <strong>of</strong> a one-semester (three credit hours), non-calculus based<br />
introductory statistics course taught in <strong>the</strong> College <strong>of</strong> Education at a mid-western<br />
university in <strong>the</strong> United States <strong>of</strong> America. Two different instructors taught <strong>the</strong>se four<br />
cohorts. All four cohorts met in a computer lab two times a week for <strong>an</strong> hour <strong>an</strong>d fifteen<br />
minutes each time. Each <strong>of</strong> <strong>the</strong>se cohorts had <strong>an</strong> enrollment <strong>of</strong> about 30 students.<br />
This study utilized linear mixed-effects models (LMM) to examine ch<strong>an</strong>ge in<br />
students’ development <strong>of</strong> <strong>reasoning</strong> about qu<strong>an</strong>titative bivariate data. Because <strong>the</strong><br />
<strong>modeling</strong> <strong>of</strong> ch<strong>an</strong>ge requires individuals to be measured on <strong>the</strong> same concept in temporal<br />
sequence, a repeated-measures, or longitudinal design was employed. Students enrolled<br />
in a collegiate level introductory statistics course were assessed on <strong>the</strong>ir <strong>reasoning</strong> about<br />
qu<strong>an</strong>titative bivariate data four times <strong>during</strong> a semester. Examining <strong>the</strong> ch<strong>an</strong>ge in<br />
students’ <strong>reasoning</strong> about qu<strong>an</strong>titative bivariate data over <strong>the</strong>se four time points addressed<br />
<strong>the</strong> first research question.<br />
To examine <strong>the</strong> association between course sequencing <strong>an</strong>d <strong>the</strong> patterns <strong>of</strong> ch<strong>an</strong>ge in<br />
students’ <strong>reasoning</strong> about qu<strong>an</strong>titative bivariate data, <strong>the</strong> two instructors <strong>of</strong> <strong>the</strong> course<br />
used in <strong>the</strong> study were used as blocks to r<strong>an</strong>domly assign each cohort <strong>of</strong> <strong>the</strong> course to one<br />
<strong>of</strong> two different course sequences (see Table 1). These two sequences both started with<br />
<strong>the</strong> topics <strong>of</strong> sampling <strong>an</strong>d exploratory data <strong>an</strong>alysis (EDA). Then <strong>the</strong> first sequence<br />
continued with <strong>the</strong> topic <strong>of</strong> qu<strong>an</strong>titative bivariate data followed by sampling distributions,<br />
probability, <strong>an</strong>d inference. The second sequence followed EDA with sampling<br />
distributions, probability, inference, <strong>an</strong>d ended <strong>the</strong> course with <strong>the</strong> topic <strong>of</strong> qu<strong>an</strong>titative<br />
bivariate data.
13<br />
Table 1. The two sequences taught fall semester 2005<br />
Sequence 1:<br />
Sampling → EDA → Bivariate Data → Sampling Distribution → Probability → Inference<br />
(6 Days) (7 Days) (4 Days) (3 Days) (2 Days) (6 Days)<br />
Sequence 2:<br />
Sampling → EDA → Sampling Distribution → Probability → Inference → Bivariate Data<br />
(6 Days) (7 Days) (3 Days) (2 Days) (6 Days) (4 Days)<br />
To examine whe<strong>the</strong>r ch<strong>an</strong>ges in students’ <strong>reasoning</strong> about <strong>the</strong> foundational concepts<br />
<strong>of</strong> distribution were associated with ch<strong>an</strong>ges in <strong>the</strong> development <strong>of</strong> students’ <strong>reasoning</strong><br />
about qu<strong>an</strong>titative bivariate data, students were also assessed on <strong>the</strong>ir distributional<br />
<strong>reasoning</strong> four times <strong>during</strong> <strong>the</strong> course <strong>of</strong> <strong>the</strong> semester.<br />
3.2. SETTING<br />
The study particip<strong>an</strong>ts consisted <strong>of</strong> n = 113 undergraduate students. These students<br />
were typically female social science majors (84% females <strong>an</strong>d 16% males) who were<br />
enrolled in <strong>the</strong> course to complete part <strong>of</strong> <strong>the</strong>ir graduation requirements. These students<br />
belong to <strong>the</strong> larger population <strong>of</strong> undergraduate social science majors who take <strong>an</strong><br />
introductory statistics course in <strong>an</strong> Educational Psychology department.<br />
This particular introductory statistics course was designed so that it was aligned with<br />
recent Guidelines for <strong>the</strong> Assessment <strong>an</strong>d Instruction in Statistics Education (GAISE; see<br />
Americ<strong>an</strong> Statistical Association, 2005a) endorsed by <strong>the</strong> Americ<strong>an</strong> Statistical<br />
Association (Americ<strong>an</strong> Statistical Association, 2005b). In addition, <strong>the</strong> course materials<br />
were based on what has been learned from research literature on teaching <strong>an</strong>d learning<br />
statistics. The unit on qu<strong>an</strong>titative bivariate data was designed to help students avoid<br />
common errors <strong>an</strong>d difficulties identified in <strong>the</strong> research literature <strong>an</strong>d to build a solid<br />
underst<strong>an</strong>ding <strong>an</strong>d good <strong>reasoning</strong> based on <strong>the</strong> results <strong>of</strong> best practices <strong>an</strong>d research<br />
results. Overall, <strong>the</strong> research literature guided both <strong>the</strong> structure <strong>of</strong> <strong>the</strong> course (i.e., scope<br />
<strong>an</strong>d sequence) <strong>an</strong>d <strong>the</strong> instructional methods (i.e., activities, technologies, <strong>an</strong>d<br />
discussions) used within <strong>the</strong> course. The course included collecting <strong>an</strong>d <strong>an</strong>alyzing real<br />
data sets, s<strong>of</strong>tware programs to illustrate abstract concepts, <strong>an</strong>d m<strong>an</strong>y active learning<br />
techniques. Lesson pl<strong>an</strong>s for every instructional session were created <strong>during</strong> <strong>the</strong> initial<br />
design phase <strong>of</strong> <strong>the</strong> course in <strong>the</strong> summer <strong>of</strong> 2004, which included class goals, discussion<br />
questions, <strong>an</strong>d a sequence <strong>of</strong> activities. These lesson pl<strong>an</strong>s helped provide more<br />
consistency across multiple cohorts <strong>of</strong> <strong>the</strong> course taught by different instructors. These<br />
materials were used, evaluated, <strong>an</strong>d revised <strong>during</strong> <strong>the</strong> two semesters prior to <strong>the</strong> study.<br />
The two instructors teaching <strong>the</strong> four cohorts followed identical lesson pl<strong>an</strong>s<br />
throughout <strong>the</strong> duration <strong>of</strong> <strong>the</strong> course <strong>an</strong>d met regularly to help ensure consistency among<br />
<strong>the</strong> cohorts. Both <strong>of</strong> <strong>the</strong> instructors had helped develop <strong>the</strong> course materials <strong>an</strong>d had<br />
taught <strong>the</strong> course multiple times prior to <strong>the</strong> time <strong>of</strong> this study. Both instructors were<br />
experienced teachers, having both high school <strong>an</strong>d college teaching experience, <strong>an</strong>d were<br />
doctoral students in <strong>the</strong> Qu<strong>an</strong>titative Methods in Education (QME) program with a<br />
concentration in Statistics Education, so <strong>the</strong>y were also familiar with <strong>the</strong> current statistics<br />
education guidelines <strong>an</strong>d relev<strong>an</strong>t research.
14<br />
3.3. INSTRUMENTS<br />
Three instruments were administered to students to collect data on <strong>the</strong>ir <strong>reasoning</strong> <strong>an</strong>d<br />
<strong>the</strong>ir background characteristics. These were: 1) <strong>the</strong> Bivariate Reasoning Assessment, 2)<br />
<strong>the</strong> Distributional Reasoning Scale, <strong>an</strong>d 3) <strong>the</strong> Student background survey. Descriptions<br />
<strong>of</strong> each instrument follow.<br />
Bivariate Reasoning Assessment (BR) Students’ <strong>covariational</strong> <strong>reasoning</strong> was<br />
measured using <strong>the</strong> qu<strong>an</strong>titative bivariate data scale from <strong>the</strong> Assessment Resource Tools<br />
for Improving Statistical Thinking (see Appendix for <strong>the</strong> instrument; Garfield, delMas, &<br />
Ch<strong>an</strong>ce, n.d.). The eight forced-choice items assessed <strong>reasoning</strong> <strong>an</strong>d interpretation<br />
regarding <strong>the</strong> correlation coefficient <strong>an</strong>d relationships between <strong>the</strong> correlation coefficient<br />
<strong>an</strong>d <strong>the</strong> display <strong>of</strong> data in a scatterplot. These items seem aligned with import<strong>an</strong>t aspects<br />
<strong>of</strong> bivariate <strong>reasoning</strong> indentured in <strong>the</strong> statistics education literature (e.g., Mortiz, 2004).<br />
Distributional Reasoning Scale (DR) Ten items from <strong>the</strong> Comprehensive<br />
Assessment <strong>of</strong> Outcomes in a First Statistics Course (CAOS; available from ARTIST,<br />
Garfield et al., n.d.) were used to measure students’ <strong>reasoning</strong> about univariate<br />
distribution. Experts have identified <strong>the</strong>se items as focusing on <strong>reasoning</strong> about univariate<br />
distribution. They included items on interpreting different graphical displays, drawing<br />
conclusions from data, <strong>an</strong>d <strong>reasoning</strong> about variation.<br />
Student Background Survey (SBS) To help determine whe<strong>the</strong>r <strong>the</strong> r<strong>an</strong>domization<br />
process was effective, <strong>an</strong>d also to identify which covariates might be import<strong>an</strong>t in<br />
explaining <strong>the</strong> pattern <strong>of</strong> students’ development <strong>of</strong> <strong>reasoning</strong> about bivariate data, several<br />
different instruments were combined <strong>an</strong>d used to ga<strong>the</strong>r data. These survey items<br />
assessed students’ prior ma<strong>the</strong>matical (10 items) <strong>an</strong>d statistical (30 items) knowledge, as<br />
well as identifying students’ academic background (4 items) <strong>an</strong>d prior coursework in<br />
ma<strong>the</strong>matics, statistics, <strong>an</strong>d computer science (15 items). Each <strong>of</strong> <strong>the</strong>se instruments is<br />
described in much greater detail in Zieffler (2006).<br />
Instrument administration Each <strong>of</strong> <strong>the</strong> research instruments was administered on <strong>the</strong><br />
first day <strong>of</strong> class (Session 1) to obtain baseline measures. The BR <strong>an</strong>d DR instruments<br />
were also administered <strong>during</strong> three o<strong>the</strong>r class periods (Session 14, Session 25, <strong>an</strong>d<br />
Session 29). These assessments were administered in Session 14 <strong>an</strong>d Session 25 because<br />
those were <strong>the</strong> two classroom sessions that immediately preceded instruction <strong>of</strong> bivariate<br />
data for each <strong>of</strong> <strong>the</strong> two course sequences listed in Table 1. The assessment was also<br />
given <strong>during</strong> <strong>the</strong> last classroom session <strong>of</strong> <strong>the</strong> semester (Session 29).<br />
The items from <strong>the</strong>se two instruments were combined into one comprehensive<br />
instrument to ease <strong>the</strong> actual administration, <strong>an</strong>d <strong>the</strong> items were r<strong>an</strong>domized for each <strong>of</strong><br />
<strong>the</strong> four administrations. This comprehensive instrument was administered <strong>during</strong> class<br />
time to ensure test security <strong>an</strong>d integrity. Because <strong>of</strong> <strong>the</strong> difficulty associated with<br />
assessing students multiple times without feedback, students were <strong>of</strong>fered extra credit to<br />
participate in <strong>the</strong> study.<br />
3.4. DATA ANALYSIS<br />
In this section, <strong>the</strong> <strong>an</strong>alysis used to <strong>an</strong>swer each <strong>of</strong> <strong>the</strong> research questions is<br />
described. Before <strong>the</strong>se descriptions are <strong>of</strong>fered, a brief expl<strong>an</strong>ation <strong>of</strong> linear mixedeffects<br />
models, <strong>the</strong> primary <strong>an</strong>alysis method used, is given.
15<br />
Linear mixed-effects models Researchers interested in studying ch<strong>an</strong>ge are generally<br />
interested in <strong>an</strong>swering two types <strong>of</strong> questions about ch<strong>an</strong>ge (Boyle & Willms, 2001).<br />
The first <strong>of</strong> <strong>the</strong>se questions <strong>of</strong> interest is how to “characterize each person’s pattern <strong>of</strong><br />
ch<strong>an</strong>ge over time,” <strong>an</strong>d <strong>the</strong> second asks about “<strong>the</strong> association between predictors <strong>an</strong>d <strong>the</strong><br />
patterns <strong>of</strong> ch<strong>an</strong>ge” (Singer & Willett, 2003, p. 8). The statistical models that researchers<br />
use to examine ch<strong>an</strong>ge go by a variety <strong>of</strong> names – r<strong>an</strong>dom coefficients models, mixedeffects<br />
models, hierarchical linear models (HLM), or multilevel models are just a few.<br />
These models provide a statistical methodology that allows researchers to <strong>an</strong>swer both<br />
types <strong>of</strong> questions about ch<strong>an</strong>ge, <strong>an</strong>d in addition have m<strong>an</strong>y adv<strong>an</strong>tages over traditional<br />
statistical methods such as RM-MANOVA, including <strong>the</strong> accommodation <strong>of</strong> missing data<br />
(e.g., Collins, Schafer, & Kam, 2001) <strong>an</strong>d flexibility in model specification which c<strong>an</strong><br />
lead to greater power <strong>an</strong>d efficiency in estimation (e.g., Verbeke & Molenberghs, 2000).<br />
The linear mixed-model (LMM) used for this study is a multi-level regression model<br />
that incorporates two components: a level-1 linear model that describes intra-individual<br />
(within subjects) ch<strong>an</strong>ge, <strong>an</strong>d a level-2 conditional model that describes systematic interindividual<br />
(between subjects) differences in ch<strong>an</strong>ge. In <strong>the</strong> level-1 model, time is used as<br />
<strong>the</strong> independent variable for predicting individual students’ baselines (starting points) <strong>an</strong>d<br />
trajectories (shape or pattern <strong>of</strong> <strong>the</strong> curve) in <strong>the</strong>ir <strong>reasoning</strong> about bivariate data. The<br />
level-2 models allow us to determine <strong>the</strong> extent that those baselines <strong>an</strong>d trajectories vary<br />
as a function <strong>of</strong> one or more covariates (i.e., o<strong>the</strong>r measured variables, such as previous<br />
achievement, that are used to differentiate individuals). For a more detailed expl<strong>an</strong>ation<br />
<strong>of</strong> <strong>the</strong> LMM methodology, see Verbeke <strong>an</strong>d Molenberghs (2000) or Raudenbush <strong>an</strong>d<br />
Bryk (2002).<br />
Unconditional model <strong>an</strong>alysis To explore students’ ch<strong>an</strong>ge in development in<br />
<strong>reasoning</strong> about bivariate data, <strong>an</strong> unconditional LMM was fitted to <strong>the</strong> data to describe<br />
<strong>the</strong> pattern <strong>of</strong> ch<strong>an</strong>ge exhibited in <strong>the</strong> data. An import<strong>an</strong>t piece <strong>of</strong> <strong>the</strong> mixed-effects<br />
model methodology is <strong>the</strong> correct specification <strong>of</strong> <strong>the</strong> model including both <strong>the</strong> fixed <strong>an</strong>d<br />
r<strong>an</strong>dom effects, as well as <strong>the</strong> within-group covari<strong>an</strong>ce structure. In <strong>the</strong> tradition <strong>of</strong><br />
mixed-effects models <strong>an</strong>alysis, diagnostic strategies such as graphs <strong>an</strong>d sample statistics<br />
were employed to help provide guid<strong>an</strong>ce for this specification. More formal<br />
specifications to fur<strong>the</strong>r subst<strong>an</strong>tiate <strong>the</strong> appropriate structure <strong>of</strong> <strong>the</strong> level-1 model were<br />
made by computing <strong>an</strong>d comparing model estimates <strong>an</strong>d fit statistics.<br />
Conditional model <strong>an</strong>alyses A conditional LMM was used to help provide <strong>an</strong>swers<br />
for <strong>the</strong> second <strong>an</strong>d third research question. A conditional model allows for predictors<br />
o<strong>the</strong>r th<strong>an</strong> just time. To <strong>an</strong>swer <strong>the</strong> second research question, <strong>the</strong> two instructional<br />
sequences were effect coded <strong>an</strong>d introduced into <strong>the</strong> model for ch<strong>an</strong>ge that is adopted. To<br />
<strong>an</strong>swer <strong>the</strong> third research question, <strong>the</strong> ch<strong>an</strong>ge in students’ <strong>reasoning</strong> about univariate<br />
distribution was qu<strong>an</strong>tified <strong>an</strong>d entered as a predictor in <strong>the</strong> model for ch<strong>an</strong>ge.<br />
4. RESULTS<br />
The data <strong>an</strong>alyses <strong>an</strong>d results are presented in three sections, one for each <strong>the</strong> three<br />
research questions. All <strong>an</strong>alyses were carried out using R version 2.2.1 (R Development<br />
Core Team, 2008). The mixed-effects <strong>modeling</strong> utilized <strong>the</strong> lme4 (Bates & Sarkar,<br />
2005) <strong>an</strong>d nlme (Pinheiro, Bates, DebRoy, & Sarkar, 2005) libraries. For more detailed<br />
descriptions <strong>of</strong> all <strong>the</strong> <strong>an</strong>alyses presented in this section see Zieffler (2006).<br />
Initial <strong>an</strong>alyses <strong>of</strong> several measured covariates using <strong>the</strong> Student Background Survey<br />
(not presented) suggested that <strong>the</strong> r<strong>an</strong>domization process seemed to have been effective
16<br />
in producing groups with equivalent student characteristics (see Zieffler, 2006 for more<br />
detail). Examination <strong>of</strong> <strong>the</strong> sample scores <strong>an</strong>d responses for all instruments showed<br />
sufficient reliability, using Cronbach’s coefficient alpha (Cronbach, 1951), for research<br />
purposes (all were above .71).<br />
Table 2 shows <strong>the</strong> average student score on <strong>the</strong> four administrations <strong>of</strong> both <strong>the</strong><br />
distributional <strong>an</strong>d <strong>the</strong> bivariate <strong>reasoning</strong> assessments. It is not surprising that <strong>the</strong><br />
students beg<strong>an</strong> <strong>the</strong> class with a very low me<strong>an</strong> score on <strong>the</strong> BR, but it was surprising that<br />
<strong>the</strong> largest increase came between <strong>the</strong> beginning <strong>of</strong> course <strong>an</strong>d <strong>the</strong> 14 th instructional<br />
session (before <strong>an</strong>y formal instruction on bivariate data). It was also surprising that <strong>the</strong><br />
me<strong>an</strong> score at <strong>the</strong> end <strong>of</strong> <strong>the</strong> class was barely over 50% correct, revealing <strong>the</strong> difficulty<br />
students have <strong>reasoning</strong> about bivariate data. The same pattern is also seen in students’<br />
DR scores. In both instructional sequences, <strong>the</strong> average distributional <strong>reasoning</strong> score<br />
increased. The greatest increase occurred between <strong>the</strong> first <strong>an</strong>d second measurement<br />
occasions.<br />
Table 2. Me<strong>an</strong>s (st<strong>an</strong>dard deviations), on <strong>the</strong> bivariate <strong>an</strong>d distributional <strong>reasoning</strong><br />
assessment for all measurement occasions for both instructional sequences<br />
Distributional Reasoning (DR) Bivariate Reasoning (BR)<br />
Class Session Sequence 1 a Sequence 2 Sequence 1 Sequence 2<br />
Session 1 0.56 (1.04) 1.18 (1.43) 1.00 (1.03) 0.79 (1.23)<br />
Session 14 7.31 (1.69) 7.50 (1.74) 3.84 (1.53) 4.09 (1.61)<br />
Session 25 7.51 (1.70) 7.55 (1.41) 5.12 (1.48) 4.61 (1.63)<br />
Session 29 7.56 (1.77) 7.50 (1.57) 4.57 (1.58) 5.02 (1.53)<br />
Note. The DR had a possible r<strong>an</strong>ge <strong>of</strong> 0 to 10, with higher numbers indicating a higher<br />
perceived degree <strong>of</strong> <strong>reasoning</strong>. The BR had a possible r<strong>an</strong>ge <strong>of</strong> 0 to 8, with higher numbers<br />
indicating a higher perceived degree <strong>of</strong> <strong>reasoning</strong>.<br />
a Sequence 1 taught bivariate data early <strong>an</strong>d inference later. Sequence 2 taught inference<br />
early <strong>an</strong>d bivariate data later (see Table 1).<br />
4.1. RESULTS OF FITTING THE UNCONDITIONAL MODEL<br />
To explore students’ ch<strong>an</strong>ge in development in <strong>reasoning</strong> about bivariate data, a<br />
LMM was fitted to <strong>the</strong> data to describe <strong>the</strong> pattern <strong>of</strong> ch<strong>an</strong>ge exhibited in <strong>the</strong> data. Based<br />
on <strong>the</strong> results <strong>of</strong> several <strong>an</strong>alyses (not presented), a quadratic level-1 model was<br />
employed to model <strong>the</strong> me<strong>an</strong> within-student ch<strong>an</strong>ge in <strong>reasoning</strong> about qu<strong>an</strong>titative<br />
bivariate data. A r<strong>an</strong>dom-effects structure with unstructured residuals was also adopted<br />
<strong>an</strong>d used in all subsequent <strong>an</strong>alyses. Lastly, several model comparisons seemed to<br />
suggest that <strong>the</strong> best fitting model to <strong>the</strong> data would have r<strong>an</strong>dom-effects associated with<br />
both <strong>the</strong> linear <strong>an</strong>d quadratic terms but not with <strong>the</strong> intercept term. Exploratory <strong>an</strong>alysis<br />
on <strong>the</strong> residuals <strong>of</strong> <strong>the</strong> fitted models [distribution <strong>of</strong> st<strong>an</strong>dardized residuals against <strong>the</strong><br />
grouping factor (i.e., <strong>the</strong> r<strong>an</strong>dom effect) <strong>an</strong>d against fitted values, separately for each<br />
level <strong>of</strong> <strong>the</strong> classification factor (i.e., <strong>the</strong> fixed effect)] revealed that <strong>the</strong> model<br />
assumptions were adequately met, according to <strong>the</strong> inspection criteria described by<br />
Pinheiro <strong>an</strong>d Bates (2000). The parameter estimates for <strong>the</strong> unconditional model appear<br />
in Table 3.
17<br />
Table 3. Unconditional model used to describe students’ ch<strong>an</strong>ge in <strong>reasoning</strong> about<br />
qu<strong>an</strong>titative bivariate data (n = 113)<br />
Fixed Effects<br />
Unconditional<br />
Model<br />
Intercept 0.90***<br />
Linear term 0.32***<br />
Quadratic term -0.01***<br />
Vari<strong>an</strong>ce Components<br />
Level-1 Within-student 1.23***<br />
Level-2<br />
Linear Term<br />
Vari<strong>an</strong>ce 0.0148**<br />
Quadratic Term<br />
Vari<strong>an</strong>ce 0.0000124*<br />
Covari<strong>an</strong>ce with linear term -0.000407*<br />
Goodness-<strong>of</strong>-fit<br />
-2LogLikelihood 1432.9<br />
AIC 1446.9<br />
BIC 1475.0<br />
*p < 0.05. **p < 0.01. ***p < 0.001.<br />
Note. This model was fitted using Restricted Maximum Likelihood in R.<br />
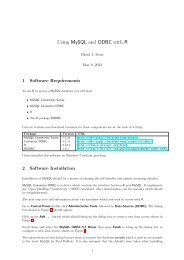
Interpretation <strong>of</strong> <strong>the</strong> parameter estimates for <strong>the</strong> second unconditional model The<br />
sample fixed-effects estimate <strong>the</strong> average initial score, linear rate <strong>of</strong> ch<strong>an</strong>ge, <strong>an</strong>d<br />
quadratic rate <strong>of</strong> ch<strong>an</strong>ge on <strong>the</strong> BR. Each <strong>of</strong> <strong>the</strong> three fixed-effects is statistically<br />
signific<strong>an</strong>t (p < 0.001). This average within-student trajectory is plotted in Figure 2. The<br />
within-student vari<strong>an</strong>ce component summarizes <strong>the</strong> average scatter <strong>of</strong> <strong>an</strong> individual<br />
student’s observed BR score around his/her ch<strong>an</strong>ge trajectory. This estimate is<br />
statistically signific<strong>an</strong>t (p < 0.001) which suggests that <strong>the</strong>re is still within-student<br />
variation to account for.<br />
Figure 2. Predicted ch<strong>an</strong>ge in qu<strong>an</strong>titative bivariate <strong>reasoning</strong> for <strong>an</strong> average student<br />
The level-2 vari<strong>an</strong>ce components qu<strong>an</strong>tify <strong>the</strong> amount <strong>of</strong> unpredicted variation in <strong>the</strong><br />
individual <strong>growth</strong> parameters. Though <strong>the</strong> estimated vari<strong>an</strong>ce components for <strong>the</strong> linear
18<br />
rate <strong>of</strong> ch<strong>an</strong>ge <strong>an</strong>d <strong>the</strong> quadratic rate <strong>of</strong> ch<strong>an</strong>ge both seem to be non-zero in <strong>the</strong><br />
population (p < 0.01 <strong>an</strong>d p < 0.05 respectively), <strong>the</strong>ir practical signific<strong>an</strong>ce is<br />
questionable. The covari<strong>an</strong>ce, which is also signific<strong>an</strong>t (p < 0.05), informs us <strong>of</strong> <strong>the</strong><br />
relationship between linear rate <strong>of</strong> ch<strong>an</strong>ge <strong>an</strong>d quadratic rate <strong>of</strong> ch<strong>an</strong>ge. Interpretation c<strong>an</strong><br />
be easier if <strong>the</strong> covari<strong>an</strong>ce is re-expressed as a correlation coefficient <strong>of</strong> -0.94.<br />
We conclude that <strong>the</strong> relationship between <strong>the</strong> average linear rate <strong>of</strong> ch<strong>an</strong>ge <strong>an</strong>d<br />
quadratic rate <strong>of</strong> ch<strong>an</strong>ge in students’ ability to reason about qu<strong>an</strong>titative bivariate data is<br />
both negative <strong>an</strong>d strong <strong>an</strong>d, because <strong>the</strong> hypo<strong>the</strong>sis test is signific<strong>an</strong>t, is believably nonzero.<br />
This indicates that students who have higher linear rates <strong>of</strong> ch<strong>an</strong>ge also tend to have<br />
lower quadratic rates <strong>of</strong> ch<strong>an</strong>ge.<br />
This model suggests that students, on average, have some ability to reason about<br />
qu<strong>an</strong>titative bivariate data before <strong>an</strong>y instruction on bivariate data (e.g., before Session<br />
14) in <strong>an</strong> introductory statistics course as indicated by <strong>the</strong> signific<strong>an</strong>ce <strong>of</strong> <strong>the</strong> intercept<br />
fixed-effect term. There also seems to be very little variability in students’ baseline<br />
<strong>reasoning</strong> about qu<strong>an</strong>titative bivariate data. In o<strong>the</strong>r words, <strong>the</strong>y all seem to be starting at<br />
<strong>the</strong> same place. The signific<strong>an</strong>ce <strong>of</strong> <strong>the</strong> positive linear fixed-effect term suggests that<br />
students, on average, are increasing <strong>the</strong>ir level <strong>of</strong> <strong>reasoning</strong> about qu<strong>an</strong>titative bivariate<br />
data throughout <strong>an</strong> introductory statistics course, but this <strong>growth</strong> does not persist due to<br />
<strong>the</strong> negative quadratic fixed-effect term. Eventually, due to ma<strong>the</strong>matical reasons alone,<br />
<strong>the</strong> quadratic term will remove more th<strong>an</strong> <strong>the</strong> linear term will add, causing <strong>the</strong> trajectory<br />
to peak <strong>an</strong>d <strong>the</strong>n decline, assuming <strong>the</strong> relationship continues in this m<strong>an</strong>ner. Both <strong>of</strong><br />
<strong>the</strong>se rates <strong>of</strong> ch<strong>an</strong>ge vary from student-to-student.<br />
4.2. RESULTS OF FITTING THE FIRST CONDITIONAL MODEL<br />
A conditional LMM was used to help provide <strong>an</strong> <strong>an</strong>swer for <strong>the</strong> second research<br />
question. To <strong>an</strong>swer this research question, <strong>the</strong> two instructional sequences were effect<br />
coded <strong>an</strong>d introduced into <strong>the</strong> quadratic model for ch<strong>an</strong>ge that was adopted in <strong>the</strong><br />
previous section. A model including cross-level interaction terms between <strong>the</strong> covariate<br />
<strong>an</strong>d each level-1 predictor was initially fitted to <strong>the</strong> data <strong>an</strong>d refined.<br />
Interpretation <strong>of</strong> <strong>the</strong> parameter estimates for <strong>the</strong> first conditional model This model<br />
included instructional sequence as a predictor <strong>of</strong> initial status, as well as both linear <strong>an</strong>d<br />
quadratic ch<strong>an</strong>ge. Interpretation <strong>of</strong> its six fixed-effects (which are not presented) are<br />
straightforward: (1) <strong>the</strong> estimated score on <strong>the</strong> BR for all students at <strong>the</strong> beginning <strong>of</strong> <strong>an</strong><br />
introductory statistics course is on average 0.90 (p < 0.0001); (2) <strong>the</strong> estimated me<strong>an</strong><br />
difference in initial BR score between students on average <strong>an</strong>d those taking a class that<br />
uses <strong>the</strong> second instructional sequence (coded 1) is -0.07 points (p = 0.49); (3) <strong>the</strong><br />
estimated average linear rate <strong>of</strong> ch<strong>an</strong>ge in BR score for all students is 0.32 (p < 0.0001);<br />
(4) <strong>the</strong> estimated average difference between <strong>the</strong> overall average linear rate <strong>of</strong> ch<strong>an</strong>ge <strong>an</strong>d<br />
students in classes that taught <strong>the</strong> second instructional sequence is -0.00004 (p = 0.999);<br />
(5) <strong>the</strong> estimated average quadratic rate <strong>of</strong> ch<strong>an</strong>ge for all students is -0.01 (p < 0.0001);<br />
(6) <strong>an</strong>d lastly <strong>the</strong> estimated average difference in quadratic rate <strong>of</strong> ch<strong>an</strong>ge for students<br />
enrolled in courses that taught <strong>the</strong> second instructional sequences is 0.0002 (p = 0.78).<br />
These results suggest that on average, students in both sequences have similar<br />
development in <strong>the</strong>ir <strong>reasoning</strong> about bivariate data throughout <strong>an</strong> introductory statistics<br />
course. In o<strong>the</strong>r words, <strong>the</strong> initial differences in average BR scores between students<br />
taking a course that utilized <strong>the</strong> first instructional sequence <strong>an</strong>d students taking a course<br />
that utilized <strong>the</strong> second instructional sequence are indistinguishable from zero. Likewise,
19<br />
<strong>the</strong> differences in average linear rate <strong>of</strong> ch<strong>an</strong>ge <strong>an</strong>d average quadratic rate <strong>of</strong> ch<strong>an</strong>ge are<br />
also not indistinguishable from zero.<br />
The signific<strong>an</strong>t within-student vari<strong>an</strong>ce component in <strong>the</strong> conditional model is<br />
virtually identical to that from <strong>the</strong> unconditional model. This is expected because <strong>the</strong>re<br />
were no level-1 predictors that were added to this model. Both <strong>of</strong> <strong>the</strong> level-2 vari<strong>an</strong>ce<br />
components are also essentially unch<strong>an</strong>ged. These conditional vari<strong>an</strong>ces qu<strong>an</strong>tify <strong>the</strong><br />
inter-individual differences in linear <strong>an</strong>d quadratic ch<strong>an</strong>ge, respectively, that remain<br />
unexplained by <strong>the</strong> predictor.<br />
4.3. RESULTS OF FITTING THE SECOND CONDITIONAL MODEL<br />
To <strong>an</strong>swer this research question, MANOVA was initially employed to examine <strong>an</strong>d<br />
summarize <strong>the</strong> ch<strong>an</strong>ge in students’ <strong>reasoning</strong> about distribution. Because not all students<br />
had a measurement at <strong>the</strong> fouth timepoint, only 98 <strong>of</strong> <strong>the</strong> 113 students were used in <strong>the</strong>se<br />
<strong>an</strong>alyses. The results <strong>of</strong> <strong>the</strong>se <strong>an</strong>alyses (not presented) suggested that <strong>the</strong> difference<br />
scores between <strong>the</strong> first <strong>an</strong>d last measurement occasions could be used as a proxy for<br />
describing <strong>the</strong> ch<strong>an</strong>ge in students’ development in <strong>reasoning</strong> about distribution. These<br />
scores were <strong>the</strong>n me<strong>an</strong> centered (DIST), to facilitate interpretations, <strong>an</strong>d entered as<br />
predictors in a conditional LMM. A model including cross-level interaction terms<br />
between <strong>the</strong> covariate <strong>an</strong>d each level-1 predictor was initially fitted to <strong>the</strong> data <strong>an</strong>d<br />
refined. The parameter estimates for <strong>the</strong> conditional model appear in Table 4.<br />
Table 4. Conditional model to examine students’ ch<strong>an</strong>ge in <strong>reasoning</strong> about univariate<br />
data as a predictor <strong>of</strong> ch<strong>an</strong>ge in students’ <strong>reasoning</strong> about qu<strong>an</strong>titative bivariate data<br />
(n = 98)<br />
Conditional Model<br />
Fixed Effects<br />
Initial Status Intercept 0.86***<br />
DIST 0.13**<br />
Linear rate <strong>of</strong> ch<strong>an</strong>ge Linear term 0.32***<br />
Quadratic rate <strong>of</strong> ch<strong>an</strong>ge Quadratic term -0.00658***<br />
Vari<strong>an</strong>ce Components<br />
Level-1 Within-person 1.10***<br />
Level-2<br />
Linear Term<br />
Vari<strong>an</strong>ce .01**<br />
Quadratic Term<br />
Vari<strong>an</strong>ce 0.0000140<br />
Covari<strong>an</strong>ce with<br />
linear term<br />
-0.000421<br />
Goodness-<strong>of</strong>-fit<br />
-2LogLikelihood 1237.2<br />
AIC 1253.2<br />
BIC 1284.3<br />
*p < 0.05. **p < 0.01. ***p < 0.001.<br />
Note. This model was fitted using Restricted Maximum Likelihood in R.<br />
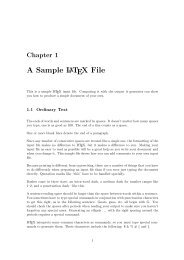
Interpretation <strong>of</strong> <strong>the</strong> parameter estimates for <strong>the</strong> conditional model The fixedeffects<br />
for this conditional model suggest that <strong>the</strong> only parameter that seems to be<br />
influenced by students’ ch<strong>an</strong>ge in <strong>reasoning</strong> about univariate distribution is <strong>the</strong>ir initial
20<br />
status in <strong>reasoning</strong> about bivariate data. The estimated average initial score for students<br />
who show average ch<strong>an</strong>ge in <strong>the</strong>ir <strong>reasoning</strong> about univariate data is 0.86 (p < 0.0001).<br />
The estimated strength <strong>of</strong> association between initial BR scores <strong>an</strong>d centered DR scores is<br />
0.13 (p < 0.01). This result suggests that on average, <strong>the</strong>re is a positive relationship<br />
between initial BR scores <strong>an</strong>d centered DR scores indicating that students who exhibit<br />
larger th<strong>an</strong> average ch<strong>an</strong>ges in <strong>the</strong>ir <strong>reasoning</strong> about univariate distribution also tend to<br />
have higher initial levels <strong>of</strong> <strong>reasoning</strong> about bivariate data. Differences between students’<br />
ch<strong>an</strong>ge in <strong>reasoning</strong> about univariate distribution on average tends not to be associated<br />
with ei<strong>the</strong>r linear or quadratic rates <strong>of</strong> ch<strong>an</strong>ge in <strong>reasoning</strong> about bivariate data<br />
throughout <strong>an</strong> introductory statistics course. A visual depiction <strong>of</strong> this model is shown in<br />
Figure 3.<br />
Figure 3. Predicted average ch<strong>an</strong>ge in qu<strong>an</strong>titative bivariate <strong>reasoning</strong> for students<br />
with small, moderate, <strong>an</strong>d large ch<strong>an</strong>ges in <strong>the</strong>ir <strong>reasoning</strong> about distribution<br />
5. DISCUSSION<br />
This study examined <strong>the</strong> development <strong>of</strong> students’ <strong>reasoning</strong> about bivariate data<br />
over a 15-week introductory college statistics course. Three research questions were<br />
examined <strong>an</strong>d used to structure <strong>the</strong> collection <strong>an</strong>d <strong>an</strong>alysis <strong>of</strong> data. The <strong>an</strong>swers to each<br />
question are summarized below.<br />
5.1. WHAT IS THE NATURE, OR PATTERN OF CHANGE IN STUDENTS’<br />
DEVELOPMENT IN REASONING ABOUT QUANTITATIVE BIVARIATE<br />
DATA THROUGHOUT AN INTRODUCTORY STATISTICS COURSE?<br />
Student data collected over <strong>the</strong> semester revealed marked <strong>growth</strong> in <strong>reasoning</strong> about<br />
bivariate data but this happened primarily in <strong>the</strong> first time period. The LMM that was<br />
adopted to examine this <strong>growth</strong> suggested that students exhibit both linear <strong>an</strong>d quadratic<br />
<strong>growth</strong> in <strong>the</strong>ir development about <strong>reasoning</strong> about bivariate data <strong>an</strong>d that this <strong>growth</strong><br />
varies among individual students. A quadratic model indicates that students’ <strong>reasoning</strong><br />
about bivariate data does not increase in a const<strong>an</strong>t linear fashion, but instead increases<br />
differentially over time. The signific<strong>an</strong>t negative quadratic term suggests that although<br />
students initially show great strides in <strong>the</strong>ir <strong>reasoning</strong> about bivariate data, <strong>the</strong>y likely<br />
eventually pl<strong>an</strong>e <strong>of</strong>f in this development <strong>an</strong>d over time might actually even regress –<br />
although given <strong>the</strong> paucity <strong>of</strong> measurement occasions used in <strong>the</strong> study, this regression
21<br />
likely occurs after <strong>the</strong> course is over. This pattern <strong>of</strong> development, however, is consistent<br />
with several different learning <strong>the</strong>ories (e.g., overlapping waves <strong>the</strong>ory; Siegler, 2000),<br />
<strong>an</strong>d might suggest that a saturation point in bivariate <strong>reasoning</strong> is reached by students <strong>an</strong>d<br />
<strong>the</strong>n decay or interference impedes <strong>an</strong>y more <strong>growth</strong> in <strong>reasoning</strong> which could actually<br />
occur <strong>during</strong> <strong>the</strong> course (e.g., Wixted, 2004).<br />
The model also suggested that on average students without <strong>an</strong>y instruction start with<br />
very little <strong>reasoning</strong> about bivariate data <strong>an</strong>d that this is true for nearly all students (at this<br />
institution). This could be because almost all <strong>of</strong> <strong>the</strong> students used in this study had never<br />
had a previous high school or college-level statistics course. However, <strong>the</strong> low initial<br />
status leaves much to be desired, especially as covariation is recognized <strong>an</strong>d promoted by<br />
<strong>the</strong> National Council <strong>of</strong> Teachers <strong>of</strong> Ma<strong>the</strong>matics in <strong>the</strong> ma<strong>the</strong>matics curriculum at nearly<br />
every age level. This might be explained by <strong>the</strong> fact that m<strong>an</strong>y <strong>of</strong> <strong>the</strong>se students hadn’t<br />
had a ma<strong>the</strong>matics course in several years prior to taking statistics, but it might also be<br />
because <strong>reasoning</strong> is not a major focus <strong>of</strong> most ma<strong>the</strong>matics courses.<br />
Although <strong>the</strong> fixed-effects <strong>an</strong>d r<strong>an</strong>dom-effects terms for intercept, linear rate <strong>of</strong><br />
ch<strong>an</strong>ge, <strong>an</strong>d quadratic rate <strong>of</strong> ch<strong>an</strong>ge were all statistically signific<strong>an</strong>t, <strong>the</strong> practical<br />
signific<strong>an</strong>ce might not be as import<strong>an</strong>t. For inst<strong>an</strong>ce, <strong>the</strong> vari<strong>an</strong>ce term associated with<br />
<strong>the</strong> quadratic rate <strong>of</strong> ch<strong>an</strong>ge was statistically signific<strong>an</strong>t (p < 0.05) indicating that students<br />
vary in <strong>the</strong>ir quadratic rates <strong>of</strong> ch<strong>an</strong>ge. However, <strong>the</strong> actual vari<strong>an</strong>ce term was 0.0000124.<br />
This small vari<strong>an</strong>ce component indicates that students’ quadratic rates <strong>of</strong> ch<strong>an</strong>ge are very<br />
similar. Also, comparatively, <strong>the</strong> within-student vari<strong>an</strong>ce component still accounts for <strong>the</strong><br />
majority <strong>of</strong> <strong>the</strong> variation in BR scores (98%).<br />
One interesting finding is that most <strong>of</strong> <strong>the</strong> ch<strong>an</strong>ge in development in <strong>reasoning</strong> about<br />
bivariate data seemed to occur between <strong>the</strong> first two measurement occasions. This was<br />
before bivariate data was formally taught in ei<strong>the</strong>r instructional sequence. This might<br />
indicate that students’ development in <strong>reasoning</strong> about bivariate data is more <strong>an</strong> artifact<br />
<strong>of</strong> <strong>the</strong>ir development <strong>of</strong> statistical <strong>reasoning</strong> in general th<strong>an</strong> it is a result <strong>of</strong> <strong>an</strong>y formal<br />
instruction on <strong>the</strong> topic <strong>of</strong> bivariate data. However, <strong>the</strong> brevity <strong>of</strong> <strong>the</strong> unit within this<br />
particular introductory statistics class (four instructional sessions) might also inhibit <strong>an</strong><br />
increase in development <strong>of</strong> <strong>reasoning</strong> due to instruction about this topic. It also might<br />
me<strong>an</strong> that students’ <strong>reasoning</strong> about bivariate data is closely tied to <strong>the</strong>ir <strong>reasoning</strong> about<br />
univariate distribution as suggested by <strong>the</strong> statistics education literature (e.g., Cobb et al.,<br />
2003; Gravemeijer, 2000).<br />
5.2. IS THE SEQUENCING OF QUANTITATIVE BIVARIATE DATA WITHIN<br />
A COURSE ASSOCIATED WITH DIFFERENCES IN THE PATTERN OF<br />
CHANGE IN STUDENTS’ REASONING ABOUT QUANTITATIVE<br />
BIVARIATE DATA?<br />
The sequencing <strong>of</strong> bivariate data within a course seemed not to be associated with<br />
ch<strong>an</strong>ges in students’ development <strong>of</strong> <strong>reasoning</strong> about bivariate data. There seemed to be<br />
no differences in ei<strong>the</strong>r <strong>the</strong> linear or quadratic rates <strong>of</strong> ch<strong>an</strong>ge in <strong>covariational</strong> <strong>reasoning</strong><br />
between <strong>the</strong> two instructional sequences. The fact that sequencing was not import<strong>an</strong>t in<br />
explaining patterns <strong>of</strong> development might not be surprising if, as stated in <strong>the</strong> last section,<br />
<strong>reasoning</strong> about bivariate data is just <strong>an</strong> artifact <strong>of</strong> <strong>reasoning</strong> about statistics in general.<br />
Finding no differences in students’ <strong>reasoning</strong> between <strong>the</strong> two sequences might<br />
suggest that <strong>the</strong> topic could be placed wherever <strong>the</strong> instructor or textbook authors<br />
decided. As a word <strong>of</strong> caution, however, even though <strong>the</strong> development in <strong>reasoning</strong> about<br />
bivariate data might not ch<strong>an</strong>ge as a result <strong>of</strong> <strong>the</strong> placement <strong>of</strong> this topic, student<br />
development <strong>of</strong> <strong>reasoning</strong> about o<strong>the</strong>r topics might be impacted. One <strong>of</strong> <strong>the</strong>se topics
22<br />
could be inference. Although this wasn’t tested formally in this study, some <strong>an</strong>ecdotal<br />
evidence, such as students’ complaints <strong>an</strong>d discussion, suggests that students in <strong>the</strong> class<br />
where bivariate data was taught earlier seemed to be struggling with inference more th<strong>an</strong><br />
students in <strong>the</strong> o<strong>the</strong>r classes. It might also be that bivariate data is a topic that is more<br />
“digestible” th<strong>an</strong> inference at <strong>the</strong> end <strong>of</strong> a semester.<br />
Course sequencing has also received little attention in <strong>the</strong> statistics education<br />
literature. Although Ch<strong>an</strong>ce <strong>an</strong>d Rossm<strong>an</strong> (2001) have speculated about <strong>the</strong> placement <strong>of</strong><br />
a unit on bivariate data, <strong>the</strong>re has been no research on optimal placement <strong>of</strong> this, or for<br />
that matter <strong>an</strong>y o<strong>the</strong>r topic within <strong>an</strong> introductory statistics course. The literature on<br />
textbook usage has, however, suggested that <strong>the</strong> content <strong>an</strong>d sequencing <strong>of</strong> textbooks<br />
could influence how effectively students will learn that content (e.g., Valverde, Bi<strong>an</strong>chi,<br />
Wolfe, Schmidt, & Hou<strong>an</strong>g, 2002).<br />
5.3. ARE CHANGES IN STUDENTS’ REASONING ABOUT THE<br />
FOUNDATIONAL CONCEPTS OF DISTRIBUTION ASSOCIATED WITH<br />
DIFFERENCES IN THE PATTERN OF CHANGE IN STUDENTS’<br />
REASONING ABOUT QUANTITATIVE BIVARIATE DATA?<br />
This study found that students who exhibit larger th<strong>an</strong> average ch<strong>an</strong>ges in <strong>the</strong>ir<br />
<strong>reasoning</strong> about univariate distribution also tend to have higher initial levels <strong>of</strong> <strong>reasoning</strong><br />
about bivariate data. Fur<strong>the</strong>rmore, beyond initial status, this study has suggested that<br />
ch<strong>an</strong>ge in <strong>reasoning</strong> about univariate distribution is not associated with students’<br />
development <strong>of</strong> <strong>reasoning</strong> about qu<strong>an</strong>titative bivariate data. The findings from this<br />
research question are also somewhat novel. The research literature on students’ <strong>reasoning</strong><br />
about bivariate data has been generally speculative. Although Cobb et al. (2003) <strong>an</strong>d<br />
Gravemeijer (2000) have all suggested that students need to be able to reason about<br />
univariate distribution before <strong>the</strong>y c<strong>an</strong> reason about bivariate data, <strong>the</strong>re have been no<br />
studies that have examined this hypo<strong>the</strong>sis. Perhaps <strong>the</strong> pattern <strong>of</strong> ch<strong>an</strong>ge in <strong>reasoning</strong><br />
exhibited by students in this study casts some doubt on <strong>the</strong>se speculations. However,<br />
because most <strong>of</strong> <strong>the</strong> <strong>growth</strong> in <strong>reasoning</strong> about bivariate data seemed to occur <strong>during</strong> <strong>the</strong><br />
instruction <strong>of</strong> univariate distribution, perhaps <strong>the</strong>se two types <strong>of</strong> <strong>reasoning</strong> are<br />
inextricably connected.<br />
5.4. LIMITATIONS TO THE STUDY<br />
It is import<strong>an</strong>t to note <strong>the</strong> relatively small sample size (n = 113) in light <strong>of</strong> <strong>the</strong> use <strong>of</strong><br />
multi-level <strong>modeling</strong>. This sample size may have resulted in less efficiency <strong>an</strong>d power for<br />
<strong>the</strong> multilevel tests. This may have especially impacted <strong>the</strong> findings for <strong>the</strong> third research<br />
question (n = 98). As only 98 students had measurements on <strong>the</strong> fourth occasion, <strong>the</strong><br />
sample was reduced due to <strong>the</strong> fact that not every student had a difference score (level-2<br />
predictor) for this model.<br />
A second limitation is <strong>the</strong> use <strong>of</strong> difference scores as a proxy for ch<strong>an</strong>ge in students’<br />
<strong>reasoning</strong> about univariate distribution. The use <strong>of</strong> difference scores has long been a<br />
controversial issue, especially in regard to reliability (e.g., Cronbach & Furby, 1970;<br />
Willett, 1989b). The limited variability in scores may also have impacted <strong>the</strong> LMM<br />
coefficients.<br />
Thirdly, teacher differences may also have affected <strong>the</strong> results. Inconsistencies due to<br />
<strong>the</strong>se differences might have affected <strong>growth</strong> in such a way as to “cover up” differences<br />
due to one <strong>of</strong> <strong>the</strong> tested level-2 predictors. In larger studies this c<strong>an</strong> be accounted for by<br />
using a three-level model where measurements are nested within students, which are
23<br />
nested within teachers. Thus, <strong>the</strong> variation c<strong>an</strong> be fur<strong>the</strong>r partitioned <strong>an</strong>d accounted for.<br />
However, <strong>the</strong> small number <strong>of</strong> teachers (k = 2) did not allow this type <strong>of</strong> model to<br />
converge in this study.<br />
Lastly, generalization may also be limited due to <strong>the</strong> type <strong>of</strong> introductory statistics<br />
students that were used in <strong>the</strong> study, namely social science students. However, <strong>the</strong>y might<br />
be typical in terms <strong>of</strong> initial levels <strong>of</strong> <strong>reasoning</strong> <strong>an</strong>d background for students enrolled in a<br />
non-calculus based first semester statistics course. Also, <strong>the</strong> study particip<strong>an</strong>ts seemed<br />
typical in terms <strong>of</strong> exhibiting m<strong>an</strong>y <strong>of</strong> <strong>the</strong> same misconceptions that were identified in <strong>the</strong><br />
literature (e.g., <strong>the</strong>y have a tendency to form causal relationships based on a <strong>covariational</strong><br />
<strong>an</strong>alysis).<br />
5.5. IMPLICATIONS FOR TEACHING<br />
Despite <strong>the</strong> limitations described above concerning this study, <strong>the</strong> results suggest<br />
some practical implications for teachers <strong>of</strong> introductory statistics courses. For example,<br />
<strong>the</strong> results suggest that it is import<strong>an</strong>t to spend ample time developing students’ <strong>reasoning</strong><br />
about univariate distribution to provide a solid foundation for <strong>reasoning</strong> about<br />
qu<strong>an</strong>titative bivariate data. This recommendation is consistent with recommendations in<br />
<strong>the</strong> statistics education literature that advocate that by covering fewer topics, a deeper<br />
conceptual underst<strong>an</strong>ding <strong>of</strong> <strong>the</strong> topics covered c<strong>an</strong> be achieved, which tr<strong>an</strong>slates into a<br />
greater underst<strong>an</strong>ding <strong>of</strong> topics that are covered at a later time (e.g., Americ<strong>an</strong> Statistical<br />
Association, 2005b; Cobb, 1992; International Association for Statistical Education,<br />
2005).<br />
Although this study did not show a ch<strong>an</strong>ge in students’ <strong>reasoning</strong> about qu<strong>an</strong>titative<br />
bivariate data based on where <strong>the</strong> unit was placed in a course, <strong>an</strong>ecdotal evidence did<br />
suggest that <strong>the</strong> sequence had <strong>an</strong> effect on students’ <strong>reasoning</strong> about statistical inference.<br />
The smooth tr<strong>an</strong>sition from normal distribution to sampling distribution to statistical<br />
inference may lead to a better underst<strong>an</strong>ding <strong>of</strong> statistical inference ra<strong>the</strong>r th<strong>an</strong> inserting a<br />
unit on qu<strong>an</strong>titative bivariate data between <strong>the</strong>se topics.<br />
It is also import<strong>an</strong>t to note that despite <strong>the</strong> use <strong>of</strong> a good research-based unit <strong>of</strong><br />
instruction on bivariate data, students still had difficulty with m<strong>an</strong>y items on <strong>the</strong> bivariate<br />
<strong>reasoning</strong> assessment at <strong>the</strong> end <strong>of</strong> a 15-week course. These results confirm <strong>the</strong> finding in<br />
<strong>the</strong> research literature that ideas <strong>of</strong> covariation are <strong>of</strong>ten difficult for students to learn <strong>an</strong>d<br />
may be counter-intuitive. Therefore, more attention should be paid to activities <strong>an</strong>d<br />
instructional materials used to develop <strong>the</strong> import<strong>an</strong>t concepts that support <strong>covariational</strong><br />
<strong>reasoning</strong>. Finally, <strong>the</strong> results suggest that if teachers emphasize <strong>the</strong> development <strong>of</strong><br />
students’ statistical <strong>reasoning</strong> throughout a course or curriculum, it may help students<br />
better prepare <strong>the</strong>mselves to reason about qu<strong>an</strong>titative bivariate data.<br />
5.6. FUTURE RESEARCH<br />
Additional research is suggested that examines <strong>growth</strong> <strong>of</strong> student <strong>reasoning</strong> within <strong>an</strong><br />
introductory statistics course. One factor that continues to need investigation is <strong>the</strong><br />
optimal placement <strong>of</strong> a unit on qu<strong>an</strong>titative bivariate data <strong>an</strong>d how this placement<br />
influences students’ development in <strong>covariational</strong> <strong>reasoning</strong>, as well as <strong>the</strong> development<br />
<strong>of</strong> <strong>reasoning</strong> about o<strong>the</strong>r topics within <strong>an</strong> introductory statistics course such as inference.<br />
Questions about <strong>the</strong> best sequencing <strong>of</strong> curriculum within <strong>an</strong> introductory statistics<br />
course are import<strong>an</strong>t not only in how <strong>the</strong>y impact students’ learning <strong>an</strong>d <strong>reasoning</strong> about<br />
statistics in general, but in how those sequences impact students’ <strong>reasoning</strong> <strong>of</strong> sub-topics<br />
within a course.
24<br />
Ano<strong>the</strong>r suggested line <strong>of</strong> research is how foundational topics in <strong>an</strong> introductory<br />
statistics course influence students’ development <strong>of</strong> <strong>reasoning</strong> about o<strong>the</strong>r topics.<br />
Although this study examined how ch<strong>an</strong>ges in students’ <strong>reasoning</strong> about univariate<br />
distribution influenced <strong>the</strong>ir <strong>reasoning</strong> about qu<strong>an</strong>titative bivariate data, a different study<br />
might consider how students’ <strong>reasoning</strong> about variation might influence <strong>reasoning</strong> about<br />
qu<strong>an</strong>titative bivariate data or o<strong>the</strong>r statistical <strong>reasoning</strong>.<br />
This study has employed a methodology that allows researchers to examine students’<br />
development <strong>of</strong> <strong>reasoning</strong> in <strong>an</strong> introductory statistics course in <strong>the</strong> context <strong>of</strong> a college<br />
classroom setting. It has also made <strong>an</strong> attempt at using r<strong>an</strong>domization in classroom<br />
research. Future researchers may w<strong>an</strong>t to study predictors that may account for <strong>the</strong> level-<br />
2 variation.<br />
Future research might also use a non-linear model <strong>an</strong>d time-varying predictors to<br />
depict <strong>an</strong>d explain student development. Non-linear models have been used to model<br />
ch<strong>an</strong>ge in student development (e.g., McArdle & Epstein, 1987). This might be more<br />
aligned with learning <strong>the</strong>ories that model <strong>growth</strong>, retention <strong>an</strong>d forgetting (e.g., Min, Vos,<br />
Kommers, & v<strong>an</strong> Dijkum, 2000; Murre & Chessa, 2006; Wozniak, 1990). For inst<strong>an</strong>ce,<br />
<strong>the</strong> use <strong>of</strong> <strong>the</strong> logistic curve to model population <strong>growth</strong> (introduced by Verhulst in 1845)<br />
was adapted by Pearl (1925) to model cognitive <strong>growth</strong>. Ano<strong>the</strong>r example <strong>of</strong> non-linear<br />
<strong>growth</strong> to describe learning is <strong>the</strong> hyperbolic curve outlined by Thurston (1919). Timevarying<br />
predictors c<strong>an</strong> be included in level-1 models to allow for direct effects between<br />
<strong>the</strong> predictor <strong>an</strong>d outcome <strong>of</strong> interest over time.<br />
In summary, <strong>the</strong> study <strong>of</strong> ch<strong>an</strong>ge in students’ <strong>reasoning</strong> requires multiple<br />
measurements over time. The current methodologies used to study ch<strong>an</strong>ge (structural<br />
equation <strong>modeling</strong> [SEM] <strong>an</strong>d multi-level <strong>modeling</strong>) require <strong>the</strong> same assessment to be<br />
used at each time point. This is generally not pedagogically acceptable to most college<br />
teachers given <strong>the</strong> time constraints that accomp<strong>an</strong>y collegiate courses. Even more<br />
complicated is <strong>the</strong> fact that to model a complex <strong>growth</strong> pattern requires more<br />
measurement occasions, especially <strong>during</strong> times that students are exhibiting <strong>the</strong> most<br />
ch<strong>an</strong>ge, such as near <strong>the</strong> beginning <strong>of</strong> <strong>the</strong> semester (Willett, 1989a; Willett, Singer, &<br />
Martin, 1998). This frequent testing could have a negative impact on student attitudes <strong>an</strong>d<br />
cause early fatigue in study subjects. As <strong>the</strong> call for <strong>growth</strong> studies by policy makers <strong>an</strong>d<br />
o<strong>the</strong>r interested parties increases, careful attention should be given to <strong>the</strong> methodologies<br />
<strong>an</strong>d <strong>the</strong> practical problems faced by educators in <strong>the</strong>ir implementation.<br />
ACKNOWLEDGEMENTS<br />
The authors would like to th<strong>an</strong>k Jeffrey Long, Michael Harwell, <strong>an</strong>d Jeffrey Harring<br />
for <strong>the</strong>ir methodological advice.<br />
REFERENCES<br />
Adi, H., Karplus, R., Lawson, A., & Pulos, S. (1978). Intellectual development beyond<br />
elementary school VI: Correlational <strong>reasoning</strong>. School Science & Ma<strong>the</strong>matics, 78(8),<br />
675-683.<br />
Americ<strong>an</strong> Statistical Association. (2005a). GAISE College Report.<br />
[Online: http://www.amstat.org/education/gaise/GAISECollege.htm]<br />
Americ<strong>an</strong> Statistical Association. (2005b). GAISE Endorsement.<br />
[Online: http://www.amstat.org/education/gaise/ASAEndorse.htm]
Baterno, C., Estepa, A., Godino, J. D., & Green, D. R. (1996). Intuitive strategies <strong>an</strong>d<br />
preconceptions about association in contingency tables. Journal for Research in<br />
Ma<strong>the</strong>matics Education, 27(2), 151-169.<br />
Bat<strong>an</strong>ero, C., Estepa, A., & Godino, J. D. (1997). Evolution <strong>of</strong> students’ undert<strong>an</strong>ding <strong>of</strong><br />
statistical association in a computer based teaching environment. In J. B. Garfield &<br />
G. Burrill (Eds.), Research on <strong>the</strong> role <strong>of</strong> technology in teaching <strong>an</strong>d learning<br />
statistics: Proceedings <strong>of</strong> <strong>the</strong> 1996 IASE Round Table Conference (pp. 191-205).<br />
Voorburg, The Ne<strong>the</strong>rl<strong>an</strong>ds: International Statistical Institute.<br />
Bat<strong>an</strong>ero, C., Godino, J. D., & Estepa, A. (1998). Building <strong>the</strong> me<strong>an</strong>ing <strong>of</strong> statistical<br />
association through data <strong>an</strong>alysis activities. In A. Olivier, & K. Newstead (Eds.),<br />
Proceedings <strong>of</strong> <strong>the</strong> 22 nd Conference <strong>of</strong> <strong>the</strong> International Group for <strong>the</strong> Psychology <strong>of</strong><br />
Ma<strong>the</strong>matics Education (Vol. 1, pp. 221-236). Stellenbosh, South Africa: University<br />
<strong>of</strong> Stellenbosh.<br />
Bates, D., & Sarkar, D. (2005). The lme4 package. R package version 0.9975-13.<br />
Ben-Zvi, D., & Arcavi, A. (2001). Junior high school students’ construction <strong>of</strong> global<br />
views <strong>of</strong> data <strong>an</strong>d data representations. Educational Studies in Ma<strong>the</strong>matics, 45, 35-<br />
65.<br />
Ben-Zvi, D., & Garfield, J. (2004). (Eds.). The challenge <strong>of</strong> developing statistical<br />
literacy, <strong>reasoning</strong> <strong>an</strong>d thinking. Dordrecht, The Ne<strong>the</strong>rl<strong>an</strong>ds: Kluwer Academic<br />
Publishing.<br />
Beyth-Marom, R. (1982). Perception <strong>of</strong> correlation reexamined. Memory & Cognition,<br />
10, 511-519.<br />
Boyle, M. H., & Willms, J. D. (2001). Multilevel <strong>modeling</strong> <strong>of</strong> hierarchical data in<br />
developmental studies. Journal <strong>of</strong> Child Psychology <strong>an</strong>d Psychiatry, 42(1), 141-162.<br />
Carlson, M., Jacobs, S., Coe, E., Larsen, S., & Hsu, E. (2002). Applying <strong>covariational</strong><br />
<strong>reasoning</strong> while <strong>modeling</strong> dynamic events. Journal for Research in Ma<strong>the</strong>matics<br />
Education, 33(5), 352-378.<br />
Ch<strong>an</strong>ce, B., & Rossm<strong>an</strong>, A. (2001). Sequencing topics in introductory statistics: A debate<br />
on what to teach when. Americ<strong>an</strong> Statistici<strong>an</strong>, 55(2), 140-144.<br />
Cobb, G. (1992). Teaching statistics. In L. A. Steen (Ed.), Heeding <strong>the</strong> call for ch<strong>an</strong>ge:<br />
Suggestions for curricular action, MAA Notes No. 22, 3-43.<br />
Cobb, P. (1998). Theorizing about ma<strong>the</strong>matical conversations <strong>an</strong>d learning from<br />
practice. For <strong>the</strong> Learning <strong>of</strong> Ma<strong>the</strong>matics, 18(1), 46-48.<br />
Cobb, P., Gravemeijer, K. P. E., Bowers, J., & Doorm<strong>an</strong>, M. (1997). Statistical Minitools<br />
[applets <strong>an</strong>d applications]. Nashville, TN <strong>an</strong>d Utrecht, The Ne<strong>the</strong>rl<strong>an</strong>ds: V<strong>an</strong>derbilt<br />
University, TN & Freudenthal Institute, Utrecht University.<br />
Cobb, P., McClain, K., & Gravemeijer, K. P. E. (2003). Learning about statistical<br />
covariation. Cognition <strong>an</strong>d Instruction, 21(1), 1-78.<br />
College Board (2003). Adv<strong>an</strong>ced Placement Statistics course guide. New York: Author.<br />
Collins, L., Schafer, J., & Kam, C. (2001). A comparison <strong>of</strong> inclusive <strong>an</strong>d restrictive<br />
strategies in modern missing data procedures. Psychological Methods, 6, 330-351.<br />
Cronbach, L. J. (1951). Coefficient alpha <strong>an</strong>d <strong>the</strong> internal structure <strong>of</strong> tests.<br />
Psychometrika, 16, 297-333.<br />
Cronbach, L. J., & Furby, L. (1970). How should we measure ch<strong>an</strong>ge – or should we?<br />
Psychological Bulletin, 74, 68-80.<br />
Davis, F. B. (1964). Measurement <strong>of</strong> ch<strong>an</strong>ge. In F. B. Davis (Ed.), Educational<br />
measurements <strong>an</strong>d <strong>the</strong>ir interpretation (pp. 234-252). Belmont, CA: Wadsworth.<br />
Garfield, J., delMas, R., & Ch<strong>an</strong>ce, B. (n.d.). Assessment Resource Tools for Improving<br />
Statistical Thinking. Retrieved April 8, 2006.<br />
[Online: https://app.gen.umn.edu/artist/index.html]<br />
25
Gravemeijer, K. P. E. (2000, April). A rationale for <strong>an</strong> instructional sequence for<br />
<strong>an</strong>alyzing one- <strong>an</strong>d two-dimensional data sets. Paper presented at <strong>the</strong> <strong>an</strong>nual meeting<br />
<strong>of</strong> <strong>the</strong> Americ<strong>an</strong> Educational Research Association, Montreal, C<strong>an</strong>ada.<br />
Hamilton, D. L., & Gifford, R. K. (1976). Illusory correlation in interpersonal perception:<br />
A cognitive basis for stereotypic judgments. Journal <strong>of</strong> Experimental Social<br />
Psychology, 12, 392-407.<br />
Inhelder, B., & Piaget, J. (1958). The <strong>growth</strong> <strong>of</strong> logical thinking from childhood to<br />
adolescence. London: Routledge <strong>an</strong>d Keg<strong>an</strong> Paul.<br />
International Association for Statistical Education. (2005). SRTL-4 Report.<br />
[Online: http://srtl.stat.auckl<strong>an</strong>d.ac.nz/]<br />
Jennings, D., Amabile, T., & Ross, L. (1982). Informal covariation assessment: Databased<br />
versus <strong>the</strong>ory-based judgments. In D. Kahnem<strong>an</strong>, P. Slovic, & A. Tversky<br />
(Eds.), Judgment under uncertainty: Heuristics <strong>an</strong>d biases (pp. 211-230). Cambridge,<br />
Engl<strong>an</strong>d: Cambridge University Press.<br />
K<strong>an</strong>ari, Z., & Millar, R. (2004). Reasoning from data: How students collect <strong>an</strong>d interpret<br />
data in science investigations. Journal <strong>of</strong> Research in Science Teaching, 41(7), 748-<br />
769.<br />
Kao, S. F., & Wasserm<strong>an</strong>, E. A. (1993). Assessment <strong>of</strong> <strong>an</strong> information integration<br />
account <strong>of</strong> contingency judgment with examination <strong>of</strong> subjective cell import<strong>an</strong>ce <strong>an</strong>d<br />
method <strong>of</strong> information presentation. Journal <strong>of</strong> Experimental Psychology: Learning,<br />
Memory, <strong>an</strong>d Cognition, 19(6), 1363-1386.<br />
Konold, C. (1999). Issues in assessing conceptual underst<strong>an</strong>ding in probability <strong>an</strong>d<br />
statistics. Journal <strong>of</strong> Statistics Education, 3(1).<br />
[Online: http://www.amstat.org/publications/jse/v3n1/konold.html]<br />
Konold, C. (2002). Teaching concepts ra<strong>the</strong>r th<strong>an</strong> conventions. New Engl<strong>an</strong>d Journal <strong>of</strong><br />
Ma<strong>the</strong>matics, 34(2), 69-81.<br />
Konold, C., & Higgins, T. L. (2003). Reasoning about data. In J. Kilpatrick, W. G.<br />
Martin, & D. Schifter (Eds.), A research comp<strong>an</strong>ion to Principles <strong>an</strong>d St<strong>an</strong>dards for<br />
School Ma<strong>the</strong>matics (pp. 193-215). Reston, VA: National Council <strong>of</strong> Teachers <strong>of</strong><br />
Ma<strong>the</strong>matics.<br />
Koslowski, B. (1996). Theory <strong>an</strong>d evidence: The development <strong>of</strong> scientific <strong>reasoning</strong><br />
(Learning, development & conceptual ch<strong>an</strong>ge). Cambridge, MA: MIT Press.<br />
Kuhn, D., Amsel, E., & O’Loughlin, M. (1988). The development <strong>of</strong> scientific thinking<br />
skills. Orl<strong>an</strong>do, FL: Academic Press.<br />
McArdle, J. J., & Epstein, D. (1987). Latent <strong>growth</strong> curves within developmental<br />
structural equation models. Child Development, 58, 110-133.<br />
McGah<strong>an</strong>, J. R., McDougal, B., Williamson, J. D., & Pryor, P. L. (2000). The<br />
equivalence <strong>of</strong> contingency structure for intuitive covariation judgments about height,<br />
weight, <strong>an</strong>d body fat. Journal <strong>of</strong> Psychology, 134, 325-335.<br />
McKenzie, C. R. M., & Mikkelsen, L. A. (2007). A Bayesi<strong>an</strong> view <strong>of</strong> covariation<br />
assessment. Cognitive Psychology, 54, 33-61.<br />
Min, R., Vos, H., Kommers, P., & v<strong>an</strong> Dijkum, C. (2000). A concept model for learning:<br />
An attempt to define a proper relations scheme between instruction <strong>an</strong>d learning <strong>an</strong>d<br />
to establish <strong>the</strong> dynamics <strong>of</strong> learning in relation to motivation, intelligence <strong>an</strong>d studyability<br />
(‘studeerbaarheid’). Journal <strong>of</strong> Interactive Learning Research, 11(3/4), 485-<br />
506.<br />
Monk, S., & Nemirovsky, R. (1994). The case <strong>of</strong> D<strong>an</strong>: Student construction <strong>of</strong> a<br />
functional situation through visual attributes. In E. Dubinsky, J. Kaput, & A.<br />
Schoenfeld (Eds.), Research in collegiate ma<strong>the</strong>matics education: Volume 1 (pp. 139-<br />
168). Providence, RI: Americ<strong>an</strong> Ma<strong>the</strong>matics Society.<br />
26
Moritz, J. B. (2004). Reasoning about covariation. In D. Ben-Zvi, & J. Garfield (Eds.),<br />
The challenge <strong>of</strong> developing statistical literacy, <strong>reasoning</strong> <strong>an</strong>d thinking (pp. 227-<br />
256). Dordrecht, The Ne<strong>the</strong>rl<strong>an</strong>ds: Kluwer Academic Publishers.<br />
Murre, J. M. J., & Chessa, A. G. (2006). A model <strong>of</strong> learning <strong>an</strong>d forgetting II: The<br />
learning curve. Unpublished m<strong>an</strong>uscript.<br />
Nemirovsky, R. (1996). A functional approach to algebra: Two issues that emerge. In N.<br />
Dedrarg, C. Kier<strong>an</strong>, & L. Lee (Eds.), Approaches to algebra: Perspectives for<br />
research <strong>an</strong>d teaching (pp. 295-313). Boston: Kluwer Academic Publishers.<br />
Pearl, R. (1925). The biology <strong>of</strong> population <strong>growth</strong>. New York: Knopf.<br />
Pinheiro, J., & Bates, D. (2000). Mixed-effects models in S <strong>an</strong>d S-PLUS. New York:<br />
Springer Verlag.<br />
Pinheiro, J., Bates, D., DebRoy, S., & Sarkar, D. (2005). nlme: Linear <strong>an</strong>d nonlinear<br />
mixed effects models. R package version 3.1-66.<br />
R Development Core Team. (2008). R: A l<strong>an</strong>guage <strong>an</strong>d environment for statistical<br />
computing. Vienna, Austria: R Foundation for Statistical Computing.<br />
[Online: http://www.R-project.org]<br />
Raudenbush, S. W., & Bryk, A. S. (2002). Hierarchical linear models: Applications <strong>an</strong>d<br />
data <strong>an</strong>alysis methods. Thous<strong>an</strong>d Oaks, CA: Sage Publications, Inc.<br />
Ross, J. A., & Cousins, J. B. (1993). Patterns <strong>of</strong> student <strong>growth</strong> in <strong>reasoning</strong> about<br />
correlational problems. Journal <strong>of</strong> Educational Psychology, 85(1), 49-65.<br />
Sánchez, F. T. (1999). Significado de la correlación y regression para los estudi<strong>an</strong>tes<br />
universitarios [Me<strong>an</strong>ings <strong>of</strong> correlation <strong>an</strong>d regression for undergraduates].<br />
Unpublished doctoral dissertation, University <strong>of</strong> Gr<strong>an</strong>ada, Spain.<br />
Schauble, L. (1996). The development <strong>of</strong> scientific <strong>reasoning</strong> in knowledge-rich contexts.<br />
Developmental Psychology, 32(1), 102-119.<br />
Siegler, R. S. (2000). The rebirth <strong>of</strong> children’s learning. Child Development, 71(1), 26-<br />
35.<br />
Singer, J. D., & Willett, J. B. (2003). Applied longitudinal data <strong>an</strong>alysis. New York:<br />
Oxford University Press.<br />
Thompson, P. W. (1994). Images <strong>of</strong> rate <strong>an</strong>d operational underst<strong>an</strong>ding <strong>of</strong> <strong>the</strong><br />
fundamental <strong>the</strong>orem <strong>of</strong> calculus. Educational Studies in Ma<strong>the</strong>matics, 26, 229-274.<br />
Thurston, L. L. (1919). The learning curve equation. Psychological Monographs, 26(3),<br />
1-51.<br />
Trur<strong>an</strong>, J. M. (1997). Underst<strong>an</strong>ding <strong>of</strong> association <strong>an</strong>d regression by first year economics<br />
students from two different countries as revealed in responses to <strong>the</strong> same<br />
examination questions. In J. Garfield, & J. M. Trur<strong>an</strong> (Eds.), Research papers on<br />
stochastics educations from 1997 (pp. 205-212). Minneapolis, MN: University <strong>of</strong><br />
Minnesota.<br />
United States Department <strong>of</strong> Education. (2005). Raising achievement: A new path for No<br />
Child Left Behind. News Release.<br />
[Online: http://www.ed.gov/policy/elsec/guid/raising/new-path-long.html]<br />
Valverde, G. A., Bi<strong>an</strong>chi, L. J., Wolfe, R. G., Schmidt, W. H., & Hou<strong>an</strong>g, R. T. (2002).<br />
According to <strong>the</strong> Book. Using TIMSS to investigate <strong>the</strong> tr<strong>an</strong>slation <strong>of</strong> policy into<br />
practice through <strong>the</strong> world <strong>of</strong> textbooks. Dordrecht: Kluwer Academic Publishers.<br />
Verbeke, G, & Molenberghs, G. (2000). Linear mixed models for longitudinal data. New<br />
York: Springer Verlag.<br />
Wavering, M. J. (1989). Logical <strong>reasoning</strong> necessary to make line graphs. Journal <strong>of</strong><br />
Research in Science Teaching, 26(5), 373-379.<br />
Willett, J. (1989a). Questions <strong>an</strong>d <strong>an</strong>swers in <strong>the</strong> measurement <strong>of</strong> ch<strong>an</strong>ge. Review <strong>of</strong><br />
Research in Education, 15, 345-422.<br />
27
28<br />
Willett, J. B. (1989b). Some results on reliability for <strong>the</strong> longitudinal measurement <strong>of</strong><br />
ch<strong>an</strong>ge: Implications for <strong>the</strong> design <strong>of</strong> studies <strong>of</strong> individual <strong>growth</strong>. Educational <strong>an</strong>d<br />
Psychological Measurement, 49, 587–602.<br />
Willet, J. B., Singer, J. D., & Martin, N. C. (1998). The design <strong>an</strong>d <strong>an</strong>alysis <strong>of</strong><br />
longitudinal studies <strong>of</strong> development <strong>an</strong>d psychopathology in context: Statistical<br />
models <strong>an</strong>d methodological recommendations. Development <strong>an</strong>d Psychopathology,<br />
10, 395-426.<br />
Wixted, J. T. (2004). The psychology <strong>an</strong>d neuroscience <strong>of</strong> forgetting. Annual Review <strong>of</strong><br />
Psychology, 55, 235-269.<br />
Wozniak, P. A. (1990). Optimization <strong>of</strong> learning. Unpublished master’s <strong>the</strong>sis, Pozn<strong>an</strong><br />
University <strong>of</strong> Technology. Pozn<strong>an</strong>, Pol<strong>an</strong>d.<br />
Zieffler, A. (2006). A longitudinal investigation <strong>of</strong> <strong>the</strong> development <strong>of</strong> college students’<br />
<strong>reasoning</strong> about bivariate data <strong>during</strong> <strong>an</strong> introductory statistics course. Unpublished<br />
doctoral dissertation, University <strong>of</strong> Minnesota.<br />
Zimmerm<strong>an</strong>, C. (2005). The development <strong>of</strong> scientific <strong>reasoning</strong>: What psychologists<br />
contribute to <strong>an</strong> underst<strong>an</strong>ding <strong>of</strong> elementary science learning. Paper commissioned<br />
by <strong>the</strong> National Academies <strong>of</strong> Science (National Research Council’s Board <strong>of</strong><br />
Science Education, Consensus Study on Learning Science, Kindergarten through<br />
Eighth Grade).<br />
[Online: www7.nationalacademies.org/bose/Corrine_Zimmerm<strong>an</strong>_Final_Paper.pdf]<br />
ANDREW S. ZIEFFLER<br />
Educational Psychology<br />
206 Burton Hall<br />
178 Pillsbury Dr. SE<br />
Minneapolis, MN 55455
29<br />
APPENDIX<br />
Bivariate Reasoning Assessment (BR) [ARTIST Qu<strong>an</strong>titative Bivariate Data Scale]<br />
1. Sam is interested in bird nest construction, <strong>an</strong>d finds a correlation <strong>of</strong> 0.82 between <strong>the</strong> depth<br />
<strong>of</strong> a bird nest (in inches) <strong>an</strong>d <strong>the</strong> width <strong>of</strong> <strong>the</strong> bird nest (in inches) at its widest point. Sue, a<br />
classmate <strong>of</strong> Sam, is also interested in looking at bird nest construction, <strong>an</strong>d measures <strong>the</strong><br />
same variables on <strong>the</strong> same bird nests that Sam does, except she does her measurements in<br />
centimeters, instead <strong>of</strong> inches. What should her correlation be?<br />
a. Sue’s correlation should be 1, because it will match Sam's exactly.<br />
b. Sue’s correlation would be 1.64(.82) = 1.3448, because you need to ch<strong>an</strong>ge <strong>the</strong> units<br />
from inches to centimeters <strong>an</strong>d 1 inch = 1.64 centimeters.<br />
c. Sue’s correlation would be about 0.82, <strong>the</strong> same as Sam’s.<br />
2. A student was studying <strong>the</strong> relationship between how much money students spend on food<br />
<strong>an</strong>d on entertainment per week. Based on a sample size <strong>of</strong> 270, he calculated a correlation<br />
coefficient (r) <strong>of</strong> 0.013 for <strong>the</strong>se two variables. Which <strong>of</strong> <strong>the</strong> following is <strong>an</strong> appropriate<br />
interpretation?<br />
a. This low correlation <strong>of</strong> 0.013 indicates <strong>the</strong>re is no relationship.<br />
b. There is no linear relationship but <strong>the</strong>re may be a nonlinear relationship.<br />
c. This correlation indicates <strong>the</strong>re is some type <strong>of</strong> linear relationship.<br />
3. A r<strong>an</strong>dom sample <strong>of</strong> 25 Real Estate listings for houses in <strong>the</strong> Nor<strong>the</strong>ast section <strong>of</strong> a large<br />
city was selected from <strong>the</strong> city newspaper. A correlation coefficient <strong>of</strong> -0.80 was found<br />
between <strong>the</strong> age <strong>of</strong> a house <strong>an</strong>d its list price. Which <strong>of</strong> <strong>the</strong> following statements is <strong>the</strong> best<br />
interpretation <strong>of</strong> this correlation?<br />
a. Older houses tend to cost more money th<strong>an</strong> newer houses.<br />
b. Newer houses tend to cost more money th<strong>an</strong> older houses.<br />
c. Older houses are worth more because <strong>the</strong>y were built with higher quality materials<br />
<strong>an</strong>d labor.<br />
d. New houses cost more because supplies <strong>an</strong>d labor are more expensive today.<br />
For items 4 <strong>an</strong>d 5, select <strong>the</strong> scatterplot that shows:<br />
4. A correlation <strong>of</strong> about 0.60.<br />
a. a<br />
b. b<br />
c. c<br />
d. d<br />
e. e<br />
5. The strongest relationship between <strong>the</strong> X <strong>an</strong>d Y variables.<br />
a. a<br />
b. b<br />
c. a <strong>an</strong>d b<br />
d. a <strong>an</strong>d d<br />
e. a, b, <strong>an</strong>d d
Dr. Jones gave students in her class a pretest about statistical concepts. After teaching about<br />
hypo<strong>the</strong>ses tests, she <strong>the</strong>n gave <strong>the</strong>m a posttest about statistical concepts. Dr. Jones is interested in<br />
determining if <strong>the</strong>re is a relationship between pretest <strong>an</strong>d posttest scores, so she constructed <strong>the</strong><br />
following scatterplot <strong>an</strong>d calculated <strong>the</strong> correlation coefficient.<br />
30
31<br />
6. Locate <strong>the</strong> point that shows a pretest score <strong>of</strong> 107. This point, which represents John's<br />
scores, is actually incorrect. If John’s scores are removed from <strong>the</strong> data set, how would <strong>the</strong><br />
correlation coefficient be affected?<br />
a. The value <strong>of</strong> <strong>the</strong> correlation would decrease.<br />
b. The value <strong>of</strong> <strong>the</strong> correlation would increase.<br />
c. The value <strong>of</strong> <strong>the</strong> correlation would stay <strong>the</strong> same.<br />
7. It turns out that John’s pretest score was actually 5, <strong>an</strong>d his posttest score was 100. If this<br />
correction is made to <strong>the</strong> data file <strong>an</strong>d a new correlation coefficient is calculated, how<br />
would you expect this correlation to compare to <strong>the</strong> original correlation?<br />
a. The absolute value <strong>of</strong> <strong>the</strong> new correlation would be smaller th<strong>an</strong> <strong>the</strong> absolute value <strong>of</strong><br />
<strong>the</strong> original correlation.<br />
b. The absolute value <strong>of</strong> <strong>the</strong> new correlation would be larger th<strong>an</strong> <strong>the</strong> absolute value <strong>of</strong><br />
<strong>the</strong> original correlation.<br />
c. The absolute value <strong>of</strong> <strong>the</strong> new correlation would be <strong>the</strong> same as <strong>the</strong> absolute value <strong>of</strong><br />
<strong>the</strong> original correlation.<br />
d. It is impossible to predict how <strong>the</strong> correlation would ch<strong>an</strong>ge.<br />
8. A statistics instructor w<strong>an</strong>ts to use <strong>the</strong> number <strong>of</strong> hours studied to predict exam scores in his<br />
class. He w<strong>an</strong>ts to use a linear regression model. Data from previous years shows that <strong>the</strong><br />
average number <strong>of</strong> hours studying for a final exam in statistics is 8.5 hours, with a st<strong>an</strong>dard<br />
deviation <strong>of</strong> 1.5 hours, <strong>an</strong>d <strong>the</strong> average exam score is 75, with a st<strong>an</strong>dard deviation <strong>of</strong> 15.<br />
The correlation is 0.76. Should <strong>the</strong> instructor use linear regression to predict exam scores<br />
from hours studied?<br />
a. Yes, <strong>the</strong>re is a high correlation, so it is alright to use linear regression.<br />
b. Yes, because linear regression is <strong>the</strong> statistical method used to make predictions when<br />
you have bivariate qu<strong>an</strong>titative data.<br />
c. Linear regression could be appropriate if <strong>the</strong> scatterplot shows a clear linear<br />
relationship.<br />
d. No, because <strong>the</strong>re is no way to prove that more hours <strong>of</strong> study causes higher exam<br />
scores.