Tutorial 1 - The Department of Statistics and Applied Probability, NUS
Tutorial 1 - The Department of Statistics and Applied Probability, NUS
Tutorial 1 - The Department of Statistics and Applied Probability, NUS

You also want an ePaper? Increase the reach of your titles
YUMPU automatically turns print PDFs into web optimized ePapers that Google loves.
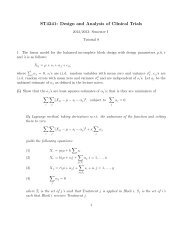
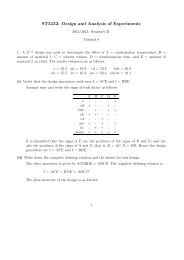
ST3232: Design <strong>and</strong> Analysis <strong>of</strong> Experiments<br />
2012/2013: Semester II<br />
<strong>Tutorial</strong> 1<br />
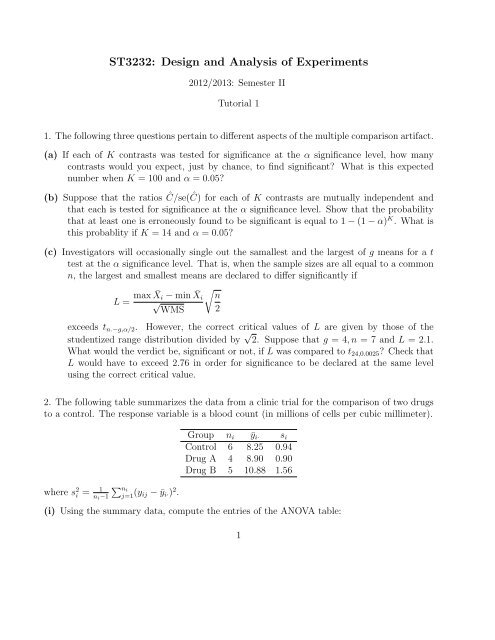
1. <strong>The</strong> following three questions pertain to different aspects <strong>of</strong> the multiple comparison artifact.<br />
(a) If each <strong>of</strong> K contrasts was tested for significance at the α significance level, how many<br />
contrasts would you expect, just by chance, to find significant? What is this expected<br />
number when K = 100 <strong>and</strong> α = 0.05?<br />
(b) Suppose that the ratios Ĉ/se(Ĉ) for each <strong>of</strong> K contrasts are mutually independent <strong>and</strong><br />
that each is tested for significance at the α significance level. Show that the probability<br />
that at least one is erroneously found to be significant is equal to 1 − (1 − α) K . What is<br />
this probablity if K = 14 <strong>and</strong> α = 0.05?<br />
(c) Investigators will occasionally single out the samallest <strong>and</strong> the largest <strong>of</strong> g means for a t<br />
test at the α significance level. That is, when the sample sizes are all equal to a common<br />
n, the largest <strong>and</strong> smallest means are declared to differ significantly if<br />
L = max ¯X i − min ¯X √<br />
√ i n<br />
WMS 2<br />
exceeds t n·−g,α/2. However, the correct critical values <strong>of</strong> L are given by those <strong>of</strong> the<br />
studentized range distribution divided by √ 2. Suppose that g = 4, n = 7 <strong>and</strong> L = 2.1.<br />
What would the verdict be, significant or not, if L was compared to t 24,0.0025 ? Check that<br />
L would have to exceed 2.76 in order for significance to be declared at the same level<br />
using the correct critical value.<br />
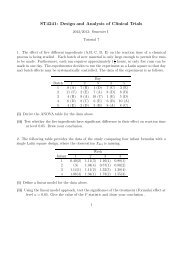
2. <strong>The</strong> following table summarizes the data from a clinic trial for the comparison <strong>of</strong> two drugs<br />
to a control. <strong>The</strong> response variable is a blood count (in millions <strong>of</strong> cells per cubic millimeter).<br />
∑<br />
where s 2 i = 1 ni<br />
n i −1 j=1 (y ij − ȳ i·) 2 .<br />
Group n i ȳ i· s i<br />
Control 6 8.25 0.94<br />
Drug A 4 8.90 0.90<br />
Drug B 5 10.88 1.56<br />
(i) Using the summary data, compute the entries <strong>of</strong> the ANOVA table:<br />
1
Source df SS MS F-ratio<br />
Drug<br />
Error<br />
Total<br />
(ii) Conduct an appropriate test for the null hypothesis that there is no difference in the effects<br />
<strong>of</strong> the three drugs at level α = 0.05.<br />
(iii) Using an appropriate multiple comparison method, test whether or not each <strong>of</strong> Drug A<br />
<strong>and</strong> Drug B is significantly different from the control drug at level α = 0.05.<br />
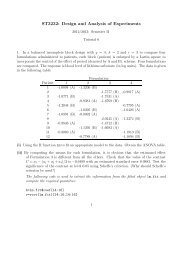
3. Consider the following summary data for the yield <strong>of</strong> tomatoes (kg/plot) for four different<br />
levels <strong>of</strong> salinity; salinity level here refers to electrical conductivity (EC), where the chosen<br />
levels were EC = 1.6, 3.8, 6.0, <strong>and</strong> 10.2 nmhos/cm:<br />
EC levels: 1.6 3.8 6.0 10.2<br />
# <strong>of</strong> observations: 4 4 4 4<br />
mean: 59.53 55.4 50.85 45.5<br />
sd: 3.232 2.665 2.426 2.901<br />
Assume the true mean yield tomatoes for the specified levels <strong>of</strong> salinity are µ 1 , µ 2 , µ 3 <strong>and</strong> µ 4<br />
respectively.<br />
(i) Calculate the AVOVA F -statistic <strong>and</strong> conclude whether it is significant at level 0.05, using<br />
the information provided in the question.<br />
(ii) Using an appropriate multiple comparison method, conclude whether or not any <strong>of</strong> the<br />
pairwise differences µ i − µ j , i, j = 1, . . . , 4, i ≠ j is statistically significant at level 0.05.<br />
If yes, what are those pairwise differences?<br />
(iii) Construct s 95% conficence interval for the contrast: µ 1 − µ 2+µ 3 +µ 4<br />
3<br />
.<br />
4. Lysozyme levels in the gastric juice <strong>of</strong> 29 patients with peptic ulcer <strong>and</strong> <strong>of</strong> 30 normal controls<br />
are given below.<br />
Patient group:<br />
0.2 0.3 0.4 1.1 2.0 2.1 3.3 3.8 4.5 4.8 4.9 5.0 5.3 7.5 9.8 10.4<br />
10.9 11.3 12.4 16.2 17.6 18.9 20.7 24.0 25.4 40.0 42.2 50.0 60.0<br />
2
Normal group:<br />
0.2 0.3 0.4 0.7 1.2 1.5 1.5 1.9 2.0 2.4 2.5 2.83.6 4.8 4.8 5.4 5.7<br />
5.8 7.5 8.7 8.8 9.1 10.3 15.6 16.1 16.5 16.7 20.0 20.7 33.0<br />
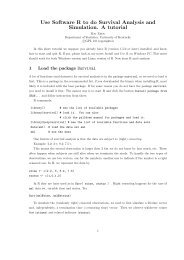
(i) Using R, compute the ANOVA table for the above data.<br />
(ii) Carry out a residual analysis to see whether the assumptions <strong>of</strong> constant variance <strong>and</strong><br />
normality are valid for the data.<br />
3