ST4241: Design and Analysis of Clinical Trials - The Department of ...
ST4241: Design and Analysis of Clinical Trials - The Department of ...
ST4241: Design and Analysis of Clinical Trials - The Department of ...

Create successful ePaper yourself
Turn your PDF publications into a flip-book with our unique Google optimized e-Paper software.
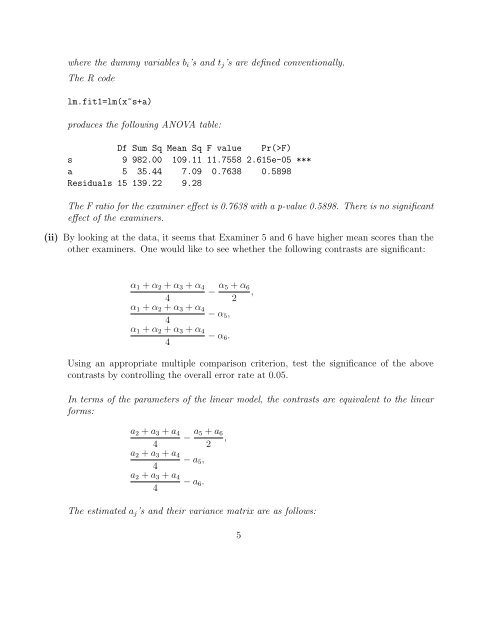
where the dummy variables b i ’s <strong>and</strong> t j ’s are defined conventionally.<br />
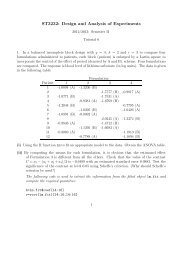
<strong>The</strong> R code<br />
lm.fit1=lm(x~s+a)<br />
produces the following ANOVA table:<br />
Df Sum Sq Mean Sq F value Pr(>F)<br />
s 9 982.00 109.11 11.7558 2.615e-05 ***<br />
a 5 35.44 7.09 0.7638 0.5898<br />
Residuals 15 139.22 9.28<br />
<strong>The</strong> F ratio for the examiner effect is 0.7638 with a p-value 0.5898. <strong>The</strong>re is no significant<br />
effect <strong>of</strong> the examiners.<br />
(ii) By looking at the data, it seems that Examiner 5 <strong>and</strong> 6 have higher mean scores than the<br />
other examiners. One would like to see whether the following contrasts are significant:<br />
α 1 + α 2 + α 3 + α 4<br />
4<br />
α 1 + α 2 + α 3 + α 4<br />
4<br />
α 1 + α 2 + α 3 + α 4<br />
4<br />
− α 5 + α 6<br />
,<br />
2<br />
− α 5 ,<br />
− α 6 .<br />
Using an appropriate multiple comparison criterion, test the significance <strong>of</strong> the above<br />
contrasts by controlling the overall error rate at 0.05.<br />
In terms <strong>of</strong> the parameters <strong>of</strong> the linear model, the contrasts are equivalent to the linear<br />
forms:<br />
a 2 + a 3 + a 4<br />
4<br />
a 2 + a 3 + a 4<br />
4<br />
a 2 + a 3 + a 4<br />
4<br />
− a 5 + a 6<br />
,<br />
2<br />
− a 5 ,<br />
− a 6 .<br />
<strong>The</strong> estimated a j ’s <strong>and</strong> their variance matrix are as follows:<br />
5