4 Comparison of the ALMA and Herschel - ESO
4 Comparison of the ALMA and Herschel - ESO
4 Comparison of the ALMA and Herschel - ESO

Create successful ePaper yourself
Turn your PDF publications into a flip-book with our unique Google optimized e-Paper software.
In DRSP contribution 2.1.2, Kinetics, Density <strong>and</strong> Temperature Pr<strong>of</strong>i le in Pre-Stellar Cores, it is<br />
planned to measure <strong>the</strong> J = 2-1 transitions in carbon monoxide, CO, <strong>and</strong> isotopes, <strong>and</strong> <strong>the</strong> J = 1-0<br />
transition <strong>of</strong> H 2<br />
D + , as well as broadb<strong>and</strong> continuum. Measurements <strong>of</strong> <strong>the</strong> H 2<br />
D + molecule are<br />
interesting since this appears not to deplete onto grains at high H 2<br />
densities. The sources are 160<br />
pc from <strong>the</strong> Sun, so <strong>the</strong> 1” angular resolution corresponds to 2.3 x 10 15 cm, or 160 Astronomical<br />
Units. In addition to interferometer data, results from <strong>the</strong> ACA <strong>and</strong> single telescopes are required.<br />
The peak line temperatures will be ~3 K for C 18 O, 5 K for 13 CO <strong>and</strong> 0.1 to 1 K for H 2<br />
D + . For<br />
<strong>the</strong> optically thin line <strong>of</strong> C 18 O, over a wide range <strong>of</strong> densities <strong>and</strong> kinetic temperatures, <strong>the</strong> rms<br />
noise in a spectral channel gives a limit to <strong>the</strong> H 2<br />
column density <strong>of</strong> 4 x 10 21 cm -2 . The rms noise<br />
in continuum measurements is 5 mJy beam -1 . This RMS noise gives an H 2<br />
column density <strong>of</strong><br />
5 x 10 20 cm -2 if <strong>the</strong> dust temperature is 10 K. Since <strong>the</strong> J = 1-0 transition <strong>of</strong> H 2<br />
D + , is absorbed in<br />
<strong>the</strong> atmosphere <strong>of</strong> <strong>the</strong> Earth, 100 hours are needed for <strong>the</strong>se measurements, while 25 hours are<br />
needed for measurements <strong>of</strong> <strong>the</strong> CO transitions.<br />
For both DRSP programmes, <strong>the</strong> absolute calibration accuracy should be better than 10% for<br />
continuum <strong>and</strong> spectral line measurements. The repeatability should be 3% <strong>and</strong> <strong>the</strong> relative<br />
calibration between receiver b<strong>and</strong>s 3%.<br />
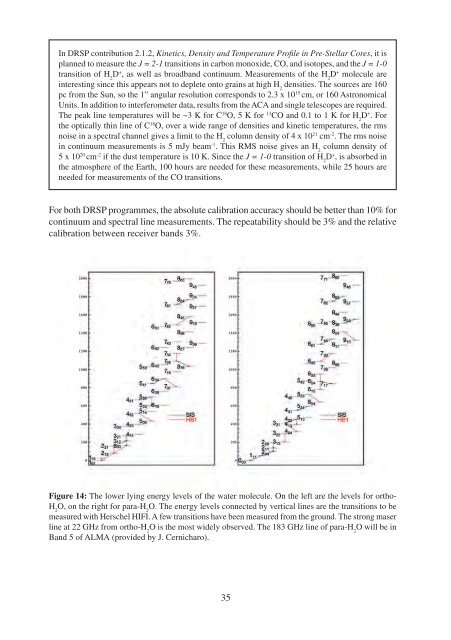
Figure 14: The lower lying energy levels <strong>of</strong> <strong>the</strong> water molecule. On <strong>the</strong> left are <strong>the</strong> levels for ortho-<br />
H 2<br />
O, on <strong>the</strong> right for para-H 2<br />
O. The energy levels connected by vertical lines are <strong>the</strong> transitions to be<br />
measured with <strong>Herschel</strong> HIFI. A few transitions have been measured from <strong>the</strong> ground. The strong maser<br />
line at 22 GHz from ortho-H 2<br />
O is <strong>the</strong> most widely observed. The 183 GHz line <strong>of</strong> para-H 2<br />
O will be in<br />
B<strong>and</strong> 5 <strong>of</strong> <strong>ALMA</strong> (provided by J. Cernicharo).<br />
35