Hydraulic Impacts of Quarries and Gravel Pits - Goodhue County
Hydraulic Impacts of Quarries and Gravel Pits - Goodhue County
Hydraulic Impacts of Quarries and Gravel Pits - Goodhue County

You also want an ePaper? Increase the reach of your titles
YUMPU automatically turns print PDFs into web optimized ePapers that Google loves.
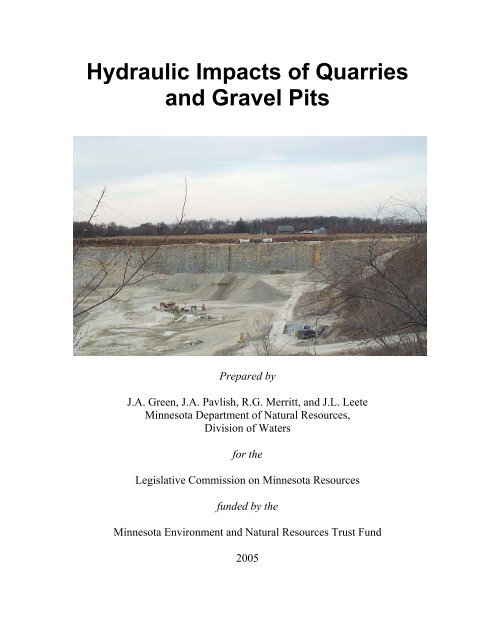
<strong>Hydraulic</strong> <strong>Impacts</strong> <strong>of</strong> <strong>Quarries</strong><br />
<strong>and</strong> <strong>Gravel</strong> <strong>Pits</strong><br />
Prepared by<br />
J.A. Green, J.A. Pavlish, R.G. Merritt, <strong>and</strong> J.L. Leete<br />
Minnesota Department <strong>of</strong> Natural Resources,<br />
Division <strong>of</strong> Waters<br />
for the<br />
Legislative Commission on Minnesota Resources<br />
funded by the<br />
Minnesota Environment <strong>and</strong> Natural Resources Trust Fund<br />
2005
Table <strong>of</strong> Contents<br />
Page<br />
Executive Summary…...…………………………………………………………………1<br />
I. Research Sections<br />
1. Scope <strong>of</strong> the Issue……………………………………………………………..………3<br />
2. Study Design…………………………………………………………………………..9<br />
3. Kraemer Quarry—Prairie du Chien Limestone………….………..…………………29<br />
4. Golberg Quarry—Prairie du Chien Limestone………………………………………35<br />
5. Spinler Quarry—Galena Limestone…………………...…………………………….41<br />
6. Fountain Quarry—Galena Limestone…………….………………………………….47<br />
7. Harmony Big Spring Quarry—Galena Limestone…………………………………..53<br />
8. Donovan Pit—Alluvial S<strong>and</strong> <strong>and</strong> <strong>Gravel</strong>…………………...………………………..57<br />
9. Leitzen-Grabau Pit—Alluvial S<strong>and</strong> <strong>and</strong> <strong>Gravel</strong>………….………………………….67<br />
10. Felton Pit—Beach Ridge S<strong>and</strong> <strong>and</strong> <strong>Gravel</strong>……………..……………………………69<br />
II. Outcomes Sections<br />
1. Conclusions………………………..……………………………………..……….….81<br />
2. Recommendations to Local Government Units for <strong>Quarries</strong> <strong>and</strong> <strong>Pits</strong>……………….83<br />
III. Appendices<br />
1. Sampling <strong>and</strong> Data Collection Methods…………………………………..…………..3<br />
2. Three-Dimensional Characterization <strong>of</strong> the Spinler Quarry………………………....17<br />
3. Glossary……………………………………………..……………………………….33<br />
4. List <strong>of</strong> References…………………………………………………………………....35<br />
Acknowledgements<br />
Funding provided by the Minnesota Environment <strong>and</strong> Natural Resources Trust Fund as<br />
recommended by the Legislative Commission on Minnesota Resources. Assistance for the project<br />
was provided by the following project partners:<br />
• Aggregate Industries<br />
• Roverud Construction <strong>of</strong> Spring Grove, Minnesota<br />
• City <strong>of</strong> Harmony Volunteer Fire Department<br />
• Crane Creek Construction <strong>of</strong> Owatonna, Minnesota<br />
• Kraemer <strong>and</strong> Sons <strong>of</strong> Plain, Wisconsin<br />
• Leitzen Concrete <strong>of</strong> Rochester, Minnesota<br />
• Minnesota Geological Survey, University <strong>of</strong> Minnesota<br />
• Milestone Materials Division <strong>of</strong> Mathy Construction, Onalaska, Wisconsin<br />
• Pederson Brothers Construction <strong>of</strong> Harmony, Minnesota<br />
• Salem Township, Olmsted <strong>County</strong>, Minnesota<br />
• University <strong>of</strong> Minnesota, Geology <strong>and</strong> Geophysics Department, Hydrogeochemistry Lab<br />
We appreciate the efforts <strong>of</strong> Tim Schlagenhaft, Jon Ellingson, <strong>and</strong> DNR Waters’ staff in St. Paul<br />
who provided peer review <strong>of</strong> the report, as well as Nick Kroska, who edited the report.
List <strong>of</strong> Tables <strong>and</strong> Figures<br />
Page<br />
Executive Summary<br />
Figure 1. Site map………………………………………………………………….………………2<br />
Table 1. Summary table <strong>of</strong> sites <strong>and</strong> impacts studied………………………………….…………..3<br />
Figure 2. The impacts on ground-water levels <strong>of</strong> drawdown at Kraemer Quarry………………....4<br />
Figure 3. Monitoring showed slight turbidity increases after blasting at Fountain………………..5<br />
Figure 4. Temperature monitoring <strong>of</strong> water at Big Spring Quarry in Harmony…………………...6<br />
Figure 5. Donovan pit mining with a hydraulic dredge…………………………………………....7<br />
Figure 6. Water level measurements, well nest 1, Donovan Pit…………………………………...7<br />
I. Research Sections<br />
Figure 1.1. The extent <strong>of</strong> dewatering………………………………………………………………3<br />
Figure 1.2. Carbonate rock (limestone <strong>and</strong> dolostone) areas <strong>of</strong> Minnesota; quarries are present in<br />
the red <strong>and</strong> yellow areas……………………………………………………………………………4<br />
Figure 2.1. Site location map……………………………………………………………………....9<br />
Table 2.1. Summary table <strong>of</strong> sites <strong>and</strong> impacts studied…………………………………………..10<br />
Figure 2.2. Kraemer quarry site photograph……………………………………………………...12<br />
Figure 2.3. Precipitation data 2001–2005 near Kraemer Quarry…………………………………13<br />
Figure 2.4. Golberg quarry site photograph………………………………………………………14<br />
Figure 2.5. Precipitation data 2001–2005 near Golberg quarry…………………………………..15<br />
Figure 2.6. Spinler quarry site photograph……………………………………………………….16<br />
Figure 2.7. Precipitation data 2001–2005 near Spinler quarry…………………………………...17<br />
Figure 2.8. Fountain quarry site photograph……………………………………………………...18<br />
Figure 2.9. Precipitation data 2001–2005 near Fountain quarry………………………………….19<br />
Figure 2.10. Big Springs quarry site photograph (2003)………………………………………....20<br />
Figure 2.11. Big Spring East, the main discharge point in the eastern part <strong>of</strong> the quarry………..21<br />
Figure 2.12. Precipitation data 2001–2005 near Big Spring quarry……………………………...22<br />
Figure 2.13. Donovan pit site photograph………………………………………………………..23<br />
Figure 2.14. Precipitation data 2001–2005 near Donovan pit……………………………………24<br />
Figure 2.15. Leitzen-Grabau pit site photograph…………………………………………………25<br />
Figure 2.16. Precipitation data 2001–2005 near Leitzen-Grabau pit……………………………..26<br />
Figure 2.17. Felton pit site photograph…………………………………………………………...27<br />
Figure 3.1. Site by aerial photograph……………………………………………………………..29<br />
Figure 3.2. Seasonal variation <strong>of</strong> water levels in Kraemer quarry wells…………………………30<br />
Figure 3.3. Historic water levels in Kraemer quarry……………………………………………...30<br />
Figure 3.4. Water levels at drawdown in Kraemer quarry wells…………………………………31<br />
Figure 3.5. Comparison <strong>of</strong> water levels <strong>and</strong> turbidity in Kraemer quarry wells………………….32<br />
Figure 4.1. Site by aerial photograph…………………………………………………….……….35<br />
Figure 4.2. Seasonal variation <strong>of</strong> water levels in Golberg quarry wells………………………….36<br />
Figure 4.3. <strong>Impacts</strong> <strong>of</strong> blasting on water levels in Golberg quarry wells…………………..…….37<br />
Figure 4.4. Historic water levels in Golberg Quarry………………………………………….…..38<br />
Figure 5.1. Site by aerial photograph……………………………………………………………..41<br />
Figure 5.2. Seasonal variation <strong>of</strong> water levels in Spinler well nest 1…………………………….42<br />
Figure 5.3. Seasonal variation <strong>of</strong> water levels in Spinler well nest 2…………………………….43<br />
Figure 5.4. Seasonal variation <strong>of</strong> water levels in Spinler well nest 3…………………………….43<br />
Figure 5.5. Water levels at drawdown in Spinler quarry wells…………………………………...44<br />
Figure 5.6. Water levels in Spinler quarry, 2005………………………………………………....45<br />
Figure 5.7. Historic water levels in upper aquifer, Spinler Quarry……………………………….46
Figure 6.1. Site by aerial photograph……………………………………………………………..47<br />
Figure 6.2. Fountain Big Spring………………………………………………………………….48<br />
Figure 6.3. Fountain Big Spring turbidity after November 4, 2002 blast………………………...49<br />
Figure 6.4. Fountain Big Spring turbidity after October 5, 2004 blast……………………...……50<br />
Figure 6.5. Fountain Big Spring turbidity response to rain……………………………………....51<br />
Figure 7.1. Site by aerial photograph……………………………………………………………..53<br />
Figure 7.2. Springshed dye trace map……………………………………………………...……..54<br />
Figure 7.3. Temperature (degrees Celsius) monitoring results……………………………...……55<br />
Figure 8.1. Site by aerial photograph……………………………………………………….…….57<br />
Figure 8.2. Floodwaters in the Donovan Pit in 2003……………………………………….…….58<br />
Figure 8.3. Ground-water levels in the Donovan pit………………………………………….….59<br />
Figure 8.4a. Water levels, nest 1………………………………………………………………….60<br />
Figure 8.4b. Water levels, nest 2…………………………………………………………….……60<br />
Figure 8.4c. Water levels, nest 3……………………………………………………………...…..61<br />
Figure 8.4d. Water levels, nest 4……………………………………………………………….....61<br />
Figure 8.5. Fluctuations in ground-water temperatures………………………………………..…63<br />
Figure 8.6. Trench 1, dye injection point…………………………………………………...…….63<br />
Figure 8.7. Trench 1 (left) <strong>and</strong> trench 2 (right) dye sampling point………………………….…..64<br />
Figure 8.8. Breakthrough curve for the dye trace…………………………………………….…..65<br />
Figure 8.9. H<strong>and</strong>held fluorometer…………………………………………………………….…..66<br />
Figure 9.1. Site by aerial photograph…………………………………………………….……….67<br />
Figure 9.2. Depth to water in Leitzen-Grabau wells……………………………………...………68<br />
Figure 10.1. Site by aerial photograph………………………………………………………..…..69<br />
Figure 10.2. Locations <strong>of</strong> cross sections in the Felton pit area……………………………...……71<br />
Figure 10.3. Geologic cross section along a trace between the North Fen <strong>and</strong> the Trust Fund<br />
<strong>Gravel</strong> Pit……………………………………………………………………………………..…..72<br />
Figure 10.4. Geologic cross section along a trace from the South Fen to the height <strong>of</strong> the beach<br />
ridge south <strong>of</strong> the Trust Fund Pit……………………………………………………………...….73<br />
Figure 10.5. Ground-water flow paths (blue) prior to mining…………………………...……….74<br />
Figure 10.6. Ground-water flow paths (blue) during mining………………………………...…...75<br />
Figure 10.7. Vertical gradient at North Fen………………………………………………………76<br />
Figure 10.8. Vertical gradient at South Fen………………………………………………………77<br />
II. Outcomes Sections<br />
III. Appendices<br />
Appendix 1. Sampling <strong>and</strong> Data Collection Methods<br />
Figure 1. Steel tape…………………………………………………………………………..…….3<br />
Figure 2. Electronic water level meter……………………………………………………….…….4<br />
Figure 3. Water level measuring at a wellhead…………………………………………………….5<br />
Figure 4. Climate monitoring equipment…………………………………………………………..6<br />
Figure 5. Introducing dye into the stream <strong>of</strong> water………………………………………………...8<br />
Figure 6. Sampling materials………………………………………………………………………9<br />
Figure 7. Water level <strong>and</strong> turbidity before <strong>and</strong> after a blast at Kraemer quarry………………….11<br />
Figure 8. Turbidity readings from a blasting event at Fountain quarry…………………………..12<br />
Figure 9. Storm induced turbidity response (2004)………………………………………………13<br />
Figure 10. Storm induced turbidity response (2003)…………………..…………………………13<br />
Figure 11. Thermochron digital recording thermometer compared with a nickel………………..15
Appendix 2. Three-Dimensional Characterization <strong>of</strong> the Spinler Quarry<br />
Figure 1…………………………………………………………………………………………...18<br />
Figure 2…………………………………………………………………………………………...19<br />
Figure 3…………………………………………………………………………………………...20<br />
Figure 4a………………………………………………………………………………………….21<br />
Figure 4b………………………………………………………………………………………….21<br />
Figure 5…………………………………………………………………………………………...23<br />
Figure 6a………………………………………………………………………………………….24<br />
Figure 6b………………………………………………………………………………………….24<br />
Figure 7…………………………………………………………………………………………...25<br />
Figure 8a………………………………………………………………………………………….26<br />
Figure 8b………………………………………………………………………………………….26<br />
Figure 9…………………………………………………………………………………………...27<br />
Figure 10a………………………………………………………………………………………...28<br />
Figure 10b………………………………………………………………………………………...28<br />
Figure 11………………………………………………………………………………………….29<br />
Figure 12……………………………………………………………………………………….…30<br />
Figure 13. (vertical exaggeration 10:1)…………………………………………………………...31
<strong>Hydraulic</strong> <strong>Impacts</strong> <strong>of</strong> <strong>Quarries</strong><br />
<strong>and</strong> <strong>Gravel</strong> <strong>Pits</strong><br />
Executive Summary<br />
1
EXECUTIVE SUMMARY<br />
Natural aggregate (crushed stone, s<strong>and</strong>, <strong>and</strong> gravel) is a vital part <strong>of</strong> our economic infrastructure<br />
in Minnesota. Aggregate is used for road <strong>and</strong> bridge construction <strong>and</strong> in a variety <strong>of</strong> building<br />
materials. In 2003, the value <strong>of</strong> construction s<strong>and</strong> <strong>and</strong> gravel <strong>and</strong> crushed stone in Minnesota was<br />
approximately $245,000,000. As Minnesota’s economy continues to exp<strong>and</strong>, the dem<strong>and</strong> for<br />
aggregate will continue to grow. S<strong>and</strong> <strong>and</strong> gravel pits are located in every county in Minnesota. In<br />
1990, the Minnesota Department <strong>of</strong> Natural Resources, Division <strong>of</strong> Minerals (DNR Minerals),<br />
estimated the number <strong>of</strong> active <strong>and</strong> inactive operations at 1500 with the view that this number<br />
was likely too low (Dennis Martin, pers. comm.). <strong>Quarries</strong> for mining limestone, dolomite,<br />
s<strong>and</strong>stone, <strong>and</strong> hard rock (granite <strong>and</strong> quartzite) are found in 34 counties. A 1990 DNR Minerals<br />
inventory found 165 active operations, 88% <strong>of</strong> which were limestone quarries (Nelson <strong>and</strong> others,<br />
1990). That same inventory counted 1,367 inactive operations, 70% <strong>of</strong> which were limestone<br />
quarries.<br />
Aggregate mining is an extractive use <strong>of</strong> resources: mining alters the l<strong>and</strong>scape <strong>and</strong> its natural<br />
hydrologic system. When a new pit or quarry is proposed or when an existing operation needs to<br />
exp<strong>and</strong>, local governments <strong>and</strong> citizens typically have many questions about the impacts mining<br />
might have. Local governments, which are responsible for reviewing these operations, rarely have<br />
the budgets to hire experts to evaluate potential impacts <strong>of</strong> quarry <strong>and</strong> gravel pit proposals. The<br />
Minnesota Legislature’s Aggregate Resources Task Force identified that local government units<br />
(LGUs) <strong>of</strong>ten lack the expertise to assess ground-water models (Southwick <strong>and</strong> others, 2000).<br />
.<br />
<strong>Quarries</strong> <strong>and</strong> pits can affect ground-water <strong>and</strong> surface-water systems in various ways. This project<br />
focused on the following potential impacts:<br />
• lowering <strong>of</strong> local ground-water <strong>and</strong> surface-water levels from mining operations <strong>and</strong><br />
mine dewatering,<br />
• changes in turbidity levels in ground water due to blasting <strong>and</strong> quarry operations,<br />
• interruption <strong>of</strong> ground-water conduit flow paths by rock removal, <strong>and</strong><br />
• temperature change (thermal impacts) in springs <strong>and</strong> surface-water streams.<br />
This report is intended to help local <strong>of</strong>ficials, the public, <strong>and</strong> the mining industry underst<strong>and</strong> the<br />
main issues surrounding mine establishment <strong>and</strong> to provide suggestions for monitoring <strong>and</strong><br />
mitigation strategies to prevent significant impacts on water resource. The research at these sites<br />
(Figure 1) provides the first comprehensive assessment <strong>of</strong> aggregate mining impacts on groundwater<br />
systems in Minnesota. This information can be used for siting <strong>of</strong> new aggregate mines <strong>and</strong><br />
for more accurately assessing their impacts on local ground-water resources. It can also be used<br />
for planning purposes at the state <strong>and</strong> local level.<br />
3
Figure 1. Site map.<br />
4
Results <strong>and</strong> Conclusions<br />
Table 1 lists the sites <strong>and</strong> the impacts that were studied during the project. The text following the<br />
table describes the results <strong>of</strong> the monitoring at the sites.<br />
Summary <strong>of</strong> <strong>Impacts</strong> <strong>and</strong> Study Results<br />
Site <strong>Impacts</strong> studied Study results<br />
Kraemer Quarry<br />
Golberg Quarry<br />
Spinler Quarry<br />
Fountain Quarry<br />
Big Spring Quarry<br />
Donovan Pit<br />
Water level<br />
Turbidity <strong>and</strong> well<br />
construction<br />
Water level<br />
Turbidity <strong>and</strong> well<br />
construction<br />
Water level<br />
Turbidity<br />
Spring diversion<br />
Temperature change<br />
Water level<br />
Temperature change<br />
Significant decline in aquifer water levels due to<br />
quarry dewatering <strong>and</strong> rock removal.<br />
No impacts observed.<br />
Significant decline in aquifer water levels due to<br />
quarry dewatering <strong>and</strong> rock removal.<br />
No impacts observed.<br />
<strong>Hydraulic</strong> gradient between the upper <strong>and</strong> lower<br />
aquifers has been reversed; the Straight River has<br />
been changed from a gaining to a losing stream.<br />
Blasting caused a slight increase in spring turbidity<br />
levels.<br />
Ground water that previously discharged directly at<br />
the Big Spring now discharges in the quarry. Some <strong>of</strong><br />
it sinks <strong>and</strong> emerges at the Big Spring; the rest flows<br />
overl<strong>and</strong> to Camp Creek.<br />
Significant temperature increases were noted in a<br />
summer measurement. Monitoring is continuing.<br />
Mining had minimal impact on aquifer water levels.<br />
Ground-water temperature changes were noted but<br />
were not consistent. Monitoring is continuing.<br />
Leitzen-Grabau Pit Water level Mining had minimal impact on aquifer water levels.<br />
Felton Pit<br />
Water level<br />
Mining has altered ground-water flow paths affecting<br />
the water supply to a calcareous fen.<br />
Limestone <strong>Quarries</strong><br />
Table 1. Summary table <strong>of</strong> sites <strong>and</strong> impacts studied.<br />
Limestone quarries are found in southeastern Minnesota from the Twin Cities south to Iowa <strong>and</strong><br />
west to Mankato. Some <strong>of</strong> these operations mine below the water table. In order to do this, the<br />
5
quarries must be dewatered. Dewatering can locally depress the water table, altering groundwater<br />
flow paths <strong>and</strong> affecting nearby wells, springs, <strong>and</strong> surface-water bodies. Concerns have<br />
also been raised to DNR Waters <strong>and</strong> local government staff about the impacts <strong>of</strong> quarry blasting<br />
on domestic wells.<br />
To investigate these issues, three sites were studied: the Kraemer quarry in Dakota <strong>County</strong>, the<br />
Golberg quarry at Rochester, <strong>and</strong> the Spinler quarry in Steele <strong>County</strong> southwest <strong>of</strong> Owatonna.<br />
Monitoring wells at these sites were equipped with automatic water level <strong>and</strong> turbidity<br />
monitoring devices.<br />
Water-Level <strong>Impacts</strong>. At all three sites, the quarry dewatering has altered the local ground-water<br />
hydrology. In essence, the quarries act as huge wells, lowering the water table in the aquifer. The<br />
impact <strong>of</strong> the dewatering at the Kraemer Quarry is shown in Figure 2. This lowering could affect<br />
Figure 2. The impacts on ground-water levels <strong>of</strong> drawdown at Kraemer Quarry.<br />
neighboring wells <strong>and</strong> testifies to the need for careful evaluation <strong>of</strong> quarry dewatering proposals<br />
<strong>and</strong> long-term monitoring <strong>of</strong> the dewatering impacts on the local aquifer. To further evaluate<br />
conditions at the Spinler quarry, a three-dimensional model was used. With the quarry being<br />
dewatered continuously, the quarry is now draining a confined limestone aquifer <strong>and</strong> a surficial<br />
s<strong>and</strong> <strong>and</strong> gravel aquifer. Model results also indicate that the Straight River, adjacent to the<br />
property, was probably a gaining stream before quarrying began <strong>and</strong> is now losing flow to the<br />
quarry.<br />
6
Turbidity <strong>Impacts</strong>. Turbidity monitoring in the wells at these sites showed no impact from<br />
blasting. One <strong>of</strong> the tools purchased for this project, a downhole camera (a camera designed to<br />
video the inside <strong>of</strong> water wells) was used to inspect the wells. The camera allowed staff to<br />
visually inspect the condition <strong>of</strong> well casings. No damage from blasting or quarry operations was<br />
visible in any <strong>of</strong> the wells, including those within 20 ft to 200 ft <strong>of</strong> the quarry face. The wells will<br />
be checked again in several years to determine whether continuing quarry operations have had an<br />
impact as the wells age.<br />
The Fountain quarry at Fountain in Fillmore <strong>County</strong> is a dry quarry (quarrying operations are<br />
above the water table) that has been shown by dye tracing to be hydraulically connected to a<br />
nearby spring. Project staff monitored this spring for blasting <strong>and</strong> quarrying impacts on spring<br />
turbidity. This setting was chosen by staff to be analogous to the numerous older wells in<br />
southeastern Minnesota that are finished in the surficial limestone deposits that are being<br />
quarried. Typically, citizens with these wells are those who complain about quarrying impacts on<br />
their wells. The monitoring showed slight increases in turbidity after blasting (Figure 3). Based<br />
on known ground-water travel times, this material had to be present in the limestone’s conduits<br />
(enlarged joints) prior to the blast. The blasting shook the limestone <strong>and</strong> the ground water <strong>and</strong><br />
released some sediment. In an older well finished in the surface limestone deposit, this<br />
mechanism could cause turbidity levels to increase after a blast.<br />
Figure 3. Monitoring showed slight turbidity increases after blasting at Fountain.<br />
The disruption <strong>of</strong> ground-water conduit flow paths by rock removal was studied at the Big Spring<br />
quarry at Harmony in Fillmore <strong>County</strong>; quarrying operations penetrated the conduit system more<br />
than 40 years ago. Ground water that formerly discharged at the Big Spring on Camp Creek now<br />
discharges in the quarry. This water either sinks back into the limestone to re-emerge at the Big<br />
Spring or flows overl<strong>and</strong> to Camp Creek. Dye tracing demonstrated that approximately 90% <strong>of</strong><br />
7
the ground-water basin is now being routed through the quarry. Without any dewatering<br />
occurring, this quarry has altered ground-water flow paths. This water is more vulnerable to<br />
quarrying operations. Temperature measurements indicate that the Big Spring was 8 degrees<br />
Fahrenheit warmer (July measurement) than the water that first discharges in the quarry, <strong>and</strong> the<br />
stream flowing out <strong>of</strong> the quarry to Camp Creek was 17 degrees warmer (Figure 4). Temperature<br />
changes <strong>of</strong> this magnitude could have a negative effect on fish populations in Camp Creek, a<br />
designated trout stream.<br />
Figure 4. Temperature monitoring <strong>of</strong> water at Big Spring Quarry in Harmony.<br />
S<strong>and</strong> <strong>and</strong> <strong>Gravel</strong> <strong>Pits</strong><br />
<strong>Impacts</strong> on Ground-Water Levels <strong>and</strong> Flow Direction. S<strong>and</strong> <strong>and</strong> gravel pits are typically<br />
located in alluvial floodplains along streams <strong>and</strong> in glacial deposits. The sites studied for this<br />
project are shown in Figure 1 above.<br />
Two alluvial s<strong>and</strong> <strong>and</strong> gravel pits, Donovan pit <strong>and</strong> the Leitzen-Grabau pit, along the Zumbro<br />
River in Olmsted <strong>County</strong> were studied. The Letizen-Grabau pit was only a few feet below the<br />
water table at its highest point after heavy rains or snowmelt. The Donovan pit had a pond area<br />
created by mining that is 500 ft by 400 ft by 30 ft deep; in this area, s<strong>and</strong> <strong>and</strong> gravel was mined<br />
by dredging (Figure 5). Neither pit was dewatered. At both sites, there was no significant impact<br />
on ground-water levels from mining. The fluctuations that were seen in the monitoring wells were<br />
due to precipitation events (Figure 6). A common concern about these operations is their impact<br />
8
on water levels in nearby s<strong>and</strong>point wells. Our results show that this type <strong>of</strong> mining should not<br />
affect the water level in these wells.<br />
Figure 5. Donovan pit mining with a hydraulic dredge.<br />
Figure 6. Water level measurements, well nest 1, Donovan Pit.<br />
One s<strong>and</strong> <strong>and</strong> gravel site in a glacial deposit, Felton gravel pit, was studied for this project. The<br />
Felton pit is on a glacial lake beach ridge in Clay <strong>County</strong>. This operation mines s<strong>and</strong> <strong>and</strong> gravel<br />
with a dragline in an open pit below the water table. Although the pit is not dewatered, the mine<br />
has altered the ground-water flow direction in the s<strong>and</strong> <strong>and</strong> gravel deposit, which has affected a<br />
nearby calcareous fen (wetl<strong>and</strong> with ground water for its water source). This type <strong>of</strong> wetl<strong>and</strong><br />
9
needs to be identified prior to mining in order to site <strong>and</strong> plan mining operations in a manner that<br />
will not disrupt the water supply to fens.<br />
Temperature <strong>Impacts</strong>. A second concern at alluvial sites is the impact open ponds could have<br />
on the temperature characteristics <strong>of</strong> the adjacent streams. These ponds change the thermal<br />
character <strong>of</strong> the ground water <strong>and</strong> could conceivably change temperatures in the streams adjacent<br />
to the pits. While some temperature monitoring was done for this project, its results were<br />
inconclusive primarily because <strong>of</strong> the intermittent schedule for taking temperature measurements.<br />
In order to increase the frequency <strong>of</strong> measurements <strong>and</strong> automate the process, temperature<br />
recorders (thermochrons) were purchased <strong>and</strong> deployed at the Donovan pit 1 month prior to the<br />
end <strong>of</strong> this project. This will allow monitoring to continue at the site for an extended time period.<br />
DNR staff conducted a dye trace through the s<strong>and</strong> <strong>and</strong> gravel to determine ground-water velocity<br />
in the deposit. Combined with the temperature data from the thermochrons, this information will<br />
be very useful for future thermal modeling.<br />
Recommendations<br />
Based on the results <strong>of</strong> this project, a list <strong>of</strong> recommendations was developed for local<br />
governments to use as they evaluate mining proposals. These recommendations are focused on<br />
what type <strong>of</strong> water-resource issues may be <strong>of</strong> concern <strong>and</strong> what information is needed from the<br />
mining company to address those concerns. Companies already obtain much <strong>of</strong> the needed<br />
information as they evaluate potential sites. The following information should be available to<br />
local units <strong>of</strong> government to help them evaluate quarry <strong>and</strong> pit proposals.<br />
Topographic Map<br />
One area <strong>of</strong> concern is the topography <strong>of</strong> a mining site. A map showing elevations, roads,<br />
floodplains, property lines, <strong>and</strong> other natural <strong>and</strong> human-made features should be provided. It can<br />
be used to address run<strong>of</strong>f, flooding, <strong>and</strong> equipment storage area questions.<br />
Geologic Map<br />
A geologic map <strong>of</strong> the site is an important piece <strong>of</strong> information that should be supplied by the<br />
mine operator. The information provided by a geologic map will provide answers to questions<br />
about the deposit’s size <strong>and</strong> extent, geologic boundaries, clay or shale layers that are protecting<br />
lower aquifers, <strong>and</strong> the amount <strong>of</strong> unusable material that will need to be stockpiled <strong>and</strong> stored at<br />
the site.<br />
Hydrologic Information<br />
Assessing the potential impacts <strong>of</strong> mining operations on ground-water flow, wells, <strong>and</strong> surface<br />
waters requires hydrologic information. The direction <strong>of</strong> ground-water flow in the deposit, the<br />
location <strong>and</strong> construction <strong>of</strong> wells, <strong>and</strong> any surface-water bodies (streams, lakes, wetl<strong>and</strong>s, <strong>and</strong><br />
springs) should be displayed on a map <strong>of</strong> the area at the appropriate scale. If the mine is to be<br />
dewatered, the pumping point, volume, <strong>and</strong> discharge location should also be included. This<br />
information will allow local government staff <strong>and</strong> mining companies to assess the impact a quarry<br />
or pit will have on adjacent wells <strong>and</strong> surface-water features.<br />
10
Karst Information<br />
Limestone quarries have some particular information needs due to their potential to affect water<br />
resources that are not immediately adjacent to the site. An experienced karst hydrologist or<br />
geologist should conduct an inventory <strong>and</strong> survey <strong>of</strong> springs, sinkholes, stream sinks, caves, <strong>and</strong><br />
other karst features in the area. Dye tracing may be needed to determine the connection between<br />
sinkholes <strong>and</strong> stream sinks at the site <strong>and</strong> area springs. Properly assessing the hydrology <strong>of</strong> a<br />
limestone area should aid in siting new quarries in locations where they will not affect springs<br />
<strong>and</strong> streams.<br />
Mining Plan<br />
To visualize the size <strong>and</strong> scope <strong>of</strong> mining operations, a detailed mining plan should be provided.<br />
It should include mining stages; dimensions <strong>of</strong> the mine; <strong>and</strong> the location <strong>of</strong> processing areas,<br />
stockpiles, settling ponds, washing facilities, stormwater ponds, <strong>and</strong> roads. This plan could be<br />
combined with the topographic map to present an overall view <strong>of</strong> the site <strong>and</strong> the mine<br />
operations.<br />
Reclamation Plan<br />
A key issue is the use <strong>and</strong> character <strong>of</strong> a mining area after mining operations end. To address this<br />
issue, a reclamation plan should be prepared. It needs to detail what reclamation activities will be<br />
done during mining, reclamation methods, vegetation types, shape <strong>and</strong> slope <strong>of</strong> open water areas,<br />
<strong>and</strong> the future use <strong>of</strong> the site. This information will allow local governments <strong>and</strong> the mining<br />
companies to tailor the reclamation plan so that the design <strong>and</strong> use <strong>of</strong> the reclaimed area is<br />
compatible with the surrounding properties.<br />
Conclusions<br />
Ultimately, aggregate mines can only be located in areas where there are aggregate resources. Our<br />
studies have shown that in certain areas, these mines can affect the local water resources.<br />
<strong>Quarries</strong> <strong>and</strong> pits that actively dewater may have impacts on neighboring wells. Mine operations<br />
<strong>and</strong> dewatering schedules may need to be altered to minimize impacts on streams <strong>and</strong> springs.<br />
Areas that may need to be avoided include those with calcareous fens <strong>and</strong> large springs.<br />
A complete listing <strong>of</strong> the recommendations to local governments is found in the Outcomes<br />
sections in the main report. These recommendations, when implemented by local governments<br />
<strong>and</strong> followed by the mining industry, should reduce the impacts <strong>of</strong> quarries <strong>and</strong> pits <strong>and</strong> address<br />
the concerns many citizens have about the water resource impacts <strong>of</strong> aggregate mining.<br />
Acknowledgements<br />
Funding provided by the Minnesota Environment <strong>and</strong> Natural Resources Trust Fund as<br />
recommended by the Legislative Commission on Minnesota Resources. Assistance for the project<br />
was provided by the following project partners:<br />
• Aggregate Industries<br />
• Roverud Construction <strong>of</strong> Spring Grove, Minnesota<br />
• City <strong>of</strong> Harmony Volunteer Fire Department<br />
• Crane Creek Construction <strong>of</strong> Owatonna, Minnesota<br />
• Kraemer <strong>and</strong> Sons <strong>of</strong> Plain, Wisconsin<br />
11
• Leitzen Concrete <strong>of</strong> Rochester, Minnesota<br />
• Minnesota Geological Survey, University <strong>of</strong> Minnesota<br />
• Milestone Materials Division <strong>of</strong> Mathy Construction, Onalaska, Wisconsin<br />
• Pederson Brothers Construction <strong>of</strong> Harmony, Minnesota<br />
• Salem Township, Olmsted <strong>County</strong>, Minnesota<br />
• University <strong>of</strong> Minnesota, Geology <strong>and</strong> Geophysics Department, Hydrogeochemistry Lab<br />
We appreciate the efforts <strong>of</strong> Tim Schlagenhaft, Jon Ellingson, <strong>and</strong> DNR Waters’ staff in St. Paul<br />
who provided peer review <strong>of</strong> the report, as well as Nick Kroska, who edited the report.<br />
12
<strong>Hydraulic</strong> <strong>Impacts</strong> <strong>of</strong> <strong>Quarries</strong><br />
<strong>and</strong> <strong>Gravel</strong> <strong>Pits</strong><br />
I. Research Sections<br />
1. Scope <strong>of</strong> the Issue<br />
2. Study Design<br />
3. Kraemer Quarry—Prairie du Chien Limestone<br />
4. Golberg Quarry—Prairie du Chien Limestone<br />
5. Spinler Quarry—Galena Limestone<br />
6. Fountain Quarry—Galena Limestone<br />
7. Harmony Big Spring Quarry—Galena Limestone<br />
8. Donovan Pit—Alluvial S<strong>and</strong> <strong>and</strong> <strong>Gravel</strong><br />
9. Leitzen-Grabau Pit—Alluvial S<strong>and</strong> <strong>and</strong> <strong>Gravel</strong><br />
10. Felton Pit—Beach Ridge S<strong>and</strong> <strong>and</strong> <strong>Gravel</strong>
SECTION 1. SCOPE OF THE ISSUE<br />
Crushed stone <strong>and</strong> s<strong>and</strong> <strong>and</strong> gravel, generally defined as natural aggregate resources, are the<br />
building blocks for much <strong>of</strong> modern society. Rock quarries <strong>and</strong> gravel pits are common features<br />
on Minnesota’s l<strong>and</strong>scape. Aggregate mining is an extractive use <strong>of</strong> resources that may result in<br />
the l<strong>and</strong>scape <strong>and</strong> its hydrology being altered. Operation <strong>of</strong> quarries <strong>and</strong> pits has the potential to<br />
cause impacts on ground-water <strong>and</strong> surface-water systems in various ways. This potential causes<br />
concerns about mining operations by citizens <strong>and</strong> state <strong>and</strong> local <strong>of</strong>ficials, as well as mine <strong>and</strong> pit<br />
operators. <strong>Quarries</strong> <strong>and</strong> gravel pits <strong>of</strong>ten are located in the aquifer itself; thus, water quality<br />
impacts can be direct <strong>and</strong> unmitigated. Ground-water levels surrounding many <strong>of</strong> these quarries<br />
<strong>and</strong> pits are drawn down to allow dry quarry operations, converting billions <strong>of</strong> gallons <strong>of</strong> ground<br />
water into surface water annually <strong>and</strong> reducing ground-water availability for nearby wells,<br />
wetl<strong>and</strong>s, springs, streams, <strong>and</strong> lakes (Figure 1.1).<br />
DNR Waters staff have ongoing involvement in the investigation <strong>of</strong> the hydrologic impacts <strong>of</strong><br />
quarries <strong>and</strong> pits. DNR water resource pr<strong>of</strong>essionals in all parts <strong>of</strong> the state are called on to make<br />
decisions related to aggregate extraction as part <strong>of</strong> water appropriation permitting <strong>and</strong><br />
environmental review <strong>and</strong> during complaint resolution. The burden on state <strong>and</strong> local staffs is<br />
only exacerbated by the lack <strong>of</strong> definitive information about the impacts <strong>of</strong> mining <strong>and</strong> quarrying.<br />
Most information on these topics is anecdotal <strong>and</strong> little can be found in the literature about the<br />
impacts <strong>of</strong> quarries <strong>and</strong> pits on water resources.<br />
Quarry <strong>and</strong> Pit Dewatering<br />
Southeastern Minnesota <strong>and</strong> Twin Cities Metro Area<br />
14<br />
Billions <strong>of</strong> Gallons<br />
12<br />
10<br />
8<br />
6<br />
4<br />
2<br />
0<br />
1988<br />
1989<br />
1990<br />
1991<br />
1992<br />
1993<br />
1994<br />
1995<br />
1996<br />
1997<br />
1998<br />
1999<br />
2000<br />
2001<br />
2002<br />
2003<br />
2004<br />
Year<br />
Figure 1.1. The extent <strong>of</strong> dewatering.<br />
In 1990, the Minerals Division <strong>of</strong> DNR estimated the number <strong>of</strong> active <strong>and</strong> inactive operations at<br />
1500 with the view that this number was likely too low (Dennis Martin, pers. comm.). <strong>Quarries</strong><br />
for mining limestone, dolomite, s<strong>and</strong>stone, <strong>and</strong> hard rock (granite <strong>and</strong> quartzite) are found in 34<br />
counties. A 1990 Minerals Division inventory found 165 active operations with 88% <strong>of</strong> those<br />
3
eing limestone quarries (Nelson <strong>and</strong> others, 1990). That same inventory counted 1,367 inactive<br />
operations with 70% <strong>of</strong> those being limestone quarries.<br />
Aggregate is an important element <strong>of</strong> our infrastructure; roads, bridges, streets, bricks, concrete,<br />
tile, paint, wallboard, ro<strong>of</strong>ing products, <strong>and</strong> glass are some <strong>of</strong> the commodities requiring<br />
aggregate. Concrete pavement <strong>and</strong> asphalt consist <strong>of</strong> 90% <strong>and</strong> 80% aggregate, respectively.<br />
Crushed limestone is used for agriculture, medicine, <strong>and</strong> household products. Nationwide,<br />
aggregate mining in 1996 yielded about 3.25 billion tons, approximately two-thirds <strong>of</strong> nonfuel<br />
minerals produced in the United States (USGS Fact Sheet FS 14-97, 1999). Iron ore, dimension<br />
stone, <strong>and</strong> aggregate compose the predominant Minnesota nonfuel mining. Minnesota’s nonfuel<br />
mineral production ranked fifth in the nation in 2003 (Ewell, 2003) <strong>and</strong> Minnesota’s 2003<br />
production <strong>of</strong> construction s<strong>and</strong> <strong>and</strong> gravel ranked sixth (Bolen, 2004). Minnesota’s aggregate<br />
industry is a vital component <strong>of</strong> Minnesota’s economy <strong>and</strong> serves to maintain Minnesota’s<br />
st<strong>and</strong>ard <strong>of</strong> living. Aggregate dem<strong>and</strong> is expected to continue to exp<strong>and</strong> as Minnesota’s economy<br />
remains strong <strong>and</strong> its population grows.<br />
<strong>Quarries</strong><br />
Limestone deposits are found in southeastern Minnesota from the Twin Cities south to Iowa <strong>and</strong><br />
west to Mankato (Figure 1.2). These deposits are fractured; as water moves through the soil it<br />
Figure 1.2. Carbonate rock (limestone <strong>and</strong> dolostone) areas <strong>of</strong> Minnesota; quarries are<br />
present in the red <strong>and</strong> yellow areas.<br />
mixes with carbon dioxide to form a mildly acidic solution. As this water moves through the<br />
fractures, it dissolves the rock, enlarging the fractures <strong>and</strong> forming a system <strong>of</strong> conduits to carry<br />
ground water. This rock dissolution <strong>and</strong> conduit creation is the driving process for karst. Drew<br />
(1999) described karst, as “an area <strong>of</strong> limestone or other highly soluble rock, in which the<br />
4
l<strong>and</strong>forms are <strong>of</strong> dominantly solutional origin <strong>and</strong> in which the drainage is underground in<br />
solutionally enlarged fissures <strong>and</strong> conduits.” Whenever limestone is near the surface, it has been<br />
exposed to karst processes. Though most <strong>of</strong> Minnesota does not contain “underground streams”,<br />
those portions <strong>of</strong> the state with karst conditions are the exception. Because ground water in these<br />
underground conduits can convey water as rapidly as surface streams, the potential for<br />
deterioration <strong>of</strong> water levels <strong>and</strong> quality is high. Prediction <strong>of</strong> flow direction <strong>and</strong> flow volumes is<br />
difficult where there are karst conditions. Ground-water watersheds in karst environments can be<br />
<strong>and</strong> usually are quite different than the l<strong>and</strong> surface watersheds. Water supplies in karst areas are<br />
quite vulnerable to unwise l<strong>and</strong> use <strong>and</strong> the impacts <strong>of</strong> that use can affect water supplies quite<br />
distant from the source.<br />
Limestone quarries are mining in karst aquifers; some <strong>of</strong> these operations mine below the water<br />
table. In order to do this, the quarries must be dewatered. Dewatering can locally depress the<br />
water table, altering ground-water flow paths <strong>and</strong> affecting nearby wells, springs, <strong>and</strong> surfacewater<br />
bodies. Interception <strong>of</strong> a ground-water conduit by a quarry can interfere with ground-water<br />
flow paths, pirating the flow <strong>and</strong> redirecting the discharge to a completely different location<br />
(Green <strong>and</strong> others, 2003).<br />
Two examples <strong>of</strong> the impacts <strong>of</strong> limestone quarries that require dewatering can be found in<br />
southeastern Minnesota. At Owatonna, Minnesota, the Fretham <strong>and</strong> Lundin quarries mine below<br />
the water table in the Galena limestone <strong>and</strong> are dewatered for mining. Between 1985 <strong>and</strong> 1992,<br />
DNR Waters staff received several complaints about wells near the quarries going dry or losing<br />
pressure. (Pressure loss can be a symptom <strong>of</strong> a water level that has dropped too close to the level<br />
at which the pump is set. Drawdown during active pumping then brings the water level to the<br />
pump intake causing the pump to suck in air.) The investigation determined that these wells were<br />
also in the Galena limestone <strong>and</strong> were in fact being impacted by the dewatering. In order to<br />
resolve the issue, the quarry operators paid to have the homes connected to the City <strong>of</strong><br />
Owatonna’s water system. A second example is the Osmundson quarry in the Lithograph City<br />
Formation at LeRoy, Minnesota. This below water table quarry requires seasonal dewatering at<br />
250 gallons per minute to 800 gallons per minute. When the quarry is being dewatered, Sweets<br />
Spring, approximately 325 yards to the southeast, stops flowing. Dye traces in 1993 <strong>and</strong> 1994<br />
verified that the quarry pirates the ground-water flow to the spring.<br />
<strong>Pits</strong><br />
Generally, s<strong>and</strong> <strong>and</strong> gravel operations are found in deposits formed during the advance <strong>and</strong> retreat<br />
<strong>of</strong> glaciers <strong>and</strong> in alluvial floodplain deposits formed by streams. Both types <strong>of</strong> deposits <strong>of</strong>ten are<br />
critical ground-water aquifers <strong>and</strong> recharge areas in upl<strong>and</strong> settings; they <strong>of</strong>ten are focused<br />
discharge zones in stream <strong>and</strong> river valleys where wetl<strong>and</strong>s <strong>and</strong> springs depend on continued<br />
ground-water flows through the s<strong>and</strong> <strong>and</strong> gravel. Because s<strong>and</strong> <strong>and</strong> gravel deposits allow<br />
comparatively high infiltration rates <strong>and</strong> relatively rapid rates <strong>of</strong> water transfer within an aquifer,<br />
activities <strong>and</strong> l<strong>and</strong> uses within <strong>and</strong> above granular aggregate can have negative effects on groundwater<br />
quantity <strong>and</strong> quality within aquifers. Where decisions are made to leave the s<strong>and</strong> <strong>and</strong> gravel<br />
deposits in place to provide natural resource values <strong>and</strong> ground water for human use, the<br />
availability <strong>of</strong> the aggregate resource will be limited. This fact concerns those who plan for the<br />
state’s future aggregate production.<br />
One example <strong>of</strong> the impacts <strong>of</strong> s<strong>and</strong> <strong>and</strong> gravel mining can be found in Clay <strong>County</strong> where the<br />
Buffalo aquifer is the primary potable water supply for the City <strong>of</strong> Moorhead during drought<br />
conditions. Lying within the flat lakebed <strong>of</strong> Glacial Lake Agassiz (now called the Red River<br />
Valley), aquifer recharge rates are very low; replenishment <strong>of</strong> ground water takes a long time<br />
5
ecause the very dense clay sediments that encase the Buffalo aquifer prevent water from<br />
reaching the aquifer horizontally. Composed <strong>of</strong> coarse granular materials, the aquifer is also the<br />
closest source <strong>of</strong> aggregate materials for the Moorhead/Fargo area. Excavation <strong>of</strong> s<strong>and</strong> <strong>and</strong> gravel<br />
in this area below depths <strong>of</strong> about 30 feet actually removes aquifer material from beneath the<br />
water table. In the northern one-half <strong>of</strong> this area, the s<strong>and</strong>s <strong>and</strong> gravels are protected from direct<br />
introduction <strong>of</strong> fluids <strong>and</strong> contaminants by a blanket <strong>of</strong> less permeable silt <strong>and</strong> clay. The gravel<br />
mines create openings (windows) through the overlying silts <strong>and</strong> clays into the aquifer. Along<br />
with direct contamination due to mining operations or neglect after mine closure, the potential <strong>of</strong><br />
aquifer contamination due to introduction <strong>of</strong> contaminated floodwaters is significant because the<br />
Red River Valley regularly experiences broad overl<strong>and</strong> flooding. Floodwaters incorporate<br />
everything from farm chemicals to tanker spills along two major roads (Interstate 94 <strong>and</strong> U.S.<br />
Highway 10). If contaminated floodwaters enter the pit, they can be readily introduced into<br />
Moorhead’s primary drought period water supply. Along with providing drought supply to<br />
Moorhead, the Buffalo aquifer supplies water to surrounding rural farmsteads <strong>and</strong> several smaller<br />
communities in the area.<br />
In recognition <strong>of</strong> the importance <strong>of</strong> the aquifer, Moorhead has taken proactive steps to protect<br />
their source <strong>of</strong> water despite the fact that the aquifer is located outside <strong>of</strong> its jurisdictional<br />
boundaries. Acknowledging the low recharge rates into the aquifer due to the protective silts <strong>and</strong><br />
clays, the city greatly reduced its use <strong>of</strong> the aquifer, saving it for drought conditions. It has<br />
conducted technical studies <strong>and</strong> developed a wellhead protection plan; it also recognizes that<br />
gravel pit windows provide direct conduits for contamination to reach the aquifer <strong>and</strong> its water<br />
supply. Recently, a company opened a new pit above the aquifer to provide fill for Interstate 394<br />
connecting Interstate 94 <strong>and</strong> U.S. Highway 10 without a permit from Clay <strong>County</strong>. The city took<br />
legal action <strong>and</strong> worked with the county through their conditional use permit process to<br />
substantially reduce the potential <strong>of</strong> contamination to the aquifer <strong>and</strong> limit future expansions <strong>of</strong><br />
the pit.<br />
Study Purpose<br />
The Minnesota Legislature established the Aggregate Resources Task Force in 1998 because <strong>of</strong><br />
the importance <strong>and</strong> dwindling supply <strong>of</strong> aggregate resources. The task force published findings<br />
<strong>and</strong> recommendations “for the management <strong>of</strong> aggregate resources throughout the state, helping<br />
to ensure the continued availability <strong>of</strong> these resources for future use at reasonable costs while<br />
maintaining existing environmental safeguards related to mining” (Southwick <strong>and</strong> others, 2000).<br />
The task force identified that local government units (LGUs) <strong>of</strong>ten lack the expertise to assess<br />
potential environmental impacts <strong>of</strong> mining proposals, <strong>and</strong> rarely do they have budgetary<br />
resources to hire consultants <strong>of</strong> their own to adequately evaluate mining proposals <strong>and</strong> ensure that<br />
environmental safeguards remain in place.<br />
This study <strong>and</strong> this report are intended to provide the following assistance:<br />
• help local <strong>of</strong>ficials, the public, <strong>and</strong> the mining industry underst<strong>and</strong> the main issues<br />
surrounding mine establishment <strong>and</strong><br />
• provide suggestions for monitoring <strong>and</strong> mitigating strategies to prevent significantly<br />
harmful impacts on water resources.<br />
The focus <strong>of</strong> this study was on the following impacts:<br />
• effects on ground-water levels from mining operations <strong>and</strong> mine dewatering,<br />
• turbidity in wells due to blasting <strong>and</strong> quarry operations,<br />
• interruption <strong>of</strong> conduit flow paths by rock removal, <strong>and</strong><br />
6
• temperature change (thermal impacts) in springs <strong>and</strong> surface-water streams.<br />
This study was proposed for LCMR funding in order to begin systematic evaluation <strong>of</strong> aggregate<br />
mining impacts at test sites in several areas <strong>of</strong> the state.<br />
7
SECTION 2. STUDY DESIGN<br />
Figure 2.1. Site location map.<br />
9
Site Selection<br />
Five quarries <strong>and</strong> three s<strong>and</strong> <strong>and</strong> gravel pits were studied (Figure 2.1 above). The limestone<br />
quarries are the following:<br />
• Kraemer quarry, Burnsville, Dakota <strong>County</strong>;<br />
• Golberg quarry, north <strong>of</strong> Rochester, Olmsted <strong>County</strong>;<br />
• Spinler quarry, southwest <strong>of</strong> Owatonna, Steele <strong>County</strong>;<br />
• Fountain quarry, Fountain, Fillmore <strong>County</strong>; <strong>and</strong><br />
• Big Spring quarry, west <strong>of</strong> Harmony near the unincorporated village <strong>of</strong> Big Spring,<br />
Fillmore <strong>County</strong>.<br />
The s<strong>and</strong> <strong>and</strong> gravel pits are the following:<br />
• Donovan pit, Salem Township, Olmsted <strong>County</strong>;<br />
• Leitzen-Grabau pit, Salem Township, Olmsted <strong>County</strong>; <strong>and</strong><br />
• Felton pit, near Felton, Clay <strong>County</strong>.<br />
Impact Monitoring<br />
Table 2.1 lists the sites <strong>and</strong> the impacts that were monitored during the project. The text following<br />
the table describes the monitoring at the sites.<br />
Site<br />
Kraemer<br />
Golberg<br />
Mineral<br />
resource<br />
Prairie du<br />
Chien<br />
limestone<br />
Prairie du<br />
Chien<br />
limestone<br />
Water level<br />
X<br />
X<br />
Ground-water impacts studied<br />
Turbidity<br />
X<br />
X<br />
Temperature<br />
change<br />
Spring<br />
diversion<br />
Spinler<br />
Galena<br />
limestone<br />
X<br />
Fountain<br />
Galena<br />
limestone<br />
X<br />
Big Spring<br />
Donovan<br />
Galena<br />
limestone X X<br />
Alluvial s<strong>and</strong><br />
<strong>and</strong> gravel X X<br />
Leitzen-<br />
Grabau<br />
Felton<br />
Alluvial s<strong>and</strong><br />
<strong>and</strong> gravel<br />
Glacial beach<br />
ridge s<strong>and</strong> <strong>and</strong><br />
gravel<br />
X<br />
X<br />
Table 2.1. Summary table <strong>of</strong> sites <strong>and</strong> impacts studied.<br />
10
Water Level<br />
Wells were monitored at three limestone quarries, Kraemer, Golberg, <strong>and</strong> Spinler, to measure the<br />
extent <strong>of</strong> the impact <strong>of</strong> dewatering on water levels in the areas around the quarries. All three <strong>of</strong><br />
these sites are below-water table operations that require dewatering for mining operations to<br />
occur. Project funds were used to install wells at all three sites. The Spinler site had additional<br />
wells in place that had been installed by the quarry owner as part <strong>of</strong> its water appropriation permit<br />
requirements.<br />
At the Felton, Donovan, <strong>and</strong> Leitzen-Grabau s<strong>and</strong> <strong>and</strong> gravel pits, mining activities occur below<br />
the water table. This is “wet mining” involving no dewatering. Monitoring wells had been<br />
installed at the Felton mine as part <strong>of</strong> an ongoing research project to evaluate the mine’s impact<br />
on a nearby calcareous seepage fen. At the Leitzen-Grabau <strong>and</strong> Donovan sites, Salem Township<br />
had required the mining companies to install monitoring wells as a stipulation in their conditional<br />
use permits. Project funds were used to install a second set <strong>of</strong> shallow wells at the Donovan pit.<br />
The wells at these sites were monitored for mining impacts on ground-water levels. At the<br />
Kraemer <strong>and</strong> Golberg sites, blasting impacts on ground-water levels were also monitored.<br />
Turbidity<br />
At the Kraemer, Golberg, <strong>and</strong> Fountain sites, blasting impacts on turbidity levels were monitored.<br />
The monitoring at Kraemer <strong>and</strong> Golberg sites was done with turbidity sensors in the monitoring<br />
wells. Most limestone <strong>and</strong> dolostone quarries in Minnesota are dry quarries; the quarrying<br />
activities occur above the water table. In these cases, the direct impacts <strong>of</strong> dewatering on the<br />
ground-water system are not manifested. There are, however, issues associated with these dry<br />
quarries. Concerns include the impacts these quarries can have on ground-water quality in the<br />
area <strong>and</strong> the particular impacts <strong>of</strong> mining <strong>and</strong> blasting on neighboring wells. In order to partially<br />
address these issues, we investigated the impacts <strong>of</strong> the quarry operated by Milestone Materials<br />
Division <strong>of</strong> Mathy Construction near Harmony, Minnesota, on the Fountain Big Spring, which is<br />
near the quarry.<br />
<strong>Hydraulic</strong> Diversion <strong>of</strong> Spring Flows<br />
The Big Spring quarry is west <strong>of</strong> Harmony near the unincorporated village <strong>of</strong> Big Spring. In the<br />
early 1960s, the quarry breached conduits carrying ground water to the Big Spring on Camp<br />
Creek. Water that formerly discharged directly from the spring now discharges into the quarry.<br />
Most <strong>of</strong> the flow sinks back into a conduit <strong>and</strong> then discharges from the Big Spring, <strong>and</strong> the<br />
remainder flows overl<strong>and</strong> to Camp Creek. Previous dye tracing work had demonstrated that a<br />
significant portion <strong>of</strong> the springshed (the area contributing flow to a spring) <strong>of</strong> the Big Spring had<br />
been diverted to the quarry. During this project, we were able to use dye tracing to more<br />
accurately quantify the extent <strong>of</strong> this conduit piracy.<br />
Water Temperature<br />
At the Big Spring quarry we began the process <strong>of</strong> assessing the impact that spring diversions<br />
might have on the temperatures <strong>of</strong> the springs <strong>and</strong> stream. At the Donovan site, the shallow wells<br />
<strong>and</strong> the pond created by mining were monitored to determine if there were thermal impacts on<br />
these systems from mining activities.<br />
11
Quarry Site Descriptions<br />
Kraemer Quarry<br />
Figure 2.2. Kraemer quarry site photograph.<br />
The Kraemer quarry (Figure 2.2) is located in township 27, range 24W, section 33, a half-mile<br />
north <strong>of</strong> State Highway 13, west <strong>of</strong> Interstate 35W, <strong>and</strong> a quarter-mile south <strong>of</strong> the Minnesota<br />
River in Burnsville, Dakota <strong>County</strong>.<br />
The primary resource being removed from the site by Kraemer <strong>and</strong> Sons is crushed limestone <strong>of</strong><br />
various grades. In a cooperative effort between Kraemer <strong>and</strong> Sons <strong>and</strong> DNR Waters, three wells<br />
were drilled on the southwest part <strong>of</strong> the property to a depth <strong>of</strong> about 120 feet. The area that is<br />
currently excavated is about 235 acres; however, the total disturbed area is closer to 500 acres.<br />
The precipitation normal for the site is 29.41 inches based on area data from the National Oceanic<br />
Oceanic <strong>and</strong> Atmospheric Administration (NOAA) from 1971 to 2000 . Daily precipitation was<br />
collected at station 217538, located 1 mile from the site, by the state climatology program’s highdensity<br />
network. The 2001 through 2005 precipitation is presented in Figure 2.3.<br />
12
Figure 2.3. Precipitation data 2001–2005 near Kraemer Quarry.<br />
Cumulative departure from normal is a measure <strong>of</strong> long-term precipitation trends. The departure<br />
from normal is calculated by subtracting the 1971–2000 monthly precipitation normals from the<br />
monthly precipitation. This is summed over the period <strong>of</strong> interest providing a measure <strong>of</strong><br />
precipitation trends. The precipitation in the area has been above normal for the study duration<br />
with big increases in precipitation in 2002. The precipitation in 2003 through the first few months<br />
<strong>of</strong> 2005 has been near average.<br />
13
Golberg Quarry<br />
Figure 2.4. Golberg quarry site photograph.<br />
The Golberg quarry (Figure 2.4) is located in township 108, range 14W, section 36, north <strong>of</strong><br />
<strong>County</strong> Road 14 <strong>and</strong> along the banks <strong>of</strong> the Zumbro River in Olmsted <strong>County</strong>. The site is 5 miles<br />
northeast <strong>of</strong> the city <strong>of</strong> Rochester.<br />
The primary resource being removed from the site by Milestone Materials Division <strong>of</strong> Mathy<br />
Construction is crushed limestone <strong>of</strong> various grades. In a cooperative effort between Mathy<br />
Construction <strong>and</strong> DNR Waters, two wells were drilled on the north property line to a depth <strong>of</strong><br />
about 120 feet. The area that is currently being mined is about 51 acres; however, the total<br />
disturbed area is closer to 150 acres.<br />
The precipitation normal for the site is 31.40 inches based on area data from NOAA from 1971 to<br />
2000. Daily precipitation was collected at station 217009, located 4 miles from the site, by the<br />
state climatology program’s high-density network. The 2001 through 2005 precipitation is<br />
presented in Figure 2.5.<br />
14
Figure 2.5. Precipitation data 2001–2005 near Golberg quarry.<br />
Cumulative departure from normal is a measure <strong>of</strong> long-term precipitation trends. The departure<br />
from normal is calculated by subtracting the 1971–2000 monthly precipitation normals from the<br />
monthly precipitation. This is summed over the period <strong>of</strong> interest providing a measure <strong>of</strong><br />
precipitation trends. The precipitation in the area has been above normal for the study duration<br />
with big increases in precipitation in the first halves <strong>of</strong> 2001, 2002, <strong>and</strong> 2004. It was slightly drier<br />
in the second half <strong>of</strong> 2003, but the overall departure from normal remained positive.<br />
15
Spinler Quarry<br />
Figure 2.6. Spinler quarry site photograph.<br />
The Spinler quarry (Figure 2.6) is located in township 106, range 21W, section 1, a half-mile west<br />
<strong>of</strong> <strong>County</strong> Road 30, two miles west <strong>of</strong> Interstate Hwy 35, south <strong>of</strong> 51 st Road, <strong>and</strong> a half-mile west<br />
<strong>of</strong> the Straight River in Steele <strong>County</strong>. The site is 6 miles southwest <strong>of</strong> the city <strong>of</strong> Owatonna.<br />
Crushed limestone is the primary resource being removed from the site by Milestone Materials<br />
Division <strong>of</strong> Mathy Construction. The site was initially operated by Crane Creek Construction as a<br />
s<strong>and</strong> <strong>and</strong> gravel pit but switched to limestone mining when bedrock was reached. In an effort to<br />
determine impacts on the local ground water <strong>and</strong> the Straight River, Crane Creek Construction<br />
was required to drill three bedrock wells around the quarry <strong>and</strong> six shallow s<strong>and</strong> <strong>and</strong> gravel wells<br />
between the quarry <strong>and</strong> the river. Two additional shallow wells were drilled by DNR Waters to<br />
supplement the information previously gathered. The area that is currently excavated is about 34<br />
acres; however, the total disturbed area is closer to 58 acres.<br />
The precipitation normal for the site is 31.64 inches based on area NOAA data from 1971 to<br />
2000. Daily precipitation was collected at station 216287, located within a mile <strong>of</strong> the site, by the<br />
state climatology program’s high-density network. The 2001 through 2005 precipitation is<br />
presented in Figure 2.7.<br />
16
Figure 2.7. Precipitation data 2001–2005 near Spinler quarry.<br />
Cumulative departure from normal is a measure <strong>of</strong> long-term precipitation trends. The departure<br />
from normal is calculated by subtracting the 1971–2000 monthly precipitation normals from the<br />
monthly precipitation. This is summed over the period <strong>of</strong> interest providing a measure <strong>of</strong><br />
precipitation trends. The precipitation in the area was above normal in the first halves <strong>of</strong> 2001 <strong>and</strong><br />
2004. The precipitation during the remainder <strong>of</strong> 2001, 2002, <strong>and</strong> the first half <strong>of</strong> 2003 was about<br />
normal. The end <strong>of</strong> 2003 was drier than normal.<br />
17
Fountain Quarry<br />
Figure 2.8. Fountain quarry site photograph.<br />
The Fountain quarry (Figure 2.8) is located in township 103, range 11W, section 3, north <strong>of</strong><br />
<strong>County</strong> Road 8, <strong>and</strong> a half-mile west <strong>of</strong> U.S. Highway 52 in Fillmore <strong>County</strong>. The site is 25 miles<br />
southeast <strong>of</strong> the city <strong>of</strong> Rochester.<br />
The primary resource being removed from the site by Milestone Materials Division <strong>of</strong> Mathy<br />
Construction is crushed limestone <strong>of</strong> various grades. No wells were installed in the vicinity <strong>of</strong> the<br />
quarry; however, turbidity was being monitored in a spring that was shown to be taking run<strong>of</strong>f<br />
from the quarry floor through a dye trace performed by University <strong>of</strong> Minnesota Geology<br />
Department in cooperation with DNR Waters. The area that is currently being mined is about 24<br />
acres; however, the total disturbed area is closer to 47 acres.<br />
The Fountain quarry is in the flat-lying Stewartville <strong>and</strong> Prosser Members <strong>of</strong> the Ordovician<br />
Galena Group. The Prosser is fine-grained, thin-bedded limestone with minor shale partings while<br />
the Stewartville is fine-grained dolomitic limestone <strong>and</strong> dolostone (Mossler, 1995). Both <strong>of</strong> these<br />
formations exhibit classic karst features when they are in a shallow setting as they are here.<br />
Numerous sinkholes, stream sinks, springs, <strong>and</strong> caves are found in this area. In the quarry there<br />
are four open joints on the floor. These joints generally have water flowing through them except<br />
during the driest periods <strong>of</strong> the year.<br />
The precipitation normal for the site is 34.29 inches based on area NOAA data from 1971 to<br />
2000. Daily precipitation was collected at station 216654, located 10 miles from the site, by the<br />
state climatology program’s high-density network. The 2001 through 2005 precipitation is<br />
presented in Figure 2.9.<br />
18
Figure 2.9. Precipitation data 2001–2005 near Fountain quarry.<br />
Cumulative departure from normal is a measure <strong>of</strong> long-term precipitation trends. The departure<br />
from normal is calculated by subtracting the 1971–2000 monthly precipitation normals from the<br />
monthly precipitation. This is summed over the period <strong>of</strong> interest providing a measure <strong>of</strong><br />
precipitation trends. The precipitation in the area has been significantly below normal through<br />
spring 2004. Early summer 2004 was wet <strong>and</strong> precipitation has been about normal since then;<br />
however, a precipitation deficit still exists.<br />
19
Big Springs Quarry<br />
Figure 2.10. Big Springs quarry site photograph (2003).<br />
The Big Springs quarry (Figure 2.10) is located in township 101, range 10W, section 9, south <strong>of</strong><br />
<strong>County</strong> Road 22 <strong>and</strong> about 2 miles west <strong>of</strong> U.S. Highway 52 in Fillmore <strong>County</strong>. The site is near<br />
Harmony, Minnesota, 38 miles southeast <strong>of</strong> the city <strong>of</strong> Rochester. The primary resource being<br />
removed from the site by Pederson Brothers Construction is crushed limestone <strong>of</strong> various grades.<br />
The Big Spring quarry is in the flat-lying Stewartville <strong>and</strong> Prosser Members <strong>of</strong> the Ordovician<br />
Galena Group. The Prosser is fine-grained, thin-bedded limestone with minor shale partings while<br />
the Stewartville is fine-grained dolomitic limestone <strong>and</strong> dolostone (Mossler, 1995). Both <strong>of</strong> these<br />
formations exhibit classic karst features when they are in a shallow setting as they are here. In this<br />
area they have numerous sinkholes, stream sinks, springs, <strong>and</strong> caves. In the quarry face, solution<br />
conduits up to 3 yards in diameter have been exposed as the quarry has exp<strong>and</strong>ed.<br />
The area that is currently being mined is about 35 acres; however, the total disturbed area is<br />
closer to 47 acres. In the early 1960s, quarrying operations disrupted the conduits carrying flow to<br />
Big Spring (A24), the headwaters <strong>of</strong> a trout stream, Camp Creek, which lies 550 yards north <strong>of</strong><br />
the quarry. The owners <strong>of</strong> the spring have stated that when this disruption occurred, the flow from<br />
the spring decreased. At that time, water started rising in the quarry at several different points;<br />
some flows overl<strong>and</strong> to Camp Creek while the rest sinks back into the quarry <strong>and</strong> resurges in Big<br />
Spring (A24). This quarry is not actively dewatered. The ratio <strong>of</strong> overl<strong>and</strong> flow versus resurging<br />
flow varies depending on spring stage <strong>and</strong> run<strong>of</strong>f events. As the quarry has exp<strong>and</strong>ed to the south,<br />
the points at which the water discharges in the quarry have migrated south also. Figure 2.11<br />
below is a photograph <strong>of</strong> Big Spring East, A238, the main point where water discharges in the<br />
eastern part <strong>of</strong> the quarry.<br />
20
Figure 2.11. Big Spring East, the main discharge point in the eastern part <strong>of</strong> the quarry.<br />
The precipitation normal for the site is 34.29 inches based on area NOAA data from 1971 to<br />
2000. Daily precipitation was collected at station 213520, located 1 mile from the site, by the<br />
state climatology program’s high-density network. The 2001 through 2005 precipitation is<br />
presented in Figure 2.12.<br />
Cumulative departure from normal is a measure <strong>of</strong> long-term precipitation trends. The departure<br />
from normal is calculated by subtracting the 1971–2000 monthly precipitation normals from the<br />
monthly precipitation. This is summed over the period <strong>of</strong> interest providing a measure <strong>of</strong><br />
precipitation trends. The precipitation in the area has been about average through summer 2002.<br />
In late summer 2002 through the following year, the precipitation was significantly below<br />
normal. The end <strong>of</strong> 2003 was about normal <strong>and</strong> was followed by a wet spring in 2004.<br />
Precipitation has been about normal since then.<br />
21
Figure 2.12. Precipitation data 2001–2005 near Big Spring quarry.<br />
22
S<strong>and</strong> <strong>and</strong> <strong>Gravel</strong> Pit Site Descriptions<br />
Donovan Pit<br />
Figure 2.13. Donovan pit site photograph.<br />
The Donovan pit (Figure 2.13) is located in township 106, range 15W, section 24, just west <strong>of</strong><br />
<strong>County</strong> Road 104 <strong>and</strong> 250 feet south <strong>of</strong> the Zumbro River in Olmsted <strong>County</strong>. The site is in<br />
Salem Township, 5 miles southwest <strong>of</strong> the city <strong>of</strong> Rochester.<br />
Milestone Materials Division <strong>of</strong> Mathy Construction is removing s<strong>and</strong> <strong>and</strong> gravel from the pit for<br />
use in the reconstruction <strong>of</strong> U.S. Highway 52 through Rochester. As required by the conditional<br />
use permit through the township, Milestone Materials Division <strong>of</strong> Mathy Construction installed<br />
three wells to monitor ground-water levels around the pit. One <strong>of</strong> the company’s wells was<br />
located upgradient <strong>of</strong> the pit <strong>and</strong> two were located downgradient; all were drilled to about 50 feet.<br />
Four additional shallow wells (15 to 20 feet deep) were drilled by DNR Waters with project funds<br />
to supplement the information provided by the company wells.<br />
The area that is to be mined is about 33 acres; however, the total disturbed area currently is 15<br />
acres. The most recent past use <strong>of</strong> the site was as an agricultural field on a soybean <strong>and</strong> corn<br />
rotation. The site is located almost entirely within the Zumbro River floodplain <strong>and</strong> is subject to<br />
inundation when the river floods.<br />
The precipitation normal for the site is 31.4 inches based on area NOAA data from 1971 to 2000.<br />
Daily precipitation was collected at station 217422, located 4 miles from the site, by the state<br />
climatology program’s high-density network. The 2001 through 2005 precipitation is presented in<br />
Figure 2.14.<br />
23
Figure 2.14. Precipitation data 2001–2005 near Donovan pit.<br />
Cumulative departure from normal is a measure <strong>of</strong> long-term precipitation trends. The departure<br />
from normal is calculated by subtracting the 1971–2000 monthly precipitation normals from the<br />
monthly precipitation. This is summed over the period <strong>of</strong> interest providing a measure <strong>of</strong><br />
precipitation trends. The first half <strong>of</strong> 2001 was wetter than normal <strong>and</strong> the second half <strong>of</strong> 2001<br />
through the first half <strong>of</strong> 2003 was about normal. The second half <strong>of</strong> 2003 was drier than normal;<br />
however, it recovered in the first part <strong>of</strong> 2004 <strong>and</strong> has been about normal through the first couple<br />
months <strong>of</strong> 2005.<br />
24
Leitzen-Grabau Pit<br />
Figure 2.15. Leitzen-Grabau pit site photograph.<br />
The Leitzen-Grabau pit (Figure 2.15) is located in township 106, range 15W, section 25, just west<br />
<strong>of</strong> 60 th Ave SW <strong>and</strong> south <strong>of</strong> <strong>County</strong> Road 117 along the Zumbro River in Olmsted <strong>County</strong>. The<br />
site is in Salem Township, 5.5 miles southwest <strong>of</strong> the city <strong>of</strong> Rochester.<br />
The Leitzen-Grabau pit is in an alluvial s<strong>and</strong> <strong>and</strong> gravel deposit in the floodplain <strong>of</strong> the South<br />
Fork Zumbro River. Pebbles <strong>and</strong> cobbles <strong>of</strong> b<strong>and</strong>ed iron ore, granite, <strong>and</strong> other rocks from<br />
northern Minnesota are clear evidence that at least some <strong>of</strong> the material was transported to the<br />
area by glaciers. Since this area was not covered by ice during the last glacial advance, these<br />
materials likely date back to an earlier glacial advance. The materials were reworked by the<br />
Zumbro River <strong>and</strong> deposited in the alluvial plain.<br />
The primary resource being removed from the site by Leitzen Concrete is s<strong>and</strong> <strong>and</strong> gravel being<br />
used in the reconstruction <strong>of</strong> U.S. Highway 52 through Rochester. As a condition <strong>of</strong> its<br />
conditional use permit through the township, Leitzen Concrete was required to install three wells<br />
to monitor ground-water levels around the pit. One well was located upgradient <strong>of</strong> the pit <strong>and</strong> two<br />
were located downgradient.<br />
The area that is to be mined is about 32 acres; however, the total disturbed area currently is 19<br />
acres. The most recent past use <strong>of</strong> the site was as an agricultural field on a soybean <strong>and</strong> corn<br />
rotation.<br />
The precipitation normal for the site is 31.4 inches based on area NOAA data from 1971 to 2000.<br />
Daily precipitation was collected at station 217422, located 5 miles from the site, by the state<br />
climatology program’s high-density network. The 2001 through 2005 precipitation is presented in<br />
Figure 2.16.<br />
25
Figure 2.16. Precipitation data 2001–2005 near Leitzen-Grabau pit.<br />
Cumulative departure from normal is a measure <strong>of</strong> long-term precipitation trends. The departure<br />
from normal is calculated by subtracting the 1971–2000 monthly precipitation normals from the<br />
monthly precipitation. This is summed over the period <strong>of</strong> interest providing a measure <strong>of</strong><br />
precipitation trends. The first half <strong>of</strong> 2001 was wetter than normal <strong>and</strong> the second half <strong>of</strong> 2001<br />
through the first half <strong>of</strong> 2003 was about normal. The second half <strong>of</strong> 2003 was drier than normal;<br />
however, it recovered in the first part <strong>of</strong> 2004 <strong>and</strong> has been about normal through the first couple<br />
months <strong>of</strong> 2005.<br />
26
Felton Pit<br />
Figure 2.17. Felton pit site photograph.<br />
The Felton study area has several active gravel pits, the largest <strong>of</strong> which are the Trust Fund Pit<br />
<strong>and</strong> the Clay <strong>County</strong> Pit. The first is a large open-water gravel pit (Figure 2.17), which is<br />
managed by the DNR Division <strong>of</strong> Forestry for the School Trust Fund. This pit is located in<br />
township 142N, range 45W, SW1/4 NW 1/4 section 32. Construction-grade gravel has been<br />
removed from the deposit on the Trust Fund parcel since 1959. The lease is currently held by<br />
Aggregate Industries. Mined to approximately the ground-water table, the Clay <strong>County</strong> Pit is<br />
situated in township 142N, range 45W, S1/2 section 6. Substantial gravel resources have been<br />
identified below the water table in <strong>and</strong> surrounding the pit.<br />
Both pits are at the western edge <strong>of</strong> the top <strong>of</strong> the Lake Agassiz beach ridge. The two calcareous<br />
fens, simplistically named North Fen <strong>and</strong> South Fen, are downslope <strong>of</strong> <strong>and</strong> 30 feet lower in<br />
elevation than the beach ridge top. The South Fen is located in township 142N, range 46W, SE<br />
1/4 section 36; the North Fen is approximately 1,000 ft northeast <strong>of</strong> the South Fen in township<br />
142N, range 45W, SW 1/4 NW 1/4 section 31. Contrasting with the relatively flat North Fen<br />
(elevation 967), the South Fen slopes approximately 18 feet from its eastern, upgradient edge<br />
(elevation 980) to its western edge (elevation 962).<br />
Ground-water gradients were monitored at four well nest locations: at each <strong>of</strong> the fens <strong>and</strong><br />
upgradient <strong>of</strong> each <strong>of</strong> the fens between the gravel pits <strong>and</strong> the fens. Water levels were monitored<br />
in other single-well installations surrounding both the Trust Fund Pit <strong>and</strong> the <strong>County</strong> Pit. Water<br />
level monitoring provided the framework for a conceptual model used to assist in assessing the<br />
reasons for degradation <strong>of</strong> the North Fen. A weather station was installed on the southwestern<br />
edge <strong>of</strong> the South Fen, <strong>and</strong> a staff gage was installed in the open-water pit to record water levels.<br />
The two closest NOAA locations to the study area are Ada (15.5 miles north-northeast) <strong>and</strong><br />
Halstad (26.7 miles northwest). The precipitation normal for the Ada site is 23.79 inches <strong>and</strong> for<br />
the Halstad site is 19.89 inches based on updated area NOAA data.<br />
27
SECTION 3. KRAEMER QUARRY—PRAIRIE DU CHIEN LIMESTONE<br />
Figure 3.1. Site by aerial photograph.<br />
<strong>Impacts</strong> on Water Levels<br />
Water level monitoring at the Kraemer quarry was accomplished by measuring water levels in<br />
three wells drilled for the project (Figure 3.1). The wells were measured manually several times<br />
per month during quarrying activities. Pressure transducers measured water levels at 15-minute<br />
intervals. Because the quarry personnel do not turn <strong>of</strong>f the quarry pumps, water levels do not<br />
fluctuate very much from year to year. Seasonal variation is usually slight with an increase <strong>of</strong> less<br />
than 3 feet occurring in early summer from snowmelt (Figure 3.2).<br />
A reconstruction <strong>of</strong> historic water levels (Figure 3.3), using available information from the<br />
l<strong>and</strong>scape <strong>and</strong> all available data, reveals that water levels in the immediate vicinity <strong>of</strong> the quarry<br />
have declined by at least 70 feet since quarrying activities began in 1959 (Figure 3.4). This is<br />
largely due to pumping at the quarry, but there are other water users in the area that may also<br />
influence the current drawdown. The Kraemer quarry is not the only quarry that has existed in the<br />
area, <strong>and</strong> there may have been depressed water tables due to other quarry operations in the past.<br />
29
Kraemer Quarry Wells<br />
680.00<br />
675.00<br />
Water Level Elevation (Ft)<br />
670.00<br />
665.00<br />
660.00<br />
655.00<br />
650.00<br />
645.00<br />
K3<br />
K2<br />
K1<br />
640.00<br />
635.00<br />
11/01/01 05/20/02 12/06/02 06/24/03 01/10/04 07/28/04 02/13/05<br />
Date<br />
Figure 3.2. Seasonal variation <strong>of</strong> water levels in Kraemer quarry wells.<br />
Figure 3.3. Historic water levels in Kraemer quarry.<br />
30
Figure 3.4. Water levels at drawdown in Kraemer quarry wells.<br />
Prior to quarrying <strong>and</strong> pumping in this area, ground water flowed from the upl<strong>and</strong> toward the<br />
Minnesota River, sustaining a series <strong>of</strong> wetl<strong>and</strong>s parallel to the river along its flowpath.<br />
Currently, water flows radially into the quarry from at least the south <strong>and</strong> west. Flow information<br />
is lacking for areas around some <strong>of</strong> the quarry perimeter; however, given the seepage faces seen<br />
around the quarry, it can be assumed that water is flowing into the quarry from all sides. Most<br />
emerges from the south <strong>and</strong> west sides <strong>of</strong> the pit. Because water levels in the quarry are lower<br />
than the water level in the Minnesota River, ground water flows into the quarry from the river on<br />
the north side.<br />
Blasting <strong>Impacts</strong><br />
Turbidity in the drilled wells was measured with an instrument that can be left in the well to<br />
record changes in turbidity. Throughout the monitoring period, no significant changes in turbidity<br />
were observed. It is possible that no significant changes occurred because <strong>of</strong> the lack <strong>of</strong><br />
variability in pumping <strong>and</strong> water levels at the site. Monitoring wells such as those at the Kraemer<br />
quarry are rarely if ever pumped. The stability <strong>of</strong> ground-water levels in this quarry <strong>and</strong> the<br />
stability <strong>of</strong> the pumping level within the quarry is not likely to suddenly dislodge particles that<br />
will result in higher turbidity because the water is moving at a relatively stable velocity. Little<br />
change in flow likely means little disruption to the matrix.<br />
31
We were also interested in turbidity changes in response to blasting events. In theory, particles in<br />
or near the well could be dislodged by the energy <strong>of</strong> the blast <strong>and</strong> cause cloudiness in the water,<br />
that is, increased turbidity. Several blasting events were monitored during summer 2002 <strong>and</strong> 2003<br />
along the southern portion <strong>of</strong> the west quarry face near the monitoring wells.<br />
Figure 3.5. Comparison <strong>of</strong> water levels <strong>and</strong> turbidity in Kraemer quarry wells.<br />
On August 8, 2002, blasting occurred below the water table. This event is characteristic <strong>of</strong> most<br />
<strong>of</strong> the data collected during such events. No response is seen in turbidity levels. Because the wells<br />
that are monitored in this case are relatively new, there may be little material present to be<br />
dislodged.<br />
The blasting results shown in Figure 3.5 reveal a slight change in water level immediately<br />
following the blast. A drop in ground-water level is observed that we attribute to the removal <strong>of</strong> a<br />
portion <strong>of</strong> the rock matrix.<br />
Kraemer Quarry Downhole Camera<br />
Given the inconclusive results <strong>of</strong> our turbidity monitoring <strong>and</strong> our determination that the<br />
condition <strong>of</strong> the well may be key to underst<strong>and</strong>ing the results, we deployed a downhole camera at<br />
Kraemer Quarry on April 7, 2005.<br />
Well 1 is the well closest to the quarry. When it was drilled, the casing terminated below the<br />
water table. At the time the well was videologged, the water table was approximately 3 feet below<br />
the bottom <strong>of</strong> the casing. This was a very visible impact <strong>of</strong> rock removal in the quarry that<br />
lowered the water table. The well casing was intact with no apparent damage. One bedrock void<br />
32
was noted 94 ft below l<strong>and</strong> surface but there was no visible flow. The well had much particulate<br />
matter in the form <strong>of</strong> mats <strong>of</strong> orange-white material, particles, <strong>and</strong> areas where the particulate<br />
literally formed clouds in the well. The logging terminated at the bottom <strong>of</strong> the well at 99 ft.<br />
Well 2 is also on the quarry property. The water table was above the casing on this date. The well<br />
casing was intact with no apparent damage. Like well 1, this well had much particulate matter in<br />
the form <strong>of</strong> mats <strong>of</strong> orange-white material, particles, <strong>and</strong> areas where the particulate literally<br />
formed clouds in the well. Bedrock voids were noted at 73.4 ft, 78.7 ft, 81 ft, <strong>and</strong> 82.4 ft. The<br />
void at 73.4 ft was the only one where flow could be observed. As the camera went down the<br />
well, particles would slowly settle alongside the camera. At this void, the particles were being<br />
pushed into the well by inward flow <strong>of</strong> ground water. The logging terminated at the bottom <strong>of</strong> the<br />
well.<br />
Well 3 is <strong>of</strong>f-site to the south <strong>of</strong> the quarry. The water table was above the casing on this date.<br />
The well casing was intact with no apparent damage. Like the other two wells, this well had much<br />
particulate matter in the form <strong>of</strong> mats <strong>of</strong> orange-white material, particles, <strong>and</strong> areas where the<br />
particulate literally formed clouds in the well. Voids were encountered at 63 ft to 65 ft with no<br />
visible flow. Below this depth, the water became significantly clearer as the visible amount <strong>of</strong><br />
particulates dropped by several orders <strong>of</strong> magnitude. Voids were also encountered at 74.2 ft, 75<br />
ft, 81 ft, <strong>and</strong> 82.5 ft. The void from 81 ft to 82.5 ft was so large that it encompassed about half <strong>of</strong><br />
the drill hole. No flow was visible from these voids. At 87 ft, we encountered a larger bedrock<br />
ledge at the base <strong>of</strong> a void. This void appeared to have alluvial gravel material on its floor. This<br />
ledge was so large that it would have made camera retrieval problematic if the camera was<br />
lowered past it. Therefore, logging was terminated at 87 ft.<br />
Conclusions<br />
Dewatering at this quarry has pr<strong>of</strong>oundly affected ground-water levels in the Prairie du Chien<br />
aquifer in the area around the quarry. The primary impact <strong>of</strong> dewatering is the alteration <strong>of</strong> the<br />
water table <strong>and</strong> resulting draining <strong>of</strong> adjacent wetl<strong>and</strong>s.<br />
The lack <strong>of</strong> turbidity change indicates that the turbidity levels were fairly constant <strong>and</strong> probably<br />
more related to the density <strong>of</strong> bacterial mats floating in the well than anything that happened in<br />
the aquifer. Even with frequent blasting, turbidity wasn’t observed to be a problem at the site.<br />
Quarrying operations had no visible impact on the integrity <strong>of</strong> the observation well’s casing. The<br />
casings all appeared to be intact <strong>and</strong> in good condition. No holes, ruptures, or seam failures were<br />
visible.<br />
Based on this work, future monitoring projects should use videologging prior to the start <strong>of</strong><br />
monitoring. In this case <strong>and</strong> if monitoring is resumed in these wells, turbidity loggers could in<br />
particular be placed at the active conduit in Kraemer well 2 <strong>and</strong> in the large void zone in Kraemer<br />
well 3. This fine-tuning <strong>of</strong> instrument placement may allow more accurate data to be obtained.<br />
These video logs will also serve as a point <strong>of</strong> reference when DNR Waters staff run the camera<br />
down these wells again in 3 to 5 years.<br />
33
SECTION 4. GOLBERG QUARRY—PRAIRIE DU CHIEN LIMESTONE<br />
Figure 4.1. Site by aerial photograph.<br />
<strong>Impacts</strong> on Water Levels<br />
The two drilled wells on the quarry site (Figure 4.1) were measured several times per month<br />
during quarrying activities, <strong>and</strong> pressure transducers measured water levels at 15-minute<br />
intervals. The quarry company does not turn <strong>of</strong>f the pumps during winter, <strong>and</strong> the quarry<br />
expansion toward the wells has removed rock, which has caused ground-water levels to decline.<br />
Ground-water levels usually rise seasonally during late spring or early summer from snowmelt<br />
(Figure 4.2).<br />
35
Golberg Quarry Wells<br />
907.00<br />
894.00<br />
Water Elevation East Well (ft)<br />
906.00<br />
905.00<br />
904.00<br />
903.00<br />
902.00<br />
901.00<br />
900.00<br />
899.00<br />
East<br />
West<br />
892.00<br />
890.00<br />
888.00<br />
886.00<br />
884.00<br />
882.00<br />
Water Elevation West Well (Ft)<br />
898.00<br />
880.00<br />
12/25/01 07/13/02 01/29/03 08/17/03 03/04/04 09/20/04 04/08/05<br />
Date<br />
Figure 4.2. Seasonal variation <strong>of</strong> water levels in Golberg quarry wells.<br />
Blasting <strong>Impacts</strong><br />
Blasting events were monitored during 2002 while the pit was exp<strong>and</strong>ed north. Similar to results<br />
at the Kraemer site, ground-water levels changed immediately following the blast (Figure 4.3).<br />
We were also interested in turbidity changes in response to blasting events. In theory, particles in<br />
or near the well could be dislodged by the energy <strong>of</strong> the blast <strong>and</strong> cause cloudiness in the water,<br />
that is, increased turbidity. Several blasting events were monitored during summer 2002 while<br />
active blasting occurred along the quarry face near the monitoring wells. There was no effect<br />
from blasting on turbidity levels. Because the wells that are monitored in this case are relatively<br />
new, there may be little material present to be dislodged.<br />
36
Figure 4.3. <strong>Impacts</strong> <strong>of</strong> blasting on water levels in Golberg quarry wells.<br />
Historically, ground water flowed from the northeast to the southwest, toward the Zumbro River.<br />
The dewatering <strong>and</strong> excavation <strong>of</strong> the quarry has lowered ground-water levels about 40 feet at the<br />
north side <strong>of</strong> the quarry (Figure 4.4). This drawdown is a result <strong>of</strong> quarry operations since no<br />
other large water users are in the immediate area.<br />
37
Figure 4.4. Historic water levels in Golberg Quarry.<br />
Golberg Quarry Downhole Camera<br />
Well 1 is on the quarry property on the north side <strong>of</strong> the mining area. The water table was above<br />
the casing on this date. The well casing was intact with no apparent damage. The well had much<br />
particulate matter in the form <strong>of</strong> mats <strong>of</strong> orange-white material, particles, <strong>and</strong> areas where the<br />
particulate literally formed clouds in the well. Voids were visible at 109 ft, 121 ft, <strong>and</strong> 129 ft.<br />
There was no evidence <strong>of</strong> flow at any <strong>of</strong> these points.<br />
Well 2 is on the quarry property on the north side <strong>of</strong> the mining area to the west <strong>of</strong> well 1. The<br />
water table was above the casing on this date. The well casing was intact with no apparent<br />
damage. The well had much particulate matter in the form <strong>of</strong> mats <strong>of</strong> orange-white material,<br />
particles, <strong>and</strong> areas where the particulate literally formed clouds in the well. Prominent voids<br />
were encountered at 127.5 ft <strong>and</strong> 151.5 ft; neither point had evidence <strong>of</strong> flow.<br />
38
Conclusions<br />
The primary impact <strong>of</strong> the quarry is a continual decline in water levels in the Prairie du Chien<br />
aquifer from historical levels. Additionally, most wells were drilled after state rules were<br />
developed to prevent the drilling <strong>of</strong> wells into the first aquifer in karst terrains. These rules were<br />
designed to protect the wells from contamination from surface sources, but they also protect the<br />
wells from the quarry dewatering. Quarrying operations had no visible impact on the integrity <strong>of</strong><br />
the observation well’s casings. The casings all appeared to be intact <strong>and</strong> in good condition. No<br />
holes, ruptures, or seam failures were visible. Blasting had no impact on turbidity levels in the<br />
monitoring wells onsite.<br />
39
SECTION 5. SPINLER QUARRY—GALENA LIMESTONE<br />
Figure 5.1. Site by aerial photograph.<br />
<strong>Impacts</strong> on Water Levels<br />
Over the course <strong>of</strong> the study, the water levels in 11 wells (six wells in three well nests <strong>and</strong> five<br />
other wells) at the site (Figure 5.1) were monitored for changes due to pumping <strong>and</strong> seasonal<br />
variation. Six wells in three well nests around the quarry provide information about vertical<br />
directions <strong>of</strong> ground-water movement (Figures 5.2, 5.3, <strong>and</strong> 5.4).<br />
41
Spinler Pit Nest 1<br />
1155<br />
Water Level Elevation (Ft)<br />
1150<br />
1145<br />
1140<br />
1135<br />
P1<br />
M1<br />
1130<br />
11/5/01 5/24/02 12/10/02 6/28/03 1/14/04 8/1/04 2/17/05<br />
Date<br />
Figure 5.2. Seasonal variation <strong>of</strong> water levels in Spinler well nest 1.<br />
P1 is a shallow well in the s<strong>and</strong> <strong>and</strong> gravel aquifer, <strong>and</strong> M1 is a deep well in the Galena<br />
limestone. They are separated by a thick clay layer, which results in two distinct aquifers. The<br />
quarry company is pumping from the lower aquifer, represented by M1, into a series <strong>of</strong> settling<br />
ponds that feed the upper aquifer, represented by P1. Water levels do not fluctuate much from<br />
year to year because the company has not been operating any deeper <strong>and</strong> keeps the pumps<br />
running almost constantly. The pumping <strong>of</strong> water into the higher aquifer also keeps the cone <strong>of</strong><br />
depression from extending too far west.<br />
42
Spinler Pit Nest 2<br />
1150<br />
Water Level Elevation (Ft)<br />
1149<br />
1148<br />
1147<br />
1146<br />
1145<br />
1144<br />
P2<br />
M2<br />
1143<br />
11/5/01 5/24/02 12/10/02 6/28/03 1/14/04 8/1/04 2/17/05<br />
Date<br />
Figure 5.3. Seasonal variation <strong>of</strong> water levels in Spinler well nest 2.<br />
Spinler Pit Nest 3<br />
Water Level Elevation (Ft)<br />
1146<br />
1144<br />
1142<br />
1140<br />
1138<br />
1136<br />
1134<br />
1132<br />
1130<br />
1128<br />
1126<br />
1124<br />
11/5/01 5/24/02 12/10/02 6/28/03 1/14/04 8/1/04 2/17/05<br />
Date<br />
P3<br />
M3<br />
Figure 5.4. Seasonal variation <strong>of</strong> water levels in Spinler well nest 3.<br />
43
The ground-water levels at the site on September 15, 2004, were fairly representative <strong>of</strong> levels in<br />
late summer (Figure 5.5). Ground water flows from the surrounding areas into the pit; the groundwater<br />
model indicates that a portion <strong>of</strong> the flow from the Straight River is pirated by the quarry.<br />
Stream gaging was completed on the Straight River both upstream <strong>and</strong> downstream <strong>of</strong> the pit, <strong>and</strong><br />
the differences were within the measurement error <strong>of</strong> the equipment. Results <strong>of</strong> stream gaging<br />
indicate that the loss <strong>of</strong> water from the river at this time is minimal.<br />
Figure 5.5. Water levels at drawdown in Spinler quarry wells.<br />
.<br />
Ground-water levels measured June 1, 2005, show a much different scenario (Figure 5.6). The<br />
company apparently had allowed water levels within the quarry to rise to nearly normal levels.<br />
The water level was still depressed in the vicinity <strong>of</strong> the quarry, but there was much less water<br />
coming from the direction <strong>of</strong> the river.<br />
Since water levels have risen in the quarry <strong>and</strong> the lower aquifer, the lower aquifer has changed<br />
from being recharged by the upper aquifer to discharging to the upper aquifer in the vicinity <strong>of</strong><br />
the quarry.<br />
44
Figure 5.6. Water levels in Spinler quarry, 2005.<br />
Historically, water levels in the upper aquifer in the vicinity <strong>of</strong> the pit have been about 1155 ft<br />
above mean sea level, about 10 ft above the current level being maintained by quarry pumping<br />
(Figure 5.7). Prior to farming <strong>and</strong> quarrying activities, water levels were probably just below the<br />
ground surface; however, ditches were dug throughout the area to lower the water table <strong>and</strong><br />
improve crop productivity.<br />
Due to the complex site geology <strong>and</strong> hydrology, additional analysis <strong>of</strong> the impacts <strong>of</strong> the quarry<br />
<strong>and</strong> its dewatering was done using three-dimensional s<strong>of</strong>tware. Those results are presented in<br />
Appendix 2.<br />
45
Figure 5.7. Historic water levels in upper aquifer, Spinler Quarry.<br />
Spinler Quarry Downhole Camera<br />
Equipment breakdown prevented the videologging <strong>of</strong> these wells prior to the conclusion <strong>of</strong> the<br />
project.<br />
Conclusions<br />
Quarrying operations have penetrated two aquifers. Ground-water pumping has changed the<br />
hydraulic gradient in the vicinity <strong>of</strong> the quarry. The lower water levels could affect domestic<br />
wells in the immediate area. With ground-water levels dropping, water is flowing from the<br />
Straight River into the upper aquifer; historically, the river gained water from the local groundwater<br />
system.<br />
46
SECTION 6. FOUNTAIN QUARRY—GALENA LIMESTONE<br />
Figure 6.1. Site by aerial photograph.<br />
Fountain quarry operations normally take place above the water table although the quarry (Figure<br />
6.1) occasionally floods from ground water discharging into it from the conduits below. In the<br />
quarry, there are four open joints in the floor. These joints have water flowing through them<br />
except during the driest parts <strong>of</strong> the year. Prior to this project, the University <strong>of</strong> Minnesota<br />
Department <strong>of</strong> Geology <strong>and</strong> Geophysics, in cooperation with DNR Waters, demonstrated by dye<br />
tracing that these joints connect to the nearby Fountain Big Spring on Riceford Creek. During this<br />
project, turbidity levels in the spring were monitored to assess the impact <strong>of</strong> dry quarry operations<br />
<strong>and</strong> blasting events.<br />
Previous Investigations<br />
Turbidity <strong>Impacts</strong><br />
Several hundred yards north <strong>and</strong> west <strong>of</strong> the Fountain quarry lies the Fountain Big Spring<br />
complex (Figure 6.2). These springs are the discharge point for the Fountain springshed. Water<br />
sinks in the upl<strong>and</strong>s in sinkholes <strong>and</strong> through the soil mantle <strong>and</strong> flows through fractures <strong>and</strong><br />
solution-enlarged conduits to the springs. The Fountain Big Spring is part <strong>of</strong> a complex <strong>of</strong> four<br />
springs that has a mapped springshed <strong>of</strong> approximately 2900 acres. This basin was delineated by<br />
47
dye tracing work for the Fillmore <strong>County</strong> Geologic Atlas; the longest straight-line dye trace was<br />
from a sinkhole 2.9 miles from the spring complex.<br />
Prior to this study, the University <strong>of</strong> Minnesota Department <strong>of</strong> Geology <strong>and</strong> Geophysics, in<br />
cooperation with DNR Waters, ran a dye trace from a joint in the quarry floor to the spring. The<br />
dye was poured into a flowing stream at the base <strong>of</strong> the joint in the east end <strong>of</strong> the quarry. Prior to<br />
the trace, background direct water samples were taken at the spring to check for natural<br />
fluorescence. After the dye was poured into the conduit, University <strong>of</strong> Minnesota students took<br />
direct water samples at the spring every 15 minutes for 24 hours. The concentrations <strong>of</strong> those<br />
samples were analyzed with a Turner filter fluorometer. The dye took approximately 12 hours to<br />
travel 1900 ft in straight-line distance to the spring (E.C. Alex<strong>and</strong>er, Jr., University <strong>of</strong> Minnesota,<br />
oral commun., 2005).<br />
Project Investigations<br />
Figure 6.2. Fountain Big Spring.<br />
During our project studies, the discharge <strong>of</strong> the Big Spring was monitored for turbidity changes<br />
from blasting events at the quarry. Two blasting events were captured: one with a Global Water<br />
WQ series h<strong>and</strong>held turbidity meter <strong>and</strong> the second with a Global Water WQ series turbidity<br />
sensor, which was left in the spring. Additional blasts were measured with a Greenspan TS series<br />
turbidity sensor, but equipment failure prevented data retrieval. A weather station was installed at<br />
the quarry to measure precipitation falling on the quarry floor.<br />
On November 4, 2002, Milestone Materials Division <strong>of</strong> Mathy Construction blasted rock on the<br />
west end <strong>of</strong> the Fountain Quarry. DNR staff at the Big Spring using a h<strong>and</strong>held turbidity meter<br />
made measurements prior to the blast, for approximately 2.5 hours after the blast, <strong>and</strong> the next<br />
day. Results in Figure 6.3 indicate that the turbidity level in the spring increased rapidly after the<br />
48
Figure 6.3. Fountain Big Spring turbidity after November 4, 2002 blast.<br />
blast. In the first 20 minutes after the blast, the turbidity level more then tripled. Based on the<br />
ground-water travel time from the dye tracing work, this increase was not due to material moving<br />
from the quarry. Our explanation is that the shock wave from the blast put fine sediment in the<br />
conduit system into suspension. This suspended material then moved through the conduits <strong>and</strong><br />
was discharged at the spring.<br />
On October 5, 2004, another blast on the west end <strong>of</strong> the quarry was captured with a Global<br />
Water WQ series turbidity sensor. The instrument was programmed to read turbidity every 15<br />
minutes. Approximately 1.5 hours after the blast, the turbidity level increased by 4 nephelometric<br />
turbidity units (NTUs) from 23 to 27 (Figure 6.4). The turbidity peaked at 32 NTUs 7.5 hours<br />
after the blast. The level dropped back down to 27 NTU <strong>and</strong> then went back up to approximately<br />
32 NTU. Our explanation for this event is similar to that <strong>of</strong> the November 4, 2002 blast. Material<br />
in the conduit is shaken loose <strong>and</strong> transported by turbulent flow to the spring.<br />
49
Figure 6.4. Fountain Big Spring turbidity after October 5, 2004 blast.<br />
Before it was stolen, the Greenspan TS series turbidity sensor recorded turbidity changes during<br />
spring from rain events (Figure 6.5). Several large rainfall events provided the opportunity to<br />
study the effects <strong>of</strong> precipitation on turbidity. The majority <strong>of</strong> the precipitation events caused the<br />
turbidity to rise between 12 hours <strong>and</strong> 16 hours following the onset <strong>of</strong> precipitation; however,<br />
when the system was primed by antecedent rainfall, the effect could be seen in less than 6 hours.<br />
Most increases in measurable turbidity were on the order <strong>of</strong> 10 NTUs, but the largest events<br />
increased the turbidity above 600 NTUs. The true magnitude <strong>of</strong> these events is unknown because<br />
the maximum turbidity exceeded the upper measurement limit <strong>of</strong> the turbidity sensor. In general,<br />
the response from precipitation is much larger than the response following blasting.<br />
50
Storm Induced Turbidity Response<br />
Fountain Big Spring<br />
Turbidity (NTU<br />
700<br />
600<br />
500<br />
400<br />
300<br />
200<br />
100<br />
0.8<br />
Turbidity<br />
Cumulative Precip 0.7<br />
0.6<br />
0.5<br />
0.4<br />
0.3<br />
0.2<br />
0.1<br />
Cumulative Precip (in)<br />
0<br />
0<br />
6/22/03 6/24/03 6/26/03 6/28/03 6/30/03 7/2/03 7/4/03 7/6/03 7/8/03 7/10/03<br />
Date<br />
Figure 6.5. Fountain Big Spring turbidity response to rain.<br />
Conclusions<br />
The turbidity data indicate an impact from blasting on the water flowing through the conduit<br />
system to the spring. Based on our knowledge <strong>of</strong> ground-water travel time in this system, this<br />
material comes into suspension in the limestone’s joints <strong>and</strong> fractures because <strong>of</strong> the blasting.<br />
Essentially, the shaking <strong>of</strong> the rock causes some fine-grained material to go into suspension<br />
where it is already present, then the material is carried to the spring. This same mechanism could<br />
also provide for turbidity spikes in domestic wells. Those wells would need to be finished in the<br />
surficial limestone layer <strong>and</strong> be open to solution-enlarged joints <strong>and</strong> fractures with significant<br />
flow. This describes many wells completed in southeastern Minnesota before enactment <strong>of</strong> the<br />
state well code; typically, owners <strong>of</strong> those wells have complained about the effects <strong>of</strong> blasting.<br />
These types <strong>of</strong> wells need to be considered when evaluating other quarrying operations in<br />
limestone terrains. Another mechanism <strong>of</strong> blasting-induced turbidity in domestic wells is the<br />
shaking <strong>of</strong> precipitates from the inside <strong>of</strong> the casing.<br />
Normal quarrying operations above the water table did not appear to increase turbidity in the Big<br />
Spring. Precipitation events can also increase turbidity in the conduit system; at this site, those<br />
impacts were much larger than those <strong>of</strong> blasting. In the case <strong>of</strong> a domestic well owner<br />
complaining about turbidity from blasting, this effect would also need to be monitored.<br />
51
SECTION 7. HARMONY BIG SPRING QUARRY—GALENA LIMESTONE<br />
Figure 7.1. Site by aerial photograph.<br />
Previous Investigations<br />
Dye traces were conducted in the area as part <strong>of</strong> the Fillmore <strong>County</strong> Geologic Atlas mapping<br />
effort (Alex<strong>and</strong>er <strong>and</strong> others, 1995) by the Minnesota Department <strong>of</strong> Natural Resources. This<br />
work was an attempt to map the basins feeding some <strong>of</strong> the large springs in the county.<br />
Boundaries between the Big Spring basin <strong>and</strong> other basins were partially established during this<br />
project. The Big Spring basin lies between the Odessa basin to the south, the Engle Spring basin<br />
to the west, <strong>and</strong> the Hart Spring <strong>and</strong> Buggywhip Spring basins to the east. During this research,<br />
we knew that we had not located all <strong>of</strong> the basin boundaries nor had we dye traced from the<br />
sinkhole plain area that extends north <strong>and</strong> east from the quarry site (Figure 7.1).<br />
<strong>Impacts</strong> on Ground-Water Flow Paths<br />
Project Investigations<br />
As part <strong>of</strong> this research project, we have been using dye tracing to refine the existing basin<br />
boundary map <strong>and</strong> determine how much <strong>of</strong> the basin area is being routed through the quarry<br />
(Green <strong>and</strong> others, 2003). Tracing was also done in the quarry to determine internal flow paths.<br />
The internal traces were run from sinking points on the west <strong>and</strong> east sides <strong>of</strong> the quarry. The<br />
trace from the west side, done under high-flow conditions, demonstrated that water sinking in the<br />
southwest part <strong>of</strong> the quarry emerges at the Big Spring. Because this trace was done under high-<br />
53
flow conditions, some <strong>of</strong> the water <strong>and</strong> dye returned to the surface in the quarry itself. Under<br />
normal- <strong>and</strong> low-flow conditions, water does not return in the quarry. Water on the east side <strong>of</strong><br />
the quarry discharges primarily from spring A238 (Big Spring East). The water flows into a pond<br />
where some <strong>of</strong> it sinks into a stream sink, B11, in the bed <strong>of</strong> the pond. A dye trace from the pond<br />
confirmed that water does sink in the bed <strong>of</strong> the pond; the water that does not sink flows out <strong>of</strong><br />
the quarry in a surface stream that joins Camp Creek. Dye traces were also run from four upl<strong>and</strong><br />
sinkholes. These traces were performed to further refine the boundaries <strong>of</strong> the Big Spring basin<br />
<strong>and</strong> document the extent <strong>of</strong> the basin area that has been pirated by the quarry. The rate <strong>of</strong> groundwater<br />
movement during these traces was 1,635 feet per day to 3,270 feet per day. The results <strong>of</strong><br />
the tracing are shown in Figure 7.2.<br />
The quarry has had a pr<strong>of</strong>ound impact on the local ground-water flow system. Based on the 1995<br />
springshed map in the geologic atlas <strong>and</strong> the additional tracing work done as part <strong>of</strong> this project,<br />
approximately 90% <strong>of</strong> the flow in the Big Spring basin is now being routed through the quarry.<br />
This exposes the conduit water to thermal impacts <strong>and</strong> makes it more vulnerable to pollution from<br />
quarrying activities.<br />
Figure 7.2. Springshed dye trace map.<br />
54
<strong>Impacts</strong> on Water Temperature<br />
The impact <strong>of</strong> the conduit piracy on water temperature was also a concern. Trout are a cold-water<br />
species <strong>and</strong>, as noted previously, Camp Creek is a designated trout stream. In order for a stream<br />
to be considered cold water, the long-term temperature maximum cannot exceed 70 degrees<br />
Fahrenheit (F) (21 Celsius [C]). Peak daily temperatures cannot exceed 75 F (23.8 C). If these<br />
thresholds are exceeded, the stream will not be able to sustain a viable trout population. Through<br />
this project, we have begun to document the quarry impacts on the spring <strong>and</strong> stream.<br />
A round <strong>of</strong> temperature measurements was taken July 15, 2003, to begin quantifying the thermal<br />
impacts on the ground-water system. Figure 7.3 shows the results <strong>of</strong> that monitoring. Water<br />
emanating from A238 (the main discharge point on the east side <strong>of</strong> the quarry) was about 49 F<br />
(9.3 C). As it flowed through the quarry <strong>and</strong> into the quarry pond, it warmed to a measured<br />
maximum <strong>of</strong> about 70 F (21.3 C). The water flowing out <strong>of</strong> the quarry via the surface stream was<br />
about 64.5 F (18.6 C) (several other springs in the quarry also discharge to this stream). The<br />
temperature <strong>of</strong> Big Spring, the headwater spring <strong>of</strong> Camp Creek, was about 56 F (13.6 C). In<br />
contrast, Little Big Spring, which has not had its basin pirated by the quarry, was 48.2 F (9 C).<br />
The warming <strong>of</strong> the water at the stream’s headwater spring could have significant impacts on the<br />
stream’s ecosystem.<br />
Project funds have been used to purchase thermochrons (button-size temperature recorders); they<br />
will be used to continue the thermal impact monitoring at this site after the project ends.<br />
Figure 7.3. Temperature (degrees Celsius) monitoring results.<br />
55
Conclusions<br />
By using dye tracing, we were able to document <strong>and</strong> quantify the scope <strong>of</strong> spring piracy at the<br />
Big Spring quarry. Based on available information, roughly 90% <strong>of</strong> the basin is now being routed<br />
through the quarry. Without any dewatering occurring, this quarry has significantly altered<br />
ground-water flow paths. The water surfacing in the quarry is significantly affected by the surface<br />
air temperature, changing the thermal regime <strong>of</strong> the Big Spring <strong>and</strong> the upper reaches <strong>of</strong> Camp<br />
Creek.<br />
56
SECTION 8. DONOVAN PIT—ALLUVIAL SAND AND GRAVEL<br />
Figure 8.1. Site by aerial photograph.<br />
Monitoring began at the Donovan gravel pit (Figure 8.1) because local residents had expressed<br />
concerns regarding the impacts <strong>of</strong> gravel pits on local ground water. Operations in the pit started<br />
working below the ground water in March 2003.<br />
S<strong>and</strong> <strong>and</strong> gravel pits in alluvial settings are vulnerable to flooding. This highlights the importance<br />
<strong>of</strong> good surveys <strong>of</strong> site elevations <strong>and</strong> site planning before a pit opens. These preparations will<br />
help prevent flooding from inundating equipment <strong>and</strong> buildings on the site. Floods in May 2003<br />
<strong>and</strong> September 2004 overtopped the banks <strong>of</strong> the Zumbro River <strong>and</strong> flooded the Donovan pit<br />
(Figure 8.2). These events resulted in ground-water levels rising more than 6 feet; however, at the<br />
peak, the floodwaters were much deeper <strong>and</strong> had completely flooded over the wells.<br />
57
Figure 8.2. Floodwaters in the Donovan Pit in 2003.<br />
<strong>Impacts</strong> on Water Levels<br />
Mining below the water table in the pit has done little to affect the quantity <strong>of</strong> water flowing to<br />
the Zumbro River (Figure 8.3) <strong>and</strong> has not affected upgradient domestic wells (Figures 8.4a, b, c,<br />
d based on an assumed datum <strong>of</strong> 100 ft). In areas <strong>of</strong> complex stratigraphy with abundant clay <strong>and</strong><br />
a high topographic gradient, the loss <strong>of</strong> s<strong>and</strong> <strong>and</strong> gravel possibly could affect ground-water levels<br />
substantially; however, alluvial deposits are not very likely to have the significant deposits <strong>of</strong> clay<br />
<strong>and</strong> the topographic gradient is slight.<br />
The open water does increase the possibility <strong>of</strong> ground-water contamination if a spill were to<br />
occur. The ground water is only about 6 feet below the ground surface, so if a spill were to occur<br />
on l<strong>and</strong>, it could contaminate the ground water because 6 feet does not allow enough time to<br />
remedy the contamination.<br />
58
Figure 8.3. Ground-water levels in the Donovan pit.<br />
59
Figure 8.4a. Water levels, nest 1.<br />
Figure 8.4b. Water levels, nest 2.<br />
60
Figure 8.4c. Water levels, nest 3.<br />
Figure 8.4d. Water levels, nest 4.<br />
61
<strong>Impacts</strong> on Water Temperature<br />
Early in this project, the monitoring at this site focused on the influence <strong>of</strong> the pit pond on<br />
ground-water levels <strong>and</strong> ground-water quality. As the project progressed, the focus shifted to the<br />
thermal impacts <strong>of</strong> the pit pond on ground-water temperatures in the s<strong>and</strong> <strong>and</strong> gravel aquifer <strong>and</strong><br />
the influence that had on the thermal characteristics <strong>of</strong> the Zumbro River. This change resulted<br />
after DNR Ecological Services voiced concerns about the impacts <strong>of</strong> mining on threatened mussel<br />
species that had been found during biological surveys <strong>of</strong> the Zumbro River in this area.<br />
In order to assess the thermal impacts, project staff began measuring water temperatures in the pit<br />
pond <strong>and</strong> the four shallow monitoring wells at the site. Ground-water temperatures in southern<br />
Minnesota typically are fairly stable at approximately 48 F. Data displayed in Figure 8.5 indicate<br />
there are significant fluctuations in ground-water temperature in the wells onsite. However, there<br />
was no apparent pattern to the variations. Wells 2S <strong>and</strong> 3S are upgradient <strong>of</strong> the pit while wells<br />
1S <strong>and</strong> 4S are downgradient. Since we could not draw any conclusions from this monitoring, staff<br />
purchased thermochrons (button-size temperature monitors) to deploy into the wells, pit, <strong>and</strong> river<br />
in order to continue this monitoring after the project concluded. These devices can measure the<br />
temperature fluctuations with minimal maintenance. They are designed to be left in the field yearround<br />
<strong>and</strong> will provide a more comprehensive picture <strong>of</strong> the thermal impacts <strong>of</strong> this pit.<br />
To enhance future thermal modeling efforts, project staff also directly measured ground-water<br />
time <strong>of</strong> travel in the s<strong>and</strong> <strong>and</strong> gravel deposit using a ground-water tracer. Using the observation<br />
well water level data <strong>and</strong> the water surface elevation <strong>of</strong> the pond, staff were able to determine the<br />
relative ground-water flow direction in the s<strong>and</strong> <strong>and</strong> gravel. Initially, project staff intended to<br />
pour a fluorescent dye into the pit pond <strong>and</strong> use well 2, 2S, <strong>and</strong> 4S as sampling points. After<br />
further review, that idea was ab<strong>and</strong>oned, as there was no guarantee that the dye plume from the<br />
pond would intersect with the wells.<br />
Subsequently, staff decided to use open trenches in the water table perpendicular to the groundwater<br />
flow direction for dye injection <strong>and</strong> sampling. The trenches were excavated with a backhoe<br />
by Milestone Materials Division <strong>of</strong> Mathy Construction. Uranine C was poured into trench 1<br />
(Figure 8.6); water samples were taken from trenches 2 <strong>and</strong> 3 daily. Six days after dye input,<br />
trench 2 had visible dye (Figure 8.7). The concentration visibly increased over the next several<br />
months. Sampling continued for several months after dye injection; no dye was detected in trench<br />
3. Sample analysis was performed with an Aquafluor h<strong>and</strong>held fluorometer. In late December<br />
2004, project staff had Milestone Materials staff fill the trenches so they would not remain open<br />
all winter <strong>and</strong> pose a safety hazard.<br />
62
Figure 8.5. Fluctuations in ground-water temperatures.<br />
Figure 8.6. Trench 1, dye injection point.<br />
63
Figure 8.7. Trench 1 (left) <strong>and</strong> trench 2 (right) dye sampling point.<br />
Conclusions<br />
Fluctuations in ground-water levels were observed in the monitoring wells onsite. There is no<br />
evidence that these fluctuations were due to mining activities. Based on the available data, the<br />
fluctuations resulted from precipitation events <strong>and</strong> are part <strong>of</strong> the normal response <strong>of</strong> a surficial<br />
aquifer to climatic variations. Temperature monitoring in the wells was inconclusive because <strong>of</strong><br />
the sporadic nature <strong>of</strong> the monitoring.<br />
The breakthrough curve for the dye trace is displayed in Figure 8.8. The dye plume did not<br />
intersect with trench 3, but the dye broke through to trench 2 in 80 to 100 hours based on the<br />
increase in dye concentrations. That indicates a ground-water travel time <strong>of</strong> approximately 1 ft<br />
per 10 hours or 2.5 ft per day. This is a reasonable value for a s<strong>and</strong> <strong>and</strong> gravel aquifer. Prior to the<br />
dye trace, project staff had measured water levels in the shallow wells <strong>and</strong> pond <strong>and</strong> had<br />
determined the ground-water elevations at each site with an assumed datum. This allowed staff to<br />
determine that the hydraulic gradient at the time <strong>of</strong> the survey was 0.003 feet per ft; the porosity<br />
<strong>of</strong> a sample <strong>of</strong> the material at the trench site was 0.27. Putting these numbers into Darcy’s<br />
equation along with the ground-water velocity gives a hydraulic conductivity <strong>of</strong> 1683 gallons per<br />
square ft per day. This number is well within the range <strong>of</strong> typical hydraulic conductivity values<br />
for an aquifer <strong>of</strong> this type (Heath, 1984). This value can be used in the future in coordination with<br />
the temperature monitoring to model the thermal flux from the pit pond to the Zumbro River.<br />
The dye did not break through to trench 3. Further investigation at the site by DNR Waters staff<br />
could not find any type <strong>of</strong> fine-grained sediments between trench 2 <strong>and</strong> trench 3 that would have<br />
slowed the ground-water velocity. Staff concluded that the dye plume traveled past the trench on<br />
its way to the Zumbro River.<br />
64
Figure 8.8. Breakthrough curve for the dye trace.<br />
This was the first dye trace in Minnesota where the analysis was performed with a h<strong>and</strong>held<br />
fluorometer (Figure 8.9). This device performed well <strong>and</strong> allowed rapid analysis <strong>of</strong> the samples.<br />
Without this device, completing the analysis would have required from weeks to months. Having<br />
the device <strong>and</strong> the ability to analyze the samples immediately after they were taken allowed staff<br />
to quickly determine the dye breakthrough curve.<br />
Using only visual analysis would have resulted in a slower ground-water velocity being<br />
calculated as the dye broke through at 2 orders <strong>of</strong> magnitude above background levels fully 24<br />
hours prior to its being visible. The device was also very beneficial for the trench 3 monitoring;<br />
staff were able to know that the dye had not broken through <strong>and</strong> were able to end the trace prior<br />
to the end <strong>of</strong> mining activities in the pit for the winter.<br />
65
Figure 8.9. H<strong>and</strong>held fluorometer.<br />
66
SECTION 9. LEITZEN-GRABAU PIT—ALLUVIAL SAND AND GRAVEL<br />
Figure 9.1. Site by aerial photograph.<br />
Monitoring started at the Leitzen-Grabau pit (Figure 9.1) about the same time as at the Donovan<br />
pit. Concerns were expressed regarding the impacts <strong>of</strong> gravel pits on local ground water. At the<br />
Leitzen pit, most <strong>of</strong> the s<strong>and</strong> <strong>and</strong> gravel is available above the ground water so excavation<br />
significantly below the water table is not necessary.<br />
The peaks in monitoring well 3 (MW3) in 2003 <strong>and</strong> 2004 (Figure 9.2) are due to heavy rain<br />
events <strong>and</strong> show the natural variability <strong>of</strong> the ground water in the area. The ground water in the<br />
area functions similar to that found in the Donovan pit; however, it is higher on the l<strong>and</strong>scape <strong>and</strong><br />
above the floodplain. While ponding occurs frequently within the pit, it never floods more than 1<br />
or 2 ft deep. There is no indication that the gravel mining has had any impacts on ground-water<br />
levels in the area.<br />
67
Figure 9.2. Depth to water in Leitzen-Grabau wells.<br />
68
SECTION 10. FELTON PIT—GLACIAL BEACH RIDGE SAND AND GRAVEL<br />
Figure 10.1. Site by aerial photograph.<br />
The Felton study area has several active gravel pits, the largest <strong>of</strong> which is the Trust Fund Pit<br />
(Figure 10.1). The m<strong>and</strong>ate is to earn money for the School Trust Fund. Substantial high-value<br />
gravel resources have been identified below the water table in <strong>and</strong> surrounding the Felton area<br />
gravel mines.<br />
Monitoring work in this area was carried out in an effort to underst<strong>and</strong> the impacts <strong>of</strong> s<strong>and</strong> <strong>and</strong><br />
gravel mining on calcareous fen wetl<strong>and</strong>s. Two such wetl<strong>and</strong>s lie to the west <strong>of</strong> the mines <strong>and</strong><br />
about 30 feet lower in elevation. Calcareous fen wetl<strong>and</strong>s provide habitat for rare plants <strong>and</strong> are<br />
protected under Minnesota Statute 103G.223. The plants can only exist where there is a constant<br />
supply <strong>of</strong> nutrient-poor, carbonate-rich ground water <strong>and</strong> there must not be surface water inflows.<br />
It follows that mining-induced changes in ground-water <strong>and</strong> surface-water hydrology may be<br />
incompatible with the sustainability <strong>of</strong> calcareous fen wetl<strong>and</strong>s.<br />
The Felton study area provided an opportunity to study a calcareous fen in proximity to an active<br />
gravel mine (North Fen) while a second calcareous fen could serve as a control (South Fen).<br />
Mining adjacent to the North Fen had begun in 1959, while basic monitoring began in 1995.<br />
Declining quality <strong>of</strong> the North Fen was recorded in the late 1980s <strong>and</strong> early 1990s.<br />
69
As noted in Section 2, ground-water gradients were monitored at well nest locations in <strong>and</strong><br />
upgradient <strong>of</strong> each fen. Water levels were monitored at other single-well installations. A staff<br />
gage was installed in the Trust Fund Pit to record water levels in the gravel pit lake. Present-day<br />
water table elevations were recorded in wells <strong>and</strong> borings, while evidence <strong>of</strong> past water levels<br />
was noted on the l<strong>and</strong>scape <strong>and</strong> in wells <strong>and</strong> borings. Data from exploratory borings, well logs,<br />
<strong>and</strong> geophysical exploration were used to construct geologic cross sections.<br />
The cross sections reveal the subsurface along an approximate east to west trace (Figure 10.2).<br />
The North Fen is at the western edge <strong>and</strong> the Trust Fund Pit at the eastern edge <strong>of</strong> the A–A’ cross<br />
section (Figure 10.3), <strong>and</strong> the South Fen is at the western edge <strong>of</strong> the B–B’ cross section (Figure<br />
10.4). The blue trace <strong>of</strong> the water table in Figure 10.4 shows that the water table intersects the<br />
ground surface along the upper edge <strong>of</strong> the South Fen, where it still provides upwelling groundwater<br />
supply to the whole calcareous fen. The water table in Figure 10.3 intersects the ground<br />
surface within the North Fen, possibly depriving the calcareous fen <strong>of</strong> part <strong>of</strong> its premining water<br />
supply. Monitoring was designed to investigate these conditions.<br />
Monitoring began at this gravel mine because DNR ecologists had noted that the North Fen was<br />
no longer as high quality <strong>of</strong> a calcareous fen as the South Fen. The major change on the l<strong>and</strong>scape<br />
was upgradient gravel mining; thus, concern was expressed that mining had negatively affected<br />
the North Fen.<br />
70
Figure 10.2. Locations <strong>of</strong> cross sections in the Felton pit area.<br />
71
Figure 10.3. Geologic cross section along a trace between the North Fen<br />
<strong>and</strong> the Trust Fund <strong>Gravel</strong> Pit.<br />
72
Figure 10.4. Geologic cross section along a trace from the South Fen to the<br />
height <strong>of</strong> the beach ridge south <strong>of</strong> the Trust Fund Pit.<br />
73
<strong>Impacts</strong> on Ground-Water Flow Paths<br />
Mining in the pit has altered ground-water flow paths. The premining flow paths (Figure 10.5)<br />
were parallel, northwest-trending lines perpendicular to the beach ridge; simply put, ground water<br />
was flowing downhill. This flow pattern resulted in the creation <strong>of</strong> a seepage face at midslope<br />
where the water emerged at ground surface, keeping wet at all times the entire calcareous fen<br />
wetl<strong>and</strong>.<br />
Figure 10.5. Ground-water flow paths (blue) prior to mining.<br />
Figure 10.6 shows the current condition <strong>of</strong> the South Fen. Mining created a radial flow pattern<br />
toward the pit along its south <strong>and</strong> west borders, resulting in a diversion <strong>of</strong> some water that would<br />
have flowed toward the North Fen <strong>and</strong> resulting in a decline in the amount <strong>of</strong> ground water<br />
available to the North Fen.<br />
74
Figure 10.6. Ground-water flow paths (blue) during mining.<br />
<strong>Impacts</strong> on Water Table Elevations<br />
The decline in the water table elevation since the start <strong>of</strong> excavation below the water table is<br />
estimated to be approximately 15 feet. Note that this change has occurred without direct pumping<br />
from the pit for dewatering. The combination <strong>of</strong> the changes in flow paths <strong>and</strong> the decline in the<br />
water table has eliminated a portion <strong>of</strong> the ground-water basin <strong>of</strong> the North Fen. The groundwater<br />
basin <strong>of</strong> the South Fen has been affected to a lesser degree. The expression <strong>of</strong> this impact is<br />
seen in the hydrographs that show vertical ground-water gradients. An upward ground-water<br />
gradient underneath the calcareous fens provides the ground-water supply to the surface. Where<br />
75
there is an upward gradient, the water level in a deep well will rise higher than the water level in a<br />
shallow well. The greater the difference in these water levels, the greater is the pressure that<br />
moves the ground water upward.<br />
At the North Fen (Figure 10.7), the water level in the deeper well (1D) rises higher than the water<br />
level in the shallower well (1S); thus, there is an upward gradient. The difference between the two<br />
water levels is about 0.5 ft.<br />
970<br />
969<br />
968<br />
Water Level Elevation<br />
967<br />
966<br />
965<br />
1S<br />
#540953<br />
4'<br />
964<br />
1D<br />
#540954<br />
10'<br />
963<br />
Jun-94 Oct-95 Mar-97 Jul-98 Dec-99 Apr-01<br />
Date<br />
Figure 10.7. Vertical gradient at North Fen.<br />
At the South Fen (Figure 10.8), the water level in the deeper well (2D) rises about 1.5 ft higher<br />
than the water level in the shallower well (2S). The potential for ground-water upwelling is about<br />
three times greater at the upper edge <strong>of</strong> the South Fen (where these wells are located) than within<br />
the North Fen.<br />
76
982.5<br />
982<br />
981.5<br />
2S<br />
#567352<br />
4'<br />
2D<br />
#567353<br />
7.1'<br />
Water Level Elevation (ft)<br />
981<br />
980.5<br />
980<br />
979.5<br />
979<br />
978.5<br />
978<br />
Jun-94 Oct-95 Mar-97 Jul-98 Dec-99 Apr-01<br />
Date<br />
Figure 10.8. Vertical gradient at South Fen.<br />
<strong>Impacts</strong> on Surface-Water Flow <strong>and</strong> Water Quality<br />
Changes in the surface-water basin direct run<strong>of</strong>f into the mine pits <strong>and</strong> from there into a ditch<br />
system. Increased flows into the ditch system have caused headward erosion <strong>and</strong> caused beavers<br />
to be attracted to the area. Beaver dam construction <strong>and</strong> blowouts have caused fluctuations in the<br />
water table <strong>and</strong> have also caused overl<strong>and</strong> flows <strong>and</strong> sediment deposition into the wetl<strong>and</strong><br />
complex downgradient <strong>of</strong> the mine. The materials between the mine <strong>and</strong> the ditch are not known<br />
to be stable; thus, the possibility exists that the whole gravel mine lake could drain<br />
catastrophically.<br />
Conclusions<br />
Ground-water flow paths, water table elevations, ground-water gradients <strong>and</strong> both surface- <strong>and</strong><br />
ground-water basins have been altered by mining below the water table. Excavation <strong>of</strong> the pit has<br />
caused water levels to decline near the mine <strong>and</strong> downgradient <strong>of</strong> the mine. The effect, as much<br />
as a 15-foot water level decline, is due to redirection <strong>of</strong> ground-water flow to the pond <strong>and</strong> then to<br />
the ditch system <strong>and</strong> is due to evaporation from the pond surface.<br />
The mine is located above a steep slope where watershed changes have set up the potential for<br />
subsurface piping <strong>and</strong> dike failure, which could lead to the loss <strong>of</strong> the gravel pit lake, complete<br />
drainage <strong>of</strong> the North Fen, <strong>and</strong> significant impacts on the South Fen.<br />
77
Mining in the vicinity <strong>of</strong> calcareous fen wetl<strong>and</strong>s must be undertaken only after evaluation <strong>of</strong><br />
potential impacts on calcareous fens <strong>and</strong> planning to avoid those impacts.<br />
78
<strong>Hydraulic</strong> <strong>Impacts</strong> <strong>of</strong> <strong>Quarries</strong><br />
<strong>and</strong> <strong>Gravel</strong> <strong>Pits</strong><br />
II. Outcomes Sections<br />
1. Conclusions<br />
2. Recommendations to Local Government Units for <strong>Quarries</strong><br />
<strong>and</strong> <strong>Pits</strong>
SECTION 1. CONCLUSIONS<br />
Based on our project monitoring <strong>and</strong> investigations, we have reached the following conclusions<br />
about the hydrologic impacts <strong>of</strong> quarries <strong>and</strong> pits:<br />
Ground-Water Levels<br />
<strong>Impacts</strong> <strong>of</strong> <strong>Quarries</strong><br />
When limestone quarries are dewatered to allow mining below the water table, they alter groundwater<br />
levels <strong>and</strong> flow direction. In essence, the quarries become huge wells. Ground-water levels<br />
were found to have dropped up to 70 ft; this lowering <strong>of</strong> the ground-water levels can affect wells<br />
on neighboring properties <strong>and</strong> surface-water bodies. New quarries that will extract material below<br />
the water table will have to be sited carefully to avoid this impact, or a plan must be developed to<br />
provide an alternative water supply for property owners whose wells are affected.<br />
Ground-Water Flow Paths<br />
Limestone quarries can alter ground-water flow paths by the removal <strong>of</strong> the aquifer material <strong>and</strong><br />
the subsequent breaching <strong>of</strong> the limestone conduits without active dewatering <strong>of</strong> the quarry. At<br />
one site investigated, 90% <strong>of</strong> the ground-water basin’s flow is now surfacing in the quarry.<br />
Ground water that previously discharged at a spring now discharges in the quarry where it is<br />
exposed to quarrying activities. This premature surfacing <strong>of</strong> the ground water also alters its<br />
temperature, changing the temperature characteristics <strong>of</strong> the receiving stream <strong>and</strong> potentially<br />
affecting its aquatic life. Our investigations found this scenario most likely to occur when<br />
quarries are located upgradient from <strong>and</strong> close to springs.<br />
Modeling has shown that quarry dewatering at one site is drawing water from a nearby river.<br />
Additional impacts could not be assessed because <strong>of</strong> the lack <strong>of</strong> hydrologic data from areas<br />
surrounding the quarry. It is likely that the dewatering has decreased the yield <strong>of</strong> nearby wells at<br />
this site.<br />
Quarry Blasting<br />
Monitoring <strong>and</strong> visual inspections <strong>of</strong> the observation wells at two <strong>of</strong> the limestone quarry sites<br />
found no impact from quarry blasting on ground water turbidity or well integrity. Turbidity<br />
monitoring at a spring downgradient <strong>of</strong> one limestone quarry did find an increase in turbidity that<br />
could be attributed to quarry blasting; however, precipitation events had a greater impact on<br />
turbidity levels. Based on these findings, the domestic wells most likely to be affected by quarry<br />
blasting are older wells (completed before enactment <strong>of</strong> the state well code) finished in the<br />
surface limestone formation.<br />
Ground-Water Levels<br />
<strong>Impacts</strong> <strong>of</strong> <strong>Pits</strong><br />
Our monitoring found no negative impacts on ground-water levels from s<strong>and</strong> <strong>and</strong> gravel pits in<br />
alluvial deposits that operate below the water table but do not dewater. These pits will not affect<br />
the quantity <strong>of</strong> water available to shallow domestic wells on neighboring properties.<br />
3
In the complex geology <strong>of</strong> glacial beach ridge settings, the removal <strong>of</strong> s<strong>and</strong> <strong>and</strong> gravel can alter<br />
ground-water flow paths <strong>and</strong> affect the supply <strong>of</strong> water available to wetl<strong>and</strong>s that are fed by<br />
discharge from the s<strong>and</strong> <strong>and</strong> gravel.<br />
Ground-Water Temperature<br />
Open-water ponds created by s<strong>and</strong> <strong>and</strong> gravel mining change ground-water temperatures. The<br />
magnitude <strong>and</strong> extent <strong>of</strong> those changes is not yet known. This is an ongoing concern that needs<br />
further study.<br />
4
SECTION 2. RECOMMENDATIONS TO LOCAL GOVERNMENT UNITS<br />
FOR QUARRIES AND PITS<br />
The following list <strong>of</strong> questions <strong>and</strong> materials is designed to help local government staff <strong>and</strong><br />
<strong>of</strong>ficials focus on water resource issues when evaluating aggregate mining proposals. Other issues<br />
that need to be considered such as noise, dust, <strong>and</strong> road impacts are not included in this<br />
document. Much <strong>of</strong> the information required to answer the questions is obtained by mining<br />
companies prior to applying for a permit as they conduct their own site evaluations.<br />
Topography<br />
These questions will allow you to assess the mining company’s ability to identify any potential<br />
impacts <strong>of</strong> flooding or run<strong>of</strong>f in the affected area.<br />
• What is the slope <strong>of</strong> the area?<br />
• If the l<strong>and</strong> is sloping, where will run<strong>of</strong>f go?<br />
• Is the site in a floodplain?<br />
To answer these questions, a topographic map <strong>of</strong> the site should be provided. The map should<br />
include the following features:<br />
• Elevations<br />
• Roads<br />
• Surface-water bodies<br />
• Property lines<br />
• Buildings<br />
• Equipment <strong>and</strong> fuel storage areas<br />
If part <strong>of</strong> the property is in a floodplain, an accurate floodplain delineation based on site survey<br />
<strong>and</strong> hydrologic data should be included in order to assess the risk <strong>of</strong> inundation <strong>of</strong> the mine,<br />
equipment, <strong>and</strong> fuel storage areas.<br />
Geology<br />
These questions will allow you to assess the operation’s size, future expansion possibilities, depth<br />
<strong>of</strong> mining, <strong>and</strong> the potential for overburden stockpiling.<br />
• What is the size <strong>of</strong> the deposit?<br />
• How deep is it?<br />
• How much overburden is there?<br />
• Are there geologic boundaries (change from one type <strong>of</strong> material to another)?<br />
• Are there clay or shale units present that might act as aquitards?<br />
To answer these questions, a geologic map, at the appropriate scale should be supplied. It should<br />
display the following:<br />
• Areal extent <strong>and</strong> depth <strong>of</strong> the deposit<br />
• Geologic units <strong>and</strong> contacts<br />
• Confining units (clay, shale, siltstone)<br />
5
• Depth to bedrock (if applicable)<br />
• Cross-sections diagrams <strong>of</strong> the deposit <strong>and</strong> site<br />
• Fracture patterns <strong>and</strong> traces (rock quarries)<br />
• Test hole locations<br />
Hydrology<br />
These questions will allow you to assess the impact the proposed operation might have on wells<br />
<strong>and</strong> surface-water bodies.<br />
• What is the water table elevation in the deposit?<br />
• Which way is the water flowing through the deposit?<br />
• What aquifers are present?<br />
• Will the mine be wet or dry? That is, will it be dewatered?<br />
• Are there wells on the neighboring properties?<br />
• How deep are they?<br />
• Do they get their water from this deposit?<br />
• What is the likelihood for impact on these wells? It will be greater if they are in the same<br />
aquifer that the deposit is.<br />
• Are there surface-water bodies nearby that might be at risk?<br />
To answer these questions, a map should be supplied that displays the following:<br />
• Water-table elevations with ground-water flow direction<br />
• Wells with depth, static water level, age, <strong>and</strong> construction<br />
• Surface-water bodies <strong>and</strong> their elevation<br />
• Springs<br />
• Karst features (if applicable)<br />
• If the pit or quarry is to be dewatered, the plan for that should include the following:<br />
• dewatering points <strong>and</strong> their elevations<br />
• proposed volume <strong>and</strong> rate <strong>of</strong> dewatering<br />
• discharge point<br />
• duration <strong>of</strong> dewatering<br />
Karst Investigations<br />
Due to the nature <strong>of</strong> karst conduit ground-water flow, limestone quarries have the potential to<br />
affect water resources that are not immediately adjacent to the site. In order to evaluate this<br />
potential, some additional information is necessary; a licensed pr<strong>of</strong>essional geologist with<br />
experience in karst mapping <strong>and</strong> hydrology should obtain this information:<br />
• A survey in the area <strong>of</strong> known caves, joints, or fractures<br />
• Mapping <strong>of</strong> sinkholes, stream sinks, <strong>and</strong> springs<br />
• Trout stream locations<br />
Dye tracing to determine the ground-water flow paths <strong>and</strong> the potential connection <strong>of</strong> the site to<br />
springs in the area may be necessary. This information will help to ensure that the quarry is sited<br />
in an area with the least likelihood <strong>of</strong> affecting local springs through dewatering, contaminant<br />
introduction, or thermal degradation.<br />
6
Monitoring<br />
Monitoring Wells<br />
After all <strong>of</strong> the site investigations are completed, if significant impacts on local water resources or<br />
wells are probable, a monitoring plan should be developed. If monitoring wells are necessary for<br />
that plan, these are recommended requirements for monitoring wells:<br />
• Such wells should be located around the perimeter <strong>of</strong> the mining area, <strong>and</strong> sited after<br />
consideration <strong>of</strong> the possible impacts <strong>and</strong> the current configuration <strong>of</strong> the water table,<br />
piezometric surface, or both.<br />
• Where multiple aquifers are involved, such as removal or dewatering <strong>of</strong> a surficial<br />
aquifer during excavation <strong>of</strong> a lower unit, both the upper <strong>and</strong> lower units should be<br />
monitored by installing a deep well <strong>and</strong> a shallow well in a “well nest”. To establish<br />
ground-water flow directions, a minimum <strong>of</strong> three wells are needed.<br />
Additional Precautions<br />
These additional precautions are necessary if a formation is used both for s<strong>and</strong> <strong>and</strong> gravel<br />
operations <strong>and</strong> for water supply.<br />
• Ground-water modeling may be needed to determine how much material can be mined<br />
without severely impairing aquifer function by changing the ability <strong>of</strong> the formation to<br />
transmit water.<br />
• Mining should not be allowed to the edge <strong>of</strong> the formation (where it meets upl<strong>and</strong><br />
deposits).<br />
• Since these operations typically result in an open-water area, those areas need to be<br />
protected. No fine-grained materials should be deposited in them <strong>and</strong> the areas should not<br />
be used for any type <strong>of</strong> waste disposal.<br />
Mining Plan<br />
Compiling the information on topography, geology, hydrology, karst (if applicable), <strong>and</strong><br />
monitoring will allow for the development <strong>of</strong> a mining plan. The following questions will allow<br />
you to assess the overall scope <strong>of</strong> the mining operation, its impact on neighboring properties, <strong>and</strong><br />
its plan <strong>of</strong> operation.<br />
• How large <strong>of</strong> an area will be mined?<br />
• How deep will the mine be?<br />
• How will mining operations be staged?<br />
• How will the overburden spoils be stored?<br />
• What mitigation measure will protect against flooding?<br />
• What mitigation measure will prevent or manage run<strong>of</strong>f onto surrounding properties <strong>and</strong><br />
surface-water bodies?<br />
7
To answer these questions, a detailed mining plan needs to be supplied that displays the<br />
following:<br />
• Mining progression<br />
• Final depth <strong>of</strong> the mine<br />
• Spoil pile locations <strong>and</strong> treatments<br />
• Material processing plans including washing sites, water sources, <strong>and</strong> treatment methods<br />
• Equipment maintenance areas<br />
• Road locations<br />
Reclamation Plan<br />
These questions will allow you to evaluate the adequacy <strong>of</strong> ongoing reclamation activities during<br />
mining <strong>and</strong> the condition <strong>of</strong> the property after mining ceases.<br />
• What reclamation activities will occur during active mining?<br />
• What will the slopes <strong>of</strong> the area be?<br />
• Will there be an open-water body? If so, what will be its shape, depth, <strong>and</strong> slope?<br />
• What type <strong>of</strong> vegetation will be planted?<br />
• What will be the l<strong>and</strong> use after mining ceases?<br />
To answer these questions, a detailed reclamation plan should be supplied that displays the<br />
following:<br />
• Stages <strong>of</strong> reclamation<br />
• Reclamation methods<br />
• Source <strong>of</strong> reclamation material<br />
• Grading <strong>and</strong> slope <strong>of</strong> the reclaimed areas<br />
• Vegetation planning including map <strong>of</strong> plantings <strong>and</strong> description <strong>of</strong> seed mixtures <strong>and</strong><br />
seed sources<br />
• Shape <strong>and</strong> slope <strong>of</strong> any open-water areas<br />
• Future use <strong>of</strong> the site<br />
8
<strong>Hydraulic</strong> <strong>Impacts</strong> <strong>of</strong> <strong>Quarries</strong><br />
<strong>and</strong> <strong>Gravel</strong> <strong>Pits</strong><br />
III. Appendices<br />
1. Sampling <strong>and</strong> Data Collection Methods<br />
2. Three-Dimensional Characterization <strong>of</strong> the Spinler Quarry<br />
3. Glossary<br />
4. List <strong>of</strong> References<br />
1
APPENDIX 1. SAMPLING AND DATA COLLECTION METHODS<br />
Water Level Measurements<br />
Water level measurements proved the most basic <strong>and</strong> most crucial information for ground-water<br />
studies. Thus, the methods for performed water level measurements must be st<strong>and</strong>ardized for both<br />
automated <strong>and</strong> manual water level measurements.<br />
For both automated <strong>and</strong> manual water level measurements it must be clear from what point on the<br />
well measurements are supposed to be taken, as this measuring point (MP) is the key link to<br />
determining water level elevations from depth to water measurements. In most cases, the MP will<br />
be the top <strong>of</strong> the free-st<strong>and</strong>ing casing. However, there may be circumstances where the MP will<br />
be an access plug located elsewhere. Irrigation or other high-capacity wells <strong>of</strong>ten have a plug near<br />
the base <strong>of</strong> the turbine or have an access tube angling <strong>of</strong>f from the turbine base. All <strong>of</strong> the wells<br />
used in the project were monitoring wells without any obstructions, so the highest part <strong>of</strong> the<br />
inner casing was the measuring point.<br />
Figure 1. Steel tape.<br />
Steel Tape Measurements<br />
Before use, the steel tape (Figure 1) needs to be wiped dry <strong>and</strong> then coated with carpenter’s chalk.<br />
To do this, a portion <strong>of</strong> tape (5 ft is usually sufficient) is unreeled <strong>and</strong>, while a person holds the<br />
reel in one h<strong>and</strong>, the chalk is pressed against the numbered side <strong>of</strong> the tape <strong>and</strong> pulled along<br />
toward the free end until the unreeled tape is coated with the light blue chalk.<br />
3
An estimate <strong>of</strong> depth to water or information from past readings is used to determine where to<br />
hold the tape in order that the wetted length falls within the chalked portion <strong>of</strong> the tape.<br />
The chalked tape is lowered into the well until some <strong>of</strong> the chalked portion is in water <strong>and</strong> then it<br />
is lowered slowly until a whole-foot mark on the tape is exactly at the measuring point. This<br />
measurement is recorded on the data sheet as “tape held” or “hold”. The tape is not allowed to fall<br />
past this chosen hold; to do so would result in an erroneous reading.<br />
The tape is reeled up <strong>and</strong> the measurement is carefully read to the closest hundredth <strong>of</strong> a foot,<br />
(0.00’) at the point where the chalk becomes wet <strong>and</strong> turns to a dark blue color. This is the<br />
“wetted length” or “cut” measurement <strong>and</strong> is recorded on the data sheet. The wetted length is<br />
subtracted from the tape held <strong>and</strong> recorded on the data sheet as “depth to water” or “DTW”. The<br />
reading is compared to previous readings, <strong>and</strong> if there is a significant difference, a second reading<br />
can be taken.<br />
Wells were measured primarily with an Envirotech Waterline model 300 engineering scale water<br />
level meter (Figure 2). As a backup, a steel tape was used when the Waterline was not available<br />
or conditions prohibited its use. The Waterline we purchased was 150 ft long <strong>and</strong> used a scale that<br />
was marked every tenth <strong>and</strong> hundredth <strong>of</strong> a foot.<br />
Figure 2. Electronic water level meter.<br />
4
The wells were all surveyed <strong>and</strong> referenced to either a local or nationwide benchmark (mean sea<br />
level). In most cases, this was the highest point on the casing <strong>and</strong> became the measuring point for<br />
all future readings. The depth to water in the wells was measured by lowering the probe end <strong>of</strong><br />
the Waterline down the well until an audible signal was heard. The point when the tone was heard<br />
is the depth to water; it is measured, to the nearest hundredth <strong>of</strong> a foot, from the probe end to the<br />
measuring point using the graduated scale on the instrument.<br />
Figure 3. Water level measuring at a wellhead.<br />
Several <strong>of</strong> the study wells were instrumented with pressure transducers from INW, Keller, <strong>and</strong><br />
Solinst that continuously measured water levels in the wells. Pressure transducers measure the<br />
pressure <strong>of</strong> the water column above a pressure sensitive membrane <strong>of</strong> the transducer. Each<br />
transducer came factory calibrated with a slope <strong>and</strong> <strong>of</strong>fset, which allow the user to calculate the<br />
height <strong>of</strong> the water column from the pressure measured by the transducer. The transducer-specific<br />
slope <strong>and</strong> <strong>of</strong>fset were entered in a datalogger, typically a CR10 or CR10X, along with<br />
programming instructions that enabled the datalogger to run the pressure transducer <strong>and</strong> make all<br />
<strong>of</strong> the necessary calculations.<br />
The transducers were programmed to measure water levels every 15 minutes <strong>and</strong> this was<br />
recorded by the datalogger. When the datalogger was downloaded, the current water level reading<br />
measured by the transducer was compared to the water level measured by the Waterline or steel<br />
tape. If a significant difference was noted, the <strong>of</strong>fset in the transducer’s program was adjusted so<br />
that the water level shown by the pressure transducer was the same as that measured by h<strong>and</strong>. The<br />
data usually needed additional corrections to account for transducer drift from aging <strong>of</strong> the<br />
membrane.<br />
5
Elevation Survey Methods<br />
Water level measurements must be tied to a common datum as was discussed above. Several <strong>of</strong><br />
the partner companies provided accurate survey data for wells installed on their property; in other<br />
cases, level surveys were conducted from federal <strong>and</strong> state benchmarks in the vicinity <strong>of</strong> the<br />
quarry or pit using survey-grade global positioning system (GPS) equipment.<br />
Figure 4. Climate monitoring equipment.<br />
Climate Monitoring Methods<br />
Climate monitoring was accomplished primarily with weather stations (Figure 4 above) located at<br />
the Felton, Kraemer, Golberg, Spinler, <strong>and</strong> Fountain sites. The weather stations monitored<br />
precipitation, wind speed, wind direction, solar radiation, barometric pressure, <strong>and</strong> relative<br />
6
humidity. Of these, precipitation <strong>and</strong> barometric pressure were the most important information<br />
collected from the stations.<br />
The weather stations were built around Campbell Scientific CR10, CR10X, or CR21X <strong>and</strong><br />
programmed with PC208W. This configuration allowed us to customize how the data were<br />
collected <strong>and</strong> the frequency <strong>of</strong> collection. For most applications, the sensors would take readings<br />
continuously, store the data hourly, <strong>and</strong> summarize the data daily. Barometric pressure was<br />
collected at 15-minute intervals, which was the same as the pressure transducers since several <strong>of</strong><br />
the transducers required a barometric pressure compensation to provide adequate data resolution.<br />
Precipitation measurements were collected every minute during rain events. Snowfall was not<br />
well represented because the precipitation gauge was not heated <strong>and</strong> much <strong>of</strong> the snow would<br />
sublime or blow <strong>of</strong>f the gauge before it could melt <strong>and</strong> be recorded. Precipitation was compared<br />
to hydrographs to determine whether there was any correlation between ground water levels <strong>and</strong><br />
precipitation.<br />
During periods <strong>of</strong> datalogger failure, precipitation was filled in from the Minnesota Climatology<br />
program High Density Network. These data were used sporadically because rainfall can be highly<br />
spatially variable; what is measured at a station a mile away can be greatly different than what is<br />
measured onsite.<br />
Purpose<br />
Dye Tracing in Limestone<br />
Using artificial additives (tracers) to track ground-water flow is a widely used tool in karst aquifer<br />
investigation. A tracer is added to the ground-water system at a sinkhole, sinking stream, or cave<br />
stream <strong>and</strong> then it is sampled for at those points, springs, where the ground-water system<br />
discharges to the surface. When done successfully, this point-to-point tracing technique provides<br />
a significant amount <strong>of</strong> information about the ground-water flow system. When point-to-point<br />
connections are known, they can be used to delineate the area that contributes water to a spring<br />
(springshed). If water samples are taken regularly during the tracing experiment, the groundwater<br />
time-<strong>of</strong>-travel, its rate <strong>of</strong> movement, can be determined. This information can then be used<br />
to evaluate the impacts <strong>of</strong> quarries <strong>and</strong> other l<strong>and</strong> uses.<br />
For this type <strong>of</strong> work, the tracer should be conservative (i.e., travel at approximately the same<br />
velocity as the water molecules). For that reason <strong>and</strong> because they are readily obtainable,<br />
nontoxic, <strong>and</strong> relatively simple to analyze, the preferred karst tracers are fluorescent dyes. Many<br />
fluorescent dyes are available to use; however, through extensive field experiments only a few<br />
have proven suitable for ground-water tracing. This suitability is based on the tracer being<br />
recoverable from the water, having a low tendency to adsorb on to the aquifer material or<br />
suspended sediment in the water, <strong>and</strong> low toxicity to plants <strong>and</strong> animals.<br />
Protocol<br />
For this study, the dyes used were eosine (CAS 17372-87-1), Rhodamine WT (CAS 37299-86-8),<br />
<strong>and</strong> uranine C (CAS 518-47-8). Three dyes were used to allow us to trace up to three different<br />
sinkholes at the same time.<br />
For traces outside <strong>of</strong> the quarry, 0.9 to 1.8 pounds <strong>of</strong> dye were flushed with approximately 9,000<br />
liters <strong>of</strong> water from a tanker truck. The traces that were conducted in the quarry used water that<br />
was emanating from springs in it. The dye was poured into those streams <strong>of</strong> water which then<br />
7
sank underground (Figure 5). Prior to dye input, samples <strong>of</strong> the spring water at Big Spring <strong>and</strong><br />
other area springs were obtained to determine background levels <strong>of</strong> fluorescence in the groundwater<br />
system.<br />
Sampling<br />
Figure 5. Introducing dye into the stream <strong>of</strong> water.<br />
Passive charcoal detectors <strong>and</strong> direct water samples were used for sampling. Charcoal detectors<br />
were constructed by placing 0.01 ounce <strong>of</strong> activated carbon coconut shell in a 5 cm by 20 cm<br />
section <strong>of</strong> milk sock filter tube stapled on both ends. A tag was attached to the detector with a<br />
short wire. This wire also served to attach the detector to a weight, which prevents the detector<br />
from washing away (Figure 6). The tag was used to record the name <strong>and</strong> number <strong>of</strong> the spring<br />
being sampled <strong>and</strong> the time <strong>and</strong> date the detector was both put into the spring <strong>and</strong> when it was<br />
retrieved.<br />
8
Figure 6. Sampling materials.<br />
Analysis<br />
Dyes were recovered in the laboratory by placing about 1 gram (dry weight) <strong>of</strong> activated carbon<br />
into a disposable test tube; a mixture <strong>of</strong> water, sodium hydroxide, <strong>and</strong> propanol was added to the<br />
carbon. This mixture would “pull” the dye <strong>of</strong>f the carbon <strong>and</strong> put it into solution so it could be<br />
analyzed. The remaining carbon was stored in a freezer for later re-analysis if required. For the<br />
direct water sample analysis, only a small portion <strong>of</strong> the sample taken in the field was used; the<br />
rest was saved for re-analysis if needed.<br />
Fluorescent dyes absorb light <strong>and</strong> remit it at longer wavelengths. The ideal wavelength at which<br />
the dye re-emits that energy is called the peak emission wavelength, where most fluorescence<br />
occurs. Fluorometers are used to detect fluorescence below visual levels. The fluorometer<br />
supplies light at the peak excitation wavelength <strong>and</strong> then measures the intensity <strong>of</strong> the light at the<br />
peak emission wavelength (Fay <strong>and</strong> Alex<strong>and</strong>er, 1994). All <strong>of</strong> the samples were analyzed with a<br />
Shimadzu RF5000 scanning spectr<strong>of</strong>luoro-photometer at the University <strong>of</strong> Minnesota Department<br />
<strong>of</strong> Geology <strong>and</strong> Geophysics. This instrument uses a synchronous scan mode that varies the peak<br />
emission <strong>and</strong> excitation wavelengths. The resultant dye peaks were analyzed with PeakFit<br />
nonlinear curve-fitting s<strong>of</strong>tware. Using this method made it possible to analyze for all three dyes<br />
at the same time <strong>and</strong> distinguish them from naturally occurring fluorescent materials.<br />
9
Dye Tracing in S<strong>and</strong> <strong>and</strong> <strong>Gravel</strong><br />
Protocol<br />
Dye tracing can be used to determine ground-water travel time <strong>and</strong> flow direction in s<strong>and</strong> <strong>and</strong><br />
gravel (porous media) aquifers. A tracer is introduced into the aquifer <strong>and</strong> then samples are taken<br />
at excavations <strong>and</strong> wells. The tracer used should not adsorb easily on to the aquifer material.<br />
Uranine C <strong>and</strong> eosine have lower adsorption tendencies than Rhodamine WT; thus, they are the<br />
dyes <strong>of</strong> choice for porous media aquifer studies.<br />
Analysis<br />
The samples were analyzed using a Turner Designs Aquafluor fluorometer. The Aquafluor is a<br />
h<strong>and</strong>held unit that was configured to analyze for uranine C <strong>and</strong> Rhodamine WT. All <strong>of</strong> the<br />
analyses for the s<strong>and</strong> <strong>and</strong> gravel dye trace were carried out with this unit. These analyses had no<br />
costs since we did not have to send the samples to the University <strong>of</strong> Minnesota Department <strong>of</strong><br />
Geology <strong>and</strong> Geophysics. It also allowed for virtually instantaneous results as we could take a<br />
sample at the pit, return to the <strong>of</strong>fice, <strong>and</strong> analyze it immediately. This allowed us to track the dye<br />
increase in trench 2 <strong>and</strong> indicated when we needed to stop sampling due to dye concentrations<br />
that were exceeding the upper limits <strong>of</strong> the unit’s measurement range.<br />
Water from the sample bottles was pipeted into a disposable cuvette that was placed in the<br />
Aquafluor. The resulting readings were recorded <strong>and</strong> plotted to determine when the dye broke<br />
through to the sampling excavation. Overall, the unit performed well <strong>and</strong> allowed for quick <strong>and</strong><br />
accurate analysis <strong>of</strong> the samples.<br />
Turbidity<br />
Turbidity is a measure <strong>of</strong> the cloudiness or ability <strong>of</strong> light to pass through water in straight lines.<br />
Water with a high turbidity scatters light in all directions or absorbs light while water with low<br />
turbidity allows light to pass through relatively unimpeded. Turbidity is measured in<br />
nephelometric turbidity units (NTU). High levels <strong>of</strong> turbidity are caused by suspended clays, silts,<br />
<strong>and</strong> other inorganic <strong>and</strong> organic precipitates.<br />
Generally, increased turbidity in a domestic water well is only an aesthetic problem given its<br />
visually unappealing appearance for drinking; however, if the turbidity is high enough <strong>and</strong> occurs<br />
frequently enough, it could fill up pressure tanks <strong>and</strong> clog filtration systems resulting in frequent<br />
filter replacement. Currently, the Minnesota Department <strong>of</strong> Health has not established a<br />
maximum contaminant level (MCL) for turbidity. The American Water Works Association<br />
(AWWA) <strong>and</strong> the U.S. Environmental Protection Agency require that turbidity be maintained<br />
below 1.0 NTU for all public water supplies.<br />
Through the process <strong>of</strong> rock crushing <strong>and</strong> processing in rock quarries, large quantities <strong>of</strong> fine<br />
materials are produced <strong>and</strong> can be washed into the ground-water system by rain events. In<br />
addition, ground vibrations produced by blasting can dislodge small particles in fractures <strong>and</strong><br />
conduits, which can increase turbidity.<br />
Over the years, we have received anecdotal reports <strong>of</strong> mining activities <strong>and</strong> blasting affecting<br />
nearby domestic wells through increased turbidity; however, we could not verify any <strong>of</strong> these<br />
reports. Given the proximity <strong>of</strong> our monitoring wells to the active quarries being studied, we<br />
10
decided to install turbidity sensors in the wells to measure turbidity changes in the ground water<br />
<strong>and</strong> document the impacts that have been described to us. We hypothesized that blasting would<br />
send enough energy through the rocks to dislodge fine particles <strong>and</strong> cause an increase in turbidity<br />
in the monitoring wells.<br />
Figure 7. Water level <strong>and</strong> turbidity before <strong>and</strong> after a blast at Kraemer quarry.<br />
Turbidity sensors work by emitting a pulse <strong>of</strong> light between an emitter <strong>and</strong> a sensor <strong>and</strong> then<br />
measuring the amount <strong>of</strong> light that is scattered to a second sensor perpendicular to the original<br />
path <strong>of</strong> the light. The turbidity is inversely proportional to the amount <strong>of</strong> light reaching the first<br />
sensor <strong>and</strong> directly proportional to the amount <strong>of</strong> light that reaches the perpendicular sensor.<br />
The first pieces <strong>of</strong> equipment we tried were Global Water WQ series sensors in project wells at<br />
Kraemer <strong>and</strong> Golberg quarries. While the equipment was promising, consistent readings could<br />
not be obtained with either the h<strong>and</strong>-held turbidimeter or the sensors. The signal noise was much<br />
greater than any real changes in turbidity. In many cases, the readings would change by an order<br />
<strong>of</strong> magnitude within a second or two. Figure 7 is a graph <strong>of</strong> data collected by the Global Water<br />
sensor during a blasting event at Kraemer Quarry. Just before <strong>and</strong> just after the blast, turbidity<br />
levels were fairly stable. The second graph (Figure 8) is for a blasting event at Fountain Quarry.<br />
The readings were collected every 15 minutes <strong>and</strong> there is so much noise in the data that no<br />
trends can be distinguished. Even a running average was unable to identify any real trends. These<br />
data are characteristic <strong>of</strong> the data that we received from this equipment.<br />
11
Figure 8. Turbidity readings from a blasting event at Fountain quarry.<br />
The second piece <strong>of</strong> equipment we tried was a Greenspan TS series turbidity sensor with built-in<br />
datalogger from Stevens Hydrologic Systems. The sensor was deployed in a cave spring<br />
downgradient <strong>of</strong> the quarry at Fountain. It performed extremely well <strong>and</strong> gave stable <strong>and</strong><br />
reproducible readings with little signal noise. The unit measured turbidity in some <strong>of</strong> the largest<br />
flows seen at the spring during June 2004 <strong>and</strong> significant events in June <strong>and</strong> July 2003. During<br />
summer 2004, the unit disappeared from the spring <strong>and</strong> has not been recovered.<br />
If the study were to be continued, we would have to change how we are monitoring turbidity.<br />
Instead <strong>of</strong> focusing on our monitoring wells, we should search for wells adjacent to quarries that<br />
have a history <strong>of</strong> turbidity after a blasting event <strong>and</strong> measure turbidity in them before <strong>and</strong> after a<br />
blast. Although we have had v<strong>and</strong>alism problems at the Fountain Big Spring site, monitoring<br />
should continue there because we have noted turbidity increases after blasting but not enough<br />
data exist to adequately quantify the impacts.<br />
Although there are little supporting data, mining activities likely do have an impact on local<br />
ground water through increased turbidity. This effect is seen mostly at monitoring locations<br />
downgradient <strong>of</strong> the quarry <strong>and</strong> is most obvious shortly after blasting events. In southeastern<br />
Minnesota, the turbidity increase from rainwater picking up quarry dust is insignificant compared<br />
to the turbidity resulting from rainwater washing sediment into sinkholes in agricultural or<br />
forested l<strong>and</strong>s. Ground water generally moves more slowly through s<strong>and</strong> <strong>and</strong> gravel when<br />
compared to flow through fractures <strong>and</strong> solution-enlarged joints in carbonate rocks. In s<strong>and</strong> <strong>and</strong><br />
gravel, this lower flow rate allows most <strong>of</strong> the suspended material to settle out before it can be<br />
detected in a monitoring well. Storm induced turbidity responses are shown in Figures 9 <strong>and</strong> 10.<br />
12
Figure 9. Storm induced turbidity response (2004).<br />
Figure 10. Storm induced turbidity response (2003).<br />
13
The possibility <strong>of</strong> a quarry creating ground-water problems needs to be addressed during the<br />
planning phase, not after residents start complaining. The potential for turbidity impacts exists in<br />
any location where conduit flow is a significant component <strong>of</strong> the total ground-water flow. The<br />
extent <strong>of</strong> conduit flow can be easily determined by examining local springs after a recharge event.<br />
If the springs are cloudy, then conduit flow is significant; but if the springs are clear, then matrix<br />
flow is likely predominant. Conflicts between homeowners <strong>and</strong> quarry operators will only<br />
increase as more quarries are opened <strong>and</strong> as urban sprawl pushes residential homes into the<br />
countryside.<br />
Downhole Camera<br />
Downhole cameras have become useful recently not only to inspect the condition <strong>of</strong> wells but<br />
also to examine the aquifer material in open-hole wells. Most cameras are actually two cameras,<br />
one looking down <strong>and</strong> one looking sideways<br />
The camera is lowered into the well on a cable that spools <strong>of</strong>f a truck-mounted winch over a pully<br />
at the end <strong>of</strong> a boom positioned directly over the well. The “drawworks” are equipped to measure<br />
<strong>and</strong> record the amount <strong>of</strong> cable being spooled out so that the video can be coded with the exact<br />
depth.<br />
Cameras are frequently used with downhole geophysics equipment in which case the geophysical<br />
log <strong>and</strong> visual log can be correlated.<br />
Downhole cameras are used to visually inspect wells <strong>and</strong> identify <strong>and</strong> solve well problems. They<br />
also can allow identification <strong>of</strong> zones <strong>of</strong> high flow in uncased portions <strong>of</strong> wells. A use for the<br />
camera in wells near quarries is to inspect for possible damage following several years <strong>of</strong> close<br />
proximity blasting.<br />
The downhole camera for this project was ordered in October 2004 <strong>and</strong> received in March 2005.<br />
After some initial testing, the camera was deployed for fieldwork in early April.<br />
The camera was purchased in order to allow project staff to visually examine the bedrock<br />
monitoring wells at the Kraemer, Golberg, <strong>and</strong> Spinler quarries. While these wells were<br />
instrumented with water level <strong>and</strong> turbidity recorders, these instruments only gave a partial<br />
picture <strong>of</strong> the conditions in the wells. Using the downhole camera, staff could look for indicators<br />
<strong>of</strong> quarrying impacts. In particular, staff could evaluate the condition <strong>of</strong> the well casing, examine<br />
the open-hole portions <strong>of</strong> the well for obvious rock movement <strong>and</strong> high-capacity conduits (visible<br />
by the movement <strong>of</strong> particulate matter in the well), <strong>and</strong> look for indications <strong>of</strong> turbidity.<br />
Comparison <strong>of</strong> present <strong>and</strong> future video logs will allow staff to gain further knowledge on<br />
quarrying impacts as the wells age.<br />
Temperature Monitoring<br />
Due to funding limitations, monitoring <strong>of</strong> thermal impacts <strong>of</strong> mining operations could not be<br />
major goal <strong>of</strong> this study. Traditional methods are time-consuming <strong>and</strong> costly. Yet concern about<br />
thermal impacts on receiving waters has continued to be a major issue in the southern Minnesota.<br />
When a new monitoring technology called thermochrons became available, therefore, it was<br />
decided that thermal impacts should be tested.<br />
14
Thermochrons are digital recording thermometers (Figure 11). These relatively new devices are<br />
only about the size <strong>of</strong> two stacked nickels but include a temperature sensor <strong>and</strong> recording<br />
memory that can keep track <strong>of</strong> temperature changes for several months. They can be placed in<br />
shallow water, for example in streams, springs, or quarry ponds, <strong>and</strong> later retrieved for data<br />
recovery.<br />
Thermochrons cost less than $50 each <strong>and</strong> the equipment to communicate with them is also<br />
inexpensive <strong>and</strong> extremely portable, making temperature monitoring in gravel pits <strong>and</strong> quarries a<br />
real possibility.<br />
Figure 11. Thermochron digital recording thermometer compared with a nickel.<br />
15
APPENDIX 2. THREE-DIMENSIONAL CHARACTERIZATION<br />
OF THE SPINLER QUARRY<br />
One <strong>of</strong> the most difficult tasks a geoscientist faces in describing the geologic setting <strong>of</strong> an area is<br />
to explain in words how it looks under ground. Pr<strong>of</strong>essional geoscientists need to think in three<br />
dimensions. Most laypeople are unable to underst<strong>and</strong> how the earth looks two-dimensionally with<br />
topographic maps. Adding the third dimension <strong>of</strong> space <strong>and</strong> the fourth dimension <strong>of</strong> time would<br />
have been difficult to portray in the past. Emerging earth science s<strong>of</strong>tware now allows the<br />
geoscientist to construct three-dimensional visual models to aid interpretation <strong>of</strong> the geologic <strong>and</strong><br />
hydrologic framework. One <strong>of</strong> the geoscience’s models, Rockworks 2004, was purchased with<br />
funds from this study to allow more detailed analysis <strong>of</strong> the impacts <strong>of</strong> quarrying on ground-water<br />
systems.<br />
Located 6 miles southwest <strong>of</strong> Owatonna, Minnesota, the Spinler Quarry was analyzed in greater<br />
detail than the other project sites; its complex hydrogeologic setting includes the widest range <strong>of</strong><br />
issues that local <strong>and</strong> state <strong>of</strong>ficials may encounter when considering requests to locate or exp<strong>and</strong> a<br />
quarry or pit. Originally operated as a gravel pit, this site has been transformed into a limestone<br />
quarry. Encompassing 55 acres, the site’s pit comprises 19 acres. Because <strong>of</strong> confidentiality<br />
agreements, the immediate site geology will not be discussed. Tipping <strong>and</strong> others (2003)<br />
described the hydrogeologic environment within which this site resides.<br />
The quarry is currently owned by Milestone Materials <strong>of</strong> Mathy Construction. At project<br />
inception, Crane Creek owned the quarry. Without cooperation <strong>and</strong> information sharing by<br />
Milestone Materials <strong>and</strong> Crane Creek, this discussion would not have been possible. Their efforts<br />
<strong>and</strong> willingness to allow access to their property <strong>and</strong> proprietary information are recognized <strong>and</strong><br />
greatly appreciated.<br />
Hydrogeologic Model<br />
Rockworks 2004 was purchased for the project to aid in the analysis <strong>and</strong> presentation <strong>of</strong> the<br />
project information in a three-dimensional format. The s<strong>of</strong>tware allows construction <strong>of</strong> a digital<br />
model using the following input data:<br />
• well logs <strong>of</strong> the underlying geology;<br />
• well location, elevation, <strong>and</strong> depth;<br />
• pit configuration <strong>and</strong> depth; <strong>and</strong><br />
• water levels <strong>of</strong> each aquifer.<br />
Rockworks 2004 is not a hydrodynamic model; it does not compute water levels based on a<br />
predictive algorithm. It is a representation <strong>of</strong> the investigator’s hydrogeologic interpretation <strong>and</strong><br />
observed water levels. It interpolates the information from known data sites to fill in the unknown<br />
areas. In spite <strong>of</strong> the above limitations, Rockworks 2004 is a powerful tool, which presents an<br />
unprecedented picture <strong>of</strong> the subterranean environment.<br />
Figure 1 (below) is a copy <strong>of</strong> a well log with the model input information highlighted. Well logs<br />
are required to be completed for each well constructed by a licensed well driller. The Minnesota<br />
Department <strong>of</strong> Health manages the database called the Minnesota <strong>County</strong> Well Index (CWI),<br />
which contains logs <strong>of</strong> most <strong>of</strong> the wells drilled in Minnesota. The Minnesota Geological Survey<br />
reviews the well logs to identify the lithology (the physical character <strong>of</strong> the earth materials<br />
through which the well is drilled) <strong>of</strong> the well <strong>and</strong> field checks their locations. Well logs are an<br />
essential component in any hydrogeologic investigation. Without geologic information garnered<br />
17
Figure 1.<br />
from the well logs, neither a digital nor a manual model can be constructed. A model is only as<br />
good as the information used to construct it. The wider the gaps in information, the less reliable<br />
the model will be. The same can be said about water levels. The greater the space between known<br />
points, the less reliable the representation will be. Along with proprietary data <strong>and</strong> maps supplied<br />
by Milestone Materials <strong>of</strong> Mathy Construction, 16 CWI well logs <strong>and</strong> the logs <strong>of</strong> three<br />
18
monitoring wells constructed for this project were stratigraphically interpreted. Figure 2 is the<br />
stratigraphic column <strong>of</strong> the well shown in Figure 1. Stratigraphy in this case is the grouping <strong>of</strong><br />
sedimentary formations into the hydrogeologic units described below. The stratigraphic data were<br />
then used to construct a three-dimensional model approximately 2.8 miles long <strong>and</strong> 1 mile wide<br />
(Figure 3). The monitoring wells, M-1, M-2 <strong>and</strong> M-3, are shown in addition to the CWI wells that<br />
are shown on Figure 3.<br />
Figure 2.<br />
The numbers shown above the model in Figure 3 are Universal Transverse<br />
Mercator (UTM) locations in meters; each tick mark represents 1 kilometer. To<br />
assist in viewing the logs, the figure’s vertical to horizontal exaggeration is 5:1.<br />
Most <strong>of</strong> the figures contained in this section will be shown with a vertical<br />
exaggeration <strong>of</strong> 5:1.<br />
The well log analysis resulted in the following stratigraphic sequence, beginning<br />
at l<strong>and</strong> surface:<br />
• Overburden is sporadically found within the model area <strong>and</strong> is quite thin.<br />
Its presence does not exert much influence on the hydrogeologic<br />
conditions.<br />
• A water table aquifer, hereafter referred to as Aquifer 1, which consists<br />
<strong>of</strong> s<strong>and</strong> <strong>and</strong> gravel <strong>and</strong> is open to atmospheric conditions.<br />
• A confining layer mainly consisting <strong>of</strong> clay, hereafter referred to as the<br />
Aquitard. Aquitards restrict the movement <strong>of</strong> ground water in relation<br />
to aquifers. Not all aquitards are the same. The degree to which groundwater<br />
movement occurs varies considerably; a wide continuum <strong>of</strong> flow<br />
restriction exists. An aquitard can also leak due to thinning <strong>of</strong> material,<br />
cracks, or holes in it.<br />
• A second, confined aquifer below the Aquitard, hereafter referred to as<br />
Aquifer 2. Lithologically, Aquifer 2 is the Galena Group, which is<br />
carbonate rock with karst features when the rock formation occurs close<br />
to the surface (Tipping <strong>and</strong> others, 2003).<br />
Due to a lack <strong>of</strong> data, a third, confined aquifer was not included in this model. A<br />
second aquitard separates it from Aquifer 2. One irrigation well was constructed<br />
in the third aquifer. Its water surface was not used for water level computations<br />
because it was completed in the deeper, third aquifer <strong>and</strong> grouted to separate its<br />
screen from Aquifer 2. All the other CWI logs used in model construction were<br />
from domestic wells completed in Aquifer 2.<br />
Once data are entered into the model, the model calculates the top, bottom, <strong>and</strong> sides <strong>of</strong> each<br />
stratigraphic formation, smoothing the information between discrete known points. Because data<br />
are not available between the wells, the model is not a completely accurate representation <strong>of</strong> the<br />
layers; it is similar to h<strong>and</strong>-drawn cross-sections where lines are drawn between well points.<br />
Without data between each well, the area between the known points is interpolated <strong>and</strong> a line is<br />
drawn based on the interpolation.<br />
19
Figure 3.<br />
The individual layers are created in grids. After the initial grid is created, a filtering function was<br />
employed to bring the pit <strong>and</strong> benches to their true elevations. The resulting filtered grids are<br />
reconstructed into the final three-dimensional solid model. Finally, the aerial photo <strong>of</strong> the site is<br />
draped onto the top layer to provide location <strong>and</strong> a feel for surface elevation.<br />
Rockware 2004 also represents water surfaces in three-dimensional grids, which can be appended<br />
into the stratigraphic model along with the well logs. Each stratigraphic layer, well log, <strong>and</strong> water<br />
surface can be displayed or eliminated in the view to allow inspection <strong>of</strong> the layers <strong>and</strong> to<br />
determine where specific features <strong>and</strong> water levels reside three-dimensionally.<br />
Figures 4a <strong>and</strong> 4b present the resulting solid three-dimensional model. Vertical to horizontal<br />
exaggeration is 1:1 <strong>and</strong> 5:1 for Figures 4a <strong>and</strong> 4b, respectively. Figure 4a is included to provide a<br />
comparison between real world conditions <strong>and</strong> figures with a vertical to horizontal exaggeration<br />
<strong>of</strong> 5:1. To aid in viewing the model results, all other figures in this section will have a vertical to<br />
horizontal exaggeration <strong>of</strong> 5:1.<br />
As discussed above, all <strong>of</strong> the CWI logs used in the model were completed in Aquifer 2. All<br />
water surfaces reported in the logs were above the top <strong>of</strong> Aquifer 2 when the well was<br />
constructed. This is important because it shows that Aquifer 2 was a confined aquifer. When this<br />
occurs, the aquifer is considered to be artesian.<br />
20
Figure 4a.<br />
Figure 4b.<br />
21
If the ground-water surface occurs at an elevation above the confined aquifer’s top surface, the<br />
ground water is considered to be under artesian conditions. The ground water is under pressure<br />
that is greater than atmospheric pressure, which causes it to rise higher in the well than the top<br />
layer <strong>of</strong> the aquifer. The aquifer has an added component to its water height. The added<br />
component is either a higher elevation <strong>of</strong> the recharge zone or pressure that is being applied to the<br />
aquifer from the weight <strong>of</strong> the overlying earth materials. The height <strong>of</strong> a confined aquifer’s water<br />
surface is termed its potentiometric surface.<br />
Historical Water Level<br />
To portray the historical water surface <strong>of</strong> Aquifer 2, the water surface elevations reported in the<br />
CWI well logs were combined into one database. This database is hereafter referred to as the<br />
prequarry potentiometric surface. All <strong>of</strong> the CWI wells were constructed prior to the gravel<br />
pit/quarry; most were in the late 1980s. Caution must be taken because the water levels in this<br />
database were not recorded the same day or even the same year. An important model assumption<br />
is that the confined water levels in Aquifer 2 were reasonably stable during the period <strong>of</strong> well<br />
construction. Though the water levels were not reported at the same time, it was decided to use<br />
the prequarry potentiometric surface for the following reasons:<br />
• All the wells were completed in Aquifer 2 prior to quarry excavation.<br />
• The aquifer was confined. In the absence <strong>of</strong> strenuous pumping, confined aquifer water<br />
levels generally remain more stable than water table aquifers because <strong>of</strong> their encasement<br />
<strong>and</strong> isolation from the l<strong>and</strong> surface. The protection from the atmosphere results in a<br />
subdued response to precipitation.<br />
• The resultant potentiometric surface is fairly horizontal, suggesting stable conditions.<br />
• No other reliable data are obtainable; it is the best available representation. No recorded<br />
data are available for the prequarry Aquifer 1 water surface.<br />
Figure 5 displays the assumed potentiometric surface (transparent, light blue) <strong>of</strong> prequarry<br />
Aquifer 2. Though water fills Aquifer 2 entirely, only the potentiometric surface is shown. To<br />
display the potentiometric surface, the overburden <strong>and</strong> Aquifer 1 layers are eliminated. Because<br />
the potentiometric surface is considerably above the Aquifer 2 <strong>and</strong> Aquitard tops, an upward<br />
(vertical) gradient from Aquifer 2 toward Aquifer 1 would occur whenever Aquifer 1 water levels<br />
drop below the Aquifer 2 potentiometric surface. If the Aquitard contains holes or is not effective<br />
in containing vertical movement, the Aquitard would have leaked, allowing ground water to<br />
move between the two aquifers.<br />
22
To investigate the possibility <strong>of</strong> prequarry leakage, the overburden <strong>and</strong> Aquifer 1 layers were<br />
removed <strong>and</strong> the block was rotated to view the Aquifer top (Figure 6a). In addition to the pit, four<br />
holes in the Aquitard are shown in Figure 6a. Each hole was confirmed with well logs; the<br />
stratigraphy is interpolated between the individual wells. Therefore, the areal extent <strong>of</strong> the holes<br />
is unknown. The important factor is that the Aquitard is leaky <strong>and</strong> can move ground water<br />
between Aquifer 1 <strong>and</strong> Aquifer 2 depending on the difference in head, or elevation, between the<br />
Aquifer 1 water surface <strong>and</strong> Aquifer 2 potentiometric surface.<br />
Figure 6b displays the potentiometric surface <strong>of</strong> prequarry Aquifer 2 with a change in the color<br />
pattern <strong>and</strong> without the stratigraphy being shown. The color pattern represents differences in<br />
elevation <strong>of</strong> the Aquifer 2 prequarry potentiometric surface. It allows identification <strong>of</strong> the<br />
horizontal ground-water gradient <strong>and</strong> flow (blue arrows). Based on the modeling, the<br />
potentiometric surface <strong>of</strong> prequarry Aquifer 2 sloped from west to east <strong>and</strong> in the western portion<br />
<strong>of</strong> the model from north to south. The highest prequarry Aquifer 2 potentiometric surface was<br />
near UTM 475,000. The holes in the Aquitard shown in Figure 6a are compatible <strong>and</strong> correspond<br />
with the higher potentiometric surface in Figure 6b.<br />
Postquarry Water Levels<br />
As discussed above, caution must be taken when viewing the water surface representations.<br />
Because no postquarry measurements are available for the area west <strong>of</strong> the pit <strong>and</strong> M-1, the true<br />
water surface west <strong>of</strong> M-1 may not be completely represented by the model’s postquarry<br />
conditions. Water level measurements west <strong>of</strong> M-1 would allow for a more accurate depiction <strong>of</strong><br />
quarrying impacts. In the active quarry, Aquifer 1 <strong>and</strong> the Aquitard have been removed.<br />
23
Quarrying operations have made a significant change in conditions. In addition to the puncture<br />
through the Aquitard, the pit is being dewatered to allow for removal <strong>of</strong> the Galena Formation<br />
(Aquifer 2). Figure 7 views the Aquitard bottom layer with Aquifer 2 eliminated; it looks upward<br />
from beneath the Aquitard. The magenta-colored surface is the pit water surface. It is being<br />
drawn down into Aquifer 2 through the puncture in the Aquitard.<br />
Dewatering has significantly lowered the Aquifer 2 potentiometric surface. Figure 8a compares<br />
the prequarry surface shown in light blue, semitransparent, with the September 15, 2004<br />
potentiometric, dark blue, wire mesh surface. As in Figure 6a, the Overburden <strong>and</strong> Aquifer 1<br />
layers are not shown. Figure 8a demonstrates the dramatic change in areal extent <strong>and</strong> elevation <strong>of</strong><br />
the Aquifer 2 potentiometric surface due to pit dewatering <strong>and</strong> puncture <strong>of</strong> the Aquitard.<br />
Displaying the September 15, 2004 Aquifer 1 (dark blue mesh) <strong>and</strong> Aquifer 2 (solid lavender)<br />
with well logs only, Figure 8b shows the cone <strong>of</strong> depression surrounding the pit <strong>and</strong> the merging<br />
<strong>of</strong> Aquifer 1 <strong>and</strong> Aquifer 2 water surfaces due to dewatering. The red arrows represent the<br />
ground-water flow under these conditions <strong>and</strong> approximate the hydraulic gradient, or water<br />
surface slope, <strong>of</strong> Aquifer 1 west <strong>of</strong> the Straight River. Because the potentiometric surface <strong>of</strong><br />
Aquifer 2 has been reduced, the hydraulic gradient <strong>of</strong> Aquifer 1 is steeply sloping toward the pit.<br />
Though the September 2004 potentiometric surface has not yet been completely drawn below the<br />
top <strong>of</strong> Aquifer 2, dewatering has the potential <strong>of</strong> causing that condition. If Aquifer 2 water levels<br />
drop below the top <strong>of</strong> Aquifer 2, it will no longer be confined <strong>and</strong> mining <strong>of</strong> the ground water will<br />
begin. The aquifer can sustain irreversible damage such as l<strong>and</strong> subsidence <strong>and</strong> aquifer<br />
compaction, particularly in a karst environment. The steeper hydraulic gradient, or slope <strong>of</strong> the<br />
water surface, can also induce erosion <strong>of</strong> the overlying sediments, adding silt into the conduit<br />
system <strong>and</strong> degrading water quality.<br />
25
Dewatering may have already reduced the head potential <strong>of</strong> surrounding domestic wells. Figure 9<br />
contains the prequarry (light blue) <strong>and</strong> postquarry (dark blue mesh) potentiometric surfaces. It<br />
appears that the pressure head loss due to dewatering is in the range <strong>of</strong> 30 feet in the western<br />
portion, which can reduce pump efficiency in a domestic well.<br />
26
Although prequarry data are not available for Aquifer 1, comparing the present water surface <strong>of</strong><br />
Aquifer 1 with the prequarry potentiometric surface <strong>of</strong> Aquifer 2 can provide insight into the<br />
prequarry water surface elevations <strong>of</strong> Aquifer 1. Figures 10a <strong>and</strong> 10b compare the prequarry<br />
potentiometric surface with the September 2004 Aquifer 1 water surface. The prequarry<br />
potentiometric surface is displayed in light blue (semitransparent in Figure 10a) <strong>and</strong> Aquifer 1<br />
surface is shown in darker blue. Figure 10a is similar to Figure 8a in that the Overburden <strong>and</strong><br />
Aquifer 1 layers are not shown. Like Figure 8b, Figure 10b displays the two water surfaces with<br />
the stratigraphic layers not shown.<br />
In the western portion <strong>of</strong> the model, the prequarry potentiometric surface <strong>of</strong> Aquifer 2 is<br />
considerably higher than the September 2004 Aquifer 1 surface. The Aquitard is leaky <strong>and</strong><br />
ground water in Aquifer 2 plays a role in Aquifer 1 levels when the potentiometric surface is<br />
above the Aquifer 1 water surface; therefore, it is likely that the water surface <strong>of</strong> Aquifer 1 would<br />
have at least mirrored the potentiometric surface <strong>of</strong> Aquifer 2 once they crossed. When the two<br />
surfaces meet, they will merge (Figure 10b). The merged surface would most likely be<br />
maintained at or above the potentiometric surface <strong>of</strong> Aquifer 2. Figure 11 (from Section 5,<br />
Spinler Quarry, <strong>of</strong> this report) suggests that the prequarry Aquifer 1 water surface is above the<br />
Aquifer 2 prequarry surface. Figure 11 was based on surface water <strong>and</strong> topographic contours to<br />
reconstruct the prequarry water table elevation <strong>of</strong> Aquifer 1. It is entirely possible that this was<br />
the case. The prequarry potentiometric surface is most likely the lowest elevation at which the<br />
prequarry water surface <strong>of</strong> Aquifer 1 existed. This means that the historic Aquifer 1 level would<br />
have been higher than existing conditions, <strong>and</strong> would have at the very least become horizontal<br />
once it reached the Straight River.<br />
Figure 10b demonstrates that ground water flows (red arrows) down the hill in the eastern portion<br />
<strong>of</strong> Figure10b <strong>and</strong> intersects the surface at or near the Straight River. This is also the case in<br />
Figure 11. Generally <strong>and</strong> in this geologic setting, ground water follows the surface contours <strong>and</strong><br />
<strong>of</strong>ten intersects the ground surface at the base <strong>of</strong> a hill in the form <strong>of</strong> springs <strong>and</strong> surface flows.<br />
This scenario is supported by the fact that the clay Aquitard covers the hill (Figure 8a). East <strong>of</strong><br />
the river, ground water will only be able to infiltrate to the Aquitard surface <strong>and</strong> then flow<br />
downhill on top <strong>of</strong> the Aquitard surface.<br />
27
Figure 11.<br />
Because the prequarry Aquifer 1 water surface was at a higher elevation, the hydraulic gradient<br />
near Straight River would have been flat instead <strong>of</strong> dipping toward the quarry, as is currently the<br />
case (See Figure 8b). The prequarry water surface <strong>of</strong> Aquifer 1 would have been similar to the<br />
dark blue surface in Figure 10b as it flowed downhill east <strong>of</strong> the stream. Prior to the quarry, once<br />
the Aquifer 1 surface encountered the Aquifer 2 surface, the Aquifer 1 water surface would be at<br />
or above the light blue surface west <strong>of</strong> the stream.<br />
Figure 12 presents water level observations <strong>of</strong> Aquifer 1 (P1) <strong>and</strong> Aquifer 2 (M1) during 1999 <strong>and</strong><br />
2000. Before the pumping discontinued approximately August 8, 1999, the Aquifer 1 water level<br />
was above the potentiometric surface <strong>of</strong> Aquifer 2. During periods <strong>of</strong> pumping, ponds that reside<br />
within Aquifer 1 receive recharge from the pumped water, maintaining the Aquifer 1 elevation<br />
above the potentiometric surface <strong>of</strong> Aquifer 2. When the pumping discontinues, the water surfaces<br />
cross <strong>and</strong> the Aquifer 2 potentiometric surface lies above the Aquifer 1 water surface until pumping<br />
begins again around May 15, 2000. The graph identifies that dewatering <strong>of</strong> the quarry is having a<br />
greater impact on Aquifer 2 levels <strong>and</strong> that Aquifer 2 has an important influence on Aquifer 1 water<br />
levels when pumping is not a factor. It supports the prior assessment that the prequarry water<br />
surface <strong>of</strong> Aquifer 1 was at least equal to the potentiometric surface <strong>of</strong> Aquifer 2. It also indicates<br />
prequarry hydraulic gradient <strong>of</strong> Aquifer 1 was at least horizontal west <strong>of</strong> the Straight River,<br />
mirroring the Aquifer 2 potentiometric surface.<br />
29
Figure 12.<br />
Figure 13 presents the prequarry potentiometric surface in light blue, the June 1, 2005 Aquifer 1<br />
water surface in lavender, <strong>and</strong> the June 1 Aquifer 2 surface in medium blue. To separate the three<br />
water surfaces, Figure 12 has a vertical to horizontal exaggeration <strong>of</strong> 10 to 1. Remember that<br />
postquarry observed water levels are not available west <strong>of</strong> M-1 when viewing Figure 12.<br />
The significance <strong>of</strong> Figure 13 is the obvious melding <strong>of</strong> water surfaces near the Straight River <strong>and</strong><br />
the horizontal gradient <strong>of</strong> the ground-water surface west <strong>of</strong> the Straight River. Water levels within<br />
the pit area have rebounded to prequarry conditions. This is important because, if the pit is<br />
discontinued, water levels should rebound to their historic conditions.<br />
Since the prequarry gradient at the Straight River was at least horizontal, the river would have<br />
been gaining flow from the ground water east <strong>of</strong> the stream. Because no historic stream discharge<br />
data are available, this assumption cannot be confirmed. Yet, it is more likely that the stream<br />
reach was a gaining reach rather than a losing reach, which it may be under present-day<br />
conditions. In other words, the stream was receiving ground-water flow from east <strong>of</strong> the river,<br />
which contributed to the stream’s discharge or flow. Now that the hydraulic gradient west <strong>of</strong> the<br />
stream has been changed from horizontal to dipping toward the pit, the stream is no longer<br />
gaining flow <strong>and</strong> may be losing flow to the ground-water system west <strong>of</strong> the stream.<br />
30
Figure 13. (vertical exaggeration 10:1)<br />
Summary<br />
A summary <strong>of</strong> insights <strong>and</strong> observations facilitated by the three-dimensional model efforts are the<br />
following:<br />
• One confined aquifer (Aquifer 2) <strong>and</strong> one unconfined aquifer (Aquifer 1) are separated<br />
by a clay aquitard.<br />
• The Aquitard is leaky <strong>and</strong> Aquifer 2 is under artesian conditions. Depending on the<br />
height <strong>of</strong> the Aquifer 1 water surface, Aquifer 1 <strong>and</strong> Aquifer 2 supply water to each other.<br />
If Aquifer 1 is above the Aquifer 2 potentiometric surface, then Aquifer 2 receives water<br />
from Aquifer 1. If the case is reversed, the Aquifer 2 potentiometric surface controls<br />
Aquifer 1 water levels west <strong>of</strong> Straight River.<br />
• The quarry has penetrated the two aquifers <strong>and</strong> Aquitard.<br />
• Dewatering <strong>of</strong> the quarry has drawn the water surfaces <strong>of</strong> both aquifers down, causing a<br />
lowering <strong>of</strong> Aquifer 2’s potentiometric surface.<br />
• Domestic wells are constructed in Aquifer 2.<br />
• Lowering <strong>of</strong> the potentiometric surface may have caused a reduction in domestic well<br />
efficiency.<br />
• Prior to the quarry, the Straight River was gaining water from the ground water. Since<br />
dewatering has occurred, the stream no longer gains ground water <strong>and</strong> may be losing to<br />
the ground water because <strong>of</strong> the change in the hydraulic gradient <strong>of</strong> both aquifers’ water<br />
surfaces west <strong>of</strong> the stream.<br />
• Historic ground-water levels can be restored once pumping ceases. During periods <strong>of</strong><br />
inactivity within the quarry, pumping should cease to allow restoration <strong>of</strong> domestic<br />
supply levels <strong>and</strong> to return ground-water supplies to the Straight River. If further<br />
31
monitoring <strong>of</strong> the quarry operations continues, it is recommended to periodically obtain<br />
water levels <strong>of</strong> surrounding domestic wells, particularly west <strong>of</strong> the quarry.<br />
• A model is only as good as the information used to build the model. Well logs <strong>and</strong><br />
historic water level measurements are the most important input data. Little funding<br />
currently exists to maintain <strong>and</strong> enhance these two crucial databases; exp<strong>and</strong>ed support<br />
for basic information is needed so that we can provide answers to questions being asked<br />
about the roles aggregate mining <strong>and</strong> rock quarrying play in our water resources.<br />
32
APPENDIX 3. GLOSSARY<br />
Alluvial Pertaining to or consisting <strong>of</strong> alluvium, deposits made by streams on river beds,<br />
floodplains, <strong>and</strong> alluvial fans.<br />
Aquifer A layer <strong>of</strong> rock or unconsolidated material that yields water in usable quantities to a well<br />
or spring.<br />
Aquitard A layer <strong>of</strong> rock or unconsolidated material having very low hydraulic conductivity that<br />
restricts movement <strong>of</strong> water into an aquifer.<br />
Aggregate Any <strong>of</strong> several hard, inert materials, such as s<strong>and</strong>, gravel, crushed stone, or<br />
combinations, used for mixing in various-sized fragments with a cementing or bituminous<br />
material to form concrete, mortar, asphalt, or plaster; it may also be used alone as in railroad<br />
ballast or graded fill. Fine aggregate is the material that will pass a 0.25-inch screen, <strong>and</strong> coarse<br />
aggregate is the material that will not pass a 0.25-inch screen.<br />
Bedrock aggregate Crushed rock (hard, solid bedrock) used as aggregate.<br />
Carbonate rock A rock comprising more than 50% (by weight) calcite or dolomite or mixtures<br />
<strong>of</strong> the two, such as limestone or dolostone (dolomitic rock).<br />
Cobble A rock fragment between 2.5 inches (64 mm) <strong>and</strong> 10 inches (256 mm) in diameter.<br />
Conduit Relatively large solution voids, including enlarged fissures <strong>and</strong> tubular tunnels; in some<br />
usage the term is restricted to voids that are filled with water.<br />
Cone <strong>of</strong> depression A depression in the potentiometric surface <strong>of</strong> a body <strong>of</strong> water, which has the<br />
shape <strong>of</strong> an inverted cone <strong>and</strong> develops around a well from which water is being withdrawn.<br />
Dolostone A carbonate sedimentary rock that contains more than 90% <strong>of</strong> the mineral dolomite<br />
<strong>and</strong> less than 10% <strong>of</strong> the mineral calcite. Dolostone is commonly referred to as dolomite,<br />
dolomite rock, or dolomitic rock.<br />
<strong>Gravel</strong> General term for sediment consisting <strong>of</strong> pebbles, cobbles, <strong>and</strong> boulders. Commercially,<br />
the term gravel indicates a sedimentary deposit consisting <strong>of</strong> 20% or more pebbles, cobbles, <strong>and</strong><br />
boulders, admixed <strong>and</strong> interstratified with s<strong>and</strong>.<br />
<strong>Hydraulic</strong> conductivity A measurement <strong>of</strong> the capacity <strong>of</strong> geologic materials to transmit water<br />
commonly expressed in units <strong>of</strong> gallons per day per square foot.<br />
Karst An area <strong>of</strong> limestone or other highly soluble rock, in which the l<strong>and</strong>forms are <strong>of</strong><br />
dominantly solutional origin <strong>and</strong> in which the drainage is underground in solutionally enlarged<br />
fissures <strong>and</strong> conduits (caves). Karst processes significantly change the flow, transport, <strong>and</strong><br />
storage behavior <strong>of</strong> ground water in such areas; turbulent flow in conduits is a characteristic<br />
feature <strong>of</strong> karst systems even in areas where no surface features are present.<br />
Limestone. A carbonate sedimentary rock containing more than 95% <strong>of</strong> the mineral calcite <strong>and</strong><br />
less than 5% <strong>of</strong> the mineral dolomite. Carbonate rocks containing between 5% <strong>and</strong> 50% dolomite<br />
<strong>and</strong> 50% to 95% calcite are referred to as dolomitic limestones.<br />
Outwash S<strong>and</strong> <strong>and</strong> gravel transported or “washed out” from a glacier by meltwater streams <strong>and</strong><br />
deposited in front <strong>of</strong> or beyond the terminal moraine or the margin <strong>of</strong> an active glacier or ice<br />
sheet.<br />
Pebble A rock fragment between 0.8 inch (2 mm) <strong>and</strong> 2.5 inches (64 mm) in diameter.<br />
Piracy The process in which flow from a surface or subsurface stream is diverted into a different<br />
flow path by the physical change <strong>of</strong> the stream’s course.<br />
Pit (commercial sense) An opening in the l<strong>and</strong> surface from which unconsolidated rock materials<br />
are excavated for sale or commercial use.<br />
Potentiometric map A subsurface contour map showing the elevation <strong>of</strong> a potentiometric<br />
surface.<br />
Potentiometric or piezometric surface An imaginary surface representing the total head <strong>of</strong><br />
ground water <strong>and</strong> defined by the level to which water will rise in a well. The water table is a<br />
particular potentiometric surface.<br />
33
Quarry A mine or opening in the l<strong>and</strong> surface from which consolidated rock materials are<br />
excavated for sale or commercial use.<br />
S<strong>and</strong> Grains <strong>of</strong> rocks or minerals that range from 0.002 inch (0.062 mm) to 0.8 inch (2 mm) in<br />
diameter. S<strong>and</strong> grains are divided into five categories, depending on grain size: very coarse 1–2<br />
mm; coarse 0.5–1 mm; medium 0.25–0.5 mm; fine 0.25–0.125 mm; very fine 0.125–0.062 mm.<br />
Sedimentary rock A rock resulting from the consolidation <strong>of</strong> loose sediment that has<br />
accumulated in layers<br />
Shale A sedimentary rock consisting <strong>of</strong> thinly laminated <strong>and</strong> compressed clay. It has a low<br />
specific gravity <strong>and</strong> high absorption. Shale is a spall material that is highly deleterious to<br />
concrete.<br />
Sinkhole A small to medium sized closed depression formed by slow, concentrated solutional<br />
removal <strong>of</strong> rock in an area, from the surface downward or by the collapse <strong>of</strong> overlying rock into a<br />
cave or chamber beneath.<br />
Sorting A term used to indicate the amount <strong>of</strong> uniformity in particle size <strong>of</strong> a sediment; a wellsorted<br />
sediment contains particles <strong>of</strong> similar size.<br />
Spring Any natural discharge <strong>of</strong> water from rock or soil onto the surface <strong>of</strong> the l<strong>and</strong> or into a<br />
body <strong>of</strong> surface water.<br />
Stream sink A well-defined point <strong>of</strong> water loss ranging in size <strong>and</strong> shape from a cave entrance to<br />
narrow cracks in bedrock streambeds.<br />
Water table The upper surface or elevation <strong>of</strong> the ground water within the aquifer that is closest<br />
to the ground surface.<br />
34
APPENDIX 4. LIST OF REFERENCES<br />
Alex<strong>and</strong>er, E.C., Jr., Green, J.A., Alex<strong>and</strong>er, S.C., <strong>and</strong> Spong, R.C., 1995, Springsheds (Plate 9)<br />
in Geologic Atlas <strong>of</strong> Fillmore <strong>County</strong>, Minnesota: Minnesota Department <strong>of</strong> Natural<br />
Resources <strong>County</strong> Atlas Series C-8, Part B.<br />
Bolen, W.P., 2004, U.S. Geological Survey Mineral Commodity Summaries, January 2004.<br />
Drew, D. <strong>and</strong> Hötzl, H., eds., 1999, Karst hydrology <strong>and</strong> human activities: impacts, consequences<br />
<strong>and</strong> implications: Brookfield, Vt., A.A. Balkema Publishers, 322 p.<br />
Ewell, M., 2003, Mining <strong>and</strong> quarrying trends, USGS Mineral Survey.<br />
Fay, S.J. <strong>and</strong> Alex<strong>and</strong>er, E.C., Jr., 1994, Groundwater dye trace report: Watson-Warrington<br />
Group detention structure, section 17, township 112 north, range 15 west, Featherstone<br />
Township, <strong>Goodhue</strong> <strong>County</strong>, Minnesota, report to <strong>Goodhue</strong> <strong>County</strong> Soil <strong>and</strong> Water<br />
Conservation District, February 1994: University <strong>of</strong> Minnesota Department <strong>of</strong> Geology <strong>and</strong><br />
Geophysics, 25 p., 3 appendices.<br />
Green, J.A., Pavlish, J.A., Leete, J.H., <strong>and</strong> Alex<strong>and</strong>er, E.C., Jr., 2003, Quarrying impacts on<br />
groundwater flow paths, in Proceedings <strong>of</strong> the ninth multidisciplinary conference on<br />
sinkholes <strong>and</strong> the engineering <strong>and</strong> environmental impacts <strong>of</strong> karst, Huntsville, Ala., Sept. 6-<br />
10, 2003: Reston, Va., American Society <strong>of</strong> Civil Engineers.<br />
Heath, R.C., 1984, Basic ground-water hydrology: U.S. Geological Survey Water-Supply Paper<br />
2220.<br />
Lowe, D. <strong>and</strong> Waltham, T., 1995, Dictionary <strong>of</strong> karst <strong>and</strong> caves, No. 6: British Cave Research<br />
Association.<br />
Monroe, W.H., 1970, Glossary <strong>of</strong> karst terminology: U.S. Geological Survey Water-Supply Paper<br />
1899-K.<br />
Mossler, J.H., 1995, Bedrock geology (Plate2) in Geologic Atlas <strong>of</strong> Fillmore <strong>County</strong>, Minnesota:<br />
Minnesota Geological Survey <strong>County</strong> Atlas Series C-8, Part A.<br />
Nelson, S.L., Oberhelman, M.W., <strong>and</strong> Olson, D.J., 1990, Inventory <strong>of</strong> industrial mineral pits <strong>and</strong><br />
quarries in Minnesota: Minnesota Department <strong>of</strong> Natural Resources, Division <strong>of</strong> Minerals,<br />
Report 282, 2 vol.<br />
Runkel, A.C., Tipping, R.G., Alex<strong>and</strong>er, E.C., Jr., Green, J.A., Mossler, J.H., <strong>and</strong> Alex<strong>and</strong>er,<br />
S.C., 2003, Hydrogeology <strong>of</strong> the Paleozoic bedrock in southeastern Minnesota: Minnesota<br />
Geological Survey, Report <strong>of</strong> Investigations 61, 105 p., 2 pls.<br />
Southwick, D.L., Jouseau, M., Meyer, G.N., Mossler, J.H., <strong>and</strong> Wahl, T.E., 2000, Aggregate<br />
resources inventory <strong>of</strong> the seven-county metropolitan area, Minnesota: Minnesota Geological<br />
Survey Information Circular 46, 91 p.<br />
U.S. Geological Survey, 1974, Water resources <strong>of</strong> the Cannon River watershed, southeastern<br />
Minnesota: Hydrologic Investigations HA-522.<br />
U.S. Geological Survey, 1999, Fact Sheet 14-97.<br />
35