st. croix county conditions & trends report table of contents
st. croix county conditions & trends report table of contents
st. croix county conditions & trends report table of contents

Create successful ePaper yourself
Turn your PDF publications into a flip-book with our unique Google optimized e-Paper software.
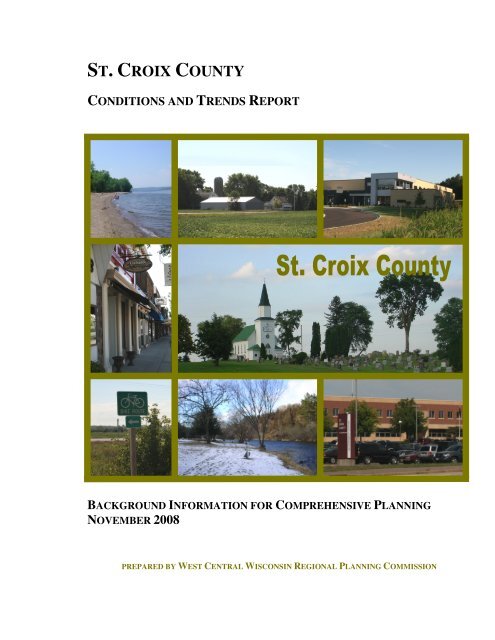
ST. CROIX COUNTY<br />
CONDITIONS AND TRENDS REPORT<br />
BACKGROUND INFORMATION FOR COMPREHENSIVE PLANNING<br />
NOVEMBER 2008<br />
PREPARED BY WEST CENTRAL WISCONSIN REGIONAL PLANNING COMMISSION
St. Croix County<br />
Conditions and Trends Report<br />
Presented to:<br />
St. Croix County and its Communities<br />
By:<br />
We<strong>st</strong> Central Wisconsin Regional Planning Commission<br />
Mail Box 9<br />
800 Wisconsin Street, Bldg D2-401<br />
Eau Claire, WI 54703-3606<br />
715.836.2918<br />
With financial assi<strong>st</strong>ance from:<br />
Wisconsin Department <strong>of</strong> Admini<strong>st</strong>ration<br />
Division <strong>of</strong> Intergovernmental Relations<br />
Final Version<br />
November 19, 2008
Forward<br />
The St. Croix County Conditions and Trends Report provides the majority <strong>of</strong> background<br />
information and exi<strong>st</strong>ing resource maps as required for comprehensive planning efforts<br />
under the Wisconsin Comprehensive Planning Law (Wis. Act 9). It is a compilation <strong>of</strong><br />
the “be<strong>st</strong> available” data available which would be needed for a typical planning effort.<br />
There are two companion documents to this <strong>report</strong>:<br />
St. Croix County Resource and Land Use Map Atlas DVD-ROM: This is a<br />
compilation <strong>of</strong> exi<strong>st</strong>ing resource and land use maps for the County and its<br />
municipalities in digital form. Land use data in these maps may need to be<br />
updated at the local level. We<strong>st</strong> Central Wisconsin Regional Planning<br />
Commission will provide the geographic information sy<strong>st</strong>em files for these maps<br />
upon reque<strong>st</strong>.<br />
Inventory <strong>of</strong> Exi<strong>st</strong>ing Plans, Programs, and Land Use Policies in We<strong>st</strong>-Central<br />
Wisconsin: As its title relates, this special addendum provides a summary <strong>of</strong> the<br />
primary programs, plans, and land use policies being implemented within the<br />
seven counties <strong>of</strong> we<strong>st</strong>-central Wisconsin.<br />
This <strong>report</strong> should be considered a <strong>st</strong>arting point for local planning efforts. Certain data<br />
and maps will need to be provided at a local level (e.g., maps and details on municipal<br />
utilities, special or regulatory di<strong>st</strong>ricts, park sy<strong>st</strong>ems, mining intere<strong>st</strong>s). Communities<br />
may also identify special issues or unique circum<strong>st</strong>ances for which additional data may<br />
be collected locally. And, for the mo<strong>st</strong> part, this <strong>report</strong> merely presents the data; the<br />
County and each community will need to analyze the data to determine local needs,<br />
issues, and important <strong>trends</strong>.<br />
We<strong>st</strong> Central Wisconsin Regional Planning Commission (WCWRPC) compiled this<br />
<strong>report</strong> as part <strong>of</strong> its regional comprehensive planning effort. A similar <strong>report</strong> is being<br />
compiled for each <strong>of</strong> the other six counties in our region. Once complete, a regional level<br />
analysis will be developed based on the data in the individual <strong>county</strong> <strong>report</strong>s.<br />
WCWRPC would like to thank everyone who provided input and data for this document,<br />
including: St. Croix County, the regional comprehensive planning effort’s Technical<br />
Advisory Group, and various State agencies (e.g., Dept. <strong>of</strong> Admini<strong>st</strong>ration, Dept. <strong>of</strong><br />
Natural Resources, Dept. <strong>of</strong> Commerce, Office <strong>of</strong> Economic Advisors, Dept. <strong>of</strong><br />
Workforce Development, Dept. <strong>of</strong> Transportation, Dept. <strong>of</strong> Health and Family Services).
ST. CROIX COUNTY<br />
CONDITIONS & TRENDS REPORT<br />
TABLE OF CONTENTS<br />
1. Issues and Opportunities Information.........................................................................1<br />
Introduction..........................................................................................................................1<br />
The County Setting ............................................................................................1<br />
Element Context.................................................................................................3<br />
Socio-Economic Pr<strong>of</strong>ile.......................................................................................................4<br />
Population ..........................................................................................................4<br />
Educational Attainment .....................................................................................8<br />
Employment.......................................................................................................8<br />
Income..............................................................................................................10<br />
Population Projections .....................................................................................11<br />
Household Projections .....................................................................................13<br />
Employment Projections..................................................................................13<br />
Summary ..........................................................................................................................14<br />
Data Tables ........................................................................................................................15<br />
2. Housing Information ...................................................................................................77<br />
Element Context.................................................................................................................77<br />
Housing Supply..................................................................................................................78<br />
Seasonal Units....................................................................................................................78<br />
Occupancy and Structural Characteri<strong>st</strong>ics .........................................................................79<br />
Age Characteri<strong>st</strong>ics ............................................................................................................79<br />
Housing Value Characteri<strong>st</strong>ics...........................................................................................80<br />
Housing Affordability........................................................................................................80<br />
Housing Unit and Household Projections..........................................................................81<br />
Housing Programs..............................................................................................................82<br />
Summary ..........................................................................................................................82<br />
Data Tables and Map .........................................................................................................84<br />
St. Croix County Conditions and Trends Report i
3. Transportation Information .....................................................................................105<br />
Element Context...............................................................................................................105<br />
Background Data/Exi<strong>st</strong>ing Conditions ............................................................................107<br />
Highways .......................................................................................................107<br />
Highway Projects in the County ....................................................................114<br />
Bridges ..........................................................................................................117<br />
Ru<strong>st</strong>ic Roads Sy<strong>st</strong>em......................................................................................119<br />
Access Management ......................................................................................120<br />
Designated Truck Routes...............................................................................120<br />
Transit ............................................................................................................121<br />
Bicycles..........................................................................................................122<br />
Pede<strong>st</strong>rian Facilities .......................................................................................123<br />
Safety .............................................................................................................126<br />
Commuting Patterns.......................................................................................128<br />
Railroads ........................................................................................................128<br />
Air Transportation..........................................................................................131<br />
Water Transportation .....................................................................................131<br />
Relevant Transportation Plans .........................................................................................132<br />
Summary ........................................................................................................................133<br />
4. Utilities and Community Facilities Information .....................................................135<br />
Element Context...............................................................................................................135<br />
Inventory <strong>of</strong> Utilities........................................................................................................136<br />
Sanitary Sewer and Wa<strong>st</strong>ewater Treatment ...................................................136<br />
On-Site Septic Sy<strong>st</strong>ems..................................................................................137<br />
Water Supply .................................................................................................138<br />
Stormwater Management...............................................................................140<br />
Telecommunications Facilities ......................................................................142<br />
Power Plants, Sub<strong>st</strong>ations, and Transmission Lines......................................144<br />
Electric Utilities .............................................................................................144<br />
Natural Gas Utilities ......................................................................................144<br />
Inventory <strong>of</strong> Educational Facilities..................................................................................145<br />
Non-Public Schools .......................................................................................145<br />
Public Schools................................................................................................146<br />
Cooperative Educational Service Agencies (CESA) .....................................147<br />
Vocational, Technical, and Adult Education .................................................147<br />
ii Table <strong>of</strong> Contents
University <strong>of</strong> Wisconsin Sy<strong>st</strong>em....................................................................148<br />
Other Colleges and Universities ....................................................................148<br />
Inventory <strong>of</strong> Other Community Facilities and Services ..................................................149<br />
Libraries .........................................................................................................149<br />
Solid Wa<strong>st</strong>e Disposal and Recycling Facilities .............................................150<br />
Law Enforcement...........................................................................................151<br />
Fire Departments............................................................................................152<br />
Ambulance .....................................................................................................152<br />
Fir<strong>st</strong> Responders.............................................................................................152<br />
Hazardous Materials Response......................................................................153<br />
Medical Facilities...........................................................................................153<br />
Child Care Services........................................................................................154<br />
Assi<strong>st</strong>ed Living Facilities, Nursing Homes, and Senior Programs................157<br />
Parks and Recreation Facilities......................................................................160<br />
Cemeteries......................................................................................................164<br />
Dams ..............................................................................................................165<br />
Other Government Facilities..........................................................................166<br />
Summary ........................................................................................................................167<br />
Utilities and Community Facilities Maps ........................................................................168<br />
5. Agricultural, Natural, and Cultural Resources Information.................................173<br />
Element Context...............................................................................................................173<br />
Agricultural Resources.....................................................................................................174<br />
Local Agricultural Indu<strong>st</strong>ry Trends ...............................................................174<br />
Prime Agricultural Lands...............................................................................180<br />
Natural Resources – Physical Features............................................................................181<br />
Topography....................................................................................................181<br />
Geology..........................................................................................................182<br />
Soils................................................................................................................182<br />
Mineral Resources .........................................................................................183<br />
Watersheds & Surface Waters .......................................................................184<br />
Water Quality by Watershed..........................................................................185<br />
Impaired Waters.............................................................................................185<br />
Out<strong>st</strong>anding and Exceptional Resource Waters.............................................186<br />
Point Source Discharges ................................................................................186<br />
Groundwater ................................................................................................. 186<br />
St. Croix County Conditions and Trends Report iii
Air Quality .................................................................................................... 188<br />
Natural Resources – Sensitive Lands...............................................................................188<br />
Shorelands......................................................................................................189<br />
Floodplains.....................................................................................................189<br />
Wetlands ........................................................................................................190<br />
Steep Slopes...................................................................................................190<br />
Fore<strong>st</strong>s and Woodlands..................................................................................191<br />
Grasslands and Prairie....................................................................................192<br />
Wildlife, Wildlife Habitat and Open Space ...................................................193<br />
Rare and Endangered Species and Natural Communities........................193<br />
State Natural Areas ..................................................................................194<br />
Wisconsin’s Land Legacy Report............................................................195<br />
Parks and Recreational Resources ...........................................................195<br />
Cultural Resources...........................................................................................................197<br />
Summary ........................................................................................................................200<br />
St. Croix County Natural Resource Map Series ..............................................................202<br />
6. Economic Development Information .......................................................................203<br />
Element Context...............................................................................................................203<br />
The Wisconsin Economy .................................................................................................203<br />
Recent Economic Trends ...............................................................................203<br />
The Current Economic Slowdown.................................................................205<br />
Wisconsin’s Economic Outlook ....................................................................206<br />
St. Croix County Economic Pr<strong>of</strong>ile .................................................................................207<br />
Economic Data...............................................................................................207<br />
Demographic Overview...........................................................................209<br />
Population and Labor Force.....................................................................209<br />
Housing Market .......................................................................................210<br />
Education .................................................................................................210<br />
Income and Wages...................................................................................211<br />
Employment Trends.................................................................................213<br />
Commuting Patterns.................................................................................215<br />
Economic Base...............................................................................................216<br />
Indu<strong>st</strong>ry Composition...............................................................................216<br />
Employment by Indu<strong>st</strong>ry..........................................................................217<br />
Employment by Occupation ....................................................................221<br />
iv Table <strong>of</strong> Contents
Employment Projections..........................................................................222<br />
Tourism..........................................................................................................226<br />
Environmentally Contaminated Sites ..............................................................................228<br />
Summary ........................................................................................................................229<br />
7. Land Use Information ...............................................................................................237<br />
Element Context...............................................................................................................237<br />
Exi<strong>st</strong>ing Land Use and Land Use Trends ........................................................................237<br />
Agricultural Land Use....................................................................................238<br />
Fore<strong>st</strong> Land Use .............................................................................................240<br />
Residential Land Use .....................................................................................240<br />
Commercial Land Use ...................................................................................241<br />
Indu<strong>st</strong>rial Land Use........................................................................................242<br />
Public Natural Resource Lands......................................................................242<br />
Land Demand and Prices ...............................................................................243<br />
Summary ........................................................................................................................244<br />
Land Use By Municipality Discussion ............................................................................246<br />
Town Land Use Summaries...........................................................................246<br />
Village Land Use Summaries ........................................................................251<br />
City Land Use Summaries .............................................................................253<br />
Land Use Tables ..............................................................................................................255<br />
Municipality Land Use Maps...........................................................................................266<br />
Limitations to Development Maps.................................................................266<br />
Exi<strong>st</strong>ing Land Use Maps................................................................................266<br />
St. Croix County Conditions and Trends Report v
Li<strong>st</strong> <strong>of</strong> Figures<br />
Figure 1.1 – St. Croix County Hi<strong>st</strong>orical Population...........................................................4<br />
Figure 1.2 – County Population Di<strong>st</strong>ribution by Incorporated & Rural Residents..............6<br />
Figure 1.3 – County Components <strong>of</strong> Population Change ....................................................7<br />
Figure 1.4 – County Racial Population Characteri<strong>st</strong>ics.......................................................8<br />
Figure 3.1 – Crashes by Highway Type (1998-2007) .....................................................126<br />
Figure 4.1 – Typical Septic Sy<strong>st</strong>em .................................................................................137<br />
Figure 5.1 – Number and Average Size <strong>of</strong> Farms ...........................................................175<br />
Figure 5.2 – Number <strong>of</strong> Farms and Dairy Farms (1987-2002)........................................178<br />
Figure 6.1 – Composite Index <strong>of</strong> Leading Indicators for Wisconsin (1990-2008)..........204<br />
Figure 6.2 – Gasoline & Medical Co<strong>st</strong>s Compared to Consumer Price Index ................205<br />
Figure 6.3 – St. Croix County Age/Labor Force Projection (2005-2030).......................210<br />
Figure 6.4 – St. Croix County vs. State Per Capita Personal Income (1997-2006).........212<br />
Figure 6.5 – St. Croix County & Wisconsin Monthly Unemployment Rate (1990-2008) .. 213<br />
Figure 6.6 – St. Croix County Monthly Total Potential Labor Force (1990-2008).........214<br />
Figure 6.7 – St. Croix County Travel Time to Work (1990, 2000) .................................215<br />
Figure 6.8 – St. Croix County Employment by Indu<strong>st</strong>ry (2006) .....................................218<br />
Figure 6.9 – We<strong>st</strong> Central Wisconsin Workforce Development Area.............................222<br />
Figure 6.10 – Traveler Expenditures in St. Croix County (1998-2007) ..........................227<br />
Figure 6.11 – Seasonality <strong>of</strong> Traveler Expenditures in St. Croix County (2007)............227<br />
Li<strong>st</strong> <strong>of</strong> Tables<br />
Table 1.1 – County Hi<strong>st</strong>orical Population..........................................................................15<br />
Table 1.2 – County and Surrounding Counties Hi<strong>st</strong>orical Population Change .................15<br />
Table 1.3 – County Hi<strong>st</strong>orical Population Change by Municpality...................................16<br />
Table 1.4 – County Components <strong>of</strong> Population Change ...................................................17<br />
Table 1.5 – County Hi<strong>st</strong>orical Population by Age and Sex ...............................................17<br />
Table 1.6 – County Change in Age-Sex Structure.............................................................17<br />
Table 1.7 – Population by Age and Sex by Municipality (2000) ......................................18<br />
Table 1.8 – Population by Age and Sex by Municipality (1990) ......................................21<br />
Table 1.9 – Percent Change in Age/Sex Structure by Municipality..................................24<br />
Table 1.10 – Population Projections, County and Municpality.........................................27<br />
Table 1.11 – Household Projections, County and Municpality.........................................28<br />
Table 1.12A –We<strong>st</strong> Central Wisconsin Region Occupation Projections (2014)...............29<br />
Table 1.12B – We<strong>st</strong> Central Wisconsin Region Indu<strong>st</strong>ry Projections (2004-2014)..........29<br />
Table 1.12C – Race Characteri<strong>st</strong>ics, County and Municipality.........................................30<br />
Table 1.13 – Educational Attainment Levels, County and Municipality ..........................31<br />
Table 1.14 – Labor Force, County and Municipality.........................................................38<br />
Table 1.15 – St. Croix County Employment (1990-2006) ................................................42<br />
Table 1.16 – Employment by Indu<strong>st</strong>ry, County and Municipality ....................................43<br />
Table 1.17 – Employment by Occupation, County and Municipality ...............................61<br />
Table 1.18 – Travel Time to Work by Municipality..........................................................73<br />
Table 1.19 – Place <strong>of</strong> Work, County and Municipality .....................................................73<br />
Table 1.20 – Households by Household Income by Municipality.....................................74<br />
Table 1.21 – Median Household Income (comparison <strong>of</strong> counties)..................................74<br />
Table 1.22 – Median Household Income (municipalities).................................................75<br />
vi Table <strong>of</strong> Contents
Table 2.1 – Housing Units, County and Municipality.......................................................84<br />
Table 2.2 – Seasonal Units, County and Municipality ......................................................85<br />
Table 2.3 – Housing Characteri<strong>st</strong>ics by County ................................................................86<br />
Table 2.4 – Units in Structure, County and Municipality..................................................87<br />
Table 2.5 – Year Structure Built, County and Municipality..............................................88<br />
Table 2.6 – Housing Value <strong>of</strong> Specified Owner-Occupied Units, County and MCD.......89<br />
Table 2.7 – Contract Rent (Renter-Occupied Units), County and Municipality ...............90<br />
Table 2.8 – Owner-Occupied Housing Co<strong>st</strong>s as Percentage <strong>of</strong> Household Income<br />
County and Municipality.................................................................................91<br />
Table 2.9 – Renter-Occupied Housing Co<strong>st</strong>s as a Percentage <strong>of</strong> Household Income<br />
County and Municipality.................................................................................92<br />
Table 2.10 – Housing Unit Projections, County and Municipality....................................93<br />
Table 2.11 – Household Projections, County and Municipality........................................94<br />
Table 2.12 – Housing Characteri<strong>st</strong>ics by Municipality .....................................................95<br />
Table 3.1 – Road Mileage by Jurisdiction - 2008............................................................107<br />
Table 3.2 – Traffic Volume Hi<strong>st</strong>ory (1992-2003) ..........................................................109<br />
Table 3.3 – Functionally Classified Road Mileage by Municipality...............................114<br />
Table 3.4 – WisDOT 6-year Plan project for St. Croix County ......................................115<br />
Table 3.5 – Ownership <strong>of</strong> Bridges in St. Croix County...................................................117<br />
Table 3.6 – Functionally Obsolete/Structurally Deficient Bridges, St. Croix County ....118<br />
Table 3.7 – St. Croix County Crash Hi<strong>st</strong>ory (1998-2007)...............................................126<br />
Table 3.8 – Highway Crashes by Municipality (2003-2007) ..........................................127<br />
Table 3.9 – Commuting Patterns <strong>of</strong> St. Croix County Residents by Municipality..........129<br />
Table 3.10 – Major Airport Improvement Projects .........................................................131<br />
Table 4.1 – Municipal Wa<strong>st</strong>ewater Sy<strong>st</strong>ems in St. Croix County ...................................136<br />
Table 4.2 – Municipal and Community Water Sy<strong>st</strong>ems in St. Croix County..................139<br />
Table 4.3 – Telephone Providers in St. Croix County.....................................................143<br />
Table 4.4 – Private Schools in St. Croix County.............................................................145<br />
Table 4.5 – Public Schools in St. Croix County ..............................................................146<br />
Table 4.6 – Enrollment <strong>of</strong> UW Campuses in We<strong>st</strong> Central Wisconsin...........................148<br />
Table 4.7 – Clinics and Hospitals in St. Croix County....................................................154<br />
Table 4.8 – Licensed Child Care Facilities in St. Croix County......................................155<br />
Table 4.9 – Assi<strong>st</strong>ed Living Facilities in St. Croix County .............................................159<br />
Table 4.10 – Primary Parks in St. Croix County .............................................................162<br />
Table 4.11 –St. Croix County Emergency Service Zones ...............................................164<br />
Table 5.1 – Acres in Farmland.........................................................................................175<br />
Table 5.2 – Number <strong>of</strong> Farms by Ownership ..................................................................176<br />
Table 5.3 – Assessed Agricultural Parcels and Acreage, County and Municipality .......177<br />
Table 5.4 – Soil Capability Classification for Agricultural Lands ..................................181<br />
Table 5.5 – Out<strong>st</strong>anding and Exceptional Waters............................................................186<br />
Table 5.6 – Permitted Municipal and Indu<strong>st</strong>rial Discharges............................................187<br />
Table 5.7 – Assessed Fore<strong>st</strong> Parcels and Acreage, County and Town ............................192<br />
Table 5.8 – Parks and Recreational Lands.......................................................................196<br />
Table 5.9 – Sites and Structures on the National Regi<strong>st</strong>er <strong>of</strong> Hi<strong>st</strong>oric Places .................197<br />
Table 5.10 – Architectural and Hi<strong>st</strong>ory Inventory Li<strong>st</strong>ings .............................................199<br />
Table 6.1 – St. Croix County Educational Attainment (1990,2000) ...............................211<br />
St. Croix County Conditions and Trends Report vii
Table 6.2 – St. Croix County Average Annual Wages by Indu<strong>st</strong>ry (2001-2006)............212<br />
Table 6.3 – St. Croix County Number <strong>of</strong> E<strong>st</strong>ablishments by Indu<strong>st</strong>ry (1998-2006) .......216<br />
Table 6.4 – St. Croix County Employment by Indu<strong>st</strong>ry (2001-2006) .............................217<br />
Table 6.5 – St. Croix County Top Employers as <strong>of</strong> March 2007 ....................................219<br />
Table 6.6 – We<strong>st</strong> Central Wi. E<strong>st</strong>imated Employment and Salary by Occup. (2004).....221<br />
Table 6.7 – We<strong>st</strong> Central Wi. Indu<strong>st</strong>ry Projections (2004-2014) ....................................223<br />
Table 6.8 – We<strong>st</strong> Central Wi. Occupation Projections and E<strong>st</strong>. Wages (2004-2014) .....224<br />
Table 6.9 – We<strong>st</strong> Central Wi. Occupation Projections (2014) ........................................225<br />
Table 6.10 – Contaminated Sites in St. Croix County.....................................................232<br />
Table 7.1 – County Land Use, 1997 and 2007 ................................................................238<br />
Table 7.2 – Acreage Loss <strong>of</strong> Land Assessed Agricultural by Municipality ....................238<br />
Table 7.3 – Percentage Loss <strong>of</strong> Land Assessed Agricultural by Municipality................239<br />
Table 7.4 – Mo<strong>st</strong> Agricultural Acres by Municipality.....................................................239<br />
Table 7.5 – Public Natural Resource Lands, 2005...........................................................242<br />
Table 7.6 – Assessed Residential Acres, County and Municipality ................................255<br />
Table 7.7 – Assessed Commercial Acres, County and Municipality ..............................256<br />
Table 7.8 – Assessed Indu<strong>st</strong>rial Acres, County and Municipality...................................257<br />
Table 7.9 – Assessed Agricultural Parcels and Acreage, County and Municipality .......258<br />
Table 7.10 – Assessed Fore<strong>st</strong> Parcels and Acreage by Town..........................................259<br />
Table 7.11 – Land Use Acreage, County and Municipality, 1987 ..................................260<br />
Table 7.12 – Land Use Acreage, County and Municipality, 1997 ..................................261<br />
Table 7.13 – Land Use Acreage, County and Municipality, 2007 ..................................262<br />
Table 7.14 – Agricultural Land Sales ..............................................................................263<br />
Table 7.15 – Fore<strong>st</strong>ed Land Sales....................................................................................264<br />
Table 7.16 – Land Value Per Acre by Town ...................................................................264<br />
Table 7.17 – Land Value Per Acre by City or Village.....................................................264<br />
viii Table <strong>of</strong> Contents
Li<strong>st</strong> <strong>of</strong> Maps<br />
1.1 – St. Croix County Locational Map...............................................................................1<br />
1.2 – St. Croix County Population Change 1970-2000 .......................................................5<br />
1.3 – St. Croix County Population Projections 2000-2030................................................11<br />
2.1 – St. Croix County Housing Unit Change 1970-2000 ...............................................104<br />
3.1 – County Roads, Airports, and Railroads ..................................................................106<br />
3.2 – County Rural Functional Classification..................................................................110<br />
3.3 – Hudson/N. Hudson Urban Functional Classification..............................................111<br />
3.4 – New Richmond Urban Functional Classification ...................................................112<br />
3.5 – River Falls (part) Urban Functional Classification.................................................113<br />
3.6 – Ru<strong>st</strong>ic Roads in the County ....................................................................................119<br />
3.7 – St. Croix County Bicycling Suitability Rating ......................................................124<br />
3.8 – St. Croix County Bicycle Sy<strong>st</strong>em Recommendations.............................................125<br />
3.7 – Railroad Ownership in We<strong>st</strong> Central Wisconsin ....................................................130<br />
4.1 – Vocational Di<strong>st</strong>ricts in the Region .........................................................................147<br />
4.2 – Electric Service in We<strong>st</strong> Central Wisconsin ...........................................................168<br />
4.3 – Natural Gas Service in We<strong>st</strong> Central Wisconsin ....................................................169<br />
4.4 – St. Croix County School Di<strong>st</strong>ricts...........................................................................170<br />
4.5 – St. Croix County Fire Di<strong>st</strong>ricts ...............................................................................171<br />
4.6 – St. Croix County Ambulance Di<strong>st</strong>ricts ...................................................................172<br />
Appendix A: St. Croix County Resource and Development Limitations Maps<br />
5.1 – Agricultural Lands<br />
5.2 – Prime Farmland<br />
5.3 – Soil Capability for Common Agricultural Crops<br />
5.4 – Elevation<br />
5.5 – General Soil Associations<br />
5.6 – Potential Sand and Gravel Deposits<br />
5.7 – Water Resources<br />
5.8 – Watersheds<br />
5.9 – Floodplain (100-year) and Frequently Flooded Soils<br />
5.10 – Wetlands<br />
5.11 – Steep Slopes<br />
5.12 – Fore<strong>st</strong>ed Areas<br />
5.13 – Grasslands<br />
5.14 – Endangered Species and Natural Communities<br />
7.1 – Shallow Depth to Bedrock<br />
7.2 – Shallow Depth to Groundwater<br />
7.3 – Limitations for Septic Sy<strong>st</strong>ems<br />
7.4 – Limitations for Residential Basements<br />
7.5 – Limitations for Small Commercial Buildings<br />
St. Croix County Conditions and Trends Report ix
St. Croix County Resource and Land Use Atlas DVD-ROM<br />
Base Maps........................................................... for cities, villages, and towns in the Atlas<br />
Agricultural Lands (cultivated fields)............................. for County and towns in the Atlas<br />
Prime Farmland............................................................... for County and towns in the Atlas<br />
Elevation .............................................................................for all communities in the Atlas<br />
General Soil Associations............................................... for County and towns in the Atlas<br />
Potential Sand & Gravel Deposits ............................. for all County and towns in the Atlas<br />
Surface Water Resources ....................................................for all communities in the Atlas<br />
Watersheds........................................................................................for County in the Atlas<br />
Floodplains (100-year) & Frequently Flooded Soils ..........for all communities in the Atlas<br />
Wetlands .............................................................................for all communities in the Atlas<br />
Steep Slopes........................................................................for all communities in the Atlas<br />
Fore<strong>st</strong>ed Areas ................................................................ for County and towns in the Atlas<br />
Shallow Depth to Bedrock..................................................for all communities in the Atlas<br />
Shallow Depth to Groundwater ..........................................for all communities in the Atlas<br />
Limitations for Septic Sy<strong>st</strong>ems ...........................................for all communities in the Atlas<br />
Limitations for Residential Basements ...............................for all communities in the Atlas<br />
Limitations for Small Commercial Buildings.....................for all communities in the Atlas<br />
Endangered Species and Natural Communities................................for County in the Atlas<br />
Town Land Use & Land Cover (2000) ..............................................for towns in the Atlas<br />
Village & City Land Use (2000)......................................for villages and cities in the Atlas<br />
x Table <strong>of</strong> Contents
1. ISSUES AND OPPORTUNITIES INFORMATION<br />
Introduction<br />
The County Setting<br />
St. Croix County is located in we<strong>st</strong> central Wisconsin and to the we<strong>st</strong> is separated from<br />
Minnesota by the St. Croix River. The <strong>county</strong> is bordered on the north by Polk County,<br />
the ea<strong>st</strong> by Dunn County and the south by Pierce County. St. Croix County has a<br />
combined land and water area <strong>of</strong> approximately 469,760 acres. This amounts to roughly<br />
734 square miles, <strong>of</strong> which 17 percent is in fore<strong>st</strong> cover and 70 percent is used for<br />
agriculture. The <strong>county</strong> is rectangular in shape and is about 33 miles ea<strong>st</strong> to we<strong>st</strong> and 24<br />
miles north to south. It ranks 40 th in land area and 20 th in population among the 72<br />
Wisconsin counties.<br />
Map 1.1 St. Croix County Locational Map<br />
Physically, St. Croix County is part <strong>of</strong> the We<strong>st</strong>ern Upland region <strong>of</strong> Wisconsin that<br />
extends ea<strong>st</strong> from and parallel to the St. Croix River, and is higher in elevation than the<br />
Central Plain to the ea<strong>st</strong>. The surface topography <strong>of</strong> the region varies from rolling plain<br />
to rugged hills and escarpments. The glaciers pushed through this area only leaving a<br />
portion <strong>of</strong> southwe<strong>st</strong> Wisconsin, southea<strong>st</strong> Minnesota, northern Illinois and northwe<strong>st</strong><br />
Iowa untouched on their southward march. This accounts for the southern two-thirds <strong>of</strong><br />
the We<strong>st</strong>ern Upland having rugged topography while the northern third is smoother. The<br />
St. Croix River which borders the we<strong>st</strong>ern <strong>county</strong> is a significant tributary <strong>of</strong> the<br />
Mississippi River. The St. Croix River enters the Mississippi River some seven and a<br />
half miles south <strong>of</strong> the St. Croix County border at Prescott, Wisconsin.<br />
St. Croix County Conditions and Trends Report 1
The topography <strong>of</strong> St. Croix County ranges from gently rolling, to hilly and rough. A<br />
large portion <strong>of</strong> the central part <strong>of</strong> the <strong>county</strong> is a rolling plain. This plain is broken by<br />
mesas <strong>of</strong> resi<strong>st</strong>ant rock formations in southwe<strong>st</strong>ern St. Croix County. The northwe<strong>st</strong>ern<br />
areas and ea<strong>st</strong>ern fringe <strong>of</strong> the <strong>county</strong> contain the mo<strong>st</strong> rugged topography.<br />
Continental glaciation covered the entire <strong>county</strong> which contributed greatly to its physical<br />
characteri<strong>st</strong>ics. While glacial deposition has occurred across the <strong>county</strong>, the mo<strong>st</strong><br />
prominent glacial features are the rough and scenic landscapes <strong>of</strong> the Towns <strong>of</strong> St. Joseph<br />
and Somerset, and the St. Croix River valley which was a major drainageway as the<br />
glaciers <strong>of</strong> the Plei<strong>st</strong>ocene Epoch receded. Rugged, hilly areas that resi<strong>st</strong>ed the scouring<br />
action <strong>of</strong> the glaciers are in the ea<strong>st</strong>ern part <strong>of</strong> the <strong>county</strong> and are noted for local relief<br />
averaging 200 feet.<br />
St. Croix County is almo<strong>st</strong> entirely in the St. Croix River Basin. A part <strong>of</strong> ea<strong>st</strong>ern St.<br />
Croix County lies within the Lower Chippewa River Basin. Numerous tributaries running<br />
into the Apple, Willow, Kinnickinnic, Rush, Eau Galle and Hay Rivers drain the County.<br />
There are also numerous lakes in the northwe<strong>st</strong>ern part <strong>of</strong> the County and in the Towns <strong>of</strong><br />
Somerset, Star Prairie, Stanton and St. Joseph.<br />
Within St. Croix County there are 21 unincorporated townships, 11 villages, and 4 cities.<br />
All but six towns in the County, the Towns <strong>of</strong> Somerset, St, Joseph, Hudson, Troy,<br />
Pleasant Valley and Rush River have boundaries that correspond to both the civil town<br />
boundary and the congressional survey township boundary. The former four have<br />
irregular boundaries along the St. Croix River and the latter two are each half <strong>of</strong> a survey<br />
township. The villages and cities include the Village <strong>of</strong> Spring Valley and City <strong>of</strong> River<br />
Falls which lie mo<strong>st</strong>ly in Pierce County. The City <strong>of</strong> Hudson is located on the we<strong>st</strong>ern<br />
edge <strong>of</strong> the <strong>county</strong> along the St. Croix River and is the <strong>county</strong> seat.<br />
The communities <strong>of</strong> St. Croix County are diverse not only because <strong>of</strong> their physical<br />
setting differences, but also because <strong>of</strong> the effects <strong>of</strong> differing human activity. The<br />
we<strong>st</strong>ern area contains the urban areas <strong>of</strong> the <strong>county</strong>. All territory, population and housing<br />
in urbanized areas and incorporated communities over 2,500 population outside <strong>of</strong><br />
urbanized areas are considered urban by the Bureau <strong>of</strong> the Census. The Cities <strong>of</strong> New<br />
Richmond and Hudson, and Village <strong>of</strong> North Hudson fit the urban classification.<br />
However, it is evident that the towns in the we<strong>st</strong>ern area are also urbanizing with rapid<br />
residential and commercial development. The Towns <strong>of</strong> Hudson, St. Joseph and Troy<br />
add about 16,000 people to about the same amount <strong>of</strong> people in the City <strong>of</strong> Hudson<br />
Village <strong>of</strong> North Hudson which they surround. This con<strong>st</strong>itutes an urbanizing area<br />
containing over 32,000 people. Another 28,000 people live in the next ring <strong>of</strong> towns<br />
(Somerset, Star Prairie, Richmond, Warren and Kinnickinnic) and the cities (New<br />
Richmond and River Falls) and villages (Roberts and Somerset) surrounded by them.<br />
Hence, in the we<strong>st</strong>ern part <strong>of</strong> the <strong>county</strong>, forty percent <strong>of</strong> the land area contains threefourths<br />
<strong>of</strong> the <strong>county</strong>’s population. The nearness to the Minneapolis-St. Paul<br />
metropolitan area and the rural life<strong>st</strong>yle amenities <strong>of</strong> we<strong>st</strong>ern Wisconsin can account for<br />
this urbanization. However, even the smaller villages in the central agricultural area and<br />
2 Issues and Opportunities Information
ea<strong>st</strong>ern wooded hills have felt some impact from the ea<strong>st</strong>ern migrations from Minnesota<br />
and the growth <strong>of</strong> the we<strong>st</strong>ern portion <strong>of</strong> the <strong>county</strong>.<br />
Major transportation corridors include U.S. Highway 53, which runs north-south through<br />
the we<strong>st</strong> half <strong>of</strong> the County; State Trunk Highway 29, which bisects the southern part <strong>of</strong><br />
the County running ea<strong>st</strong> and we<strong>st</strong>; State Trunk Highway 64, which runs we<strong>st</strong> and ea<strong>st</strong><br />
across the northern third <strong>of</strong> the County; and State Trunk Highway 27, which runs north<br />
and south in roughly the ea<strong>st</strong>ern third <strong>of</strong> the County. A relatively fine network <strong>of</strong> town<br />
roads di<strong>st</strong>ributes traffic to numerous <strong>county</strong> trunk highways.<br />
St. Croix County is the ea<strong>st</strong>ernmo<strong>st</strong> <strong>county</strong> in the Minneapolis-St. Paul Metropolitan<br />
area. The influence <strong>of</strong> economic opportunities and residential migration from the<br />
metropolitan area was recognized by the U.S. Census Bureau in 1980 when St. Croix<br />
County was added to the Minneapolis-St. Paul Metropolitan Stati<strong>st</strong>ical Area. A<br />
Metropolitan Stati<strong>st</strong>ical Area is a <strong>county</strong> or counties with a central city <strong>of</strong> at lea<strong>st</strong> 50,000<br />
people, a total population over 100,000, and significant social and economic ties which<br />
exi<strong>st</strong> between the central city and any outlying counties that are included. As a result <strong>of</strong><br />
the 1990 Census, Pierce County to the south <strong>of</strong> St. Croix County was included in the<br />
Minneapolis-St. Paul Metropolitan Stati<strong>st</strong>ical Area by the Census Bureau. Hence, it is<br />
apparent that the influence <strong>of</strong> the metro area is spreading. Polk County to the north <strong>of</strong> St.<br />
Croix County is also feeling the influence <strong>of</strong> the metro area.<br />
Element Context<br />
This section is a primary source for the necessary background information for the Issues<br />
and Opportunities Element <strong>of</strong> a comprehensive plan for communities in St. Croix County.<br />
A socio-economic pr<strong>of</strong>ile for all <strong>of</strong> St. Croix County is provided, which provides the<br />
demographic context for communities developing their individual plans.<br />
Overall comprehensive planning goals and objectives for the County are not provided in<br />
this section; in<strong>st</strong>ead, each community comprehensive plan will contain its own individual<br />
vision, goals and objectives. Exi<strong>st</strong>ing governmental programs and policies are also not<br />
provided here, but are reviewed in the Addendum: Inventory <strong>of</strong> Exi<strong>st</strong>ing Plans, Programs,<br />
& Land Use Policies in We<strong>st</strong> Central Wisconsin.<br />
St. Croix County Conditions and Trends Report 3
Socio-Economic Pr<strong>of</strong>ile<br />
Population<br />
Analyzing population size, growth, density, characteri<strong>st</strong>ics and di<strong>st</strong>ribution <strong>trends</strong> reveals<br />
important facts about the mo<strong>st</strong> important component <strong>of</strong> growth and development in St.<br />
Croix County ⎯ its residents. Reviewing population characteri<strong>st</strong>ics will reveal important<br />
indicators <strong>of</strong> change that mu<strong>st</strong> be recognized to effectively prepare for change.<br />
Between 1900 and 1950, St. Croix County’s population has remained fairly <strong>st</strong>eady, with<br />
small declines in the decades <strong>of</strong> the 1900s, 1920s and 1930s, and small increases in the<br />
decades <strong>of</strong> the 1910s and 1940s. In the decades between 1940 and 1980, the <strong>county</strong>’s<br />
population increased at an accelerating rate, ultimately resulting in the <strong>county</strong>’s highe<strong>st</strong><br />
growth decade in the 1970s (26%). The population growth rate declined somewhat in the<br />
1980s (16.2%) only to have the 1990s (25.7%) almo<strong>st</strong> match the growth <strong>of</strong> the 1970s.<br />
Recently between 2000 and 2008, the County’s population increased by 16,547 people,<br />
or 26.2 percent. If such a rate <strong>of</strong> growth were continued throughout the decade it would<br />
result in a decennial rate <strong>of</strong> 32.8 percent. See Figure 1.1 below, and Table 1.1 and 1.2 at<br />
the end <strong>of</strong> this section.<br />
Figure 1.1<br />
St. Croix County Hi<strong>st</strong>orical Population 1900 to 2008<br />
Population<br />
90,000<br />
80,000<br />
70,000<br />
60,000<br />
50,000<br />
40,000<br />
30,000<br />
20,000<br />
10,000<br />
0<br />
1900 1910 1920 1930 1940 1950 1960 1970 1980 1990 2000 2008<br />
Year<br />
source: U.S. Census Bureau; Wisconsin Department <strong>of</strong> Admini<strong>st</strong>ration 2008 e<strong>st</strong>imate<br />
From 1990 to 2000, the Town <strong>of</strong> Hudson had the highe<strong>st</strong> rate <strong>of</strong> population growth as a<br />
percentage <strong>of</strong> its population in St. Croix County at 68.3 percent (see Table 1.3 at end <strong>of</strong><br />
section). The following communities also had significant population growth:<br />
Towns <strong>of</strong> Star Prairie 40.3%<br />
Somerset 33.9%<br />
Warren 31.0%<br />
4 Issues and Opportunities Information
St. Joseph 29.3%<br />
Troy 28.5%<br />
Kinnickinnic 22.9%<br />
Village <strong>of</strong> Somerset 46.1%<br />
Village <strong>of</strong> Baldwin 31.9%<br />
City <strong>of</strong> Hudson 37.6%<br />
City <strong>of</strong> River Falls 31.0% (portion within St. Croix County)<br />
City <strong>of</strong> New Richmond 23.6%<br />
Map 1.2<br />
St. Croix County Population Change 1970 to 2000<br />
In terms <strong>of</strong> actual population increases, the Town and City <strong>of</strong> Hudson had the large<strong>st</strong><br />
number <strong>of</strong> new residents, 2,521 and 2,397, respectively between 1990 and 2000. Two<br />
villages and four towns ⎯ Roberts and Deer Park, and Fore<strong>st</strong>, Stanton, Cylon and<br />
St. Croix County Conditions and Trends Report 5
Baldwin ⎯ saw population decreases between 1990 and 2000 <strong>of</strong> -7.1 percent and 4.2<br />
percent, and -3.9 percent, -3.7 percent, -1.6% percent and -0.9 percent, respectively.<br />
Map 1.2 shows the population change for St. Croix County communities between 1970<br />
and 2000. The highe<strong>st</strong> growth during this period occurred in the Town <strong>of</strong> Hudson and<br />
the portion <strong>of</strong> Village <strong>of</strong> Spring Valley within St. Croix County. The Town and Village<br />
<strong>of</strong> Somerset, the portion <strong>of</strong> River Falls within St. Croix County, the Towns <strong>of</strong> St. Joseph,<br />
Star Prairie, Troy and Warren, and the Villages <strong>of</strong> North Hudson and Woodville also saw<br />
significant growth. The Towns <strong>of</strong> Fore<strong>st</strong>, Glenwood, and Springfield lo<strong>st</strong> population<br />
overall during the period.<br />
Since 2000 significant growth has continued in many communities, even through serious<br />
economic downturns. Indeed, it appears that in the fir<strong>st</strong> decade <strong>of</strong> the 21 <strong>st</strong> Century the<br />
County will experience its highe<strong>st</strong> hi<strong>st</strong>orical growth. The communities with the highe<strong>st</strong><br />
growth rates between 2000 and 2008 were the Towns <strong>of</strong> Richmond (85.3%), Hammond<br />
(78.8%), Somerset (30.4%), Hudson (27.7%), Troy (23.8%), Eau Galle (22.1%),<br />
Kinnickinnic (20.6%) and Star Prairie (20.4%), the Villages <strong>of</strong> Roberts (60.4%),<br />
Somerset (47.8%), Hammond (42.1%), Baldwin (33.8%) and Woodville (20.3%), and the<br />
Cities <strong>of</strong> Hudson (35.2%), New Richmond (26.6%) and River Falls (within St. Croix<br />
County, 22.6%).<br />
For the fir<strong>st</strong> time, in 1960s, the percentage urban or rural non-farm residents surpassed<br />
the percentage rural farm residents (see Figure 1.2).<br />
Figure 1.2<br />
St. Croix County Population Di<strong>st</strong>ribution by Urban & Rural Residents, 1960 to 2000<br />
Percent <strong>of</strong> Total Population<br />
60<br />
50<br />
40<br />
30<br />
20<br />
10<br />
0<br />
1960 1970 1980 1990 2000<br />
Year<br />
source: U.S. Census Bureau<br />
Urban Rural Farm Rural Non-Farm<br />
6 Issues and Opportunities Information
The number <strong>of</strong> rural farm residents continued to decrease, con<strong>st</strong>ituting only 4.5 percent <strong>of</strong><br />
the County’s population in 2000, a decrease <strong>of</strong> approximately 76.8 percent (or 9,530 farm<br />
residents) since 1960. Since 1980, the urban population has been increasing in its<br />
percentage <strong>of</strong> the total population indicating more people may be choosing city and small<br />
town life over rural living.<br />
The 1970s and 1990s are the only recent decades in which the population increase in St.<br />
Croix County has been more from in-migration <strong>of</strong> new residents than natural increase<br />
(see Table 1.4 and Figure 1.3). The natural increase rate for the 1990s was at a 50-year<br />
low for the <strong>county</strong>.<br />
Figure 1.3<br />
St. Croix County Components <strong>of</strong> Population Change 1950 to 2000<br />
People<br />
14,000<br />
12,000<br />
10,000<br />
8,000<br />
6,000<br />
4,000<br />
2,000<br />
0<br />
-2,000<br />
Source: U.S. Census Bureau<br />
1950-60 1960-70 1970-80 1980-90 1990-00<br />
Year<br />
Natural Increase Net Migration<br />
The average age <strong>of</strong> St. Croix County residents increased seven years from 1980 to 2000<br />
to 35.0 years (see Table 1.5). Population increased in every age group except 30-34<br />
between 1990 and 2000 (see Table 1.5 and Table 1.6). The middle-age groups (35-60)<br />
increased sub<strong>st</strong>antially during 1990s, with a very large population increase <strong>of</strong> 80 percent<br />
in the 45-54 age group.<br />
The 1990 and 2000 age-by-sex breakdowns for each municipality in St. Croix County are<br />
included at the end <strong>of</strong> this section in Table 1.7 and 1.8. Table 1.9, also at the end <strong>of</strong> this<br />
section, shows the percentage change from 1990 to 2000 for each municipality by agesex<br />
group.<br />
Overall, St. Croix County’s population is relatively homogenous, with 97.4 percent <strong>of</strong> the<br />
population in the white, non-Hispanic ethnic group. Figure 1.4 shows the di<strong>st</strong>ribution <strong>of</strong><br />
the population by race for the other 2.6 percent <strong>of</strong> the population (representing 1,630<br />
St. Croix County Conditions and Trends Report 7
persons in 2000) for 1990 and 2000. During the pa<strong>st</strong> decade, the population in all racial<br />
groups increased, with the Asian and Hispanic or Latino groups increasing mo<strong>st</strong> to<br />
become the large<strong>st</strong> minority populations in St. Croix County. Table 1.12C shows the<br />
race characteri<strong>st</strong>ics <strong>of</strong> St. Croix County in 2000.<br />
Figure 1.4<br />
St. Croix County Racial Population Characteri<strong>st</strong>ics 1990 to 2000<br />
People<br />
1400<br />
1200<br />
1000<br />
800<br />
600<br />
400<br />
200<br />
0<br />
Source: U.S. Census Bureau<br />
Educational Attainment<br />
The Decennial Census provides information on educational attainment levels, which are<br />
li<strong>st</strong>ed in Table 1.13. All St. Croix County communities saw a greater percentage <strong>of</strong><br />
residents 25 years or older with high school or higher education levels in 2000 than in<br />
1990. These indicators certainly demon<strong>st</strong>rate a well-educated population.<br />
It should be no surprise with the large inve<strong>st</strong>ments in education and the increasing<br />
requirement for technical or po<strong>st</strong>-secondary degrees for job placement that larger<br />
numbers <strong>of</strong> people are pursuing higher education. St. Croix County communities have<br />
had a significant percentage <strong>of</strong> people who have attained high school or higher<br />
educational levels (91.6 percent in 2000). Since 1990, more St. Croix County residents<br />
have pursued po<strong>st</strong>-secondary education. In 2000, 58.3 percent <strong>of</strong> St. Croix County<br />
residents 25 years or older had attended a po<strong>st</strong>-secondary in<strong>st</strong>itution, with 35.2 percent<br />
achieving a degree.<br />
Employment<br />
Black American<br />
Indian<br />
Asian White<br />
Hispanic<br />
Year<br />
1990 2000<br />
Other<br />
The area’s current economic growth is a major contributor to the employment<br />
opportunities available to St. Croix County residents. The principal economic factors that<br />
influence an individual's quality <strong>of</strong> life and provide a choice <strong>of</strong> residential options are<br />
8 Issues and Opportunities Information
employment opportunities and income. A comparison <strong>of</strong> labor force and employment<br />
<strong>st</strong>ati<strong>st</strong>ics for 1990 to 2000 provides some insight into the economic well-being <strong>of</strong> St.<br />
Croix County community residents.<br />
Personal income is derived primarily from employment wages. An individual's<br />
occupation determines the range <strong>of</strong> that wage scale and influences the personal <strong>st</strong>andard<br />
<strong>of</strong> living. A comparison <strong>of</strong> the occupations <strong>of</strong> those employed in the labor force helps to<br />
determine the economic affect <strong>of</strong> the employment opportunities available to area<br />
residents, and the ability to increase their <strong>st</strong>andard <strong>of</strong> living.<br />
While the segment <strong>of</strong> the population eligible for the labor force in St. Croix County grew<br />
by nearly 30 percent between 1990 and 2000 (Table 1.14), the actual number in the labor<br />
force increased by 33.8 percent. The employed residents in the labor force increased by<br />
35.8 percent over the same period, while the percentage <strong>of</strong> unemployed residents<br />
decreased by one and a half percentage points. Based on these <strong>st</strong>ati<strong>st</strong>ics, it appears that a<br />
growing number <strong>of</strong> County residents had been finding employment opportunities in the<br />
1990s. The economic downturn early in the decade <strong>st</strong>arting in 2000 makes it uncertain<br />
how the labor force and employment has been affected in St. Croix County; however, in<br />
Table 1.15 we can see indicators in employment for St. Croix County that may reveal the<br />
recent economic slowdown, but not the present apparent economic recovery.<br />
The Census Bureau collects place-<strong>of</strong>-residence employment data. This means these data<br />
can tell us in what indu<strong>st</strong>ries or occupations the residents <strong>of</strong> St. Croix County<br />
communities work, but not where they work. Table 1.16 at the end <strong>of</strong> this section<br />
compares the indu<strong>st</strong>ries in which St. Croix County residents worked between 1990 and<br />
2000. Between 1990 and 2000, St. Croix County residents were increasingly employed in<br />
Con<strong>st</strong>ruction, and Educational, Health and Social Services indu<strong>st</strong>ries. Manufacturing<br />
employment, while increasing in number, decreased slightly as a percentage <strong>of</strong> total<br />
employment. Perhaps surprising is the <strong>st</strong>eady decrease in County residents’ employment<br />
in the Retail Trade indu<strong>st</strong>ry found in the Census. As seen in Table 1.15, Retail Trade<br />
employment within St. Croix County increased <strong>st</strong>eadily throughout the 1990s. It is likely<br />
that there is either a discrepancy between the data sources, or workers outside <strong>of</strong> the<br />
County are increasingly filling much <strong>of</strong> the retail employment in St. Croix County. Table<br />
1.17 shows in what occupations St. Croix County residents were employed as opposed to<br />
the indu<strong>st</strong>ries depicted in Table 1.16. St. Croix County communities experienced very<br />
little change in residents’ occupations, except for Farming, Fore<strong>st</strong>ry and Fishing, which<br />
decreased by 80 percent between 1990 and 2000, and Sales, Admini<strong>st</strong>rative Support and<br />
Service occupations, which increased by 32 percent.<br />
Table 1.15 shows St. Croix County non-farm employment. As previously mentioned,<br />
these data could indicate whether the economic downturn in the early part <strong>of</strong> the decade<br />
<strong>st</strong>arting in the year 2000 is having an impact on St. Croix County communities. Although<br />
one cannot see what is happening in each municipality, one could infer that the trend<br />
defined for St. Croix County is likely to show changes in employment opportunities for<br />
the residents <strong>of</strong> mo<strong>st</strong> St. Croix County communities. After <strong>st</strong>eady employment growth in<br />
the 1990s, a decrease in employment is evident since 2000, mo<strong>st</strong> likely reflecting the<br />
St. Croix County Conditions and Trends Report 9
national economic downturn. The 2006 data shows a slight rebound but ju<strong>st</strong> is not enough<br />
information to indicate the impact <strong>of</strong> the current economic recovery in St. Croix County.<br />
Although the Decennial Census’s <strong>st</strong>andard available information limits employment<br />
information to place <strong>of</strong> residence, it also provides information that can indicate St. Croix<br />
County’s commuting characteri<strong>st</strong>ics. Table 1.18 shows how long it took St. Croix County<br />
residents to get to work in 1990 and 2000. During this period, the percentage <strong>of</strong> residents<br />
who worked at home or commuted less than 20 minutes decreased, while the percentage<br />
<strong>of</strong> residents who commuted 20 minutes or more increased. The percentage <strong>of</strong> residents<br />
who worked at home or commuted less than 20 minutes to work decreased by 12 percent<br />
between 1990 and 2000, while the percentage <strong>of</strong> residents who commuted 20 minutes or<br />
more to work increased by 13 percent. Between 1990 and 2000, the actual number <strong>of</strong><br />
residents working at home or commuting less than 20 minutes to work increased by less<br />
than 20 percent, while those taking 20 minutes or more to get to work increased by 54<br />
percent.<br />
In general, St. Croix County residents are experiencing even longer commutes to work.<br />
This is important, in part because it is one indicator <strong>of</strong> the use <strong>of</strong> the exi<strong>st</strong>ing<br />
transportation infra<strong>st</strong>ructure. For example, growing commute times, coupled with a<br />
growing population, results in an increased demand for road maintenance and expansion.<br />
It is uncertain if this trend will continue with recent increases in energy prices.<br />
Studying the special di<strong>st</strong>ribution <strong>of</strong> workers and employment centers is helpful with<br />
economic development efforts and transportation infra<strong>st</strong>ructure management. The Census<br />
information that reveals actual commuting patterns is called Place <strong>of</strong> Residence / Place <strong>of</strong><br />
Work shown in Table 1.19.<br />
In 2000, about 42 percent <strong>of</strong> the workers living in the County worked in the seven-<strong>county</strong><br />
Minneapolis/St. Paul metro core, 12 percent in the City <strong>of</strong> Hudson and about 35 percent<br />
in the remainder <strong>of</strong> St. Croix County.<br />
Income<br />
The combined effect <strong>of</strong> advanced education and increased employment opportunities, and<br />
evidence <strong>of</strong> well-paying occupations, is also reflected in the earning capability and<br />
increasing incomes <strong>of</strong> St. Croix County residents. Table 1.20 shows household income<br />
di<strong>st</strong>ribution for St. Croix County households in 1989 and 1999. Table 1.21 shows the<br />
changes in income <strong>of</strong> St. Croix County and surrounding County residents between 1990<br />
and 2000. Finally, Table 1.22 shows the median household income for all St. Croix<br />
County communities.<br />
Household income is the sum <strong>of</strong> money income received in the calendar year before the<br />
Decennial Census is collected by all household members 15 years old and over, including<br />
household members not related to the householder, people living alone, and other nonfamily<br />
household members. Included in the total are amounts <strong>report</strong>ed separately for<br />
wage or salary income; net self-employment income; intere<strong>st</strong>, dividends, or net rental or<br />
10 Issues and Opportunities Information
oyalty income or income from e<strong>st</strong>ates and tru<strong>st</strong>s; Social Security or Railroad Retirement<br />
income; Supplemental Security Income (SSI); public assi<strong>st</strong>ance or welfare payments;<br />
retirement, survivor, or disability pensions; and all other income. The median is the<br />
mathematically derived middle value with 50 percent above and 50 percent below that<br />
number.<br />
It can be seen from Table 1.21 that St. Croix County is above average when compared to<br />
the incomes <strong>of</strong> surrounding counties. Certainly counties with, or closer to, larger urban<br />
centers have a greater “economic engine” that provides employment opportunities and<br />
resultant higher income. Those counties with lower incomes all have smaller urban<br />
centers or are further away from significant employment centers such as the Twin Cities.<br />
The data indicates that between 1990 and 2000 incomes for St. Croix County community<br />
residents increased fa<strong>st</strong>er than inflation; indeed, the County median household income is<br />
above that <strong>of</strong> the State <strong>of</strong> Wisconsin as a whole. It can also be seen that the median<br />
household income in 22 communities is below the County median household income,<br />
including almo<strong>st</strong> all cities and villages, while 26 communities have median household<br />
incomes higher than that <strong>of</strong> the <strong>st</strong>ate as a whole.<br />
Population Projections<br />
Population projections have long been used to assess development prospects and<br />
community facility needs created by population growth. Small area population foreca<strong>st</strong>s<br />
can be used to evaluate potential residential development and economic <strong>conditions</strong>, and<br />
the level <strong>of</strong> demand for public facilities and services. Businesses, schools and<br />
government frequently use these foreca<strong>st</strong>s to determine the future needs or design <strong>of</strong><br />
public facilities or services. This e<strong>st</strong>imate <strong>of</strong> future growth is also valuable information<br />
for e<strong>st</strong>ablishing management techniques to guide orderly growth and development.<br />
Projecting population is not a science in which absolutes can be placed. Consequently,<br />
there are limitations that should be remembered when reviewing and evaluating these<br />
foreca<strong>st</strong>s. These limitations include:<br />
� Population projections are based on hi<strong>st</strong>orical <strong>trends</strong> <strong>of</strong> population growth that are<br />
extended into the future, and the assumption that those <strong>trends</strong>, and the factors behind<br />
them, will continue to some point in time.<br />
� Foreca<strong>st</strong>s <strong>of</strong> large area populations (e.g., <strong>st</strong>ates or counties) are more reliable. The<br />
smaller the area for which a projection is produced, like an individual community, the<br />
greater the possibility for error.<br />
� The closer the projection year is to the base year; the more likely the population for<br />
that projection will be close to the true population.<br />
� Population projections are, at be<strong>st</strong>, guides and their limitations mu<strong>st</strong> be considered.<br />
Intimate knowledge <strong>of</strong> local <strong>conditions</strong> can help build local variables into population<br />
projections to enhance their validity.<br />
St. Croix County Conditions and Trends Report 11
The Wisconsin Department <strong>of</strong> Admini<strong>st</strong>ration (DOA) population projections are, by <strong>st</strong>ate<br />
<strong>st</strong>atute, the <strong>of</strong>ficial population projections for Wisconsin. Over the about next 22 years,<br />
the DOA projections predict a 117.5 percent increase in the St. Croix County population<br />
(about 58,000 more residents). The percentage increases within the cities are anticipated<br />
to be a bit higher on average than the villages and towns (see Map 1.3 and Table 1.10).<br />
The large<strong>st</strong> rates <strong>of</strong> increase are expected in the Towns <strong>of</strong> Hammond, Richmond, Hudson<br />
and Somerset, the Villages <strong>of</strong> Somerset, Hammond, Roberts, and Baldwin, and the Cities<br />
<strong>of</strong> Hudson and New Richmond.<br />
Map 1.3<br />
St. Croix County Population Projections 2000 to 2030<br />
12 Issues and Opportunities Information
Household Projections<br />
A household foreca<strong>st</strong> is used to help develop housing and land use foreca<strong>st</strong>s. The<br />
Wisconsin Department <strong>of</strong> Admini<strong>st</strong>ration, Demographic Services has prepared household<br />
projections for year 2000 to 2030 in five-year increments found in Table 1.11.<br />
Employment Projections<br />
In May 2008, the Wisconsin Department <strong>of</strong> Workforce Development (WDWD) Office <strong>of</strong><br />
Economic Advisors (OEA) released a series <strong>of</strong> publications entitled OEA 2006-2016<br />
Statewide Long-term Projections. In addition, a WDWD, OEA <strong>report</strong> entitled<br />
Occupation Projections for We<strong>st</strong> Central Wisconsin Workforce Development Area, 2004-<br />
2014 was also released in Augu<strong>st</strong> <strong>of</strong> 2006. These <strong>report</strong>s make economic projections<br />
regarding the <strong>st</strong>ate’s labor force, indu<strong>st</strong>ries and occupations.<br />
Municipal units within St. Croix County have employment patterns that are similar to the<br />
<strong>st</strong>ate. It is expected that during the next several years, Wisconsin’s population is<br />
projected to grow slower and older than the nation as a whole, therefore leading to lower<br />
participation rates in the workforce. Wisconsin is also having difficulty attracting<br />
dome<strong>st</strong>ic migrants and retaining its own citizens. However, international immigrants are<br />
increasing significantly. Wisconsin will continue to face the challenge <strong>of</strong> filling job<br />
openings. The indu<strong>st</strong>ries that are projected to add the mo<strong>st</strong> jobs from 2006-2016 are<br />
ambulatory health care services, admini<strong>st</strong>rative and support services, eating and drinking<br />
e<strong>st</strong>ablishments, hospitals, social assi<strong>st</strong>ance and pr<strong>of</strong>essional, scientific and technical<br />
services. The top six occupations in Wisconsin with the greate<strong>st</strong> expected job growth for<br />
2006-2016 are retail salespersons (32,400); cashiers (31,400); waiters/waitresses<br />
(30,900); regi<strong>st</strong>ered nurses (21,800); cu<strong>st</strong>omer service representatives (21,000); and<br />
combined food preparation/serving workers (20,800). For further labor force and<br />
economic base indicators refer to Section 6, Economic Development Element.<br />
Table 1.12A presents employment and wage projections by the top 10 occupations for the<br />
Wisconsin Department <strong>of</strong> Workforce Development We<strong>st</strong> Central Wisconsin Region. This<br />
represents the occupation opportunities available for St. Croix County residents. The<br />
greate<strong>st</strong> demand for workers is in the occupations on the ‘Mo<strong>st</strong> Openings’ li<strong>st</strong>. This li<strong>st</strong><br />
includes many occupations considered as fir<strong>st</strong>-time, or temporary, jobs that workers <strong>of</strong>ten<br />
leave as other opportunities open up. Turnover is high and wages are low. There is one<br />
exception on the li<strong>st</strong>: regi<strong>st</strong>ered nurses which requires a greater degree <strong>of</strong> education or<br />
training and reflects a higher wage scale.<br />
The ‘Fa<strong>st</strong>e<strong>st</strong> Growth’ occupations are <strong>of</strong>ten referred to as hot jobs, with more training<br />
requirements and better wages. There are <strong>of</strong>ten fewer openings in these jobs since the li<strong>st</strong><br />
is based on the greate<strong>st</strong> percent change in employment; for example, an occupation that<br />
increases from 5 to 10 jobs increased 100 percent, whereas an occupation that increases<br />
from 2,000 to 2,200 jobs increased only 10 percent.<br />
St. Croix County Conditions and Trends Report 13
Table 1.12B shows employment projections by indu<strong>st</strong>ry for the We<strong>st</strong> Central Wisconsin<br />
Region. The greate<strong>st</strong> potential growth for employment appears to be in health and<br />
education related fields, while computer and electronic product manufacturing appears to<br />
be at risk <strong>of</strong> losing employment. Information and pr<strong>of</strong>essional services, and the leisure<br />
and hospitality indu<strong>st</strong>ry have the potential to add significant employment by 2014.<br />
Summary<br />
Certain <strong>trends</strong> become apparent after reviewing the <strong>county</strong>wide demographic and<br />
economic information. Studying these <strong>trends</strong> and their implications on local quality <strong>of</strong><br />
life will be useful in guiding public decision making. Since 1970, St. Croix County has<br />
experienced some <strong>of</strong> the fa<strong>st</strong>e<strong>st</strong> population growth in the <strong>st</strong>ate; however, being part <strong>of</strong> the<br />
Minneapolis/St. Paul metropolitan area it is clear its future is somehow linked to the<br />
vitality <strong>of</strong> the area.<br />
Since 1960, there has been an explosion <strong>of</strong> rural non-farm residents. Indeed, among<strong>st</strong> the<br />
rural population there has been a transformation from a largely farm population to a rural<br />
non-farm population. Significant rural development may be curtailed because <strong>of</strong> the<br />
developing energy situation with a continuing shift occurring in the urban/rural mix, with<br />
an increasing percentage <strong>of</strong> the County’s inhabitants living in or near the urban areas.<br />
Since 1960 St. Croix County has seen fairly con<strong>st</strong>ant natural increase in population with<br />
two periods where in-migration exceeded natural increase (1970-1980 and 1990-2000).<br />
It is clear that the national trend <strong>of</strong> an aging population is reflected in St. Croix County.<br />
Large numbers <strong>of</strong> people will be achieving retirement age over the next 20 years. While<br />
the St. Croix County population will be aging, it will also be changing its racial and<br />
ethnic characteri<strong>st</strong>ics. The County’s Asian and Hispanic populations can be expected to<br />
continue to increase significantly.<br />
St. Croix County residents have become more educated over the pa<strong>st</strong> several decades.<br />
Without adequate employment opportunities this can lead to the loss <strong>of</strong> increasingly wellqualified<br />
individuals moving to other areas <strong>of</strong>fering those opportunities. While about 42<br />
percent <strong>of</strong> St. Croix County workers commute to the Twin Cities local employment is<br />
fairly <strong>st</strong>rong, especially in the manufacturing sector.<br />
Overall, the previously analyzed <strong>trends</strong> reveal that St. Croix County will continue to be<br />
vigorous with continued dramatic growth in population and employment, and its<br />
communities will face several challenges as a result. Over the next several sections <strong>of</strong> the<br />
Conditions and Trends Report, other factors that affect St. Croix County communities<br />
will be explored. With further analysis <strong>of</strong> these following sections it is hoped that a clear<br />
picture <strong>of</strong> where St. Croix County has been, and is now, will emerge. This will help<br />
communities frame the issues that face them, the changes that are likely to impact them<br />
and the ways they can address those changes to achieve the community character they<br />
desire.<br />
14 Issues and Opportunities Information
Data Tables<br />
Table 1.1<br />
St. Croix County Hi<strong>st</strong>orical Population 1900 to 2008<br />
Year<br />
Population<br />
Numerical<br />
Change<br />
Percent<br />
Change<br />
1900 26,830 --- ---<br />
1910 25,910 -920 -3.4<br />
1920 26,106 196 7.6<br />
1930 25,455 -651 -2.5<br />
1940 24,842 -613 -2.4<br />
1950 25,905 1,063 4.3<br />
1960 29,164 3,259 12.6<br />
1970 34,354 5,190 17.8<br />
1980 43,262 8,908 25.9<br />
1990 50,251 6,989 16.2<br />
2000 63,155 12,904 25.7<br />
2008 79,702 16,547 26.2<br />
source: U.S. Census Bureau, WisDOA 2007 preliminary e<strong>st</strong>imate<br />
Table 1.2<br />
St. Croix County and Area Counties Hi<strong>st</strong>orical Population Change 1960 to 2000<br />
1960 to 1970 1970 to 1980 1980 to 1990 1990 to 2000<br />
County No. Pct. No. Pct. No. Pct. No. Pct.<br />
St. Croix County 5,190 17.8 8,908 25.9 6,989 16.2 12,904 25.7<br />
Barron County -315 -0.9 4,775 14.1 2,020 5.2 4,213 10.3<br />
Dunn County 2,998 11.5 5,160 17.8 1,595 4.7 3,949 11.0<br />
Pierce County 4,149 18.4 4,497 16.9 1,616 5.9 4,039 12.3<br />
Polk County 1,698 6.8 5,685 21.3 2,422 7.5 6,546 18.8<br />
Washington County 30,516 58.2 30,623 36.8 32,289 28.4 55,270 37.9<br />
source: U.S. Census Bureau<br />
St. Croix County Conditions and Trends Report 15
Table 1.3<br />
St. Croix County Hi<strong>st</strong>orical Population and Population Change, 1960 to 2008, by MCD<br />
1960 1970 1980 1990 2000 2008 '60-'70 '70-'80 '80-'90 '90-'00 '00-'08<br />
Towns<br />
Baldwin 833 890 943 911 903 965 6.8% 6.0% -3.4% -0.9% 6.9%<br />
Cady 762 670 724 643 710 815 -12.1% 8.1% -11.2% 10.4% 14.8%<br />
Cylon 614 620 717 639 629 672 1.0% 15.6% -10.9% -1.6% 6.8%<br />
Eau Galle 717 720 897 756 882 1,077 0.4% 24.6% -15.7% 16.7% 22.1%<br />
Emerald 647 588 638 630 691 801 -9.1% 8.5% -1.3% 9.7% 15.9%<br />
Erin Prairie 499 516 661 647 658 683 3.4% 28.1% -2.1% 1.7% 3.8%<br />
Fore<strong>st</strong> 674 649 631 614 590 642 -3.7% -2.8% -2.7% -3.9% 8.8%<br />
Glenwood 835 764 715 700 755 871 -8.5% -6.4% -2.1% 7.9% 15.4%<br />
Hammond 773 764 822 819 947 1,693 -1.2% 7.6% -0.4% 15.6% 78.8%<br />
Hudson 649 925 2,012 3,692 6,213 7,931 42.5% 117.5% 83.5% 68.3% 27.7%<br />
Kinnickinnic 667 755 1,051 1,139 1,400 1,688 13.2% 39.2% 8.4% 22.9% 20.6%<br />
Pleasant Valley 310 330 360 384 430 497 6.5% 9.1% 6.7% 12.0% 15.6%<br />
Richmond 701 1,091 1,338 1,400 1,556 2,883 55.6% 22.6% 4.6% 11.1% 85.3%<br />
Rush River 403 439 476 419 498 529 8.9% 8.4% -12.0% 18.9% 6.2%<br />
St. Joseph/Houlton 1,068 1,357 2,180 2,657 3,436 3,884 27.1% 60.6% 21.9% 29.3% 13.0%<br />
Somerset 976 1,185 1,833 1,975 2,644 3,447 21.4% 54.7% 7.7% 33.9% 30.4%<br />
Springfield 814 811 816 772 808 930 -0.4% 0.6% -5.4% 4.7% 15.1%<br />
Stanton 640 975 1,083 1,042 1,003 1,004 52.3% 11.1% -3.8% -3.7% 0.1%<br />
Star Prairie 1,015 1,390 1,900 2,098 2,944 3,544 36.9% 36.7% 10.4% 40.3% 20.4%<br />
Troy 845 1,517 2,326 2,850 3,661 4,534 79.5% 53.3% 22.5% 28.5% 23.8%<br />
Warren 614 622 897 1,008 1,320 1,541 1.3% 44.2% 12.4% 31.0% 16.7%<br />
sub-total<br />
Villages<br />
15,056 17,578 23,020 25,795 32,678 40,631 16.8% 31.0% 12.1% 26.7% 24.3%<br />
Baldwin 1,184 1,399 1,620 2,022 2,667 3,568 18.2% 15.8% 24.8% 31.9% 33.8%<br />
Deer Park 221 217 232 237 227 222 -1.8% 6.9% 2.2% -4.2% -2.2%<br />
Hammond 645 768 991 1,097 1,153 1,638 19.1% 29.0% 10.7% 5.1% 42.1%<br />
North Hudson 1,019 1,547 2,218 3,101 3,463 3,700 51.8% 43.4% 39.8% 11.7% 6.8%<br />
Roberts 308 484 833 1,043 969 1,554 57.1% 72.1% 25.2% -7.1% 60.4%<br />
Somerset 729 778 860 1,065 1,556 2,300 6.7% 10.5% 23.8% 46.1% 47.8%<br />
Spring Valley* 0 0 0 0 2 4 - - - - 100.0%<br />
Star Prairie 331 362 420 507 574 645 9.4% 16.0% 20.7% 13.2% 12.4%<br />
Wilson 140 130 155 163 176 205 -7.1% 19.2% 5.2% 8.0% 16.5%<br />
Woodville 430 522 725 942 1,104 1,328 21.4% 38.9% 29.9% 17.2% 20.3%<br />
sub-total<br />
Cities<br />
5,007 6,207 8,054 10,177 11,891 15,164 24.0% 29.8% 26.4% 16.8% 27.5%<br />
Glenwood City 835 822 950 1,026 1,183 1,218 -1.6% 15.6% 8.0% 15.3% 3.0%<br />
Hudson 4,325 5,049 5,434 6,378 8,775 11,865 16.7% 7.6% 17.4% 37.6% 35.2%<br />
New Richmond 3,316 3,707 4,306 5,106 6,310 7,981 11.8% 16.2% 18.6% 23.6% 26.5%<br />
River Falls* 625 991 1,498 1,769 2,318 2,843 58.6% 51.2% 18.1% 31.0% 22.6%<br />
sub-total 9,101 10,569 12,188 14,279 18,586 23,907 16.1% 15.3% 17.2% 30.2% 28.6%<br />
Total 29,164 34,354 43,262 50,251 63,155 79,702 17.8% 25.9% 16.2% 25.7% 26.2%<br />
source: U.S. Census Bureau; 2008 Wisconsin Department <strong>of</strong> Admini<strong>st</strong>ration E<strong>st</strong>imate<br />
*Portion <strong>of</strong> Spring Valley and River Falls located in St. Croix County only.<br />
Year Percent Change<br />
16 Issues and Opportunities Information
Table 1.4<br />
St. Croix County Components <strong>of</strong> Population Change 1950 to 2000<br />
1950 to<br />
1960<br />
1960 to<br />
1970<br />
1970 to<br />
1980<br />
1980 to<br />
1990<br />
1990 to<br />
2000<br />
Births 7,016 6,872 6,544 7,859 7,838<br />
Deaths 2,606 2,880 3,136 3,542 4,035<br />
Total Natural Increase 4,410 3,992 3,408 4,317 3,803<br />
Natural Increase Rate 15.1% 11.6% 7.9% 8.6% 6.9%<br />
Net Migration -1,151 1,198 5,500 2,671 9,101<br />
Net Migration Rate -3.9% 3.5% 12.7% 5.3% 14.4%<br />
Total Population Change 3,259 5,190 8,908 6,989 12,904<br />
Percent Population Change 12.6% 17.8% 25.9% 16.2% 25.7%<br />
source: Wisconsin Department <strong>of</strong> Health and Human Services and WisDOA Demographic Services<br />
Table 1.5<br />
St. Croix County Hi<strong>st</strong>orical Population by Age and Sex 1980 to 2000<br />
Male Female Total<br />
Age 1980 1990 2000 1980 1990 2000 1980 1990 2000<br />
0-4 1,885 2,115 2,275 1,803 2,025 2,148 3,688 4,140 4,423<br />
5-9 1,851 2,244 2,539 1,816 2,124 2,382 3,667 4,368 4,921<br />
10-14 3,943 2,229 2,573 1,880 2,089 2,551 5,823 4,318 5,124<br />
15-19 2,236 1,805 2,491 2,127 1,721 2,250 4,363 3,526 4,741<br />
20-24 1,858 1,524 1,857 1,896 1,502 1,711 3,754 3,026 3,568<br />
25-29 1,868 2,060 2,067 1,777 2,006 2,045 3,645 4,066 4,112<br />
30-34 1,819 2,394 2,377 1,714 2,472 2,355 3,533 4,866 4,732<br />
35-44 2,568 4,298 5,752 2,511 4,112 5,753 5,079 8,410 11,505<br />
45-54 1,994 2,572 4,630 1,940 2,372 4,288 3,934 4,944 8,918<br />
55-59 914 908 1,472 881 878 1,417 1,795 1,786 2,889<br />
60-64 698 863 1,005 729 838 996 1,427 1,701 2,001<br />
65-74 1,055 1,230 1,506 1,258 1,440 1,666 2,313 2,670 3,172<br />
75+ 819 820 1,064 1,302 1,610 1,985 2,121 2,430 3,049<br />
Median Age 28.0 31.6 35.0<br />
source: U.S. Census Bureau<br />
Table 1.6<br />
St. Croix County Change in Age-Sex Structure 1970 to 2000<br />
Change – Male Change – Female Total Change Total Pct Change<br />
Age 1980-90 1990-00 1980-90 1990-00 1980-90 1990-00 1980-90 1990-00<br />
0-4 230 160 222 123 452 283 10.9 6.4<br />
5-9 393 295 308 258 701 553 16.0 11.2<br />
10-14 -1,714 344 209 462 -1,505 806 -34.9 15.7<br />
15-19 -431 686 -406 529 -837 1,215 -23.7 25.6<br />
20-24 -334 333 -394 209 -728 542 -24.1 15.2<br />
25-29 192 7 229 39 421 46 10.4 11.2<br />
30-34 575 -17 -758 -117 1,333 -134 27.4 -2.8<br />
35-44 1,730 1,454 1,601 1,641 3,331 3,095 39.6 26.9<br />
45-54 578 2,058 432 1,916 1,010 3,974 20.4 44.6<br />
55-59 -6 564 -3 539 -9 1,103 0.5 38.2<br />
60-64 165 142 109 158 274 300 8.7 15.0<br />
65-74 175 276 182 226 357 502 13.4 15.8<br />
75+ 1 244 308 375 309 619 12.7 20.3<br />
source: U.S. Census Bureau<br />
St. Croix County Conditions and Trends Report 17
Table 1.7<br />
Population by Age and Sex by Municipality – 2000 St. Croix County<br />
Baldwin (T)<br />
Cady (T)<br />
Cylon (T)<br />
Eau Galle (T)<br />
Emerald (T)<br />
Erin Prairie (T)<br />
Fore<strong>st</strong> (T)<br />
18 Issues and Opportunities Information<br />
Glenwood (T)<br />
Hammond (T)<br />
Hudson (T)<br />
Kinnickinnic (T)<br />
Pleasant Valley<br />
(T)<br />
Total 903 710 629 882 691 658 590 755 947 6,213 1,400 430 1,556 498<br />
Median Age 39.0 36.5 37.3 37.8 35.3 36.6 36.8 34.9 37.1 34.2 37.0 34.0 35.1 38.7<br />
Male 444 365 339 459 356 334 318 404 489 3,188 694 218 799 259<br />
Female 459 345 290 423 335 324 272 351 458 3,025 706 212 757 239<br />
Male<br />
Under 5 years 19 24 31 18 25 19 21 23 26 242 44 19 58 14<br />
5 to 9 years 22 25 25 42 24 27 27 32 40 296 61 16 63 20<br />
10 to 14 years 39 30 22 36 30 26 23 43 47 314 68 23 79 21<br />
15 to 17 years 37 20 17 32 21 15 27 29 31 213 26 11 51 18<br />
18 and 19 years 10 12 7 11 10 14 6 17 17 96 18 5 18 11<br />
20 years 4 7 1 6 5 3 4 0 3 23 8 3 6 4<br />
21 years 6 1 7 2 5 6 4 4 7 20 2 4 8 1<br />
22 to 24 years 11 10 14 9 8 9 10 6 8 70 17 6 27 3<br />
25 to 29 years 19 24 15 19 19 18 15 20 19 144 20 10 40 5<br />
30 to 34 years 16 16 23 29 23 12 20 27 22 228 45 15 50 15<br />
35 to 39 years 43 38 26 43 32 41 25 29 51 336 68 15 76 24<br />
40 to 44 years 57 26 26 35 32 35 27 51 37 335 66 19 77 35<br />
45 to 49 years 43 39 28 41 39 25 22 37 54 295 70 26 66 19<br />
50 to 54 years 40 22 28 31 17 25 21 19 31 251 76 12 64 16<br />
55 to 59 years 19 25 17 34 18 25 17 13 26 155 39 6 32 12<br />
60 and 61 years 9 2 8 6 8 6 5 8 10 42 8 3 10 6<br />
62 to 64 years 12 4 10 16 11 5 10 9 6 38 9 4 13 5<br />
65 to 69 years 12 11 14 22 9 8 13 11 20 53 18 7 31 11<br />
70 to 74 years 13 13 10 11 6 7 7 12 15 17 17 7 14 10<br />
75 to 79 years 10 9 7 10 8 4 6 5 12 10 8 4 11 3<br />
80 to 84 years 2 4 3 4 4 2 7 5 4 5 4 3 2 5<br />
85 years and over 1 3 0 2 2 2 1 4 3 5 2 0 3 1<br />
Female<br />
Under 5 years 19 21 13 25 25 20 17 17 23 229 46 15 47 14<br />
5 to 9 years 36 33 14 34 31 30 22 27 29 279 49 17 55 15<br />
10 to 14 years 39 24 27 44 29 30 18 43 56 328 70 21 77 23<br />
15 to 17 years 33 19 19 24 17 22 14 30 37 160 45 13 46 14<br />
18 and 19 years 22 8 4 8 9 7 8 7 16 63 23 6 23 6<br />
20 years 3 2 3 3 6 6 1 6 0 24 7 2 8 1<br />
21 years 3 5 1 1 1 2 2 0 4 22 10 3 13 1<br />
22 to 24 years 15 11 9 8 5 5 7 1 9 52 16 4 14 7<br />
25 to 29 years 14 15 19 15 21 20 14 21 16 123 20 14 38 6<br />
30 to 34 years 23 21 21 33 27 19 20 26 26 285 42 14 55 19<br />
35 to 39 years 34 29 27 41 25 25 16 32 47 333 73 17 73 26<br />
40 to 44 years 55 35 23 42 37 39 32 31 34 346 65 24 76 25<br />
45 to 49 years 54 22 25 30 32 19 15 29 50 274 75 23 71 17<br />
50 to 54 years 24 21 23 27 20 23 23 11 26 209 57 9 49 11<br />
55 to 59 years 24 26 20 26 19 18 13 16 24 141 34 9 25 17<br />
60 and 61 years 9 6 6 11 2 5 9 3 8 39 7 2 12 4<br />
62 to 64 years 5 6 11 5 7 6 8 6 8 32 13 3 14 2<br />
65 to 69 years 18 15 9 20 4 7 8 18 18 35 16 8 25 13<br />
70 to 74 years 13 12 5 11 9 6 10 10 8 21 14 3 13 10<br />
75 to 79 years 8 5 5 5 6 6 12 9 6 10 14 3 15 3<br />
80 to 84 years 3 6 4 9 1 6 2 5 9 12 7 1 2 3<br />
85 years and over 5 3 2 1 2 3 1 3 4 8 3 1 6 2<br />
Table 1.7 continued on next page<br />
Richmond (T)<br />
Rush River (T)
Table 1.7 continued<br />
Population by Age and Sex by Municipality – 2000 St. Croix County<br />
St. Joseph (T)<br />
Somerset (T)<br />
Springfield (T)<br />
Stanton (T)<br />
Star Prairie (T)<br />
Troy (T)<br />
St. Croix County Conditions and Trends Report 19<br />
Warren (T)<br />
Baldwin (V)<br />
Deer Park (V)<br />
Hammond (V)<br />
North Hudson<br />
(V)<br />
Total 3,436 2,644 808 1,003 2,944 3,661 1,320 2,667 227 1,153 3,463 969 1,556<br />
Median Age 37.4 36.0 38.0 36.0 31.9 36.5 35.9 35.4 35.8 33.9 34.6 31.8 27.4<br />
Male 1,811 1,381 422 509 1,573 1,884 1,270 109 541 1,754 484 751 1,270<br />
Female 1,625 1,263 386 494 1,371 1,777 1,397 118 612 1,709 485 805 1,397<br />
Male<br />
Under 5 years 125 98 22 31 106 135 88 10 37 149 31 63 88<br />
5 to 9 years 173 94 27 31 119 167 84 6 36 136 32 67 84<br />
10 to 14 years 175 134 42 37 152 167 81 3 34 126 23 44 81<br />
15 to 17 years 78 74 22 32 69 99 62 1 36 72 33 48 62<br />
18 and 19 years 48 31 12 18 49 52 41 3 15 37 18 35 41<br />
20 years 14 14 5 7 35 21 13 1 13 22 10 9 13<br />
21 years 12 10 6 6 27 15 21 1 6 23 5 6 21<br />
22 to 24 years 26 33 17 18 62 54 59 3 19 62 26 57 59<br />
25 to 29 years 68 59 16 25 130 64 98 14 46 144 42 95 98<br />
30 to 34 years 122 112 23 35 127 127 114 11 50 129 53 60 114<br />
35 to 39 years 179 142 32 47 123 185 97 7 42 157 34 75 97<br />
40 to 44 years 212 136 46 46 149 196 82 9 50 161 42 56 82<br />
45 to 49 years 139 127 39 46 124 159 84 8 36 136 36 42 84<br />
50 to 54 years 157 98 34 40 104 150 68 5 44 135 24 28 68<br />
55 to 59 years 96 80 26 30 65 117 57 6 16 89 32 18 57<br />
60 and 61 years 29 22 3 11 18 35 15 0 4 29 8 7 15<br />
62 to 64 years 42 27 9 7 31 41 21 3 4 35 12 3 21<br />
65 to 69 years 48 30 13 17 33 40 39 6 7 40 8 11 39<br />
70 to 74 years 34 27 18 14 33 30 43 6 13 37 6 8 43<br />
75 to 79 years 23 18 5 6 12 17 39 2 12 18 7 11 39<br />
80 to 84 years 7 12 5 4 3 10 34 4 9 12 1 4 34<br />
85 years and over 4 3 0 1 2 3 30 0 12 5 1 4 30<br />
Female<br />
Under 5 years 115 85 13 35 90 142 110 6 37 116 31 82 110<br />
5 to 9 years 132 111 30 36 139 155 82 6 49 125 32 79 82<br />
10 to 14 years 145 114 37 40 121 141 82 12 50 133 31 65 82<br />
15 to 17 years 62 58 27 41 70 96 54 13 27 80 28 21 54<br />
18 and 19 years 23 26 8 16 32 40 26 2 18 39 13 18 26<br />
20 years 7 8 7 3 12 15 21 2 3 15 8 8 21<br />
21 years 12 9 3 6 14 14 15 0 10 14 7 15 15<br />
22 to 24 years 28 33 9 14 38 23 72 1 26 59 25 60 72<br />
25 to 29 years 73 70 14 24 113 89 97 11 41 119 47 87 97<br />
30 to 34 years 115 97 23 30 113 122 99 6 42 154 31 60 99<br />
35 to 39 years 194 131 47 40 129 193 98 11 48 154 47 84 98<br />
40 to 44 years 195 131 35 49 135 197 89 5 51 177 46 55 89<br />
45 to 49 years 149 102 34 41 94 164 82 11 42 138 24 41 82<br />
50 to 54 years 137 93 19 27 86 137 55 2 35 124 45 30 55<br />
55 to 59 years 85 64 21 23 61 101 51 5 18 95 22 10 51<br />
60 and 61 years 29 15 5 11 12 25 15 1 7 27 3 10 15<br />
62 to 64 years 30 20 10 14 23 33 31 5 5 35 4 11 31<br />
65 to 69 years 37 35 16 20 32 39 60 6 16 32 12 15 60<br />
70 to 74 years 33 31 12 12 26 25 67 5 22 27 9 21 67<br />
75 to 79 years 10 13 12 7 17 15 66 4 20 16 6 10 66<br />
80 to 84 years 6 14 2 3 9 7 64 2 15 14 9 13 64<br />
85 years and over 8 3 2 2 5 4 61 2 30 16 5 10 61<br />
Table 1.7 continued on next page<br />
Roberts (V)<br />
Somerset (V)*
Table 1.7 continued<br />
Population by Age and Sex by Municipality – 2000 St. Croix County<br />
Spring Valley<br />
(V) *<br />
Star Prairie (V)<br />
Wilson (V)<br />
Woodville (V)<br />
Glenwood City<br />
(C)<br />
20 Issues and Opportunities Information<br />
Hudson (C)<br />
New Richmond<br />
(C)<br />
Total 2 574 176 1,104 1,183 8,775 6,310 2,318<br />
Median Age 67.0 32.1 36.5 33.7 35.7 33.3 34.5 37.9<br />
Male 1 285 93 538 558 4,240 3,018 1,034<br />
Female 1 289 83 566 625 4,535 3,292 1,284<br />
Male<br />
Under 5 years 0 25 9 46 36 351 225 64<br />
5 to 9 years 0 25 5 47 48 316 277 71<br />
10 to 14 years 0 18 10 36 58 283 207 76<br />
15 to 17 years 0 8 6 21 33 164 132 37<br />
18 and 19 years 0 8 1 18 18 81 76 32<br />
20 years 0 7 0 6 3 36 40 14<br />
21 years 0 3 0 8 7 53 52 21<br />
22 to 24 years 0 16 1 27 30 217 126 56<br />
25 to 29 years 0 25 11 40 29 441 225 87<br />
30 to 34 years 0 28 5 39 41 405 246 70<br />
35 to 39 years 0 25 6 52 41 358 264 82<br />
40 to 44 years 0 27 9 47 46 322 239 81<br />
45 to 49 years 0 14 5 30 36 277 202 68<br />
50 to 54 years 0 7 3 21 34 274 173 52<br />
55 to 59 years 0 12 5 19 23 174 103 31<br />
60 and 61 years 0 6 0 5 5 57 42 9<br />
62 to 64 years 0 8 3 8 8 65 43 27<br />
65 to 69 years 1 10 3 8 15 121 75 28<br />
70 to 74 years 0 9 4 22 18 91 80 33<br />
75 to 79 years 0 4 4 10 12 66 78 29<br />
80 to 84 years 0 0 2 9 8 37 67 24<br />
85 years and over 0 0 1 19 9 51 46 42<br />
Female<br />
Under 5 years 0 23 8 44 38 311 226 62<br />
5 to 9 years 0 23 2 45 44 285 223 62<br />
10 to 14 years 0 28 3 37 50 279 223 67<br />
15 to 17 years 0 11 1 18 31 158 147 48<br />
18 and 19 years 0 6 2 8 8 94 98 24<br />
20 years 0 6 0 4 11 48 48 16<br />
21 years 0 5 4 7 6 50 41 28<br />
22 to 24 years 0 14 3 32 17 245 120 65<br />
25 to 29 years 0 19 6 44 33 471 222 87<br />
30 to 34 years 0 19 5 43 37 360 245 78<br />
35 to 39 years 0 35 11 43 46 344 260 71<br />
40 to 44 years 0 23 4 32 42 352 244 97<br />
45 to 49 years 0 16 6 23 38 322 201 68<br />
50 to 54 years 0 11 4 29 33 232 166 62<br />
55 to 59 years 0 15 4 18 18 200 117 45<br />
60 and 61 years 0 7 1 5 6 67 33 24<br />
62 to 64 years 0 2 3 11 10 82 71 24<br />
65 to 69 years 1 9 6 21 22 120 109 36<br />
70 to 74 years 0 7 4 21 29 140 109 36<br />
75 to 79 years 0 4 4 27 38 125 147 59<br />
80 to 84 years 0 1 1 18 27 96 116 71<br />
85 years and over 0 5 1 36 41 154 126 154<br />
source: U.S. Census, 2000 *Portion <strong>of</strong> Spring Valley located in St. Croix County only<br />
River Falls (C)
Table 1.8<br />
Population by Age and Sex by Municipality – 1990 St. Croix County<br />
Baldwin (T)<br />
Cady (T)<br />
Cylon (T)<br />
Eau Galle (T)<br />
Emerald (T)<br />
Erin Prairie (T)<br />
Total 911 643 639 756 630 647 614 700 819 3692 1139 384 1400 419<br />
Median Age 30.8 33.6 31.6 35.0 30.7 30.7 31.1 30.6 33.0 30.8 35.8 30.3 29.7 34.2<br />
Male 464 330 333 400 345 326 328 367 424 1883 548 208 726 213<br />
Fore<strong>st</strong> (T)<br />
Female 447 313 306 356 285 321 286 333 395 1809 591 176 674 206<br />
Male<br />
Under 5 years 36 18 26 21 27 32 30 27 25 144 35 20 62 12<br />
5 to 9 years 52 27 29 33 30 33 34 41 41 214 45 19 64 23<br />
10 to 14 years 51 32 38 42 48 31 27 38 41 173 42 22 67 16<br />
15 to 17 years 24 22 22 17 25 19 16 14 25 105 27 8 39 10<br />
18 and 19 years 8 10 6 11 7 5 8 11 14 66 18 7 23 6<br />
20 years 1 5 4 2 3 6 3 4 6 18 4 0 9 3<br />
21 years 4 6 5 2 0 3 7 6 7 19 2 1 9 3<br />
22 to 24 years 9 6 6 5 13 10 14 10 10 45 15 8 39 3<br />
25 to 29 years 29 22 20 34 26 21 18 24 29 120 37 17 52 13<br />
30 to 34 years 50 22 30 32 27 28 28 43 30 155 43 17 62 19<br />
35 to 39 years 37 29 28 28 35 28 29 36 40 211 48 23 70 20<br />
40 to 44 years 41 26 21 31 20 24 21 18 30 195 64 13 58 17<br />
45 to 49 years 27 25 18 23 19 32 16 17 24 156 46 11 41 14<br />
50 to 54 years 22 14 19 29 19 10 16 15 24 119 20 7 29 11<br />
55 to 59 years 18 13 17 28 14 13 13 19 23 84 20 8 40 10<br />
60 and 61 years 6 4 6 10 2 2 2 6 10 9 12 3 13 4<br />
62 to 64 years 12 12 6 12 7 3 9 11 8 12 12 9 10 6<br />
65 to 69 years 20 15 7 17 9 8 14 9 17 17 19 7 15 5<br />
70 to 74 years 10 13 8 8 7 9 13 8 8 9 10 5 8 9<br />
75 to 79 years 4 7 9 10 7 2 4 7 4 8 13 0 9 3<br />
80 to 84 years 2 1 5 3 0 5 4 2 6 2 6 2 3 3<br />
85 years and over 1 1 3 2 0 2 2 1 2 2 10 1 4 3<br />
Female<br />
Under 5 years 37 28 25 27 18 29 19 30 32 183 42 18 51 10<br />
5 to 9 years 47 27 36 28 33 32 32 34 43 176 46 21 62 19<br />
10 to 14 years 48 27 23 30 22 36 36 27 32 168 55 14 73 24<br />
15 to 17 years 29 11 15 16 18 23 18 22 18 97 24 6 29 12<br />
18 and 19 years 11 3 5 8 4 10 9 11 13 46 13 1 23 4<br />
20 years 9 3 7 3 1 0 1 1 2 21 5 2 10 2<br />
21 years 2 3 3 6 1 2 4 2 3 17 4 0 7 2<br />
22 to 24 years 13 11 7 9 12 7 5 10 7 47 18 9 38 2<br />
25 to 29 years 30 21 24 25 18 15 14 30 26 130 29 17 50 15<br />
30 to 34 years 52 33 28 27 35 37 29 27 30 207 48 21 76 17<br />
35 to 39 years 39 22 25 25 27 30 20 26 38 205 59 18 55 18<br />
40 to 44 years 30 21 17 26 21 26 20 16 29 165 51 11 54 12<br />
45 to 49 years 20 26 18 28 25 18 15 18 32 144 34 8 37 12<br />
50 to 54 years 14 12 22 21 9 14 16 14 18 87 24 7 27 12<br />
55 to 59 years 20 14 14 26 5 9 8 20 20 49 23 7 28 12<br />
60 and 61 years 7 7 3 2 7 3 3 5 6 7 4 5 12 4<br />
62 to 64 years 6 7 6 11 7 4 7 6 9 12 13 3 12 9<br />
65 to 69 years 18 14 7 12 10 8 13 18 13 15 20 4 15 5<br />
70 to 74 years 7 11 6 13 5 10 4 6 13 11 11 3 8 5<br />
75 to 79 years 4 4 7 5 6 4 7 8 6 12 11 0 3 5<br />
80 to 84 years 3 8 7 6 0 4 4 0 3 5 16 0 3 2<br />
85 years and over 1 0 1 2 1 0 2 2 2 5 41 1 1 3<br />
Table 1.8 continued on next page<br />
St. Croix County Conditions and Trends Report 21<br />
Glenwood (T)<br />
Hammond (T)<br />
Hudson (T)<br />
Kinnickinnic (T)<br />
Pleasant Valley<br />
(T)<br />
Richmond (T)<br />
Rush River (T)
Table 1.8 continued<br />
Population by Age and Sex by Municipality – 1990 St. Croix County<br />
St. Joseph (T)<br />
Somerset (T)<br />
Springfield (T)<br />
Stanton (T)<br />
Star Prairie (T)<br />
Troy (T)<br />
22 Issues and Opportunities Information<br />
Warren (T)<br />
Baldwin (V)<br />
Deer Park (V)<br />
Hammond (V)<br />
North Hudson<br />
(V)<br />
Total 2657 1975 772 1042 2098 2850 1008 2022 237 1097 3101 1043 1065<br />
Median Age 31.6 31.6 32.0 30.3 32.0 31.3 31.0 34.0 34.0 33.1 30.5 27.8 28.0<br />
Male 1372 1029 397 513 1088 1481 522 947 118 541 1561 511 509<br />
Female 1285 946 375 529 1010 1369 486 1075 119 556 1540 532 556<br />
Male<br />
Under 5 years 129 92 30 41 81 131 44 81 6 52 141 39 41<br />
5 to 9 years 119 92 32 39 88 132 53 89 4 40 151 47 40<br />
10 to 14 years 114 90 36 47 111 110 45 57 8 51 149 49 47<br />
15 to 17 years 59 58 14 32 39 80 33 32 8 18 78 21 33<br />
18 and 19 years 30 23 10 18 29 47 16 12 2 17 32 17 9<br />
20 years 16 16 7 9 13 18 3 6 2 7 17 14 13<br />
21 years 12 9 10 10 11 15 9 8 3 7 29 7 3<br />
22 to 24 years 53 39 12 18 41 61 10 51 5 20 63 21 31<br />
25 to 29 years 102 67 34 30 93 113 40 93 11 53 142 63 72<br />
30 to 34 years 143 89 36 44 108 143 44 72 10 38 157 52 51<br />
35 to 39 years 123 115 31 42 92 138 50 80 10 41 145 47 45<br />
40 to 44 years 140 95 27 48 95 130 40 50 7 48 125 43 34<br />
45 to 49 years 104 60 28 30 54 123 45 51 7 21 106 26 19<br />
50 to 54 years 78 51 12 28 46 79 23 37 4 13 68 16 11<br />
55 to 59 years 49 31 24 25 38 50 23 43 5 11 46 11 14<br />
60 and 61 years 17 10 8 5 18 18 6 15 2 9 20 7 4<br />
62 to 64 years 21 18 7 13 24 22 5 18 5 11 21 5 12<br />
65 to 69 years 33 29 14 16 33 37 14 40 3 18 34 13 11<br />
70 to 74 years 13 23 11 10 27 12 8 42 10 24 19 5 8<br />
75 to 79 years 8 13 7 3 24 10 6 26 1 11 7 6 5<br />
80 to 84 years 4 6 3 3 14 7 2 18 2 12 6 2 3<br />
85 years and over 5 3 4 2 9 5 3 26 3 19 5 0 3<br />
Female<br />
Under 5 years 110 68 33 41 81 104 45 84 12 34 128 55 54<br />
5 to 9 years 109 75 34 63 79 118 35 80 14 45 136 65 45<br />
10 to 14 years 122 91 34 56 84 112 49 55 6 34 118 46 44<br />
15 to 17 years 51 50 20 27 55 78 28 51 2 21 61 24 25<br />
18 and 19 years 39 35 7 25 24 29 12 15 2 15 38 8 16<br />
20 years 10 12 3 6 14 16 11 12 0 8 16 6 11<br />
21 years 4 5 2 6 5 22 4 17 2 8 22 8 8<br />
22 to 24 years 48 23 11 18 42 45 8 45 6 26 54 24 34<br />
25 to 29 years 113 81 30 30 72 124 39 100 11 42 144 62 59<br />
30 to 34 years 132 100 31 40 108 120 57 83 8 44 180 40 53<br />
35 to 39 years 129 91 31 48 80 146 34 58 11 46 150 44 45<br />
40 to 44 years 123 94 21 35 78 121 55 57 2 37 136 43 32<br />
45 to 49 years 89 50 22 33 54 113 28 44 9 24 101 29 23<br />
50 to 54 years 74 34 19 27 39 71 23 39 4 14 72 10 18<br />
55 to 59 years 39 38 21 23 44 45 14 42 7 17 44 16 16<br />
60 and 61 years 16 13 6 8 9 15 9 18 0 7 16 5 7<br />
62 to 64 years 19 25 9 14 19 17 9 31 4 14 25 8 12<br />
65 to 69 years 22 24 16 9 19 30 10 50 4 25 27 14 13<br />
70 to 74 years 14 21 12 10 30 20 9 52 5 18 25 8 15<br />
75 to 79 years 11 10 5 3 30 10 4 40 6 25 25 12 14<br />
80 to 84 years 7 2 5 6 13 7 2 50 3 21 14 3 9<br />
85 years and over 4 4 3 1 31 6 1 52 1 31 8 2 3<br />
Table 1.8 continued on next page<br />
Roberts (V)<br />
Somerset (V)*
Table 1.8 continued<br />
Population by Age and Sex by Municipality – 1990 St. Croix County<br />
Spring Valley<br />
(V) *<br />
Star Prairie (V)<br />
Wilson (V)<br />
Woodville (V)<br />
Glenwood City<br />
(C)<br />
St. Croix County Conditions and Trends Report 23<br />
Hudson (C)<br />
New Richmond<br />
(C)<br />
Total 0 507 163 942 1026 6378 5106 1769<br />
Median Age -- 31.5 31.0 33.1 34.7 32.1 31.4 33.7<br />
Male 0 259 88 448 482 3082 2424 808<br />
Female 0 248 75 494 544 3296 2682 961<br />
Male<br />
Under 5 years 0 29 9 42 42 276 219 75<br />
5 to 9 years 0 22 11 41 39 289 224 78<br />
10 to 14 years 0 18 5 45 45 200 201 62<br />
15 to 17 years 0 11 6 18 24 112 99 26<br />
18 and 19 years 0 5 2 10 16 59 64 13<br />
20 years 0 2 1 3 7 35 19 12<br />
21 years 0 7 2 4 3 41 27 11<br />
22 to 24 years 0 9 1 12 18 141 110 37<br />
25 to 29 years 0 20 10 43 37 334 237 83<br />
30 to 34 years 0 27 8 46 39 312 225 73<br />
35 to 39 years 0 22 5 29 31 261 199 62<br />
40 to 44 years 0 13 7 21 28 267 166 56<br />
45 to 49 years 0 16 1 15 18 166 112 31<br />
50 to 54 years 0 15 3 13 15 116 97 40<br />
55 to 59 years 0 9 2 9 18 133 78 22<br />
60 and 61 years 0 5 3 4 6 41 34 14<br />
62 to 64 years 0 3 2 18 16 59 55 11<br />
65 to 69 years 0 9 5 14 17 85 83 17<br />
70 to 74 years 0 6 3 15 22 45 61 22<br />
75 to 79 years 0 5 1 16 14 47 60 28<br />
80 to 84 years 0 4 0 11 15 30 32 15<br />
85 years and over 0 2 1 19 12 33 22 20<br />
Female<br />
Under 5 years 0 22 5 37 41 261 196 65<br />
5 to 9 years 0 22 3 35 39 230 235 77<br />
10 to 14 years 0 12 7 34 38 224 193 64<br />
15 to 17 years 0 6 2 15 22 106 103 32<br />
18 and 19 years 0 6 1 9 11 73 58 20<br />
20 years 0 11 0 7 6 38 36 8<br />
21 years 0 2 1 4 6 41 35 12<br />
22 to 24 years 0 12 3 21 16 164 128 24<br />
25 to 29 years 0 23 10 41 39 304 237 70<br />
30 to 34 years 0 21 4 34 29 316 241 82<br />
35 to 39 years 0 14 3 39 31 276 188 65<br />
40 to 44 years 0 15 4 25 31 232 152 54<br />
45 to 49 years 0 18 5 19 16 168 101 33<br />
50 to 54 years 0 12 3 15 17 140 98 36<br />
55 to 59 years 0 12 6 18 19 114 94 24<br />
60 and 61 years 0 0 4 13 14 41 53 8<br />
62 to 64 years 0 6 1 10 15 78 52 17<br />
65 to 69 years 0 15 6 18 36 109 124 36<br />
70 to 74 years 0 5 4 15 27 91 96 37<br />
75 to 79 years 0 7 1 27 40 95 93 58<br />
80 to 84 years 0 4 2 32 21 88 82 69<br />
85 years and over 0 3 0 26 30 107 87 70<br />
source: U.S. Census, 1990 *Portion <strong>of</strong> Spring Valley located in St. Croix County only<br />
River Falls (C)
Table 1.9<br />
Percent Change in Age by Municipality – 1990 to 2000 – St. Croix County<br />
Baldwin (T)<br />
Cady (T)<br />
Cylon (T)<br />
Eau Galle (T)<br />
Emerald (T)<br />
Erin Prairie (T)<br />
Under 5 years -47.9 -2.2 -13.7 -10.4 11.1 -36.1 -22.4 -29.8 -14.0 44.0 16.9 -10.5 -7.1 27.3<br />
5 to 9 years -41.4 7.4 -40.0 24.6 -12.7 -12.3 -25.8 -21.3 -17.9 47.4 20.9 -17.5 -6.3 -16.7<br />
10 to 14 years -21.2 -8.5 -19.7 11.1 -15.7 -16.4 -34.9 32.3 41.1 88.3 42.3 22.2 11.4 10.0<br />
15 to 17 years 32.1 18.2 -2.7 69.7 -11.6 -11.9 20.6 63.9 58.1 84.7 39.2 71.4 42.6 45.5<br />
18 and 19 years 68.4 53.8 0.0 0.0 72.7 40.0 -17.6 9.1 22.2 42.0 32.3 37.5 -10.9 70.0<br />
20 years -30.0 12.5 -63.6 80.0 175.0 50.0 25.0 20.0 -62.5 20.5 66.7 150.0 -26.3 0.0<br />
21 years 50.0 -33.3 0.0 -62.5 500.0 60.0 -45.5 -50.0 10.0 16.7 100.0 600.0 31.3 -60.0<br />
22 to 24 years 18.2 23.5 76.9 21.4 -48.0 -17.6 -10.5 -65.0 0.0 32.6 0.0 -41.2 -46.8 100.0<br />
25 to 29 years -44.1 -9.3 -22.7 -42.4 -9.1 5.6 -9.4 -24.1 -36.4 6.8 -39.4 -29.4 -23.5 -60.7<br />
30 to 34 years -61.8 -32.7 -24.1 5.1 -19.4 -52.3 -29.8 -24.3 -20.0 41.7 -4.4 -23.7 -23.9 -5.6<br />
35 to 39 years 1.3 31.4 0.0 58.5 -8.1 13.8 -16.3 -1.6 25.6 60.8 31.8 -22.0 19.2 31.6<br />
40 to 44 years 57.7 29.8 28.9 35.1 68.3 48.0 43.9 141.2 20.3 89.2 13.9 79.2 36.6 106.9<br />
45 to 49 years 106.4 19.6 47.2 39.2 61.4 -12.0 19.4 88.6 85.7 89.7 81.3 157.9 75.6 38.5<br />
50 to 54 years 77.8 65.4 24.4 16.0 32.1 100.0 37.5 3.4 35.7 123.3 202.3 50.0 101.8 17.4<br />
55 to 59 years 13.2 88.9 19.4 11.1 94.7 95.5 42.9 -25.6 16.3 122.6 69.8 0.0 -16.2 31.8<br />
60 and 61 years 38.5 -27.3 55.6 41.7 11.1 120.0 180.0 0.0 12.5 406.3 -6.3 -37.5 -12.0 25.0<br />
62 to 64 years -5.6 -47.4 75.0 -8.7 28.6 57.1 12.5 -11.8 -17.6 191.7 -12.0 -41.7 22.7 -53.3<br />
65 to 69 years -21.1 -10.3 64.3 44.8 -31.6 -6.3 -22.2 7.4 26.7 175.0 -12.8 36.4 86.7 140.0<br />
70 to 74 years 52.9 4.2 7.1 4.8 25.0 -31.6 0.0 57.1 9.5 90.0 47.6 25.0 68.8 42.9<br />
75 to 79 years 125.0 27.3 -25.0 0.0 7.7 66.7 63.6 -6.7 80.0 0.0 -8.3 7000.0 116.7 -25.0<br />
80 to 84 years 0.0 11.1 -41.7 44.4 5000.0 -11.1 12.5 400.0 44.4 142.9 -50.0 100.0 -33.3 60.0<br />
85 years and over 200.0 500.0 -50.0 -25.0 300.0 150.0 -50.0 133.3 75.0 85.7 -90.2 -50.0 80.0 -50.0<br />
Table 1.9 continued on next page<br />
24 Issues and Opportunities Information<br />
Fore<strong>st</strong> (T)<br />
Glenwood (T)<br />
Hammond (T)<br />
Hudson (T)<br />
Kinnickinnic (T)<br />
Pleasant Valley<br />
(T)<br />
Richmond (T)<br />
Rush River (T)
Table 1.9 continued<br />
Percent Change in Age by Municipality – 1990 to 2000 – St. Croix County<br />
St. Joseph (T)<br />
Somerset (T)<br />
Springfield (T)<br />
Stanton (T)<br />
Star Prairie (T)<br />
Troy (T)<br />
St. Croix County Conditions and Trends Report 25<br />
Warren (T)<br />
Baldwin (V)<br />
Deer Park (V)<br />
Hammond (V)<br />
North Hudson<br />
(V)<br />
Under 5 years 0.4 14.4 -44.4 -19.5 21.0 17.9 122.5 -90.3 311.1 208.1 -77.0 54.3 108.4<br />
5 to 9 years 33.8 22.8 -13.6 -34.3 54.5 28.8 88.6 -92.9 372.2 207.1 -77.7 30.4 95.3<br />
10 to 14 years 35.6 37.0 12.9 -25.2 40.0 38.7 73.4 -86.6 500.0 204.7 -79.8 14.7 79.1<br />
15 to 17 years 27.3 22.2 44.1 23.7 47.9 23.4 90.2 -83.1 530.0 289.7 -56.1 53.3 100.0<br />
18 and 19 years 2.9 -1.7 17.6 -20.9 52.8 21.1 139.3 -81.5 725.0 137.5 -55.7 112.0 168.0<br />
20 years -19.2 -21.4 20.0 -33.3 74.1 5.9 142.9 -83.3 700.0 146.7 -45.5 -15.0 41.7<br />
21 years 50.0 35.7 -25.0 -25.0 156.3 -21.6 176.9 -96.0 220.0 146.7 -76.5 40.0 227.3<br />
22 to 24 years -46.5 6.5 13.0 -11.1 20.5 -27.4 627.8 -95.8 309.1 163.0 -56.4 160.0 101.5<br />
25 to 29 years -34.4 -12.8 -53.1 -18.3 47.3 -35.4 146.8 -87.0 295.5 176.8 -68.9 45.6 48.9<br />
30 to 34 years -13.8 10.6 -31.3 -22.6 11.1 -5.3 110.9 -89.0 411.1 245.1 -75.1 30.4 104.8<br />
35 to 39 years 48.0 32.5 27.4 -3.3 46.5 33.1 132.1 -87.0 328.6 257.5 -72.5 74.7 116.7<br />
40 to 44 years 54.8 41.3 68.8 14.5 64.2 56.6 80.0 -86.9 1022.2 297.6 -66.3 29.1 159.1<br />
45 to 49 years 49.2 108.2 46.0 38.1 101.9 36.9 127.4 -80.0 387.5 508.9 -71.0 50.9 295.2<br />
50 to 54 years 93.4 124.7 71.0 21.8 123.5 91.3 167.4 -90.8 887.5 859.3 -50.7 123.1 324.1<br />
55 to 59 years 105.7 108.7 4.4 10.4 53.7 129.5 191.9 -87.1 183.3 557.1 -40.0 3.7 260.0<br />
60 and 61 years 75.8 60.9 -42.9 69.2 11.1 81.8 100.0 -97.0 450.0 250.0 -69.4 41.7 172.7<br />
62 to 64 years 80.0 9.3 18.8 -22.2 25.6 89.7 271.4 -83.7 0.0 180.0 -65.2 7.7 116.7<br />
65 to 69 years 54.5 22.6 -3.3 48.0 25.0 17.9 312.5 -86.7 228.6 67.4 -67.2 -3.7 312.5<br />
70 to 74 years 148.1 31.8 30.4 30.0 3.5 71.9 547.1 -88.3 133.3 52.4 -65.9 123.1 378.3<br />
75 to 79 years 73.7 34.8 41.7 116.7 -46.3 60.0 950.0 -90.9 357.1 -5.6 -59.4 16.7 452.6<br />
80 to 84 years 18.2 225.0 -12.5 -22.2 -55.6 21.4 2350.0 -91.2 380.0 -21.2 -50.0 240.0 716.7<br />
85 years and over 33.3 -14.3 -71.4 0.0 -82.5 -36.4 2175.0 -97.4 950.0 -58.0 -53.8 600.0 1416.7<br />
Table 1.9 continued on next page<br />
Roberts (V)<br />
Somerset (V)*
Table 1.9 continued<br />
Percent Change in Age by Municipality – 1990 to 2000 – St. Croix County<br />
Spring Valley<br />
(V *)<br />
Star Prairie (V)<br />
Wilson (V)<br />
Woodville (V)<br />
Glenwood City<br />
(C)<br />
26 Issues and Opportunities Information<br />
Hudson (C)<br />
New Richmond<br />
(C)<br />
Under 5 years -- -5.9 21.4 13.9 -10.8 23.3 8.7 -10.0<br />
5 to 9 years<br />
--<br />
9.1 -50.0 21.1 17.9 15.8 8.9 -14.2<br />
10 to 14 years<br />
--<br />
53.3 8.3 -7.6 30.1 32.5 9.1 13.5<br />
15 to 17 years<br />
--<br />
11.8 -12.5 18.2 39.1 47.7 38.1 46.6<br />
18 and 19 years<br />
--<br />
27.3 0.0 36.8 -3.7 32.6 42.6 69.7<br />
20 years<br />
--<br />
0.0 -100.0 0.0 7.7 15.1 60.0 50.0<br />
21 years<br />
--<br />
-11.1 33.3 87.5 44.4 25.6 50.0 113.0<br />
22 to 24 years<br />
--<br />
42.9 0.0 78.8 38.2 51.5 3.4 98.4<br />
25 to 29 years<br />
--<br />
2.3 -15.0 0.0 -18.4 42.9 -5.7 13.7<br />
30 to 34 years<br />
--<br />
-2.1 -16.7 2.5 14.7 21.8 5.4 -4.5<br />
35 to 39 years<br />
--<br />
66.7 112.5 39.7 40.3 30.7 35.4 20.5<br />
40 to 44 years<br />
--<br />
78.6 18.2 71.7 49.2 35.1 51.9 61.8<br />
45 to 49 years<br />
--<br />
-11.8 83.3 55.9 117.6 79.3 89.2 112.5<br />
50 to 54 years<br />
--<br />
-33.3 16.7 78.6 109.4 97.7 73.8 50.0<br />
55 to 59 years<br />
--<br />
28.6 12.5 37.0 10.8 51.4 27.9 65.2<br />
60 and 61 years<br />
--<br />
160.0 -85.7 -41.2 -45.0 51.2 -13.8 50.0<br />
62 to 64 years<br />
--<br />
11.1 100.0 -32.1 -41.9 7.3 6.5 82.1<br />
65 to 69 years<br />
--<br />
-20.8 -18.2 -9.4 -30.2 24.2 -11.1 20.8<br />
70 to 74 years<br />
--<br />
45.5 14.3 43.3 -4.1 69.9 20.4 16.9<br />
75 to 79 years<br />
--<br />
-33.3 300.0 -14.0 -7.4 34.5 47.1 2.3<br />
80 to 84 years<br />
--<br />
-87.5 50.0 -37.2 -2.8 12.7 60.5 13.1<br />
85 years and over<br />
--<br />
0.0 100.0 22.2 19.0 46.4 57.8 117.8<br />
source: U.S. Census Bureau *Portion <strong>of</strong> Spring Valley located in St. Croix County only<br />
River Falls (C)
Table 1.10<br />
Population Projections – 2000 to 2030 – St. Croix County by Minor Civil Division<br />
Census E<strong>st</strong>imate Proj. Proj. Proj. Proj. Proj. % Change<br />
Municipality 2000 2005 2010 2015 2020 2025 2030 2000-2030<br />
Towns<br />
Baldwin 903 958 999 1,058 1,116 1,164 1,202 33.1%<br />
Cady 710 785 846 921 997 1,064 1,124 58.3%<br />
Cylon 629 671 696 735 772 803 826 31.3%<br />
Eau Galle 882 995 1,100 1,209 1,318 1,419 1,507 70.9%<br />
Emerald 691 781 851 939 1,027 1,109 1,182 71.1%<br />
Erin Prairie 658 672 691 723 754 777 793 20.5%<br />
Fore<strong>st</strong> 590 627 651 687 722 750 773 31.0%<br />
Glenwood 755 856 931 1,026 1,121 1,210 1,287 70.5%<br />
Hammond 947 1,523 1,871 2,265 2,675 3,074 3,453 264.6%<br />
Hudson 6,213 7,533 8,941 10,533 12,178 13,767 15,259 145.6%<br />
Kinnickinnic 1,400 1,629 1,829 2,068 2,312 2,542 2,752 96.6%<br />
Pleasant Valley 430 480 523 579 634 684 730 69.8%<br />
Richmond 1,556 2,441 2,974 3,580 4,210 4,822 5,401 247.1%<br />
Rush River 498 526 560 604 649 688 721 44.8%<br />
St. Joseph 3,436 3,716 4,095 4,561 5,035 5,477 5,873 70.9%<br />
Somerset 2,644 3,252 3,750 4,334 4,936 5,513 6,048 128.7%<br />
Springfield 808 916 991 1,085 1,181 1,268 1,344 66.3%<br />
Stanton 1,003 1,014 1,033 1,062 1,087 1,101 1,105 10.2%<br />
Star Prairie 2,944 3,495 3,973 4,539 5,121 5,675 6,185 110.1%<br />
Troy 3,661 4,385 5,011 5,748 6,503 7,224 7,889 115.5%<br />
Warren 1,320 1,540 1,747 1,990 2,238 2,474 2,691 103.9%<br />
Subtotal: 32,678 38,795 44,063 50,246 56,586 62,605 68,145 108.5%<br />
Villages<br />
Baldwin 2,667 3,441 4,044 4,746 5,470 6,170 6,824 155.9%<br />
Deer Park 227 224 225 229 232 234 232 2.2%<br />
Hammond 1,153 1,649 1,951 2,300 2,661 3,009 3,337 189.4%<br />
North Hudson 3,463 3,693 3,988 4,374 4,763 5,120 5,432 56.9%<br />
Roberts 969 1,362 1,585 1,849 2,123 2,386 2,631 171.5%<br />
Somerset 1,556 2,204 2,681 3,225 3,790 4,339 4,860 212.3%<br />
Spring Valley* 574 634 693 768 842 912 974 69.7%<br />
Star Prairie 2 3 3 3 2 3 3 50.0%<br />
Wilson 176 194 209 229 249 267 282 60.2%<br />
Woodville 1,104 1,292 1,436 1,630 1,830 2,018 2,191 98.5%<br />
Subtotal: 11,891 14,696 16,815 19,353 21,962 24,458 26,766 125.1%<br />
Cities<br />
Glenwood City 1,183 1,227 1,303 1,405 1,506 1,597 1,672 41.3%<br />
Hudson 8,775 11,432 13,473 15,865 18,337 20,725 22,967 161.7%<br />
New Richmond 6,310 7,566 8,638 9,917 11,230 12,485 13,643 116.2%<br />
River Falls* 2,318 2,549 2,831 3,179 3,533 3,866 4,167 79.8%<br />
Subtotal: 18,586 22,774 26,245 30,366 34,606 38,673 42,449 128.4%<br />
St. Croix County 63,155 76,265 87,123 99,965 113,154 125,736 137,360 117.5%<br />
source: U.S. Census Bureau & Wisconsin Department <strong>of</strong> Admini<strong>st</strong>ration, Demographic Services Center, January 2008.<br />
*Portion located in St. Croix County only.<br />
St. Croix County Conditions and Trends Report 27
Table 1.11<br />
Household Projections - 2000 to 2030 – St. Croix County by Minor Civil Division<br />
Census E<strong>st</strong>imate Proj. Proj. Proj. Proj. Proj. % Change<br />
Municipality 2000 2005 2010 2015 2020 2025 2030 2000-2030<br />
Towns<br />
Baldwin 307 327 345 368 392 411 430 40.1<br />
Cady 255 283 308 338 370 397 425 66.7<br />
Cylon 227 243 255 271 287 301 314 38.3<br />
Eau Galle 307 347 389 431 473 513 553 80.1<br />
Emerald 236 267 295 328 362 394 425 80.1<br />
Erin Prairie 227 233 242 255 268 278 288 26.9<br />
Fore<strong>st</strong> 203 217 227 242 256 268 280 37.9<br />
Glenwood 254 289 318 353 389 422 456 79.5<br />
Hammond 314 507 630 769 915 1,059 1,206 284.1<br />
Hudson 1,925 2,349 2,822 3,349 3,903 4,443 4,994 159.4<br />
Kinnickinnic 483 564 641 730 822 911 1,000 107.0<br />
Pleasant Valley 145 163 180 199 220 239 259 78.6<br />
Richmond 524 827 1,019 1,236 1,466 1,691 1,920 266.4<br />
Rush River 171 182 196 212 230 245 261 52.6<br />
St. Joseph 1,193 1,295 1,445 1,621 1,804 1,977 2,149 80.1<br />
Somerset 927 1,145 1,336 1,554 1,785 2,007 2,233 140.9<br />
Springfield 285 324 355 392 430 464 499 75.1<br />
Stanton 352 357 368 381 394 401 408 15.9<br />
Star Prairie 1,006 1,205 1,387 1,596 1,815 2,025 2,239 122.6<br />
Troy 1,250 1,503 1,738 2,008 2,290 2,561 2,837 127.0<br />
Warren 426 499 573 657 744 829 914 114.6<br />
Subtotal: 11,017 13,126 15,069 17,290 19,615 21,836 24,090 118.7<br />
Villages<br />
Baldwin 1,115 1,454 1,729 2,045 2,375 2,698 3,026 171.4<br />
Deer Park 91 90 92 94 96 98 98 7.7<br />
Hammond 433 627 750 891 1,039 1,184 1,332 207.6<br />
North Hudson 1,315 1,407 1,538 1,699 1,866 2,019 2,172 65.2<br />
Roberts 392 553 651 766 886 1,002 1,120 185.7<br />
Somerset 635 903 1,111 1,347 1,596 1,839 2,089 229.0<br />
Spring Valley* 212 235 260 290 321 350 378 78.3<br />
Star Prairie 1 2 2 2 2 2 2 100.0<br />
Wilson 66 73 80 88 97 104 112 69.7<br />
Woodville 446 525 590 675 763 848 933 109.2<br />
Subtotal: 4,706 5,869 6,803 7,897 9,041 10,144 11,262 139.3<br />
Cities<br />
Glenwood City 460 479 515 559 604 646 685 48.9<br />
Hudson 3,687 4,826 5,758 6,830 7,952 9,053 10,175 176.0<br />
New Richmond 2,561 3,105 3,588 4,151 4,737 5,303 5,876 129.44<br />
River Falls* 979 1,101 1,237 1,399 1,568 1,727 1,887 92.7<br />
Subtotal: 7,687 9,511 11,098 12,939 14,861 16,729 18,623 142.3<br />
St. Croix County 23,410 28,506 32,970 38,126 43,517 48,709 53,975 130.6<br />
source: U.S. Census Bureau & Wisconsin Department <strong>of</strong> Admini<strong>st</strong>ration, Demographic Services Center, January 2008.<br />
*Portion located in St. Croix County only.<br />
28 Issues and Opportunities Information
Table 1.12A<br />
We<strong>st</strong> Central Wisconsin Region Occupation Projections – 2014<br />
Fa<strong>st</strong>e<strong>st</strong> Growth<br />
Mo<strong>st</strong> Openings<br />
Top 10 Occupations<br />
Typically Required<br />
Education/Training Average Wage<br />
Home Health Aides 1-month on-the-job training $9.29<br />
Medical Assi<strong>st</strong>ants 1-12 mo. on-the-job training $12.63<br />
Network and Data Analy<strong>st</strong>s Bachelor’s degree $22.19<br />
Computer S<strong>of</strong>tware Engrs, Applications Bachelor’s degree $37.08<br />
Personal and Home Care Aides 1-month on-the-job training $8.82<br />
Dental Assi<strong>st</strong>ants 1-12 mo. on-the-job training $12.50<br />
Dental Hygieni<strong>st</strong>s Associate degree $23.34<br />
Employment, Recruitment & Placement Bachelor’s degree $19.67<br />
Medical Records & Health Information Associate degree $12.71<br />
Occupational Therapi<strong>st</strong>s Ma<strong>st</strong>er’s degree $25.53<br />
Cashiers 1-month on-the-job training $7.64<br />
Retail Salespersons 1-month on-the-job training $11.06<br />
Comb Food Prep/Serv Wrk/Incl Fa<strong>st</strong> 1-month on-the-job training $7.04<br />
Waiters/Waitresses 1-month on-the-job training $7.34<br />
Regi<strong>st</strong>ered Nurses Associate’s or Bachelor’s degree $25.83<br />
Labrs/Frght/Stock/Matrl Movers/Handlers 1-month on-the-job training $10.09<br />
Janitors/Cleaners, except Maids/Housekpg 1-month on-the-job training $10.67<br />
Team Assemblers 1-12 mo. on-the-job training $12.94<br />
Stock Clerks/Order Fillers 1-month on-the-job training $9.47<br />
Bartenders 1-month on-the-job training $8.16<br />
We<strong>st</strong> Central WDA includes Barron, Chippewa Clark, Dunn, Eau Claire, Pepin, Pierce, Polk and St. Croix Counties.<br />
source: Wisconsin Dept. <strong>of</strong> Workforce Development, Bureau <strong>of</strong> Workforce Information, 2006<br />
Table 1.12B<br />
We<strong>st</strong> Central Wisconsin Region Indu<strong>st</strong>ry Projections – 2004-2014<br />
Indu<strong>st</strong>ry Title<br />
2004<br />
E<strong>st</strong>imated<br />
Employment<br />
2014<br />
Projected<br />
Employment<br />
2004-2014<br />
Employment<br />
Change<br />
2004-2014<br />
Percentage<br />
Change<br />
Total Non-Farm Employment 173,880 194,330 20,450 11.8%<br />
Con<strong>st</strong>ruction/Mining/Natural Resources 8,380 9,880 1,500 17.9%<br />
Manufacturing 31,990 32,030 40 0.1%<br />
Paper Manufacturing 1,720 1,720 0 0.0%<br />
Pla<strong>st</strong>ics and Rubber Products 3,400 3,670 270 7.9%<br />
Computer and Electronic Product 3,220 3,020 -200 -6.2%<br />
Trade 28,800 30,900 2,100 7.3%<br />
Food and Beverage Stores 5,040 5,250 210 4.2%<br />
Transportation and Utilities (Including US<br />
Po<strong>st</strong>al)<br />
8,270 9,520 1,250 15.1%<br />
Financial Activities 7,010 7,710 700 10.0%<br />
Education and Health Services (Including<br />
State and Local Gov Educ and Hosp)<br />
37,330 45,540 8,210 22.0%<br />
Ambulatory Health Care Services 5,540 7,570 2,030 36.6%<br />
Hospitals (Including State and Local<br />
Government)<br />
7,050 8,640 1,590 22.6%<br />
Leisure and Hospitality 17,300 19,930 2,630 15.2%<br />
Information/Pr<strong>of</strong> Services/Other Services 21,470 24,920 3,450 16.1%<br />
Government (Excluding US Po<strong>st</strong>al, State<br />
and Local Educ and Hosp)<br />
13,310 13,930 620 4.7%<br />
We<strong>st</strong> Central WDA includes Barron, Chippewa Clark, Dunn, Eau Claire, Pepin, Pierce, Polk and St. Croix Counties.<br />
source: Wisconsin Dept. <strong>of</strong> Workforce Development, Bureau <strong>of</strong> Workforce Information, 2006<br />
St. Croix County Conditions and Trends Report 29
Table 1.12C<br />
St. Croix County Race Characteri<strong>st</strong>ics - 2000<br />
Municipality<br />
Total<br />
Population<br />
White<br />
Towns<br />
Baldwin 881 846 96 0 3 3 0 0 29 4.0<br />
Cady 713 701 98 0 3 0 0 0 9 1.7<br />
Cylon 599 595 99 0 0 0 0 2 2 0.7<br />
Eau Galle 906 900 99 0 0 0 2 2 2 0.7<br />
Emerald 701 684 98 12 0 4 0 0 1 2.4<br />
Erin Prairie 667 667 100 0 0 0 0 0 0 0.0<br />
Fore<strong>st</strong> 589 585 99 0 0 2 0 2 0 0.7<br />
Glenwood 761 736 97 0 3 4 0 13 5 3.3<br />
Hammond 973 953 98 0 8 0 0 0 12 2.1<br />
Hudson 6,433 6,286 98 46 10 27 2 7 55 2.3<br />
Kinnickinnic 1,417 1,391 98 0 0 7 0 0 19 1.8<br />
Pleasant Valley 409 398 97 0 8 3 0 0 0 2.7<br />
Richmond 1,585 1,573 99 0 0 0 0 8 4 0.8<br />
Rush River 506 496 98 0 3 0 0 0 7 2.0<br />
St. Joseph/Houlton 3,416 3,392 99 13 3 0 0 0 8 0.7<br />
Somerset 2,732 2,653 97 5 16 20 0 0 38 2.9<br />
Springfield 790 781 99 0 0 6 0 0 3 1.1<br />
Stanton 1,054 1,012 96 0 7 31 0 0 4 4.0<br />
Star Prairie 3,019 2,899 96 90 13 0 0 0 17 4.0<br />
Troy 3,668 3,573 97 45 0 14 0 36 0 2.6<br />
Warren 1,323 1,309 99 0 0 6 0 2 6 1.1<br />
Villages<br />
Baldwin 2,665 2,616 98 3 5 10 0 0 31 1.8<br />
Deer Park 263 263 100 0 0 0 0 0 0 0.0<br />
Hammond 1,132 1,126 99 4 2 0 0 0 0 0.5<br />
North Hudson 3,443 3,372 98 6 0 35 0 5 25 2.1<br />
Roberts 976 952 98 0 4 8 0 9 3 2.5<br />
Somerset 1,488 1,426 96 7 3 0 0 11 41 4.2<br />
Star Prairie 519 513 99 4 0 0 0 0 2 1.2<br />
Wilson 188 188 100 0 0 0 0 0 0 0.0<br />
Woodville<br />
Cities<br />
1,113 1,101 99 0 0 0 0 10 2 1.1<br />
Glenwood City 1,181 1,164 99 0 5 0 0 0 12 1.4<br />
Hudson 8,508 8,188 96 79 79 75 0 17 70 3.8<br />
New Richmond 6,192 6,105 99 0 0 8 0 0 79 1.4<br />
River Falls* 2,345 2,306 98 19 15 0 0 0 5 1.7<br />
St. Croix County 63,155 61,750 98 333 190 263 4 124 491 2.2<br />
Source: U.S. Census<br />
*Portion <strong>of</strong> River Falls located in St. Croix County only.<br />
% White<br />
30 Issues and Opportunities Information<br />
Black/African<br />
American<br />
American<br />
Indian & Alaska<br />
Native<br />
Asian<br />
Native Hawaiian<br />
& Other Pacific<br />
Islander<br />
Other Race<br />
Two or More<br />
Races<br />
% Other Race
Table 1.13<br />
Educational Attainment Levels – 1990 and 2000 – St. Croix County Municipal Units<br />
Town <strong>of</strong> Baldwin<br />
Town <strong>of</strong> Cady<br />
Town <strong>of</strong> Cylon<br />
Town <strong>of</strong> Eau Galle<br />
Town <strong>of</strong> Emerald<br />
Educational Level 1990 2000<br />
Number Percent Number Percent<br />
Persons 25 Years and Over 537 100.0 561 100.0<br />
Less than high school diploma 79 14.7 37 6.6<br />
High school graduate 279 52.0 274 48.8<br />
Some college, no degree 86 16.0 138 24.6<br />
Associate degree 46 8.6 31 5.5<br />
Bachelor’s degree or higher 47 8.8 47 8.4<br />
High school graduate or higher 458 85.3 524 93.4<br />
Persons 25 Years and Over 409 100.0 452 100.0<br />
Less than high school diploma 113 27.6 39 8.6<br />
High school graduate 196 47.9 213 47.1<br />
Some college, no degree 55 13.4 91 20.1<br />
Associate degree 16 3.9 37 8.2<br />
Bachelor’s degree or higher 29 7.1 72 15.9<br />
High school graduate or higher 296 72.4 413 91.4<br />
Persons 25 Years and Over 394 100.0 389 100.0<br />
Less than high school diploma 81 21.0 38 9.8<br />
High school graduate 210 53.3 166 42.7<br />
Some college, no degree 47 11.9 77 19.8<br />
Associate degree 33 8.4 41 10.5<br />
Bachelor’s degree or higher 23 5.8 67 17.2<br />
High school graduate or higher 313 79.4 351 90.2<br />
Persons 25 Years and Over 472 100.0 576 100.0<br />
Less than high school diploma 114 24.2 57 9.9<br />
High school graduate 197 41.7 235 40.8<br />
Some college, no degree 82 17.4 145 25.2<br />
Associate degree 18 3.8 35 6.1<br />
Bachelor’s degree or higher 61 12.9 104 18.1<br />
High school graduate or higher 358 75.8 519 90.1<br />
Persons 25 Years and Over 405 100.0 462 100.0<br />
Less than high school diploma 84 20.7 60 13.0<br />
High school graduate 210 51.9 198 42.9<br />
Some college, no degree 65 16.0 114 24.7<br />
Associate degree 15 3.7 32 6.9<br />
Bachelor’s degree or higher 31 7.7 58 12.6<br />
High school graduate or higher 321 79.3 402 87.0<br />
St. Croix County Conditions and Trends Report 31
Table 1.13 continued<br />
Educational Attainment Levels – 1990 and 2000 – St. Croix County Municipal Units<br />
Town <strong>of</strong> Erin Prairie<br />
Town <strong>of</strong> Fore<strong>st</strong><br />
Town <strong>of</strong> Glenwood<br />
Town <strong>of</strong> Hammond<br />
Town <strong>of</strong> Hudson<br />
Educational Level 1990 2000<br />
Number Percent Number Percent<br />
Persons 25 Years and Over 386 100.0 415 100.0<br />
Less than high school diploma 54 14.0 41 9.9<br />
High school graduate 156 40.4 155 37.3<br />
Some college, no degree 81 21.0 94 22.7<br />
Associate degree 34 8.8 32 7.7<br />
Bachelor’s degree or higher 61 15.8 93 22.1<br />
High school graduate or higher 332 86.0 374 90.1<br />
Persons 25 Years and Over 346 100.0 360 100.0<br />
Less than high school diploma 79 22.8 43 11.9<br />
High school graduate 181 52.3 181 50.3<br />
Some college, no degree 36 10.4 79 21.9<br />
Associate degree 30 8.7 25 6.9<br />
Bachelor’s degree or higher 20 5.8 32 8.9<br />
High school graduate or higher 267 77.2 317 88.1<br />
Persons 25 Years and Over 424 100.0 467 100.0<br />
Less than high school diploma 100 23.6 82 17.6<br />
High school graduate 219 51.7 216 46.3<br />
Some college, no degree 55 13.0 79 16.9<br />
Associate degree 20 4.7 40 8.6<br />
Bachelor’s degree or higher 30 7.1 50 10.7<br />
High school graduate or higher 324 76.4 385 82.4<br />
Persons 25 Years and Over 528 100.0 619 100.0<br />
Less than high school diploma 69 13.1 32 5.2<br />
High school graduate 243 46.0 230 37.2<br />
Some college, no degree 90 17.0 161 26.0<br />
Associate degree 37 7.0 42 6.8<br />
Bachelor’s degree or higher 89 16.9 137 22.1<br />
High school graduate or higher 459 86.9 570 92.1<br />
Persons 25 Years and Over 2,153 100.0 3,943 100.0<br />
Less than high school diploma 102 4.7 116 2.9<br />
High school graduate 741 34.4 972 24.7<br />
Some college, no degree 460 21.4 983 24.9<br />
Associate degree 209 9.7 408 10.3<br />
Bachelor’s degree or higher 641 29.8 1,464 37.1<br />
High school graduate or higher 2,051 95.3 3,827 97.1<br />
32 Issues and Opportunities Information
Table 1.13 continued<br />
Educational Attainment Levels – 1990 and 2000 – St. Croix County Municipal Units<br />
Town <strong>of</strong> Kinnickinnic<br />
Town <strong>of</strong> Pleasant Valley<br />
Town <strong>of</strong> Richmond<br />
Town <strong>of</strong> Rush River<br />
Town <strong>of</strong> St.<br />
Joseph/Houlton<br />
Educational Level 1990 2000<br />
Number Percent Number Percent<br />
Persons 25 Years and Over 744 100.0 890 100.0<br />
Less than high school diploma 102 13.7 36 4.0<br />
High school graduate 255 34.3 268 30.1<br />
Some college, no degree 164 22.0 218 24.5<br />
Associate degree 34 4.6 98 11.0<br />
Bachelor’s degree or higher 189 25.4 296 33.3<br />
High school graduate or higher 642 86.3 854 96.0<br />
Persons 25 Years and Over 205 100.0 253 100.0<br />
Less than high school diploma 25 12.2 23 9.1<br />
High school graduate 77 37.6 88 34.8<br />
Some college, no degree 40 19.5 48 19.0<br />
Associate degree 18 8.8 36 14.2<br />
Bachelor’s degree or higher 45 22.0 72 28.5<br />
High school graduate or higher 180 87.8 230 90.9<br />
Persons 25 Years and Over 795 100.0 973 100.0<br />
Less than high school diploma 130 16.4 97 10.0<br />
High school graduate 348 43.8 367 37.7<br />
Some college, no degree 136 17.1 247 25.4<br />
Associate degree 58 7.3 72 7.4<br />
Bachelor’s degree or higher 123 15.5 190 19.5<br />
High school graduate or higher 665 83.6 876 90.9<br />
Persons 25 Years and Over 291 100.0 328 100.0<br />
Less than high school diploma 46 15.8 30 9.1<br />
High school graduate 138 47.4 137 41.8<br />
Some college, no degree 57 19.6 97 29.6<br />
Associate degree 23 7.9 35 10.7<br />
Bachelor’s degree or higher 27 9.3 29 8.8<br />
High school graduate or higher 245 84.2 298 90.0<br />
Persons 25 Years and Over 1,632 100.0 2,268 100.0<br />
Less than high school diploma 54 3.3 83 3.7<br />
High school graduate 574 35.2 669 29.5<br />
Some college, no degree 307 18.8 575 25.4<br />
Associate degree 160 9.8 202 8.9<br />
Bachelor’s degree or higher 407 24.9 739 32.6<br />
High school graduate or higher 1,448 88.7 2,185 96.3<br />
St. Croix County Conditions and Trends Report 33
Table 1.13 continued<br />
Educational Attainment Levels – 1990 and 2000 – St. Croix County Municipal Units<br />
Town <strong>of</strong> Somerset<br />
Town <strong>of</strong> Lake Springfield<br />
Town <strong>of</strong> Stanton<br />
Town <strong>of</strong> Star Prairie<br />
Town <strong>of</strong> Troy<br />
Education Level 1990 2000<br />
Number Percent Number Percent<br />
Persons 25 Years and Over 1,197 100.0 1,761 100.0<br />
Less than high school diploma 199 16.6 141 8.0<br />
High school graduate 515 43.0 575 32.7<br />
Some college, no degree 189 15.8 443 25.2<br />
Associate degree 94 7.9 171 9.7<br />
Bachelor’s degree or higher 200 16.7 431 24.5<br />
High school graduate or higher 998 83.4 1,620 92.0<br />
Persons 25 Years and Over 465 100.0 532 100.0<br />
Less than high school diploma 118 25.4 80 15.0<br />
High school graduate 237 51.0 246 46.2<br />
Some college, no degree 53 11.4 92 17.3<br />
Associate degree 6 1.3 30 5.6<br />
Bachelor’s degree or higher 51 11.0 84 15.8<br />
High school graduate or higher 347 74.6 452 85.0<br />
Persons 25 Years and Over 586 100.0 659 100.0<br />
Less than high school diploma 72 12.3 51 7.7<br />
High school graduate 256 43.7 238 36.1<br />
Some college, no degree 118 20.1 193 29.3<br />
Associate degree 52 8.9 52 7.9<br />
Bachelor’s degree or higher 88 15.0 125 19.0<br />
High school graduate or higher 514 87.7 608 92.3<br />
Persons 25 Years and Over 1,301 100.0 1,867 100.0<br />
Less than high school diploma 280 21.5 229 12.3<br />
High school graduate 553 42.5 761 40.8<br />
Some college, no degree 214 16.4 430 23.0<br />
Associate degree 99 7.6 147 7.9<br />
Bachelor’s degree or higher 155 11.9 300 16.1<br />
High school graduate or higher 1,021 78.5 1,638 87.7<br />
Persons 25 Years and Over 1,793 100.0 2,352 100.0<br />
Less than high school diploma 90 5.0 93 4.0<br />
High school graduate 436 24.3 480 20.4<br />
Some college, no degree 382 21.3 543 23.1<br />
Associate degree 227 12.7 253 10.8<br />
Bachelor’s degree or higher 658 36.7 984 41.8<br />
High school graduate or higher 1,703 95.0 2,259 96.0<br />
34 Issues and Opportunities Information
Table 1.13 continued<br />
Educational Attainment Levels – 1990 and 2000 – St. Croix County Municipal Units<br />
Town <strong>of</strong> Warren<br />
Village <strong>of</strong> Baldwin<br />
Village <strong>of</strong> Deer Park<br />
Village <strong>of</strong> Hammond<br />
Village <strong>of</strong> North Hudson<br />
Educational Level 1990 2000<br />
Number Percent Number Percent<br />
Persons 25 Years and Over 575 100.0 817 100.0<br />
Less than high school diploma 60 10.4 57 7.0<br />
High school graduate 279 48.5 337 41.2<br />
Some college, no degree 94 16.3 149 18.2<br />
Associate degree 42 7.3 69 8.4<br />
Bachelor’s degree or higher 100 17.4 205 25.1<br />
High school graduate or higher 515 89.6 760 93.0<br />
Persons 25 Years and Over 1,327 100.0 1,765 100.0<br />
Less than high school diploma 366 27.6 201 11.4<br />
High school graduate 493 37.2 652 36.9<br />
Some college, no degree 197 14.8 355 20.1<br />
Associate degree 103 7.8 179 10.1<br />
Bachelor’s degree or higher 168 12.7 378 21.4<br />
High school graduate or higher 961 72.4 1,564 88.6<br />
Persons 25 Years and Over 134 100.0 188 100.0<br />
Less than high school diploma 29 21.6 18 9.6<br />
High school graduate 80 59.7 75 39.9<br />
Some college, no degree 22 16.4 64 34.0<br />
Associate degree 3 2.2 19 10.1<br />
Bachelor’s degree or higher 0 0 49 26.1<br />
High school graduate or higher 105 78.4 170 90.4<br />
Persons 25 Years and Over 694 100.0 732 100.0<br />
Less than high school diploma 131 18.9 85 11.6<br />
High school graduate 342 49.3 281 38.4<br />
Some college, no degree 94 13.5 168 23.0<br />
Associate degree 43 6.2 71 9.7<br />
Bachelor’s degree or higher 84 12.1 127 17.3<br />
High school graduate or higher 563 81.1 647 88.4<br />
Persons 25 Years and Over 1,868 100.0 2,206 100.0<br />
Less than high school diploma 171 9.2 110 5.0<br />
High school graduate 654 35.0 529 24.0<br />
Some college, no degree 324 17.3 595 27.0<br />
Associate degree 178 9.5 292 13.2<br />
Bachelor’s degree or higher 541 29.0 785 35.6<br />
High school graduate or higher 1,697 90.8 2,096 95.0<br />
St. Croix County Conditions and Trends Report 35
Table 1.13 continued<br />
Educational Attainment Levels – 1990 and 2000 – St. Croix County Municipal Units<br />
Village <strong>of</strong> Roberts<br />
Village <strong>of</strong> Somerset<br />
Village <strong>of</strong> Spring Valley*<br />
Village <strong>of</strong> Star Prairie<br />
Village <strong>of</strong> Wilson<br />
Educational Level 1990 2000<br />
Number Percent Number Percent<br />
Persons 25 Years and Over 592 100.0 632 100.0<br />
Less than high school diploma 98 16.6 64 10.1<br />
High school graduate 282 47.6 278 44.0<br />
Some college, no degree 83 14.0 168 26.6<br />
Associate degree 54 9.1 49 7.8<br />
Bachelor’s degree or higher 75 12.7 73 11.6<br />
High school graduate or higher 494 83.4 568 89.9<br />
Persons 25 Years and Over 611 100.0 817 100.0<br />
Less than high school diploma 121 19.8 118 14.4<br />
High school graduate 298 48.8 362 44.3<br />
Some college, no degree 66 10.8 171 20.9<br />
Associate degree 57 9.3 77 9.4<br />
Bachelor’s degree or higher 69 11.3 90 11.0<br />
High school graduate or higher 490 80.2 699 85.6<br />
Persons 25 Years and Over 0 0 0 0<br />
Less than high school diploma 0 0 0 0<br />
High school graduate 0 0 0 0<br />
Some college, no degree 0 0 0 0<br />
Associate degree 0 0 0 0<br />
Bachelor’s degree or higher 0 0 0 0<br />
High school graduate or higher 0 0 0 0<br />
Persons 25 Years and Over 303 100.0 318 100.0<br />
Less than high school diploma 71 23.4 45 14.2<br />
High school graduate 130 42.9 102 32.1<br />
Some college, no degree 33 10.9 100 31.4<br />
Associate degree 37 12.2 21 6.6<br />
Bachelor’s degree or higher 32 10.6 41 12.9<br />
High school graduate or higher 232 76.6 273 85.8<br />
Persons 25 Years and Over 113 100.0 126 100.0<br />
Less than high school diploma 24 21.2 16 12.7<br />
High school graduate 70 61.9 69 54.8<br />
Some college, no degree 10 8.8 18 14.3<br />
Associate degree 2 1.8 13 10.3<br />
Bachelor’s degree or higher 7 6.2 10 7.9<br />
High school graduate or higher 89 78.8 110 87.3<br />
36 Issues and Opportunities Information
Table 1.13 continued<br />
Educational Attainment Levels – 1990 and 2000 – St. Croix County Municipal Units<br />
Village <strong>of</strong> Woodville<br />
City <strong>of</strong> Glenwood<br />
City <strong>of</strong> Hudson<br />
City <strong>of</strong> New Richmond<br />
City <strong>of</strong> River Falls<br />
Persons 25 Years and Over 610 100.0 704 100.0<br />
Less than high school diploma 192 31.5 115 16.3<br />
High school graduate 245 40.2 274 38.9<br />
Some college, no degree 70 11.5 146 20.7<br />
Associate degree 36 5.9 30 4.3<br />
Bachelor’s degree or higher 67 11.0 139 19.7<br />
High school graduate or higher 418 68.5 589 83.7<br />
Persons 25 Years and Over 644 100.0 751 100.0<br />
Less than high school diploma 197 30.6 161 21.4<br />
High school graduate 269 41.8 323 43.0<br />
Some college, no degree 65 10.1 125 16.6<br />
Associate degree 37 5.7 39 5.2<br />
Bachelor’s degree or higher 76 11.8 103 13.7<br />
High school graduate or higher 447 69.4 590 78.6<br />
Persons 25 Years and Over 4,088 100.0 5,617 100.0<br />
Less than high school diploma 466 11.4 270 4.8<br />
High school graduate 1,229 30.1 1,454 25.9<br />
Some college, no degree 831 20.3 1,263 22.5<br />
Associate degree 345 8.4 510 9.1<br />
Bachelor’s degree or higher 1,217 29.8 2,120 37.7<br />
High school graduate or higher 3,622 88.6 5,347 95.2<br />
Persons 25 Years and Over 3,159 100.0 3,981 100.0<br />
Less than high school diploma 540 17.1 480 12.1<br />
High school graduate 1,185 37.5 1,570 39.4<br />
Some college, no degree 511 16.2 825 20.7<br />
Associate degree 325 10.3 411 10.3<br />
Bachelor’s degree or higher 598 18.9 695 17.5<br />
High school graduate or higher 2,619 82.9 3,501 88.0<br />
Persons 25 Years and Over 1,092 100.0 1,576 100.0<br />
Less than high school diploma 222 20.3 229 14.5<br />
High school graduate 343 31.4 450 28.6<br />
Some college, no degree 201 18.4 318 20.2<br />
Associate degree 60 5.5 149 9.5<br />
Bachelor’s degree or higher 266 24.4 430 27.3<br />
High school graduate or higher 870 79.7 1,347 85.5<br />
St. Croix County Conditions and Trends Report 37
Table 1.14<br />
Labor Force – 1990 and 2000 – St. Croix County Municipal Units<br />
Town <strong>of</strong> Baldwin<br />
Persons<br />
16 and<br />
over<br />
# in Labor<br />
Force<br />
% in<br />
Labor<br />
Force Employed Unemployed<br />
%<br />
Unemployed<br />
1990 621 501 80.7 491 10 2.0<br />
2000 682 543 79.6 531 12 2.2<br />
Town <strong>of</strong> Cady<br />
1990 479 344 71.8 328 16 4.7<br />
2000 532 418 78.6 411 7 1.7<br />
Town <strong>of</strong> Cylon<br />
1990 474 329 69.4 317 12 3.6<br />
2000 471 350 74.3 331 19 5.4<br />
Town <strong>of</strong> Eau Galle<br />
1990 520 360 69.2 344 16 4.4<br />
2000 667 528 79.2 518 10 1.9<br />
Town <strong>of</strong> Emerald<br />
1990 473 341 72.1 326 15 4.4<br />
2000 533 409 76.7 398 11 2.7<br />
Town <strong>of</strong> Erin Prairie<br />
1990 455 348 76.5 336 12 3.4<br />
2000 518 410 79.2 394 16 3.9<br />
Town <strong>of</strong> Fore<strong>st</strong><br />
1990 413 314 76.0 303 11 3.5<br />
2000 446 348 78.0 332 16 4.6<br />
Town <strong>of</strong> Glenwood<br />
1990 501 367 73.3 349 18 4.9<br />
2000 544 396 72.8 377 19 4.8<br />
Town <strong>of</strong> Hammond<br />
1990 599 475 79.3 466 9 1.9<br />
2000 716 560 78.2 552 8 1.4<br />
Town <strong>of</strong> Hudson<br />
1990 2,558 2,053 80.3 1,984 69 3.4<br />
2000 4,627 3,756 81.2 3,709 47 1.3<br />
Town <strong>of</strong> Kinnickinnic<br />
1990 844 593 70.3 564 29 4.9<br />
2000 1,038 791 76.2 771 20 2.5<br />
38 Issues and Opportunities Information
Table 1.14 continued<br />
Labor Force – 1990 and 2000 – St. Croix County Municipal Units<br />
Town <strong>of</strong> Pleasant Valley<br />
Persons<br />
16 and<br />
over<br />
# in Labor<br />
Force<br />
% in<br />
Labor<br />
Force Employed Unemployed<br />
%<br />
Unemployed<br />
1990 264 195 73.9 193 2 1.0<br />
2000 295 233 79.0 224 9 3.9<br />
Town <strong>of</strong> Richmond<br />
1990 994 818 82.3 785 33 4.0<br />
2000 1,186 913 77.0 895 18 2.0<br />
Town <strong>of</strong> Rush River<br />
1990 318 226 71.1 217 9 4.0<br />
2000 400 305 76.3 297 8 2.6<br />
Town <strong>of</strong> St. Joseph/Houlton<br />
1990 1,919 1,515 78.9 1,459 56 3.7<br />
2000 2,497 1,997 80.0 1,918 79 4.0<br />
Town <strong>of</strong> Somerset<br />
1990 1,423 1,078 75.8 1,022 56 5.2<br />
2000 2,054 1,605 78.1 1,540 65 4.0<br />
Town <strong>of</strong> Springfield<br />
1990 543 392 72.2 373 19 4.8<br />
2000 616 474 76.9 450 24 5.1<br />
Town <strong>of</strong> Stanton<br />
1990 730 580 79.5 554 26 4.5<br />
2000 787 607 77.1 591 16 2.6<br />
Town <strong>of</strong> Star Prairie<br />
1990 1,537 1,009 65.6 949 60 5.9<br />
2000 2,273 1,633 71.8 1,592 41 2.5<br />
Town <strong>of</strong> Troy<br />
1990 2,206 1,819 82.5 1,777 42 2.3<br />
2000 2,684 2,094 78.0 2,068 26 1.2<br />
Town <strong>of</strong> Warren<br />
1990 707 564 79.8 549 15 2.7<br />
2000 969 784 80.9 772 12 1.5<br />
Village <strong>of</strong> Baldwin<br />
1990 1,549 1,000 64.6 947 53 5.3<br />
2000 2,091 1,466 70.1 1,407 59 4.0<br />
St. Croix County Conditions and Trends Report 39
Table 1.14 continued<br />
Labor Force – 1990 and 2000 – St. Croix County Municipal Units<br />
Village <strong>of</strong> Deer Park<br />
Persons<br />
16 and<br />
over<br />
# in Labor<br />
Force<br />
% in<br />
Labor<br />
Force Employed Unemployed<br />
%<br />
Unemployed<br />
1990 165 108 65.5 89 19 17.6<br />
2000 213 155 72.8 153 2 1.3<br />
Village <strong>of</strong> Hammond<br />
1990 836 531 63.5 515 16 3.0<br />
2000 879 651 74.1 635 16 2.5<br />
Village <strong>of</strong> North Hudson<br />
1990 2,226 1,788 80.3 1,732 56 3.1<br />
2000 2,569 2,108 82.1 2,059 49 2.3<br />
Village <strong>of</strong> Roberts<br />
1990 730 572 78.4 538 34 5.9<br />
2000 776 595 76.7 583 12 2.0<br />
Village <strong>of</strong> Somerset<br />
1990 772 595 77.1 568 27 4.5<br />
2000 1,067 821 76.9 790 31 3.8<br />
Village <strong>of</strong> Spring Valley*<br />
1990 0 0 0 0 0 0<br />
2000 0 0 0 0 0 0<br />
Village <strong>of</strong> Star Prairie<br />
1990 361 240 66.5 229 11 4.6<br />
2000 374 283 75.7 281 2 0.7<br />
Village <strong>of</strong> Wilson<br />
1990 130 100 76.9 90 10 10.0<br />
2000 150 114 76.0 111 3 2.6<br />
Village <strong>of</strong> Woodville<br />
1990 695 439 63.2 402 37 8.4<br />
2000 831 560 67.4 548 12 2.1<br />
City <strong>of</strong> Glenwood<br />
1990 753 433 57.5 410 23 5.3<br />
2000 902 575 63.7 561 14 2.4<br />
City <strong>of</strong> Hudson<br />
1990 4,792 3,489 72.8 3,371 118 3.4<br />
2000 6,590 4,753 72.1 4,700 53 1.1<br />
City <strong>of</strong> New Richmond<br />
1990 3,762 2,509 66.7 2,390 119 4.7<br />
40 Issues and Opportunities Information
Persons<br />
16 and<br />
over<br />
# in Labor<br />
Force<br />
% in<br />
Labor<br />
Force Employed Unemployed<br />
%<br />
Unemployed<br />
2000 4,666 3,348 71.8 3,187 161 4.8<br />
City <strong>of</strong> River Falls**<br />
1990 1,239 770 62.1 738 32 4.2<br />
2000 1,892 1,259 66.5 1,219 40 3.2<br />
St. Croix County<br />
1990 36,588 26,795 73.2 25,705 1,090 4.1<br />
2000 47,535 35,842 75.4 34,905 937 2.6<br />
source: U.S. Census<br />
St. Croix County Conditions and Trends Report 41
Table 1.15<br />
St. Croix County Employment – 1990 to 2006<br />
Indu<strong>st</strong>ry Category<br />
1990 1992 1994 1996 1998 2000 2002 2004 2006<br />
42 Issues and Opportunities Information<br />
% Chg<br />
‘90- ‘06<br />
Ag Fore<strong>st</strong>ry Fishing & Hunting 156 S S S S S 270 262 271 73.7<br />
Mining Quarrying & Oil & Gas<br />
Extraction 6 S S S S S 20 27 29 383.3<br />
Utilities 46 51 52 58 56 90 66 71 97 110.9<br />
Con<strong>st</strong>ruction 627 684 769 903 1,070 1,334 1,586 1,771 1,631 160.1<br />
Manufacturing 4,005 5,229 6,118 6,551 6,490 7,317 6,040 5,654 6,159 -31.4<br />
Wholesale Trade 494 448 437 395 429 469 586 632 756 53.0<br />
Retail Trade 2,435 2,327 2,478 2,667 2,819 3,225 3,656 3,841 4,040 47.1<br />
Transportation & Warehousing 893 985 858 842 984 954 984 1,100 1,165 22.7<br />
Information 207 S 198 192 S 302 285 279 290 40.1<br />
Finance & Insurance 427 404 450 500 519 613 680 895 899 110.5<br />
Real E<strong>st</strong>ate & Rental &<br />
Leasing 110 117 132 127 140 199 284 272 279 153.6<br />
Pr<strong>of</strong>essional & Technical<br />
Services 423 508 487 572 661 774 858 883 976 130.7<br />
Management Of Companies &<br />
Enterprises 75 102 114 136 200 142 162 304 292 289.3<br />
Admin & Wa<strong>st</strong>e Services 318 399 506 814 1166 1000 1031 878 825 159.4<br />
Educational Services 1,117 1,329 1,391 1,435 1,596 1,737 1,794 1,929 2,092 87.3<br />
Health Care & Social<br />
Assi<strong>st</strong>ance 1,830 1,928 2,104 2,133 2,174 2,298 2,486 2,551 2,856 56.1<br />
Arts Entertainment &<br />
Recreation 172 481 350 428 416 573 438 455 539 213.4<br />
Accommodation & Food<br />
Services 1,666 2,136 2,158 2,087 2,327 2,577 2,714 2,796 3,033 82.1<br />
Other Services, except Public<br />
Admin 434 439 489 625 637 717 744 789 840 93.5<br />
Public Admini<strong>st</strong>ration 1,020 1,029 1,088 1,100 1,160 1,266 1,305 1,248 1,296 27.1<br />
Unclassified 0 S 8 8 S 0 0 0 0 n.a.<br />
Total 16,461 18,596 20,187 21,573 22,844 25,587 25,989 26,637 28,365 72.3<br />
note: Only includes employers participating in the State unemployment insurance program.<br />
source: Wisconsin Department <strong>of</strong> Workforce Development, WORKnet
Table 1.16<br />
Employment By Indu<strong>st</strong>ry – 1990 and 2000 – St. Croix County Municipal Units<br />
(yellow shading indicates combined categories)<br />
Town <strong>of</strong> Baldwin<br />
1990 2000<br />
Number Percent Number Percent<br />
Agriculture, fore<strong>st</strong>ry, fishing, hunting & mining 83 16.9 70 13.2<br />
Con<strong>st</strong>ruction 24 4.9 55 10.4<br />
Manufacturing 137 27.9 130 24.5<br />
Wholesale trade 16 3.3 23 4.3<br />
Retail trade 71 14.5 47 8.9<br />
Transportation, warehousing and utilities 25 5.1 24 4.5<br />
Information 5 1.0 15 2.8<br />
Finance, insurance, real e<strong>st</strong>ate, rental & leasing<br />
Pr<strong>of</strong>essional, scientific, management,<br />
14 2.9 21 4.0<br />
admini<strong>st</strong>rative and wa<strong>st</strong>e management services 16 3.3 18 3.4<br />
Educational, health and social services<br />
Arts, entertainment, recreation, accommodation<br />
67 13.6 81 15.3<br />
and food services 21 4.3 11 2.1<br />
Other services, except public admini<strong>st</strong>ration 21 4.0<br />
Public admini<strong>st</strong>ration 12 2.4 15 2.8<br />
Total Employment (16 years and over) 491 100.0 531 100.0<br />
Town <strong>of</strong> Cady<br />
Agriculture, fore<strong>st</strong>ry, fishing, hunting & mining 86 26.2 60 14.6<br />
Con<strong>st</strong>ruction 14 4.3 36 8.8<br />
Manufacturing 75 22.9 118 28.7<br />
Wholesale trade 20 6.1 4 1.0<br />
Retail trade 32 9.8 31 7.5<br />
Transportation, warehousing and utilities 27 8.2 18 4.4<br />
Information 0 0 2 0.5<br />
Finance, insurance, real e<strong>st</strong>ate, rental & leasing<br />
Pr<strong>of</strong>essional, scientific, management,<br />
10 3.0 19 4.6<br />
admini<strong>st</strong>rative and wa<strong>st</strong>e management services 19 5.8 21 5.1<br />
Educational, health and social services<br />
Arts, entertainment, recreation, accommodation<br />
37 11.3 69 16.8<br />
and food services 6 1.8 9 2.2<br />
Other services, except public admini<strong>st</strong>ration 13 3.2<br />
Public admini<strong>st</strong>ration 2 0.6 11 2.7<br />
Total Employment (16 years and over) 328 100.0 411 100.0<br />
St. Croix County Conditions and Trends Report 43
Table 1.16 continued<br />
Employment By Indu<strong>st</strong>ry – 1990 and 2000 – St. Croix County Municipal Units<br />
(yellow shading indicates combined categories)<br />
Town <strong>of</strong> Cylon<br />
1990 2000<br />
Number Percent Number Percent<br />
Agriculture, fore<strong>st</strong>ry, fishing, hunting & mining 68 21.5 34 10.3<br />
Con<strong>st</strong>ruction 23 7.3 30 9.1<br />
Manufacturing 101 31.9 105 31.7<br />
Wholesale trade 3 0.9 10 3.0<br />
Retail trade 28 8.8 24 7.3<br />
Transportation, warehousing and utilities 11 3.5 11 3.3<br />
Information 8 2.5 0 0<br />
Finance, insurance, real e<strong>st</strong>ate, rental & leasing<br />
Pr<strong>of</strong>essional, scientific, management,<br />
8 2.5 17 5.1<br />
admini<strong>st</strong>rative and wa<strong>st</strong>e management services 14 4.4 22 6.6<br />
Educational, health and social services<br />
Arts, entertainment, recreation, accommodation<br />
32 10.1 35 10.6<br />
and food services 18 5.7 11 3.3<br />
Other services, except public admini<strong>st</strong>ration 24 7.3<br />
Public admini<strong>st</strong>ration 3 0.9 8 2.4<br />
Total Employment (16 years and over) 317 100.0 331 100.0<br />
Town <strong>of</strong> Eau Galle<br />
Agriculture, fore<strong>st</strong>ry, fishing, hunting & mining 72 20.9 53 10.2<br />
Con<strong>st</strong>ruction 29 8.4 48 9.3<br />
Manufacturing 79 23.0 104 20.1<br />
Wholesale trade 3 0.9 2 0.4<br />
Retail trade 48 14.0 40 7.7<br />
Transportation, warehousing and utilities 28 8.1 35 6.8<br />
Information 4 1.2 7 1.4<br />
Finance, insurance, real e<strong>st</strong>ate, rental & leasing<br />
Pr<strong>of</strong>essional, scientific, management,<br />
12 3.5 27 5.2<br />
admini<strong>st</strong>rative and wa<strong>st</strong>e management services 16 4.7 32 6.2<br />
Educational, health and social services<br />
Arts, entertainment, recreation, accommodation<br />
36 10.5 107 20.7<br />
and food services 13 3.8 30 5.8<br />
Other services, except public admini<strong>st</strong>ration 23 4.4<br />
Public admini<strong>st</strong>ration 4 1.2 10 1.9<br />
Total Employment (16 years and over) 344 100.0 518 100.0<br />
44 Issues and Opportunities Information
Table 1.16 continued<br />
Employment By Indu<strong>st</strong>ry – 1990 and 2000 – St. Croix County Municipal Units<br />
(yellow shading indicates combined categories)<br />
Town <strong>of</strong> Emerald<br />
1990 2000<br />
Number Percent Number Percent<br />
Agriculture, fore<strong>st</strong>ry, fishing, hunting & mining 87 26.7 62 15.6<br />
Con<strong>st</strong>ruction 18 5.5 30 7.5<br />
Manufacturing 77 23.6 102 25.6<br />
Wholesale trade 8 2.5 6 1.5<br />
Retail trade 27 8.3 32 8.0<br />
Transportation, warehousing and utilities 25 7.7 28 7.0<br />
Information 4 1.2 5 1.3<br />
Finance, insurance, real e<strong>st</strong>ate, rental & leasing<br />
Pr<strong>of</strong>essional, scientific, management,<br />
7 2.1 9 2.3<br />
admini<strong>st</strong>rative and wa<strong>st</strong>e management services 10 3.1 14 3.5<br />
Educational, health and social services<br />
Arts, entertainment, recreation, accommodation<br />
40 12.3 76 19.1<br />
and food services 10 3.1 15 3.8<br />
Other services, except public admini<strong>st</strong>ration 12 3.0<br />
Public admini<strong>st</strong>ration 13 4.0 7 1.8<br />
Total Employment (16 years and over) 326 100.0 398 100.0<br />
Town <strong>of</strong> Erin Prairie<br />
Agriculture, fore<strong>st</strong>ry, fishing, hunting & mining 52 15.5 38 9.6<br />
Con<strong>st</strong>ruction 10 3.0 35 8.9<br />
Manufacturing 89 24.3 113 28.7<br />
Wholesale trade 12 3.6 7 1.8<br />
Retail trade 45 13.4 47 11.9<br />
Transportation, warehousing and utilities 13 3.9 15 3.8<br />
Information 6 1.8 2 0.5<br />
Finance, insurance, real e<strong>st</strong>ate, rental & leasing<br />
Pr<strong>of</strong>essional, scientific, management,<br />
7 2.1 10 2.5<br />
admini<strong>st</strong>rative and wa<strong>st</strong>e management services 11 3.3 35 8.9<br />
Educational, health and social services<br />
Arts, entertainment, recreation, accommodation<br />
73 21.7 52 13.2<br />
and food services 14 4.2 27 6.9<br />
Other services, except public admini<strong>st</strong>ration 5 1.3<br />
Public admini<strong>st</strong>ration 4 1.2 8 2.0<br />
Total Employment (16 years and over) 336 100.0 394 100.0<br />
St. Croix County Conditions and Trends Report 45
Table 1.16 continued<br />
Employment By Indu<strong>st</strong>ry – 1990 and 2000 – St. Croix County Municipal Units<br />
(yellow shading indicates combined categories)<br />
Town <strong>of</strong> Fore<strong>st</strong><br />
1990 2000<br />
Number Percent Number Percent<br />
Agriculture, fore<strong>st</strong>ry, fishing, hunting & mining 141 46.5 90 27.1<br />
Con<strong>st</strong>ruction 8 2.6 18 5.4<br />
Manufacturing 55 18.2 80 24.1<br />
Wholesale trade 9 3.0 11 3.3<br />
Retail trade 14 4.6 30 9.0<br />
Transportation, warehousing and utilities 12 4.0 25 7.5<br />
Information 2 0.6 0 0<br />
Finance, insurance, real e<strong>st</strong>ate, rental & leasing<br />
Pr<strong>of</strong>essional, scientific, management,<br />
7 2.3 9 2.7<br />
admini<strong>st</strong>rative and wa<strong>st</strong>e management services 20 6.6 14 4.2<br />
Educational, health and social services<br />
Arts, entertainment, recreation, accommodation<br />
20 6.6 28 8.4<br />
and food services 9 3.0 12 3.6<br />
Other services, except public admini<strong>st</strong>ration 10 3.0<br />
Public admini<strong>st</strong>ration 6 2.0 5 1.5<br />
Total Employment (16 years and over) 303 100.0 332 100.0<br />
Town <strong>of</strong> Glenwood<br />
Agriculture, fore<strong>st</strong>ry, fishing, hunting & mining 105 30.1 57 15.1<br />
Con<strong>st</strong>ruction 12 3.4 11 2.9<br />
Manufacturing 60 17.2 81 21.5<br />
Wholesale trade 4 1.1 12 3.2<br />
Retail trade 62 17.8 62 16.4<br />
Transportation, warehousing and utilities 19 5.4 22 5.8<br />
Information 0 0 0 0<br />
Finance, insurance, real e<strong>st</strong>ate, rental & leasing<br />
Pr<strong>of</strong>essional, scientific, management,<br />
13 3.7 4 1.1<br />
admini<strong>st</strong>rative and wa<strong>st</strong>e management services 12 3.4 17 4.5<br />
Educational, health and social services<br />
Arts, entertainment, recreation, accommodation<br />
35 10.0 56 14.9<br />
and food services 15 4.3 28 7.4<br />
Other services, except public admini<strong>st</strong>ration 27 7.2<br />
Public admini<strong>st</strong>ration 12 3.4 0 0<br />
Total Employment (16 years and over) 349 100.0 377 100.0<br />
46 Issues and Opportunities Information
Table 1.16 continued<br />
Employment By Indu<strong>st</strong>ry – 1990 and 2000 – St. Croix County Municipal Units<br />
(yellow shading indicates combined categories)<br />
Town <strong>of</strong> Hammond<br />
1990 2000<br />
Number Percent Number Percent<br />
Agriculture, fore<strong>st</strong>ry, fishing, hunting & mining 89 19.1 49 8.9<br />
Con<strong>st</strong>ruction 36 7.7 43 7.8<br />
Manufacturing 69 14.8 126 22.8<br />
Wholesale trade 18 3.9 10 1.8<br />
Retail trade 48 10.2 49 8.9<br />
Transportation, warehousing and utilities 18 3.9 38 6.9<br />
Information 9 1.9 9 1.6<br />
Finance, insurance, real e<strong>st</strong>ate, rental & leasing<br />
Pr<strong>of</strong>essional, scientific, management,<br />
45 9.7 33 6.0<br />
admini<strong>st</strong>rative and wa<strong>st</strong>e management services 13 2.8 34 6.2<br />
Educational, health and social services<br />
Arts, entertainment, recreation, accommodation<br />
74 15.9 102 18.5<br />
and food services 28 6.0 19 3.4<br />
Other services, except public admini<strong>st</strong>ration 26 4.7<br />
Public admini<strong>st</strong>ration 19 4.1 14 2.5<br />
Total Employment (16 years and over) 466 100.0 552 100.0<br />
Town <strong>of</strong> Hudson<br />
Agriculture, fore<strong>st</strong>ry, fishing, hunting & mining 31 1.6 18 0.5<br />
Con<strong>st</strong>ruction 107 5.4 260 7.0<br />
Manufacturing 513 25.9 827 22.3<br />
Wholesale trade 58 2.9 68 1.8<br />
Retail trade 341 17.2 425 11.5<br />
Transportation, warehousing and utilities 125 6.3 356 9.6<br />
Information 61 3.1 56 1.5<br />
Finance, insurance, real e<strong>st</strong>ate, rental & leasing<br />
Pr<strong>of</strong>essional, scientific, management,<br />
189 9.5 387 10.4<br />
admini<strong>st</strong>rative and wa<strong>st</strong>e management services 144 7.3 271 7.3<br />
Educational, health and social services<br />
Arts, entertainment, recreation, accommodation<br />
270 13.6 621 16.7<br />
and food services 97 4.9 164 4.4<br />
Other services, except public admini<strong>st</strong>ration 150 4.0<br />
Public admini<strong>st</strong>ration 48 2.4 106 2.9<br />
Total Employment (16 years and over) 1,984 100.0 3,709 100.0<br />
St. Croix County Conditions and Trends Report 47
Table 1.16 continued<br />
Employment By Indu<strong>st</strong>ry – 1990 and 2000 – St. Croix County Municipal Units<br />
(yellow shading indicates combined categories)<br />
Town <strong>of</strong> Kinnickinnic<br />
1990 2000<br />
Number Percent Number Percent<br />
Agriculture, fore<strong>st</strong>ry, fishing, hunting & mining 62 11.0 25 3.2<br />
Con<strong>st</strong>ruction 14 2.5 61 7.9<br />
Manufacturing 129 22.9 178 23.1<br />
Wholesale trade 14 2.5 18 2.3<br />
Retail trade 84 14.9 102 13.2<br />
Transportation, warehousing and utilities 40 7.1 43 5.6<br />
Information 7 1.2 14 1.8<br />
Finance, insurance, real e<strong>st</strong>ate, rental & leasing<br />
Pr<strong>of</strong>essional, scientific, management,<br />
43 7.6 50 6.5<br />
admini<strong>st</strong>rative and wa<strong>st</strong>e management services 33 5.9 44 5.7<br />
Educational, health and social services<br />
Arts, entertainment, recreation, accommodation<br />
94 16.7 162 21.0<br />
and food services 28 5.0 25 3.2<br />
Other services, except public admini<strong>st</strong>ration 18 2.3<br />
Public admini<strong>st</strong>ration 16 2.8 31 4.0<br />
Total Employment (16 years and over) 564 100.0 771 100.0<br />
Town <strong>of</strong> Pleasant Valley<br />
Agriculture, fore<strong>st</strong>ry, fishing, hunting & mining 53 27.5 37 16.5<br />
Con<strong>st</strong>ruction 0 0 16 7.1<br />
Manufacturing 41 21.2 30 13.4<br />
Wholesale trade 10 5.2 6 2.7<br />
Retail trade 6 3.1 19 8.5<br />
Transportation, warehousing and utilities 14 7.3 11 4.9<br />
Information 0 0 1 0.4<br />
Finance, insurance, real e<strong>st</strong>ate, rental & leasing<br />
Pr<strong>of</strong>essional, scientific, management,<br />
14 7.3 7 3.1<br />
admini<strong>st</strong>rative and wa<strong>st</strong>e management services 8 4.1 21 9.4<br />
Educational, health and social services<br />
Arts, entertainment, recreation, accommodation<br />
27 14.0 42 18.8<br />
and food services 20 10.4 11 4.9<br />
Other services, except public admini<strong>st</strong>ration 12 5.4<br />
Public admini<strong>st</strong>ration 0 0 11 4.9<br />
Total Employment (16 years and over) 193 100.0 224 100.0<br />
48 Issues and Opportunities Information
Table 1.16 continued<br />
Employment By Indu<strong>st</strong>ry – 1990 and 2000 – St. Croix County Municipal Units<br />
(yellow shading indicates combined categories)<br />
Town <strong>of</strong> Richmond<br />
1990 2000<br />
Number Percent Number Percent<br />
Agriculture, fore<strong>st</strong>ry, fishing, hunting & mining 95 12.1 69 7.7<br />
Con<strong>st</strong>ruction 49 6.2 46 5.1<br />
Manufacturing 247 31.5 231 25.8<br />
Wholesale trade 26 3.3 22 2.5<br />
Retail trade 85 10.8 72 8.0<br />
Transportation, warehousing and utilities 34 4.3 55 6.1<br />
Information 1 0.1 5 0.6<br />
Finance, insurance, real e<strong>st</strong>ate, rental & leasing<br />
Pr<strong>of</strong>essional, scientific, management,<br />
35 4.5 54 6.0<br />
admini<strong>st</strong>rative and wa<strong>st</strong>e management services 42 5.4 55 6.1<br />
Educational, health and social services<br />
Arts, entertainment, recreation, accommodation<br />
115 14.6 158 17.7<br />
and food services 42 5.4 74 8.3<br />
Other services, except public admini<strong>st</strong>ration 21 2.3<br />
Public admini<strong>st</strong>ration 14 1.8 33 3.7<br />
Total Employment (16 years and over) 785 100.0 895 100.0<br />
Town <strong>of</strong> Rush River<br />
Agriculture, fore<strong>st</strong>ry, fishing, hunting & mining 54 24.9 32 10.8<br />
Con<strong>st</strong>ruction 4 1.8 23 7.7<br />
Manufacturing 51 23.5 73 24.6<br />
Wholesale trade 4 1.8 8 2.7<br />
Retail trade 31 14.3 13 4.4<br />
Transportation, warehousing and utilities 13 6.0 21 7.1<br />
Information 1 0.5 3 1.0<br />
Finance, insurance, real e<strong>st</strong>ate, rental & leasing<br />
Pr<strong>of</strong>essional, scientific, management,<br />
10 4.6 23 7.7<br />
admini<strong>st</strong>rative and wa<strong>st</strong>e management services 12 5.5 11 3.7<br />
Educational, health and social services<br />
Arts, entertainment, recreation, accommodation<br />
18 8.3 44 14.8<br />
and food services 7 3.2 21 7.1<br />
Other services, except public admini<strong>st</strong>ration 13 4.4<br />
Public admini<strong>st</strong>ration 12 5.5 12 4.0<br />
Total Employment (16 years and over) 217 100.0 297 100.0<br />
St. Croix County Conditions and Trends Report 49
Table 1.16 continued<br />
Employment By Indu<strong>st</strong>ry – 1990 and 2000 – St. Croix County Municipal Units<br />
(yellow shading indicates combined categories)<br />
Town <strong>of</strong> St. Joseph/Houlton<br />
1990 2000<br />
Number Percent Number Percent<br />
Agriculture, fore<strong>st</strong>ry, fishing, hunting & mining 66 4.5 18 0.9<br />
Con<strong>st</strong>ruction 112 7.7 189 9.9<br />
Manufacturing 415 28.4 415 21.6<br />
Wholesale trade 68 4.7 59 3.1<br />
Retail trade 211 14.5 187 9.7<br />
Transportation, warehousing and utilities 49 3.4 147 7.7<br />
Information 23 1.6 54 2.8<br />
Finance, insurance, real e<strong>st</strong>ate, rental & leasing<br />
Pr<strong>of</strong>essional, scientific, management,<br />
67 4.6 158 8.2<br />
admini<strong>st</strong>rative and wa<strong>st</strong>e management services 97 6.6 214 11.2<br />
Educational, health and social services<br />
Arts, entertainment, recreation, accommodation<br />
176 12.1 242 12.6<br />
and food services 114 7.8 73 3.8<br />
Other services, except public admini<strong>st</strong>ration 96 5.0<br />
Public admini<strong>st</strong>ration 61 4.2 66 3.4<br />
Total Employment (16 years and over) 1,459 100.0 1.918 100.0<br />
Town <strong>of</strong> Somerset<br />
Agriculture, fore<strong>st</strong>ry, fishing, hunting & mining 39 3.8 61 4.0<br />
Con<strong>st</strong>ruction 83 8.1 172 11.2<br />
Manufacturing 337 33.0 467 30.3<br />
Wholesale trade 25 24.5 7 0.5<br />
Retail trade 141 13.8 120 7.8<br />
Transportation, warehousing and utilities 45 4.4 66 4.3<br />
Information 40 3.9 27 1.8<br />
Finance, insurance, real e<strong>st</strong>ate, rental & leasing<br />
Pr<strong>of</strong>essional, scientific, management,<br />
43 4.2 56 3.6<br />
admini<strong>st</strong>rative and wa<strong>st</strong>e management services 70 6.8 129 8.4<br />
Educational, health and social services<br />
Arts, entertainment, recreation, accommodation<br />
105 10.3 263 17.1<br />
and food services 55 5.4 72 4.7<br />
Other services, except public admini<strong>st</strong>ration 55 3.6<br />
Public admini<strong>st</strong>ration 39 3.8 45 2.9<br />
Total Employment (16 years and over) 1,022 100.0 1,540 100.0<br />
50 Issues and Opportunities Information
Table 1.16 continued<br />
Employment By Indu<strong>st</strong>ry – 1990 and 2000 – St. Croix County Municipal Units<br />
(yellow shading indicates combined categories)<br />
Town <strong>of</strong> Springfield<br />
1990 2000<br />
Number Percent Number Percent<br />
Agriculture, fore<strong>st</strong>ry, fishing, hunting & mining 94 25.2 48 10.7<br />
Con<strong>st</strong>ruction 23 6.2 28 6.2<br />
Manufacturing 84 22.5 144 32.0<br />
Wholesale trade 9 2.4 23 5.1<br />
Retail trade 42 11.3 32 7.1<br />
Transportation, warehousing and utilities 17 4.6 25 5.6<br />
Information 5 1.3 2 0.4<br />
Finance, insurance, real e<strong>st</strong>ate, rental & leasing<br />
Pr<strong>of</strong>essional, scientific, management,<br />
4 1.1 34 7.6<br />
admini<strong>st</strong>rative and wa<strong>st</strong>e management services 13 3.5 17 3.8<br />
Educational, health and social services<br />
Arts, entertainment, recreation, accommodation<br />
50 13.4 63 14.0<br />
and food services 28 7.5 16 3.6<br />
Other services, except public admini<strong>st</strong>ration 12 2.7<br />
Public admini<strong>st</strong>ration 4 1.1 6 1.3<br />
Total Employment (16 years and over) 373 100.0 450 100.0<br />
Town <strong>of</strong> Stanton<br />
Agriculture, fore<strong>st</strong>ry, fishing, hunting & mining 117 21.1 27 4.6<br />
Con<strong>st</strong>ruction 29 5.2 41 6.9<br />
Manufacturing 127 22.9 167 28.3<br />
Wholesale trade 24 4.3 21 3.6<br />
Retail trade 90 16.2 74 12.5<br />
Transportation, warehousing and utilities 20 3.6 32 5.4<br />
Information 10 1.8 12 2.0<br />
Finance, insurance, real e<strong>st</strong>ate, rental & leasing<br />
Pr<strong>of</strong>essional, scientific, management,<br />
14 2.5 27 4.6<br />
admini<strong>st</strong>rative and wa<strong>st</strong>e management services 30 5.4 37 6.3<br />
Educational, health and social services<br />
Arts, entertainment, recreation, accommodation<br />
45 8.1 81 13.7<br />
and food services 38 6.9 48 8.1<br />
Other services, except public admini<strong>st</strong>ration 14 2.4<br />
Public admini<strong>st</strong>ration 10 1.8 10 1.7<br />
Total Employment (16 years and over) 554 100.0 591 100.0<br />
St. Croix County Conditions and Trends Report 51
Table 1.16 continued<br />
Employment By Indu<strong>st</strong>ry – 1990 and 2000 – St. Croix County Municipal Units<br />
(yellow shading indicates combined categories)<br />
Town <strong>of</strong> Star Prairie<br />
1990 2000<br />
Number Percent Number Percent<br />
Agriculture, fore<strong>st</strong>ry, fishing, hunting & mining 61 6.4 17 1.1<br />
Con<strong>st</strong>ruction 60 6.3 164 10.3<br />
Manufacturing 339 35.7 492 30.9<br />
Wholesale trade 30 3.2 35 2.2<br />
Retail trade 145 15.3 194 12.2<br />
Transportation, warehousing and utilities 25 2.6 59 3.7<br />
Information 10 1.1 23 1.4<br />
Finance, insurance, real e<strong>st</strong>ate, rental & leasing<br />
Pr<strong>of</strong>essional, scientific, management,<br />
36 3.8 36 2.3<br />
admini<strong>st</strong>rative and wa<strong>st</strong>e management services 41 4.3 74 4.6<br />
Educational, health and social services<br />
Arts, entertainment, recreation, accommodation<br />
120 12.6 237 14.9<br />
and food services 50 5.3 103 6.5<br />
Other services, except public admini<strong>st</strong>ration 96 6.0<br />
Public admini<strong>st</strong>ration 32 3.4 62 3.9<br />
Total Employment (16 years and over) 949 100.0 1,592 100.0<br />
Town <strong>of</strong> Troy<br />
Agriculture, fore<strong>st</strong>ry, fishing, hunting & mining 126 7.1 30 1.5<br />
Con<strong>st</strong>ruction 64 3.6 105 5.1<br />
Manufacturing 378 21.3 449 21.7<br />
Wholesale trade 62 3.5 28 1.4<br />
Retail trade 270 15.2 189 9.1<br />
Transportation, warehousing and utilities 116 6.5 135 6.5<br />
Information 17 1.0 47 2.3<br />
Finance, insurance, real e<strong>st</strong>ate, rental & leasing<br />
Pr<strong>of</strong>essional, scientific, management,<br />
153 8.6 227 11.0<br />
admini<strong>st</strong>rative and wa<strong>st</strong>e management services 106 6.0 201 9.7<br />
Educational, health and social services<br />
Arts, entertainment, recreation, accommodation<br />
327 18.4 408 19.7<br />
and food services 78 4.4 129 6.2<br />
Other services, except public admini<strong>st</strong>ration 69 3.3<br />
Public admini<strong>st</strong>ration 80 4.5 51 2.5<br />
Total Employment (16 years and over) 1,777 100.0 2,068 100.0<br />
52 Issues and Opportunities Information
Table 1.16 continued<br />
Employment By Indu<strong>st</strong>ry – 1990 and 2000 – St. Croix County Municipal Units<br />
(yellow shading indicates combined categories)<br />
Town <strong>of</strong> Warren<br />
1990 2000<br />
Number Percent Number Percent<br />
Agriculture, fore<strong>st</strong>ry, fishing, hunting & mining 73 13.3 51 6.6<br />
Con<strong>st</strong>ruction 24 4.4 53 6.9<br />
Manufacturing 151 27.5 189 24.5<br />
Wholesale trade 21 3.8 23 3.0<br />
Retail trade 90 16.4 87 11.3<br />
Transportation, warehousing and utilities 34 6.2 34 4.4<br />
Information 13 2.4 11 1.4<br />
Finance, insurance, real e<strong>st</strong>ate, rental & leasing<br />
Pr<strong>of</strong>essional, scientific, management,<br />
23 4.2 72 9.3<br />
admini<strong>st</strong>rative and wa<strong>st</strong>e management services 22 4.0 52 6.7<br />
Educational, health and social services<br />
Arts, entertainment, recreation, accommodation<br />
61 11.1 105 13.6<br />
and food services 31 5.6 54 7.0<br />
Other services, except public admini<strong>st</strong>ration 16 2.1<br />
Public admini<strong>st</strong>ration 6 1.1 25 3.2<br />
Total Employment (16 years and over) 549 100.0 772 100.0<br />
Village <strong>of</strong> Baldwin<br />
Agriculture, fore<strong>st</strong>ry, fishing, hunting & mining 26 2.7 26 1.8<br />
Con<strong>st</strong>ruction 41 4.3 66 4.7<br />
Manufacturing 267 28.2 320 22.7<br />
Wholesale trade 37 3.9 39 2.8<br />
Retail trade 142 15.0 182 12.9<br />
Transportation, warehousing and utilities 65 6.9 66 4.7<br />
Information 13 13.7 25 1.8<br />
Finance, insurance, real e<strong>st</strong>ate, rental & leasing<br />
Pr<strong>of</strong>essional, scientific, management,<br />
35 3.7 70 5.0<br />
admini<strong>st</strong>rative and wa<strong>st</strong>e management services 51 5.4 72 5.1<br />
Educational, health and social services<br />
Arts, entertainment, recreation, accommodation<br />
171 18.1 297 21.1<br />
and food services 77 8.1 114 8.1<br />
Other services, except public admini<strong>st</strong>ration 77 5.5<br />
Public admini<strong>st</strong>ration 22 2.3 53 3.8<br />
Total Employment (16 years and over) 947 100.0 1,407 100.0<br />
St. Croix County Conditions and Trends Report 53
Table 1.16 continued<br />
Employment By Indu<strong>st</strong>ry – 1990 and 2000 – St. Croix County Municipal Units<br />
(yellow shading indicates combined categories)<br />
Village <strong>of</strong> Deer Park<br />
1990 2000<br />
Number Percent Number Percent<br />
Agriculture, fore<strong>st</strong>ry, fishing, hunting & mining 0 0 1 0.7<br />
Con<strong>st</strong>ruction 2 2.2 6 3.9<br />
Manufacturing 38 42.7 58 37.9<br />
Wholesale trade 0 0 5 3.3<br />
Retail trade 10 11.2 20 13.1<br />
Transportation, warehousing and utilities 5 5.6 0 0<br />
Information 0 0 3 2.0<br />
Finance, insurance, real e<strong>st</strong>ate, rental & leasing<br />
Pr<strong>of</strong>essional, scientific, management,<br />
1 1.1 8 5.2<br />
admini<strong>st</strong>rative and wa<strong>st</strong>e management services 11 12.4 4 2.6<br />
Educational, health and social services<br />
Arts, entertainment, recreation, accommodation<br />
12 13.5 21 13.7<br />
and food services 10 11.2 14 9.2<br />
Other services, except public admini<strong>st</strong>ration 9 5.9<br />
Public admini<strong>st</strong>ration 0 0 4 2.6<br />
Total Employment (16 years and over) 89 100.0 153 100.0<br />
Village <strong>of</strong> Hammond<br />
Agriculture, fore<strong>st</strong>ry, fishing, hunting & mining 12 2.3 6 0.9<br />
Con<strong>st</strong>ruction 28 5.4 62 9.8<br />
Manufacturing 149 28.9 123 19.4<br />
Wholesale trade 15 2.9 16 2.5<br />
Retail trade 76 14.8 97 15.3<br />
Transportation, warehousing and utilities 27 5.2 24 3.8<br />
Information 6 1.2 8 1.3<br />
Finance, insurance, real e<strong>st</strong>ate, rental & leasing<br />
Pr<strong>of</strong>essional, scientific, management,<br />
33 6.4 43 6.8<br />
admini<strong>st</strong>rative and wa<strong>st</strong>e management services 31 6.0 31 4.9<br />
Educational, health and social services<br />
Arts, entertainment, recreation, accommodation<br />
89 17.3 111 17.5<br />
and food services 36 7.0 64 10.1<br />
Other services, except public admini<strong>st</strong>ration 17 2.7<br />
Public admini<strong>st</strong>ration 13 2.5 33 5.2<br />
Total Employment (16 years and over) 515 100.0 635 100.0<br />
54 Issues and Opportunities Information
Table 1.16 continued<br />
Employment By Indu<strong>st</strong>ry – 1990 and 2000 – St. Croix County Municipal Units<br />
(yellow shading indicates combined categories)<br />
Village <strong>of</strong> North Hudson<br />
1990 2000<br />
Number Percent Number Percent<br />
Agriculture, fore<strong>st</strong>ry, fishing, hunting & mining 32 1.8 6 0.3<br />
Con<strong>st</strong>ruction 93 5.4 131 6.4<br />
Manufacturing 476 27.5 454 22.0<br />
Wholesale trade 47 2.7 48 2.3<br />
Retail trade 229 13.2 157 7.6<br />
Transportation, warehousing and utilities 66 3.8 115 5.6<br />
Information 28 1.6 54 2.6<br />
Finance, insurance, real e<strong>st</strong>ate, rental & leasing<br />
Pr<strong>of</strong>essional, scientific, management,<br />
194 11.2 192 9.3<br />
admini<strong>st</strong>rative and wa<strong>st</strong>e management services 117 6.8 165 8.0<br />
Educational, health and social services<br />
Arts, entertainment, recreation, accommodation<br />
279 16.1 392 19.0<br />
and food services 120 16.4 193 9.4<br />
Other services, except public admini<strong>st</strong>ration 76 3.7<br />
Public admini<strong>st</strong>ration 51 2.9 76 3.7<br />
Total Employment (16 years and over) 1,732 100.0 2,059 100.0<br />
2,059<br />
Village <strong>of</strong> Roberts<br />
Agriculture, fore<strong>st</strong>ry, fishing, hunting & mining 6 1.1 0 0<br />
Con<strong>st</strong>ruction 27 5.0 33 5.7<br />
Manufacturing 164 30.5 183 31.4<br />
Wholesale trade 20 3.7 17 2.9<br />
Retail trade 72 13.4 67 11.5<br />
Transportation, warehousing and utilities 35 6.5 43 7.4<br />
Information 6 1.1 23 3.9<br />
Finance, insurance, real e<strong>st</strong>ate, rental & leasing 53 9.9 49 8.4<br />
Pr<strong>of</strong>essional, scientific, management,<br />
admini<strong>st</strong>rative and wa<strong>st</strong>e management services 19 3.5 19 3.3<br />
Educational, health and social services 69 12.8 73 12.5<br />
Arts, entertainment, recreation, accommodation<br />
and food services<br />
47 8.7 51 8.7<br />
Other services, except public admini<strong>st</strong>ration 11 1.9<br />
Public admini<strong>st</strong>ration 20 3.7 14 2.4<br />
Total Employment (16 years and over) 538 100.0 583 100.0<br />
St. Croix County Conditions and Trends Report 55
Table 1.16 continued<br />
Employment By Indu<strong>st</strong>ry – 1990 and 2000 – St. Croix County Municipal Units<br />
(yellow shading indicates combined categories)<br />
Village <strong>of</strong> Somerset<br />
1990 2000<br />
Number Percent Number Percent<br />
Agriculture, fore<strong>st</strong>ry, fishing, hunting & mining 14 2.5 2 0.3<br />
Con<strong>st</strong>ruction 31 5.5 72 9.1<br />
Manufacturing 154 27.1 224 28.4<br />
Wholesale trade 16 2.8 13 1.6<br />
Retail trade 127 22.4 105 13.3<br />
Transportation, warehousing and utilities 26 4.6 43 5.4<br />
Information 4 0.7 8 1.0<br />
Finance, insurance, real e<strong>st</strong>ate, rental & leasing<br />
Pr<strong>of</strong>essional, scientific, management,<br />
43 7.6 32 4.1<br />
admini<strong>st</strong>rative and wa<strong>st</strong>e management services 26 4.6 46 5.8<br />
Educational, health and social services<br />
Arts, entertainment, recreation, accommodation<br />
74 13.0 121 15.3<br />
and food services 41 7.2 72 9.1<br />
Other services, except public admini<strong>st</strong>ration 33 4.2<br />
Public admini<strong>st</strong>ration 12 2.1 19 2.4<br />
Total Employment (16 years and over) 568 100.0 790 100.0<br />
Village <strong>of</strong> Spring Valley*<br />
Agriculture, fore<strong>st</strong>ry, fishing, hunting & mining 0 0 0 0<br />
Con<strong>st</strong>ruction 0 0 0 0<br />
Manufacturing 0 0 0 0<br />
Wholesale trade 0 0 0 0<br />
Retail trade 0 0 0 0<br />
Transportation, warehousing and utilities 0 0 0 0<br />
Information 0 0 0 0<br />
Finance, insurance, real e<strong>st</strong>ate, rental & leasing<br />
Pr<strong>of</strong>essional, scientific, management,<br />
0 0 0 0<br />
admini<strong>st</strong>rative and wa<strong>st</strong>e management services 0 0 0 0<br />
Educational, health and social services<br />
Arts, entertainment, recreation, accommodation<br />
0 0 0 0<br />
and food services 0 0 0 0<br />
Other services, except public admini<strong>st</strong>ration 0 0<br />
Public admini<strong>st</strong>ration 0 0 0 0<br />
Total Employment (16 years and over) 0 0 0 0<br />
56 Issues and Opportunities Information
Table 1.16 continued<br />
Employment By Indu<strong>st</strong>ry – 1990 and 2000 – St. Croix County Municipal Units<br />
(yellow shading indicates combined categories)<br />
Village <strong>of</strong> Star Prairie<br />
1990 2000<br />
Number Percent Number Percent<br />
Agriculture, fore<strong>st</strong>ry, fishing, hunting & mining 12 5.2 6 2.1<br />
Con<strong>st</strong>ruction 23 10.0 43 15.3<br />
Manufacturing 88 38.4 93 33.1<br />
Wholesale trade 10 4.4 4 1.4<br />
Retail trade 38 16.6 31 11.0<br />
Transportation, warehousing and utilities 4 1.7 5 1.8<br />
Information 0 0 2 0.7<br />
Finance, insurance, real e<strong>st</strong>ate, rental & leasing<br />
Pr<strong>of</strong>essional, scientific, management,<br />
4 1.7 15 5.3<br />
admini<strong>st</strong>rative and wa<strong>st</strong>e management services 6 2.6 12 4.3<br />
Educational, health and social services<br />
Arts, entertainment, recreation, accommodation<br />
21 9.2 29 10.3<br />
and food services 16 7.0 16 5.7<br />
Other services, except public admini<strong>st</strong>ration 17 6.0<br />
Public admini<strong>st</strong>ration 7 3.1 8 2.8<br />
Total Employment (16 years and over) 229 100.0 281 100.0<br />
Village <strong>of</strong> Wilson<br />
Agriculture, fore<strong>st</strong>ry, fishing, hunting & mining 9 10.0 5 4.5<br />
Con<strong>st</strong>ruction 7 7.8 12 10.8<br />
Manufacturing 18 20.0 25 22.5<br />
Wholesale trade 2 2.2 3 2.7<br />
Retail trade 23 25.6 10 9.0<br />
Transportation, warehousing and utilities 4 4.4 7 6.3<br />
Information 5 5.6 3 2.7<br />
Finance, insurance, real e<strong>st</strong>ate, rental & leasing<br />
Pr<strong>of</strong>essional, scientific, management,<br />
4 4.4 5 4.5<br />
admini<strong>st</strong>rative and wa<strong>st</strong>e management services 8 8.9 0 0<br />
Educational, health and social services<br />
Arts, entertainment, recreation, accommodation<br />
8 8.9 16 14.4<br />
and food services 0 0 17 15.3<br />
Other services, except public admini<strong>st</strong>ration 6 5.4<br />
Public admini<strong>st</strong>ration 2 2.2 2 1.8<br />
Total Employment (16 years and over) 90 100.0 111 100.0<br />
St. Croix County Conditions and Trends Report 57
Table 1.16 continued<br />
Employment By Indu<strong>st</strong>ry – 1990 and 2000 – St. Croix County Municipal Units<br />
(yellow shading indicates combined categories)<br />
Village <strong>of</strong> Woodville<br />
1990 2000<br />
Number Percent Number Percent<br />
Agriculture, fore<strong>st</strong>ry, fishing, hunting & mining 4 1.0 0 0<br />
Con<strong>st</strong>ruction 31 7.7 59 10.8<br />
Manufacturing 134 33.3 156 28.5<br />
Wholesale trade 17 4.2 15 2.7<br />
Retail trade 63 15.7 64 11.7<br />
Transportation, warehousing and utilities 11 2.7 36 6.6<br />
Information 5 1.2 0 0<br />
Finance, insurance, real e<strong>st</strong>ate, rental & leasing<br />
Pr<strong>of</strong>essional, scientific, management,<br />
18 4.5 26 4.7<br />
admini<strong>st</strong>rative and wa<strong>st</strong>e management services 26 6.5 28 5.1<br />
Educational, health and social services<br />
Arts, entertainment, recreation, accommodation<br />
50 12.4 85 15.5<br />
and food services 28 7.0 24 4.4<br />
Other services, except public admini<strong>st</strong>ration 41 7.5<br />
Public admini<strong>st</strong>ration 15 3.7 14 2.6<br />
Total Employment (16 years and over) 402 100.0 548 100.0<br />
City <strong>of</strong> Glenwood<br />
Agriculture, fore<strong>st</strong>ry, fishing, hunting & mining 12 2.9 22 3.9<br />
Con<strong>st</strong>ruction 8 2.0 36 6.4<br />
Manufacturing 101 24.6 167 29.8<br />
Wholesale trade 14 3.4 10 1.8<br />
Retail trade 76 18.5 69 12.3<br />
Transportation, warehousing and utilities 17 4.1 44 7.8<br />
Information 1 0.2 7 1.2<br />
Finance, insurance, real e<strong>st</strong>ate, rental & leasing<br />
Pr<strong>of</strong>essional, scientific, management,<br />
23 5.6 23 4.1<br />
admini<strong>st</strong>rative and wa<strong>st</strong>e management services 31 7.6 8 1.4<br />
Educational, health and social services<br />
Arts, entertainment, recreation, accommodation<br />
87 21.2 109 19.4<br />
and food services 29 7.1 27 4.8<br />
Other services, except public admini<strong>st</strong>ration 27 4.8<br />
Public admini<strong>st</strong>ration 11 2.7 12 2.1<br />
Total Employment (16 years and over) 410 100.0 561 100.0<br />
58 Issues and Opportunities Information
Table 1.16 continued<br />
Employment By Indu<strong>st</strong>ry – 1990 and 2000 – St. Croix County Municipal Units<br />
(yellow shading indicates combined categories)<br />
City <strong>of</strong> Hudson<br />
1990 2000<br />
Number Percent Number Percent<br />
Agriculture, fore<strong>st</strong>ry, fishing, hunting & mining 29 0.9 26 0.6<br />
Con<strong>st</strong>ruction 150 4.4 250 5.3<br />
Manufacturing 774 23.0 831 17.7<br />
Wholesale trade 153 4.5 158 3.4<br />
Retail trade 625 18.5 535 11.4<br />
Transportation, warehousing and utilities 198 5.9 338 7.2<br />
Information 59 1.8 133 2.8<br />
Finance, insurance, real e<strong>st</strong>ate, rental & leasing<br />
Pr<strong>of</strong>essional, scientific, management,<br />
303 9.0 466 9.9<br />
admini<strong>st</strong>rative and wa<strong>st</strong>e management services 297 8.8 417 8.9<br />
Educational, health and social services<br />
Arts, entertainment, recreation, accommodation<br />
449 13.3 787 16.7<br />
and food services 195 5.8 374 8.0<br />
Other services, except public admini<strong>st</strong>ration 156 3.3<br />
Public admini<strong>st</strong>ration 139 4.1 229 4.9<br />
Total Employment (16 years and over) 3,371 100.0 4,700 100.0<br />
City <strong>of</strong> New Richmond<br />
Agriculture, fore<strong>st</strong>ry, fishing, hunting & mining 45 1.9 42 1.3<br />
Con<strong>st</strong>ruction 135 5.6 252 7.9<br />
Manufacturing 696 29.1 798 25.0<br />
Wholesale trade 47 2.0 87 2.7<br />
Retail trade 357 14.9 385 12.1<br />
Transportation, warehousing and utilities 43 1.8 170 5.3<br />
Information 45 1.9 42 1.3<br />
Finance, insurance, real e<strong>st</strong>ate, rental & leasing<br />
Pr<strong>of</strong>essional, scientific, management,<br />
121 5.1 218 6.8<br />
admini<strong>st</strong>rative and wa<strong>st</strong>e management services 200 8.4 166 5.2<br />
Educational, health and social services<br />
Arts, entertainment, recreation, accommodation<br />
485 20.3 649 20.4<br />
and food services 156 6.5 172 5.4<br />
Other services, except public admini<strong>st</strong>ration 117 3.7<br />
Public admini<strong>st</strong>ration 60 2.5 89 2.8<br />
Total Employment (16 years and over) 2,390 100.0 3,187 100.0<br />
City <strong>of</strong> River Falls**<br />
Agriculture, fore<strong>st</strong>ry, fishing, hunting & mining 15 2.0 42 1.3<br />
Con<strong>st</strong>ruction 33 4.5 252 7.9<br />
Manufacturing 199 30.0 798 25.0<br />
St. Croix County Conditions and Trends Report 59
1990 2000<br />
Number Percent Number Percent<br />
Wholesale trade 16 2.2 87 2.7<br />
385<br />
Retail trade 116 15.7 385 12.1<br />
Transportation, warehousing and utilities 24 3.3 170 5.3<br />
Information 14 1.9 42 1.3<br />
Finance, insurance, real e<strong>st</strong>ate, rental & leasing<br />
Pr<strong>of</strong>essional, scientific, management,<br />
81 11.0 218 6.8<br />
admini<strong>st</strong>rative and wa<strong>st</strong>e management services 36 4.9 166 5.2<br />
Educational, health and social services<br />
Arts, entertainment, recreation, accommodation<br />
155 21.0 649 20.4<br />
and food services 22 3.0 172 5.4<br />
Other services, except public admini<strong>st</strong>ration 117 3.7<br />
Public admini<strong>st</strong>ration 27 3.7 89 2.8<br />
Total Employment (16 years and over) 738 100.0 3,187 100.0<br />
St. Croix County<br />
Agriculture, fore<strong>st</strong>ry, fishing, hunting & mining 1,870 7.3 1,093 3.1<br />
Con<strong>st</strong>ruction 1,352 5.3 2,581 7.4<br />
Manufacturing 6,812 26.5 8,268 23.7<br />
Wholesale trade 838 3.3 837 2.4<br />
Retail trade 3,865 15.0 3,761 10.8<br />
Transportation, warehousing and utilities 1,235 4.8 2,131 6.1<br />
Information 412 1.6 610 1.7<br />
Finance, insurance, real e<strong>st</strong>ate, rental & leasing<br />
Pr<strong>of</strong>essional, scientific, management,<br />
1,667 6.5 2,471 7.1<br />
admini<strong>st</strong>rative and wa<strong>st</strong>e management services 1,608 6.3 2,357 6.8<br />
Educational, health and social services<br />
Arts, entertainment, recreation, accommodation<br />
3,771 14.7 6,125 17.5<br />
and food services 1,499 5.8 2,209 6.3<br />
Other services, except public admini<strong>st</strong>ration 1,345 3.9<br />
Public admini<strong>st</strong>ration 776 3.0 1,117 3.2<br />
Total Employment (16 years and over) 25,705 100.0 34,905 100.0<br />
source: U.S. Census<br />
60 Issues and Opportunities Information
Table 1.17<br />
Employment By Occupation – 1990 and 2000 – St. Croix County Municipal Units<br />
(yellow and green shading indicates combined categories)<br />
1990 2000<br />
Number Percent Number Percent<br />
Town <strong>of</strong> Baldwin<br />
Executive, admini<strong>st</strong>rative and managerial 38 7.7 161 30.3<br />
Pr<strong>of</strong>essional 33 6.7<br />
Technician 10 2.0<br />
Sales 38 7.7 126 23.7<br />
Admini<strong>st</strong>rative support, including clerical 68 13.8<br />
Service 57 11.6 50 9.4<br />
Farming, fore<strong>st</strong>ry, fishing 73 14.9 17 3.2<br />
Con<strong>st</strong>ruction, extraction and maintenance 65 12.2<br />
Precision production, craft and repair 82 16.7 112 21.1<br />
Machine operators, assemblers and inspectors 58 11.8<br />
Transportation and material moving 17 3.5<br />
Handlers, equipment cleaners, helpers & laborers 17 3.5<br />
Total Employment (16 years and over) 491 100.0 531 100.0<br />
Town <strong>of</strong> Cady<br />
Executive, admini<strong>st</strong>rative and managerial 22 6.7 117 28.5<br />
Pr<strong>of</strong>essional 23 7.0<br />
Technician 10 3.0<br />
Sales 26 7.9 72 17.5<br />
Admini<strong>st</strong>rative support, including clerical 29 8.8<br />
Service 38 11.6 44 10.7<br />
Farming, fore<strong>st</strong>ry, fishing 80 24.4 10 2.4<br />
Con<strong>st</strong>ruction, extraction and maintenance 60 14.6<br />
Precision production, craft and repair 28 8.5 108 26.3<br />
Machine operators, assemblers and inspectors 31 9.5<br />
Transportation and material moving 23 7.0<br />
Handlers, equipment cleaners, helpers & laborers 18 5.5<br />
Total Employment (16 years and over) 328 100.0 411 100.0<br />
Town <strong>of</strong> Cylon<br />
Executive, admini<strong>st</strong>rative and managerial 24 7.6 86 26.0<br />
Pr<strong>of</strong>essional 15 4.7<br />
Technician 2 0.6<br />
Sales 17 5.4 71 21.5<br />
Admini<strong>st</strong>rative support, including clerical 31 9.8<br />
Service 33 10.4 43 13.0<br />
Farming, fore<strong>st</strong>ry, fishing 67 21.1 10 3.0<br />
Con<strong>st</strong>ruction, extraction and maintenance 46 13.9<br />
Precision production, craft and repair 53 16.7 75 22.7<br />
Machine operators, assemblers and inspectors 42 13.2<br />
Transportation and material moving 12 3.8<br />
Handlers, equipment cleaners, helpers & laborers 21 6.6<br />
Total Employment (16 years and over) 317 100.0 331 100.0<br />
St. Croix County Conditions and Trends Report 61
Table 1.17 continued<br />
Employment By Occupation – 1990 and 2000 – St. Croix County Municipal Units<br />
(yellow and green shading indicates combined categories)<br />
1990 2000<br />
Number Percent Number Percent<br />
Town <strong>of</strong> Eau Galle<br />
Executive, admini<strong>st</strong>rative and managerial 26 7.6 174 33.6<br />
Pr<strong>of</strong>essional 29 8.4<br />
Technician 6 1.7<br />
Sales 31 9.0 93 18.0<br />
Admini<strong>st</strong>rative support, including clerical 39 11.3<br />
Service 22 6.4 67 12.9<br />
Farming, fore<strong>st</strong>ry, fishing 66 19.2 9 1.7<br />
Con<strong>st</strong>ruction, extraction and maintenance 64 12.4<br />
Precision production, craft and repair 42 12.2 111 21.4<br />
Machine operators, assemblers and inspectors 37 10.8<br />
Transportation and material moving 24 7.0<br />
Handlers, equipment cleaners, helpers & laborers 22 6.4<br />
Total Employment (16 years and over) 344 100.0 518 100.0<br />
Town <strong>of</strong> Emerald<br />
Executive, admini<strong>st</strong>rative and managerial 8 2.5 109 27.4<br />
Pr<strong>of</strong>essional 18 5.5<br />
Technician 7 2.1<br />
Sales 16 4.9 74 18.6<br />
Admini<strong>st</strong>rative support, including clerical 25 7.7<br />
Service 51 15.6 45 11.3<br />
Farming, fore<strong>st</strong>ry, fishing 80 24.5 15 3.8<br />
Con<strong>st</strong>ruction, extraction and maintenance 47 11.8<br />
Precision production, craft and repair 41 12.6 108 27.1<br />
Machine operators, assemblers and inspectors 45 13.8<br />
Transportation and material moving 25 7.7<br />
Handlers, equipment cleaners, helpers & laborers 10 3.1<br />
Total Employment (16 years and over) 326 100.0 398 100.0<br />
Town <strong>of</strong> Erin Prairie<br />
Executive, admini<strong>st</strong>rative and managerial 24 7.2 130 33.0<br />
Pr<strong>of</strong>essional 45 13.4<br />
Technician 12 3.6<br />
Sales 36 10.7 85 21.6<br />
Admini<strong>st</strong>rative support, including clerical 41 12.2<br />
Service 33 9.9 40 10.2<br />
Farming, fore<strong>st</strong>ry, fishing 49 14.6 14 3.6<br />
Con<strong>st</strong>ruction, extraction and maintenance 56 14.2<br />
Precision production, craft and repair 53 15.8 69 17.5<br />
Machine operators, assemblers and inspectors 30 9.0<br />
Transportation and material moving 10 3.0<br />
Handlers, equipment cleaners, helpers & laborers 2 0.6<br />
Total Employment (16 years and over) 335 100.0 394 100.0<br />
62 Issues and Opportunities Information
Table 1.17 continued<br />
Employment By Occupation – 1990 and 2000 – St. Croix County Municipal Units<br />
(yellow and green shading indicates combined categories)<br />
1990 2000<br />
Number Percent Number Percent<br />
Town <strong>of</strong> Fore<strong>st</strong><br />
Executive, admini<strong>st</strong>rative and managerial 14 4.6 109 32.8<br />
Pr<strong>of</strong>essional 29 9.6<br />
Technician 2 0.7<br />
Sales 12 4.0 42 12.7<br />
Admini<strong>st</strong>rative support, including clerical 27 8.9<br />
Service 26 8.6 37 11.1<br />
Farming, fore<strong>st</strong>ry, fishing 135 44.6 28 8.4<br />
Con<strong>st</strong>ruction, extraction and maintenance 34 10.2<br />
Precision production, craft and repair 23 7.6 82 24.7<br />
Machine operators, assemblers and inspectors 17 5.6<br />
Transportation and material moving 12 4.0<br />
Handlers, equipment cleaners, helpers & laborers 6 2.0<br />
Total Employment (16 years and over) 303 100.0 332 100.0<br />
Town <strong>of</strong> Glenwood<br />
Executive, admini<strong>st</strong>rative and managerial 8 2.3 105 27.9<br />
Pr<strong>of</strong>essional 18 5.2<br />
Technician 10 2.9<br />
Sales 21 6.0 88 23.3<br />
Admini<strong>st</strong>rative support, including clerical 51 14.6<br />
Service 49 14.0 47 12.5<br />
Farming, fore<strong>st</strong>ry, fishing 101 28.9 15 4.0<br />
Con<strong>st</strong>ruction, extraction and maintenance 27 7.2<br />
Precision production, craft and repair 34 9.7 95 25.2<br />
Machine operators, assemblers and inspectors 28 8.0<br />
Transportation and material moving 17 4.9<br />
Handlers, equipment cleaners, helpers & laborers 12 3.4<br />
Total Employment (16 years and over) 349 100.0 377 100.0<br />
Town <strong>of</strong> Hammond<br />
Executive, admini<strong>st</strong>rative and managerial 43 9.2 193 35.0<br />
Pr<strong>of</strong>essional 48 10.3<br />
Technician 15 3.2<br />
Sales 39 8.4 117 21.2<br />
Admini<strong>st</strong>rative support, including clerical 64 13.7<br />
Service 59 12.7 57 10.3<br />
Farming, fore<strong>st</strong>ry, fishing 76 16.3 15 2.7<br />
Con<strong>st</strong>ruction, extraction and maintenance 53 9.6<br />
Precision production, craft and repair 50 10.7 117 21.2<br />
Machine operators, assemblers and inspectors 27 5.8<br />
Transportation and material moving 34 7.3<br />
Handlers, equipment cleaners, helpers & laborers 11 2.4<br />
Total Employment (16 years and over) 466 100.0 552 100.0<br />
St. Croix County Conditions and Trends Report 63
Table 1.17 continued<br />
Employment By Occupation – 1990 and 2000 – St. Croix County Municipal Units<br />
(yellow and green shading indicates combined categories)<br />
1990 2000<br />
Number Percent Number Percent<br />
Town <strong>of</strong> Hudson<br />
Executive, admini<strong>st</strong>rative and managerial 355 17.9 1,519 41.0<br />
Pr<strong>of</strong>essional 270 13.6<br />
Technician 89 4.5<br />
Sales 272 13.7 1,019 27.5<br />
Admini<strong>st</strong>rative support, including clerical 319 16.1<br />
Service 173 8.7 324 8.7<br />
Farming, fore<strong>st</strong>ry, fishing 24 1.2 0 0<br />
Con<strong>st</strong>ruction, extraction and maintenance 301 8.1<br />
Precision production, craft and repair 205 10.3 546 14.7<br />
Machine operators, assemblers and inspectors 154 7.8<br />
Transportation and material moving 72 3.6<br />
Handlers, equipment cleaners, helpers & laborers 51 2.6<br />
Total Employment (16 years and over) 1,984 100.0 3,709 100.0<br />
Town <strong>of</strong> Kinnickinnic<br />
Executive, admini<strong>st</strong>rative and managerial 72 12.8 275 35.7<br />
Pr<strong>of</strong>essional 93 16.5<br />
Technician 25 4.4<br />
Sales 58 10.3 184 23.9<br />
Admini<strong>st</strong>rative support, including clerical 69 12.2<br />
Service 59 10.5 77 10.0<br />
Farming, fore<strong>st</strong>ry, fishing 59 10.5 4 0.5<br />
Con<strong>st</strong>ruction, extraction and maintenance 88 11.4<br />
Precision production, craft and repair 52 9.2 143 18.5<br />
Machine operators, assemblers and inspectors 44 7.8<br />
Transportation and material moving 15 2.7<br />
Handlers, equipment cleaners, helpers & laborers 18 3.2<br />
Total Employment (16 years and over) 564 100.0 771 100.0<br />
Town <strong>of</strong> Pleasant Valley<br />
Executive, admini<strong>st</strong>rative and managerial 13 6.7 107 47.8<br />
Pr<strong>of</strong>essional 21 10.9<br />
Technician 9 4.7<br />
Sales 6 3.1 30 13.4<br />
Admini<strong>st</strong>rative support, including clerical 32 16.6<br />
Service 23 11.9 25 11.2<br />
Farming, fore<strong>st</strong>ry, fishing 51 26.4 14 6.3<br />
Con<strong>st</strong>ruction, extraction and maintenance 20 8.9<br />
Precision production, craft and repair 17 8.8 28 12.5<br />
Machine operators, assemblers and inspectors 12 6.2<br />
Transportation and material moving 2 1.0<br />
Handlers, equipment cleaners, helpers & laborers 7 3.6<br />
Total Employment (16 years and over) 193 100.0 224 100.0<br />
64 Issues and Opportunities Information
Table 1.17 continued<br />
Employment By Occupation – 1990 and 2000 – St. Croix County Municipal Units<br />
(yellow and green shading indicates combined categories)<br />
1990 2000<br />
Number Percent Number Percent<br />
Town <strong>of</strong> Richmond<br />
Executive, admini<strong>st</strong>rative and managerial 67 8.5 278 31.1<br />
Pr<strong>of</strong>essional 84 10.7<br />
Technician 16 2.0<br />
Sales 72 9.2 217 24.2<br />
Admini<strong>st</strong>rative support, including clerical 89 11.3<br />
Service 99 12.6 96 10.7<br />
Farming, fore<strong>st</strong>ry, fishing 82 10.4 25 2.8<br />
Con<strong>st</strong>ruction, extraction and maintenance 100 11.2<br />
Precision production, craft and repair 96 12.2 179 20.0<br />
Machine operators, assemblers and inspectors 96 12.2<br />
Transportation and material moving 41 5.2<br />
Handlers, equipment cleaners, helpers & laborers 43 5.5<br />
Total Employment (16 years and over) 785 100.0 895 100.0<br />
Town <strong>of</strong> Rush River<br />
Executive, admini<strong>st</strong>rative and managerial 31 14.3 86 29.0<br />
Pr<strong>of</strong>essional 10 4.6<br />
Technician 8 3.7<br />
Sales 12 5.5 73 24.6<br />
Admini<strong>st</strong>rative support, including clerical 23 10.6<br />
Service 27 12.4 42 14.1<br />
Farming, fore<strong>st</strong>ry, fishing 46 21.2 10 3.4<br />
Con<strong>st</strong>ruction, extraction and maintenance 22 7.4<br />
Precision production, craft and repair 21 9.7 64 21.5<br />
Machine operators, assemblers and inspectors 16 7.4<br />
Transportation and material moving 13 6.0<br />
Handlers, equipment cleaners, helpers & laborers 10 4.6<br />
Total Employment (16 years and over) 217 100.0 297 100.0<br />
Town <strong>of</strong> St. Joseph/Houlton<br />
Executive, admini<strong>st</strong>rative and managerial 191 13.1 763 39.8<br />
Pr<strong>of</strong>essional 225 15.4<br />
Technician 50 3.4<br />
Sales 144 9.9 485 25.3<br />
Admini<strong>st</strong>rative support, including clerical 196 13.4<br />
Service 176 12.1 186 9.7<br />
Farming, fore<strong>st</strong>ry, fishing 61 4.2 0 0<br />
Con<strong>st</strong>ruction, extraction and maintenance 214 11.2<br />
Precision production, craft and repair 212 14.5 270 14.1<br />
Machine operators, assemblers and inspectors 119 8.2<br />
Transportation and material moving 44 3.0<br />
Handlers, equipment cleaners, helpers & laborers 41 2.8<br />
Total Employment (16 years and over) 1,459 100.0 1,918 100.0<br />
St. Croix County Conditions and Trends Report 65
Table 1.17 continued<br />
Employment By Occupation – 1990 and 2000 – St. Croix County Municipal Units<br />
(yellow and green shading indicates combined categories)<br />
1990 2000<br />
Number Percent Number Percent<br />
Town <strong>of</strong> Somerset<br />
Executive, admini<strong>st</strong>rative and managerial 99 9.7 543 35.3<br />
Pr<strong>of</strong>essional 99 9.7<br />
Technician 25 2.4<br />
Sales 67 6.6 354 23.0<br />
Admini<strong>st</strong>rative support, including clerical 144 14.1<br />
Service 144 14.1 123 8.0<br />
Farming, fore<strong>st</strong>ry, fishing 27 2.6 14 0.9<br />
Con<strong>st</strong>ruction, extraction and maintenance 196 12.7<br />
Precision production, craft and repair 170 16.6 310 20.1<br />
Machine operators, assemblers and inspectors 132 12.9<br />
Transportation and material moving 64 6.3<br />
Handlers, equipment cleaners, helpers & laborers 51 5.0<br />
Total Employment (16 years and over) 1,022 100.0 1,540 100.0<br />
Town <strong>of</strong> Springfield<br />
Executive, admini<strong>st</strong>rative and managerial 15 4.0 117 26.0<br />
Pr<strong>of</strong>essional 33 8.8<br />
Technician 10 2.7<br />
Sales 16 4.3 95 21.1<br />
Admini<strong>st</strong>rative support, including clerical 43 11.5<br />
Service 31 8.3 46 10.2<br />
Farming, fore<strong>st</strong>ry, fishing 91 24.4 20 4.4<br />
Con<strong>st</strong>ruction, extraction and maintenance 39 8.7<br />
Precision production, craft and repair 56 15.0 133 29.6<br />
Machine operators, assemblers and inspectors 40 10.7<br />
Transportation and material moving 23 6.2<br />
Handlers, equipment cleaners, helpers & laborers 15 4.0<br />
Total Employment (16 years and over) 373 100.0 450 100.0<br />
Town <strong>of</strong> Stanton<br />
Executive, admini<strong>st</strong>rative and managerial 36 6.5 152 25.7<br />
Pr<strong>of</strong>essional 42 7.6<br />
Technician 9 1.6<br />
Sales 72 13.0 148 25.0<br />
Admini<strong>st</strong>rative support, including clerical 70 12.6<br />
Service 74 13.4 54 9.1<br />
Farming, fore<strong>st</strong>ry, fishing 109 19.7 2 0.3<br />
Con<strong>st</strong>ruction, extraction and maintenance 66 11.2<br />
Precision production, craft and repair 62 11.2 169 28.6<br />
Machine operators, assemblers and inspectors 42 7.6<br />
Transportation and material moving 10 1.8<br />
Handlers, equipment cleaners, helpers & laborers 28 5.1<br />
Total Employment (16 years and over) 554 100.0 591 100.0<br />
66 Issues and Opportunities Information
Table 1.17 continued<br />
Employment By Occupation – 1990 and 2000 – St. Croix County Municipal Units<br />
(yellow and green shading indicates combined categories)<br />
1990 2000<br />
Number Percent Number Percent<br />
Town <strong>of</strong> Star Prairie<br />
Executive, admini<strong>st</strong>rative and managerial 77 8.1 378 23.7<br />
Pr<strong>of</strong>essional 104 11.0<br />
Technician 35 3.7<br />
Sales 83 8.7 408 25.6<br />
Admini<strong>st</strong>rative support, including clerical 103 10.9<br />
Service 126 13.3 232 14.6<br />
Farming, fore<strong>st</strong>ry, fishing 48 5.1 11 0.7<br />
Con<strong>st</strong>ruction, extraction and maintenance 211 13.3<br />
Precision production, craft and repair 152 16.0 352 22.1<br />
Machine operators, assemblers and inspectors 134 14.1<br />
Transportation and material moving 35 3.7<br />
Handlers, equipment cleaners, helpers & laborers 52 5.5<br />
Total Employment (16 years and over) 949 100.0 1,592 100.0<br />
Town <strong>of</strong> Troy<br />
Executive, admini<strong>st</strong>rative and managerial 190 10.7 937 45.3<br />
Pr<strong>of</strong>essional 372 21.1<br />
Technician 88 5.0<br />
Sales 233 13.1 479 23.2<br />
Admini<strong>st</strong>rative support, including clerical 226 12.7<br />
Service 148 8.3 206 10.0<br />
Farming, fore<strong>st</strong>ry, fishing 111 6.2 11 0.5<br />
Con<strong>st</strong>ruction, extraction and maintenance 177 8.6<br />
Precision production, craft and repair 142 8.0 258 12.5<br />
Machine operators, assemblers and inspectors 102 5.7<br />
Transportation and material moving 99 5.6<br />
Handlers, equipment cleaners, helpers & laborers 66 3.7<br />
Total Employment (16 years and over) 1,777 100.0 2,068 100.0<br />
Town <strong>of</strong> Warren<br />
Executive, admini<strong>st</strong>rative and managerial 39 7.1 270 35.0<br />
Pr<strong>of</strong>essional 57 10.4<br />
Technician 28 5.1<br />
Sales 53 9.7 193 25.0<br />
Admini<strong>st</strong>rative support, including clerical 80 14.6<br />
Service 66 12.0 80 10.4<br />
Farming, fore<strong>st</strong>ry, fishing 69 12.6 11 1.4<br />
Con<strong>st</strong>ruction, extraction and maintenance 67 8.7<br />
Precision production, craft and repair 71 12.9 151 19.6<br />
Machine operators, assemblers and inspectors 44 8.0<br />
Transportation and material moving 14 2.6<br />
Handlers, equipment cleaners, helpers & laborers 28 5.1<br />
Total Employment (16 years and over) 549 100.0 772 100.0<br />
St. Croix County Conditions and Trends Report 67
Table 1.17 continued<br />
Employment By Occupation – 1990 and 2000 – St. Croix County Municipal Units<br />
(yellow and green shading indicates combined categories)<br />
1990 2000<br />
Number Percent Number Percent<br />
Village <strong>of</strong> Baldwin<br />
Executive, admini<strong>st</strong>rative and managerial 60 6.3 382 27.1<br />
Pr<strong>of</strong>essional 95 10.0<br />
Technician 25 2.6<br />
Sales 61 6.4 368 26.2<br />
Admini<strong>st</strong>rative support, including clerical 138 14.6<br />
Service 174 18.4 227 16.1<br />
Farming, fore<strong>st</strong>ry, fishing 23 2.4 21 1.5<br />
Con<strong>st</strong>ruction, extraction and maintenance 143 10.2<br />
Precision production, craft and repair 90 9.5 266 18.9<br />
Machine operators, assemblers and inspectors 143 15.1<br />
Transportation and material moving 79 8.3<br />
Handlers, equipment cleaners, helpers & laborers 59 6.2<br />
Total Employment (16 years and over) 947 100.0 1,407 100.0<br />
Village <strong>of</strong> Deer Park<br />
Executive, admini<strong>st</strong>rative and managerial 9 10.1 28 18.3<br />
Pr<strong>of</strong>essional 6 6.7<br />
Technician 3 3.4<br />
Sales 2 2.2 37 24.2<br />
Admini<strong>st</strong>rative support, including clerical 21 23.6<br />
Service 13 14.6 26 17.0<br />
Farming, fore<strong>st</strong>ry, fishing 0 0 1 0.7<br />
Con<strong>st</strong>ruction, extraction and maintenance 10 6.5<br />
Precision production, craft and repair 14 15.7 51 33.3<br />
Machine operators, assemblers and inspectors 15 16.9<br />
Transportation and material moving 4 15.7<br />
Handlers, equipment cleaners, helpers & laborers 2 2.2<br />
Total Employment (16 years and over) 89 100.0 153 100.0<br />
Village <strong>of</strong> Hammond<br />
Executive, admini<strong>st</strong>rative and managerial 51 9.9 151 23.8<br />
Pr<strong>of</strong>essional 62 12.0<br />
Technician 17 3.3<br />
Sales 32 6.2 182 28.7<br />
Admini<strong>st</strong>rative support, including clerical 77 15.0<br />
Service 89 17.3 123 19.4<br />
Farming, fore<strong>st</strong>ry, fishing 6 1.2 0 0<br />
Con<strong>st</strong>ruction, extraction and maintenance 73 11.5<br />
Precision production, craft and repair 64 12.4 106 16.7<br />
Machine operators, assemblers and inspectors 56 10.9<br />
Transportation and material moving 28 5.4<br />
Handlers, equipment cleaners, helpers & laborers 33 6.4<br />
Total Employment (16 years and over) 515 100.0 635 100.0<br />
68 Issues and Opportunities Information
Table 1.17 continued<br />
Employment By Occupation – 1990 and 2000 – St. Croix County Municipal Units<br />
(yellow and green shading indicates combined categories)<br />
1990 2000<br />
Number Percent Number Percent<br />
Village <strong>of</strong> North Hudson<br />
Executive, admini<strong>st</strong>rative and managerial 164 9.5 801 38.9<br />
Pr<strong>of</strong>essional 327 18.9<br />
Technician 106 6.1<br />
Sales 168 9.7 486 23.6<br />
Admini<strong>st</strong>rative support, including clerical 369 21.3<br />
Service 159 9.2 377 18.3<br />
Farming, fore<strong>st</strong>ry, fishing 23 1.3 0 0<br />
Con<strong>st</strong>ruction, extraction and maintenance 134 6.5<br />
Precision production, craft and repair 219 12.6 261 12.7<br />
Machine operators, assemblers and inspectors 115 6.6<br />
Transportation and material moving 33 1.9<br />
Handlers, equipment cleaners, helpers & laborers 49 2.8<br />
Total Employment (16 years and over) 1,732 100.0 2,059 100.0<br />
Village <strong>of</strong> Roberts<br />
Executive, admini<strong>st</strong>rative and managerial 48 8.9 98 16.8<br />
Pr<strong>of</strong>essional 34 6.3<br />
Technician 22 4.1<br />
Sales 44 8.2 156 26.8<br />
Admini<strong>st</strong>rative support, including clerical 115 21.4<br />
Service 58 10.8 90 15.4<br />
Farming, fore<strong>st</strong>ry, fishing 4 0.7 0 0<br />
Con<strong>st</strong>ruction, extraction and maintenance 68 11.7<br />
Precision production, craft and repair 78 14.5 171 29.3<br />
Machine operators, assemblers and inspectors 73 13.6<br />
Transportation and material moving 23 4.3<br />
Handlers, equipment cleaners, helpers & laborers 39 7.2<br />
Total Employment (16 years and over) 538 100.0 583 100.0<br />
Village <strong>of</strong> Somerset<br />
Executive, admini<strong>st</strong>rative and managerial 52 9.2 167 21.1<br />
Pr<strong>of</strong>essional 68 12.0<br />
Technician 18 3.2<br />
Sales 65 11.4 211 26.7<br />
Admini<strong>st</strong>rative support, including clerical 79 13.9<br />
Service 87 15.3 113 14.3<br />
Farming, fore<strong>st</strong>ry, fishing 7 1.2 0 0<br />
Con<strong>st</strong>ruction, extraction and maintenance 103 13.0<br />
Precision production, craft and repair 76 13.4 196 24.8<br />
Machine operators, assemblers and inspectors 60 10.6<br />
Transportation and material moving 39 6.9<br />
Handlers, equipment cleaners, helpers & laborers 17 3.0<br />
Total Employment (16 years and over) 568 100.0 79 100.0<br />
St. Croix County Conditions and Trends Report 69
Table 1.17 continued<br />
Employment By Occupation – 1990 and 2000 – St. Croix County Municipal Units<br />
(yellow and green shading indicates combined categories)<br />
1990 2000<br />
Number Percent Number Percent<br />
Village <strong>of</strong> Spring Valley (St. Croix County only)<br />
Executive, admini<strong>st</strong>rative and managerial 0 0 0 0<br />
Pr<strong>of</strong>essional 0 0<br />
Technician 0 0<br />
Sales 0 0 0 0<br />
Admini<strong>st</strong>rative support, including clerical 0 0<br />
Service 0 0 0 0<br />
Farming, fore<strong>st</strong>ry, fishing 0 0 0 0<br />
Con<strong>st</strong>ruction, extraction and maintenance 0 0<br />
Precision production, craft and repair 0 0 0 0<br />
Machine operators, assemblers and inspectors 0 0<br />
Transportation and material moving 0 0<br />
Handlers, equipment cleaners, helpers & laborers 0 0<br />
Total Employment (16 years and over) 0 0 0 0<br />
Village <strong>of</strong> Star Prairie<br />
Executive, admini<strong>st</strong>rative and managerial 15 6.6 61 21.7<br />
Pr<strong>of</strong>essional 13 5.7<br />
Technician 12 5.2<br />
Sales 22 9.6 66 23.5<br />
Admini<strong>st</strong>rative support, including clerical 33 14.4<br />
Service 34 14.8 33 11.7<br />
Farming, fore<strong>st</strong>ry, fishing 3 1.3 0 0<br />
Con<strong>st</strong>ruction, extraction and maintenance 58 20.6<br />
Precision production, craft and repair 44 19.2 63 22.4<br />
Machine operators, assemblers and inspectors 36 15.7<br />
Transportation and material moving 4 1.7<br />
Handlers, equipment cleaners, helpers & laborers 13 5.7<br />
Total Employment (16 years and over) 229 100.0 281 100.0<br />
Village <strong>of</strong> Wilson<br />
Executive, admini<strong>st</strong>rative and managerial 8 8.9 16 14.4<br />
Pr<strong>of</strong>essional 5 5.6<br />
Technician 2 2.2<br />
Sales 13 14.4 6 5.4<br />
Admini<strong>st</strong>rative support, including clerical 6 6.7<br />
Service 12 13.3 34 30.6<br />
Farming, fore<strong>st</strong>ry, fishing 9 10.0 2 1.8<br />
Con<strong>st</strong>ruction, extraction and maintenance 19 17.1<br />
Precision production, craft and repair 9 10.0 34 30.6<br />
Machine operators, assemblers and inspectors 7 7.8<br />
Transportation and material moving 11 12.2<br />
Handlers, equipment cleaners, helpers & laborers 8 8.9<br />
Total Employment (16 years and over) 90 100.0 111 100.0<br />
70 Issues and Opportunities Information
Table 1.17 continued<br />
Employment By Occupation – 1990 and 2000 – St. Croix County Municipal Units<br />
(yellow and green shading indicates combined categories)<br />
1990 2000<br />
Number Percent Number Percent<br />
Village <strong>of</strong> Woodville<br />
Executive, admini<strong>st</strong>rative and managerial 30 7.5 129 23.5<br />
Pr<strong>of</strong>essional 26 6.5<br />
Technician 10 2.5<br />
Sales 44 10.9 120 21.9<br />
Admini<strong>st</strong>rative support, including clerical 45 11.2<br />
Service 60 14.9 79 14.4<br />
Farming, fore<strong>st</strong>ry, fishing 3 0.7 0 0<br />
Con<strong>st</strong>ruction, extraction and maintenance 75 13.7<br />
Precision production, craft and repair 67 16.7 145 26.5<br />
Machine operators, assemblers and inspectors 68 16.9<br />
Transportation and material moving 21 5.2<br />
Handlers, equipment cleaners, helpers & laborers 28 7.0<br />
Total Employment (16 years and over) 402 100.0 548 100.0<br />
City <strong>of</strong> Glenwood<br />
Executive, admini<strong>st</strong>rative and managerial 22 5.4 126 22.5<br />
Pr<strong>of</strong>essional 60 14.6<br />
Technician 10 2.4<br />
Sales 38 9.3 102 18.2<br />
Admini<strong>st</strong>rative support, including clerical 51 12.4<br />
Service 84 20.5 74 13.2<br />
Farming, fore<strong>st</strong>ry, fishing 9 2.2 11 2.0<br />
Con<strong>st</strong>ruction, extraction and maintenance 58 10.3<br />
Precision production, craft and repair 41 10.0 190 33.9<br />
Machine operators, assemblers and inspectors 42 10.2<br />
Transportation and material moving 33 8.0<br />
Handlers, equipment cleaners, helpers & laborers 20 4.9<br />
Total Employment (16 years and over) 410 100.0 561 100.0<br />
City <strong>of</strong> Hudson<br />
Executive, admini<strong>st</strong>rative and managerial 493 14.6 1,953 41.6<br />
Pr<strong>of</strong>essional 471 14.0<br />
Technician 113 3.4<br />
Sales 548 16.3 1,254 26.7<br />
Admini<strong>st</strong>rative support, including clerical 611 18.1<br />
Service 437 13.0 624 13.3<br />
Farming, fore<strong>st</strong>ry, fishing 11 0.3 0 0<br />
Con<strong>st</strong>ruction, extraction and maintenance 333 7.1<br />
Precision production, craft and repair 278 8.2 536 11.4<br />
Machine operators, assemblers and inspectors 195 5.8<br />
Transportation and material moving 86 2.6<br />
Handlers, equipment cleaners, helpers & laborers 128 3.8<br />
Total Employment (16 years and over) 3,371 100.0 4,700 100.0<br />
St. Croix County Conditions and Trends Report 71
City <strong>of</strong> New Richmond<br />
Executive, admini<strong>st</strong>rative and managerial 255 10.7 779 32.4<br />
Pr<strong>of</strong>essional 375 15.7<br />
Technician 86 3.6<br />
Sales 208 8.7 832 28.3<br />
Admini<strong>st</strong>rative support, including clerical 384 16.1<br />
Service 321 13.4 463 18.8<br />
Farming, fore<strong>st</strong>ry, fishing 36 1.5 20 1.1<br />
Con<strong>st</strong>ruction, extraction and maintenance 364 6.0<br />
Precision production, craft and repair 311 13.0 729 13.5<br />
Machine operators, assemblers and inspectors 284 11.9<br />
Transportation and material moving 46 1.9<br />
Handlers, equipment cleaners, helpers & laborers 84 3.5<br />
Total Employment (16 years and over) 2,390 100.0 3,187 100.0<br />
City <strong>of</strong> River Falls<br />
Executive, admini<strong>st</strong>rative and managerial 128 17.3 2,520 32.4<br />
Pr<strong>of</strong>essional 73 9.9<br />
Technician 28 3.8<br />
Sales 55 7.5 2,200 28.3<br />
Admini<strong>st</strong>rative support, including clerical 117 15.9<br />
Service 108 14.6 1,458 18.8<br />
Farming, fore<strong>st</strong>ry, fishing 7 0.9 82 1.1<br />
Con<strong>st</strong>ruction, extraction and maintenance 463 6.0<br />
Precision production, craft and repair 113 15.3 1,051 13.5<br />
Machine operators, assemblers and inspectors 67 9.1<br />
Transportation and material moving 24 3.3<br />
Handlers, equipment cleaners, helpers & laborers 18 2.4<br />
Total Employment (16 years and over) 738 100.0 7,774 100.0<br />
St. Croix County<br />
Executive, admini<strong>st</strong>rative and managerial 2,727 10.6 11,744 33.6<br />
Pr<strong>of</strong>essional 3,283 12.8<br />
Technician 918 3.6<br />
Sales 2,624 10.2 8,521 24.4<br />
Admini<strong>st</strong>rative support, including clerical 3,815 14.9<br />
Service 3,150 12.3 4,378 12.5<br />
Farming, fore<strong>st</strong>ry, fishing 1,646 6.4 321 0.9<br />
Con<strong>st</strong>ruction, extraction and maintenance 3,509 10.1<br />
Precision production, craft and repair 3,066 11.9 6,432 18.4<br />
Machine operators, assemblers and inspectors 2,411 9.4<br />
Transportation and material moving 1,037 4.0<br />
Handlers, equipment cleaners, helpers & laborers 1,028 4.0<br />
Total Employment (16 years and over) 25,705 100.0 34,905 100.0<br />
72 Issues and Opportunities Information
Table 1.18<br />
Travel Time to Work – 1990 and 2000 – St. Croix County<br />
1990 2000<br />
Number Percent Number Percent<br />
Worked at home 1,892 7.5 1,625 4.7<br />
Less than 5 minutes 1,580 6.2 1,517 4.4<br />
5 to 9 minutes 3,942 15.6 4,584 13.3<br />
10 to 19 minutes 5,764 22.8 8,037 23.3<br />
20 to 29 minutes 4,093 16.2 5,696 16.5<br />
30 to 44 minutes 4,657 18.4 6,735 19.6<br />
45 to 59 minutes 2,185 8.6 3,765 10.9<br />
60 minutes or longer 1,213 4.8 2,469 7.2<br />
TOTAL 25,326 100.0 34,428 100.0<br />
source: U.S. Census<br />
Table 1.19<br />
Place <strong>of</strong> Work – 2000 – St. Croix County Residents<br />
2000<br />
Number Percent<br />
Village <strong>of</strong> Baldwin 1,159 3.2<br />
Village <strong>of</strong> Hammond 471 1.3<br />
Village <strong>of</strong> North Hudson 253 0.7<br />
Village <strong>of</strong> Roberts 264 0.7<br />
Village <strong>of</strong> Somerset 684 1.9<br />
Village <strong>of</strong> Woodville 598 1.7<br />
City <strong>of</strong> Glenwood 421 1.2<br />
City <strong>of</strong> Hudson 4,303 12.0<br />
City <strong>of</strong> New Richmond 3,207 9.0<br />
City <strong>of</strong> River Falls (St. Croix<br />
County portion) 820 2.3<br />
Elsewhere in St. Croix County 4,579 12.8<br />
Barron County 90 0.3<br />
Dunn County 304 0.8<br />
Pierce County 2,289 6.4<br />
Polk County 662 1.8<br />
Other Wisconsin Counties 274 0.8<br />
Seven County St. Paul/Mpls.<br />
Metro Area 14,989 41.9<br />
Other Minnesota Counties 341 1.0<br />
States other than Wisconsin or<br />
Minnesota 104 0.3<br />
TOTAL 35,812 100.0<br />
source: U.S. Census<br />
St. Croix County Conditions and Trends Report 73
Table 1.20<br />
Households by Household Income – 1989 and 1999 – St. Croix County<br />
Household<br />
Income<br />
Number <strong>of</strong><br />
Households<br />
1989 1999<br />
% <strong>of</strong> Total<br />
Households<br />
Number <strong>of</strong><br />
Households<br />
% <strong>of</strong> Total<br />
Households<br />
Number<br />
Change<br />
Percent<br />
Change<br />
Less than $10,000 1,652 9.4 940 4.0 -712 -43.1<br />
$10,000 to $14,999 1,121 6.4 971 4.1 -150 -13.4<br />
$15,000 to $24,999 2,652 15.0 2,026 8.6 -626 -23.6<br />
$25,000 to $34,999 2,851 16.2 2,213 9.4 -638 -22.4<br />
$35,000 to $49,999 3,769 21.4 4,125 17.6 356 9.5<br />
$50,000 to $74,999 3,790 21.5 5,810 24.8 2,020 53.3<br />
$75,000 or greater 1,788 10.1 7,343 31.3 5,555 310.7<br />
TOTAL 17,623 100 23,428 100 5,805 32.9<br />
source: U.S. Census<br />
Table 1.21<br />
Median Household Income – 1989 and 1999 – St. Croix and Surrounding Wisconsin<br />
Counties<br />
Change<br />
County 1989 1999 Number Percent<br />
Barron County $22,570 $37,275 14,705 65.2<br />
Dunn County 24,452 38,753 14,301 58.5<br />
Pierce County 30,520 49,551 19,031 62.4<br />
Polk County 24,267 41,183 16,916 69.7<br />
St. Croix County 36,716 54,930 18,214 49.6<br />
source: U.S. Census<br />
74 Issues and Opportunities Information
Table 1.22<br />
Median Household Income – 1989 and 1999 – St. Croix County<br />
Towns<br />
Dollars Change<br />
1989 1999 Dollars Percent<br />
Baldwin $37,500 $40,313 $2,813 7.5<br />
Cady 26,477 53,250 26,773 101.1<br />
Cylon 36,071 56,250 20,179 55.9<br />
Eau Galle 26,944 47,500 20,556 76.3<br />
Emerald 38,889 65,938 27,049 69.6<br />
Erin Prairie 27,937 50,833 22,896 82.0<br />
Fore<strong>st</strong> 23,125 47,222 24,097 104.2<br />
Glenwood 36,250 45,789 9,539 26.3<br />
Hammond 55,509 81,733 26,224 47.2<br />
Hudson 43,750 62,727 18,977 43.4<br />
Kinnickinnic 40,000 58,750 18,750 46.9<br />
Pleasant Valley 39,261 59,688 20,427 52.0<br />
Richmond 38,409 58,333 19,924 51.9<br />
Rush River 52,021 81,277 29,256 56.2<br />
St. Joseph/Houlton 42,798 45,194 2,396 5.6<br />
Somerset 27,054 54,886 27,832 102.9<br />
Springfield 36,250 52,604 16,354 45.1<br />
Stanton 35,603 48,750 13,147 36.9<br />
Star Prairie 44,718 73,125 28,407 63.5<br />
Troy 44,861 68,452 23,591 52.6<br />
Warren 37,500 40,313 2,813 7.5<br />
Villages<br />
Baldwin 27,143 52,188 25,045 92.3<br />
Deer Park 22,000 51,000 29,000 131.8<br />
Hammond 30,114 53,438 23,324 77.5<br />
North Hudson 44,595 60,848 16,253 36.4<br />
Roberts 30,750 42,258 11,508 37.4<br />
Somerset 29,032 62,063 33,031 113.8<br />
Spring Valley* - - - -<br />
Star Prairie 28,125 53,468 25,343 90.1<br />
Wilson 24,063 35,893 11,830 49.2<br />
Woodville 23,906 38,828 14,922 62.4<br />
Cities<br />
Glenwood City 22,670 36,964 14,294 63.1<br />
Hudson 38,037 50,991 12,954 34.1<br />
New Richmond 30,330 43,475 13,145 43.3<br />
River Falls* 33,239 38,576 5,337 16.1<br />
St. Croix County 36,716 54,930 18,214 49.6<br />
State <strong>of</strong> Wisconsin 29,442 43,791 14,349 47.1<br />
source: U.S. Census.<br />
*Portions <strong>of</strong> Spring Valley and River Falls located in St. Croix County only.<br />
St. Croix County Conditions and Trends Report 75
76 Issues and Opportunities Information
2. HOUSING INFORMATION<br />
Element Context<br />
This section contains an inventory and analysis <strong>of</strong> housing characteri<strong>st</strong>ics in St. Croix<br />
County. Quality housing is an essential component to healthy and vibrant communities,<br />
and <strong>st</strong>riving to provide safe and co<strong>st</strong>-effective housing is an important community<br />
development goal. An analysis <strong>of</strong> housing <strong>conditions</strong> will help St. Croix County<br />
municipal units gain a better under<strong>st</strong>anding <strong>of</strong> the changes that have occurred over the<br />
pa<strong>st</strong> 20 to 25 years. It will also provide insight into future changes that can be anticipated.<br />
This information will create a foundation from which decisions regarding future housing<br />
development can be based.<br />
In its 2000 Consolidated Plan, the State <strong>of</strong> Wisconsin li<strong>st</strong>s the following as housing<br />
priorities that serve as guiding principles for the housing component <strong>of</strong> local<br />
comprehensive plans:<br />
� Provide affordable housing to all consumers, especially those with severe co<strong>st</strong><br />
burdens.<br />
� Maintain an adequate production <strong>of</strong> new units, including the provision <strong>of</strong> large family<br />
and elderly housing.<br />
� Preserve and increase the availability <strong>of</strong> safe, sanitary housing for low and moderateincome<br />
owners and renters.<br />
� Make lead based paint hazard reduction training and resources available.<br />
� Provide housing assi<strong>st</strong>ance for special needs groups, including the homeless.<br />
� Continue to ensure fairness and accessibility for all housing consumers.<br />
� Continue to assi<strong>st</strong> with housing disa<strong>st</strong>er relief.<br />
These are items that local units <strong>of</strong> government should take into consideration as they<br />
develop housing goals and policies for their individual comprehensive plans.<br />
The information contain herein differentiates between the dwelling unit used for a home<br />
and the people that occupy the home. A household refers to the people living in any<br />
particular housing unit such as a single-family home. The U.S. Census indicates that a<br />
household includes all the persons who occupy a housing unit. A housing unit is a house,<br />
an apartment, a mobile home, a group <strong>of</strong> rooms, or a single room that is occupied (or if<br />
vacant, is intended for occupancy) as separate living quarters. Separate living quarters are<br />
those in which the occupants live and eat separately from any other persons in the<br />
building and that have direct access from the outside <strong>of</strong> the building or through a<br />
common hall. The occupants may be a single family, one person living alone, two or<br />
more families living together, or any other group <strong>of</strong> related or unrelated persons who<br />
share living arrangements. (People not living in households are classified as living in<br />
group quarters.)<br />
St. Croix County Conditions and Trends Report 77
Housing Supply<br />
Table 2.1 provides the hi<strong>st</strong>oric and current count <strong>of</strong> housing units in St. Croix County<br />
from 1980 to 2000. The communities shaded in gray are participating in the multijurisdictional<br />
comprehensive planning process. Between 1980 and 1990, 3,595 housing<br />
units were added <strong>county</strong>wide. During this period there were 20 municipal units with a<br />
housing growth <strong>of</strong> 10 percent or greater. 10 municipal units saw an increase in housing <strong>of</strong><br />
over 25%. The Town <strong>of</strong> Hudson had the large<strong>st</strong> housing growth at 92.3%. Five<br />
municipalities experienced a loss <strong>of</strong> housing for the period.<br />
From 1990 to 2000, the growth in the housing <strong>st</strong>ock was even greater than the previous<br />
decade with a 31% increase. Twenty-seven municipalities experienced an expansion in<br />
the number <strong>of</strong> housing units <strong>of</strong> over 10 percent. Seventeen municipal units experienced<br />
growth <strong>of</strong> 20 percent or more. The Town <strong>of</strong> Hudson again experienced the large<strong>st</strong> growth<br />
with 72%. Only one municipality lo<strong>st</strong> housing, and this was only a loss <strong>of</strong> one housing<br />
unit. A reduction in a municipality’s housing <strong>st</strong>ock is mo<strong>st</strong> commonly caused by<br />
annexing land from a town to an incorporated municipality, through abandonment or<br />
condemnation, or de<strong>st</strong>ruction from natural disa<strong>st</strong>ers.<br />
Table 2.1 and Map 2.1 show housing unit change between 1980 and 2000. For the 20year<br />
period, areas adding the mo<strong>st</strong> housing included the City <strong>of</strong> Hudson, Town <strong>of</strong><br />
Hudson, City <strong>of</strong> New Richmond, and Town <strong>of</strong> North Hudson. Areas with the greate<strong>st</strong><br />
percentage increase in housing units include the Town <strong>of</strong> Hudson, Village <strong>of</strong> Somerset,<br />
City <strong>of</strong> River Falls, and City <strong>of</strong> Hudson.<br />
Between 1980 and 1990, County housing unit growth outpaced household growth slightly<br />
with the addition <strong>of</strong> 3,595 housing units and 3,479 households. Between 1990 and 2000,<br />
this reversed, with household growth outpacing housing unit growth 5,772 to 5,744.<br />
Seasonal Units<br />
Seasonal units are used or intended for use only in certain seasons (e.g., beach cottages<br />
and hunting cabins) or for weekend or occasional use throughout the year. Seasonal units<br />
may also include quarters used for seasonal workers such as loggers. They typically<br />
demand less <strong>of</strong> public services than housing units that are occupied throughout the year.<br />
St. Croix County contained 281 seasonal units in 2000 as shown in Table 2.2. Overall,<br />
only 1.2% <strong>of</strong> the County’s housing <strong>st</strong>ock is in seasonal units. Areas with the large<strong>st</strong><br />
number <strong>of</strong> seasonal units include the following:<br />
Town <strong>of</strong> Star Prairie 58 units<br />
Town <strong>of</strong> Troy 53 units<br />
Town <strong>of</strong> St. Joseph 45 units<br />
As shown in Table 2.3 the percentage <strong>of</strong> seasonal units in the <strong>county</strong> increased by 28%<br />
between 1980 and 1990, and then by 4% between 1990 and 2000. This resulted in a 33%<br />
increase in seasonal units for the 20-year period.<br />
78 Housing Information
Occupancy and Structural Characteri<strong>st</strong>ics<br />
Housing occupancy helps determine whether the housing supply is adequate to meet<br />
demand. A <strong>st</strong>able housing market is one where the availability <strong>of</strong> new and exi<strong>st</strong>ing<br />
housing units roughly matches the needs <strong>of</strong> the population. According to the U.S.<br />
Department <strong>of</strong> Housing and Urban Development (HUD), an overall housing vacancy rate<br />
<strong>of</strong> 3 percent is considered optimal. Vacancy rates under the 3 percent <strong>st</strong>andard may imply<br />
a tight housing market where demand exceeds supply, causing housing prices to rise.<br />
Conversely, a vacancy rate greater than 3 percent may imply an over-supply <strong>of</strong> housing<br />
units, causing housing prices to <strong>st</strong>agnate.<br />
In 2000, the County’s vacancy rate was slightly higher than the 3 percent <strong>st</strong>andard at 3.5<br />
percent. The 2000 vacancy rate is lower than the rates seen in 1990 (4.8%) or 1980<br />
(3.7%). The lower vacancy rates may signify that it has become more difficult for<br />
households to find sui<strong>table</strong> housing to own or rent. In other words, people seeking<br />
housing in aggregate will have fewer choices, and the price <strong>of</strong> housing will increase as a<br />
result.<br />
The majority <strong>of</strong> housing units in St. Croix County are owner occupied. In 2000, 17,881<br />
(76 percent) occupied housing units were identified as owner occupied, representing a 35<br />
percent increase from 1990. In 2000, 5,529 (24 percent) occupied housing units were<br />
identified as rental units. This represents a 25 percent increase from 1990. Of all rental<br />
units in the County, 80 percent are located in the cities and villages. In 2000, 77 percent<br />
<strong>of</strong> the housing <strong>st</strong>ock was comprised <strong>of</strong> single-family units, 19 percent were multi-family<br />
units, and 4 percent were mobile homes.<br />
Table 2.4 displays the number <strong>of</strong> units per <strong>st</strong>ructure for St. Croix County for 2000. The<br />
majority <strong>of</strong> the housing units (76 percent) are one-unit detached <strong>st</strong>ructures, commonly<br />
referred to as single-family homes. Detached housing units are one-unit <strong>st</strong>ructures<br />
detached from any other house, with open space on four sides. Structures are considered<br />
detached even if they have an attached garage or contain a business unit. Attached<br />
housing units are one-unit <strong>st</strong>ructures that have one or more walls extending from ground<br />
to ro<strong>of</strong> departing them from adjoining <strong>st</strong>ructures. Detailed housing occupancy and tenure<br />
data for individual municipalities is found at the end <strong>of</strong> this element in Table 2.12.<br />
Age Characteri<strong>st</strong>ics<br />
The age <strong>of</strong> the housing <strong>st</strong>ock is an important element to be analyzed when preparing for<br />
the future. If there is a significant amount <strong>of</strong> older housing units within the housing<br />
supply, they will mo<strong>st</strong> likely need to be replaced, rehabilitated or abandoned for new<br />
development within the planning period. Allowing for a new housing supply also requires<br />
planning regarding infra<strong>st</strong>ructure, land availability, community utilities, transportation<br />
routes, and a variety <strong>of</strong> other public services to address community needs that are<br />
affected by new development.<br />
St. Croix County Conditions and Trends Report 79
Table 2.5 depicts the year that <strong>st</strong>ructures were built in St. Croix County. According to the<br />
<strong>table</strong>, while 19% <strong>of</strong> housing <strong>st</strong>ock was con<strong>st</strong>ructed in 1939 or earlier, 27% <strong>of</strong> units have<br />
been built since 1990. Areas with the highe<strong>st</strong> growth in housing units include the Town<br />
<strong>of</strong> Hudson, Village <strong>of</strong> Somerset, Town <strong>of</strong> Star Prairie, City <strong>of</strong> Hudson, and Village <strong>of</strong><br />
Baldwin. Housing built prior to 1939 may need to be replaced, rehabilitated or<br />
demolished in the near future.<br />
Housing Value Characteri<strong>st</strong>ics<br />
Providing affordable housing that meets the needs <strong>of</strong> current and future St. Croix County<br />
residents is an important element in planning for the future. A lack <strong>of</strong> quality affordable<br />
housing has overriding impacts on population migration patterns, economic development<br />
and the <strong>county</strong>’s tax base.<br />
Table 2.6 provides housing values <strong>of</strong> specified owner-occupied units for 2000. A housing<br />
unit is owner-occupied if the owner or co-owner lives in the unit even if it is mortgaged<br />
or not fully paid for. The U.S. Bureau <strong>of</strong> the Census determines value by respondents’<br />
e<strong>st</strong>imates <strong>of</strong> how much the property (house and lot, mobile home and lot, or<br />
condominium unit) would sell for if it placed on the market. Please note that the figures<br />
presented may differ from assessed housing value as calculated by a public agency<br />
assessor.<br />
As noted, the majority <strong>of</strong> housing units (36 percent) in St. Croix County were valued<br />
between $100,000 and $149,000 in 2000. The median housing value in St. Croix County<br />
<strong>of</strong> $139,500 is significantly higher than the <strong>st</strong>ate median value <strong>of</strong> $112,200. Eleven<br />
municipal units have median housing values that exceed the <strong>st</strong>ate median. The Town <strong>of</strong><br />
Star Prairie has the highe<strong>st</strong> median value at $193,600. Fifteen municipal units have<br />
median values below the <strong>st</strong>ate median. The area with the lowe<strong>st</strong> median value is the<br />
Village <strong>of</strong> Wilson at $74,000.<br />
As shown in Table 2.7, the majority <strong>of</strong> rental households (46 percent) pay between $500<br />
and $749 for rental co<strong>st</strong>s. Twenty-two percent pay over $750 for rental co<strong>st</strong>s.<br />
Housing Affordability<br />
The U.S. Department <strong>of</strong> Housing and Urban Development (HUD) defines affordable<br />
housing as housing that does not co<strong>st</strong> a household more than 30 percent <strong>of</strong> its household<br />
income. This affordability benchmark is not an underwriting <strong>st</strong>andard; it does not address<br />
the ability to pay for housing. Households may choose to pay more to get the housing<br />
they need or want; however, according to HUD <strong>st</strong>andards, people should have the choice<br />
<strong>of</strong> having decent and safe housing for no more than 30 percent <strong>of</strong> their household income.<br />
As shown in Table 2.8, 82 percent <strong>of</strong> owner-occupied households in St. Croix County<br />
pay less than 30 percent <strong>of</strong> their household income towards housing co<strong>st</strong>s. Eighteen<br />
percent are experiencing a high co<strong>st</strong> burden (over 30 percent). As shown in Table 2.9,<br />
80 Housing Information
about 32 percent <strong>of</strong> rental households are paying 30 percent or more <strong>of</strong> their monthly<br />
income for housing co<strong>st</strong>s.<br />
Housing Unit and Household Projections<br />
Housing projections are helpful to e<strong>st</strong>imate the amount <strong>of</strong> land that may be consumed by<br />
future housing development. As the number <strong>of</strong> households and housing units in a <strong>county</strong><br />
continues to grow, there is a resulting need for local units <strong>of</strong> government to provide<br />
additional public facilities and services such as roads, sewer and water extensions, fire<br />
and police protection, schools, etc. It may also create a need for to develop and enforce<br />
additional regulations and ordinances. These are important planning issues for<br />
consideration.<br />
The housing unit projections used for this plan are intended to provide an e<strong>st</strong>imate <strong>of</strong><br />
housing units that will be developed through the year 2030 based on observed changes in<br />
population and housing preferences. Household projections characterize changes in<br />
housing preferences and habitation patterns. The projections are based on several<br />
assumptions that create limitations that should be remembered when reviewing and<br />
evaluating the projections. The assumptions include the following:<br />
� The population projections developed as part <strong>of</strong> this plan are reasonable and will<br />
continue to be reasonable during the planning period (see Table 1.4).<br />
� The persons per housing unit will remain con<strong>st</strong>ant during the planning period.<br />
� The vacancy rate will remain con<strong>st</strong>ant during the planning period.<br />
� Pa<strong>st</strong> <strong>trends</strong> regarding seasonal housing, as previously described, will continue in the<br />
future.<br />
Based on the developed housing projections as shown in Table 2.10, it is e<strong>st</strong>imated that<br />
St. Croix County will have 55,944 housing units by the year 2030. This is an increase <strong>of</strong><br />
31,681 housing units, or 131 percent, from the 2000 census. It is projected that housing<br />
units will average an annual increase <strong>of</strong> approximately 1,056 housing units per year<br />
during the 30-year period.<br />
Similarly, a household foreca<strong>st</strong> is used to help develop housing and land use foreca<strong>st</strong>s.<br />
The persons-per-household figure is obtained by dividing the number <strong>of</strong> persons in<br />
households by the number <strong>of</strong> households (or householders).<br />
Households with individuals under 18 years include not only families with related<br />
children but also all other households in which a person under 18 is present. The data is<br />
expressed here as a percent <strong>of</strong> all households. The Wisconsin Department <strong>of</strong><br />
Admini<strong>st</strong>ration Demographic Services <strong>of</strong>fice has prepared household projections for year<br />
2000 to 2030 in five-year increments that are found in Table 2.11.<br />
St. Croix County Conditions and Trends Report 81
Housing Programs<br />
There are a number and variety <strong>of</strong> housing programs in<strong>st</strong>ituted in St. Croix County.<br />
These are li<strong>st</strong>ed in the Inventory <strong>of</strong> Exi<strong>st</strong>ing Plans, Programs, & Land Use Policies in<br />
We<strong>st</strong>-Central Wisconsin <strong>report</strong> that will be di<strong>st</strong>ributed with the St. Croix County<br />
Conditions and Trends Report.<br />
Summary<br />
� Between 1980 and 2000, St. Croix County experienced a 63 percent increase in<br />
housing growth, adding 9,339 units.<br />
� Areas increasing the housing <strong>st</strong>ock by more than 50% during this period include the<br />
Town <strong>of</strong> St. Joseph, Town <strong>of</strong> Somerset, Town <strong>of</strong> Star Prairie, Town <strong>of</strong> Troy, Town <strong>of</strong><br />
Warren, Village <strong>of</strong> Baldwin, Village <strong>of</strong> North Hudson, Village <strong>of</strong> Somerset, Village<br />
<strong>of</strong> Woodville, City <strong>of</strong> Hudson, City <strong>of</strong> New Richmond, and City <strong>of</strong> River Falls.<br />
� Between 1980 and 1990, housing unit growth outpaced household growth in the<br />
<strong>county</strong>. Between 1990 and 2000, this trend was reversed.<br />
� St. Croix County has a small number <strong>of</strong> seasonal homes, making up only 1.2% <strong>of</strong> the<br />
County’s housing <strong>st</strong>ock.<br />
� In 2000, the vacancy rate in St. Croix County was 3.5 percent. This is a decrease from<br />
the 1980 and 1990 rates <strong>of</strong> 3.7% and 4.8% respectively.<br />
� Owner-occupied housing accounts for 76 percent <strong>of</strong> all housing in the <strong>county</strong>; rentals<br />
account for 24 percent. The majority (80 percent) <strong>of</strong> rentals are located in cities and<br />
villages. Seventy-six percent <strong>of</strong> the housing units are one-unit detached <strong>st</strong>ructures<br />
(single-family homes).<br />
� The <strong>county</strong> has a fairly new housing <strong>st</strong>ock with 27% <strong>of</strong> the units having been built<br />
since 1990. Nineteen percent <strong>of</strong> the <strong>county</strong>’s housing <strong>st</strong>ock was con<strong>st</strong>ructed before<br />
1939, indicating that they may need to be replaced, rehabilitated or abandoned in the<br />
near future. In some areas, the majority <strong>of</strong> housing was con<strong>st</strong>ructed after 1970.<br />
� The majority <strong>of</strong> housing in St. Croix County (36 percent) is valued between $100,000<br />
and $149,000. The median housing value in the County <strong>of</strong> $139,500 is significantly<br />
higher than the <strong>st</strong>ate median <strong>of</strong> $112,200.<br />
� A greater percentage <strong>of</strong> renters than homeowners are paying more than 30 percent <strong>of</strong><br />
the household’s annual income on housing co<strong>st</strong>s. Of the owner-occupied households<br />
in the County, 18 percent pay more than 30 percent <strong>of</strong> their income for housing. Of<br />
rental households, 32 percent are paying more than 30 percent <strong>of</strong> their income for<br />
housing co<strong>st</strong>s.<br />
82 Housing Information
� It is projected that by the year 2030 St. Croix County will contain 55,944 housing<br />
units. This represents an increase <strong>of</strong> 131 percent from 2000. This is an average <strong>of</strong><br />
1,056 additional housing units per year for the period.<br />
� There are a wide variety <strong>of</strong> programs and organizations are available to help St. Croix<br />
County communities ensure they have an adequate supply <strong>of</strong> housing to meet a<br />
diverse array <strong>of</strong> current and future demands.<br />
St. Croix County Conditions and Trends Report 83
Data Tables and Map<br />
Table 2.1<br />
Housing Units – 1980 to 2000 – St. Croix County Municipalities<br />
Percent Change<br />
Municipality 1980 1990 2000 1980-90 1990-00<br />
Towns<br />
Baldwin 274 288 315 5.1% 9.4%<br />
Cady 248 240 264 -3.2% 10.0%<br />
Cylon 229 227 232 -.9% 2.2%<br />
Eau Galle 286 269 320 -5.9% 19.0%<br />
Emerald 189 203 244 7.4% 20.2%<br />
Erin Prairie 193 208 234 7.8% 12.5%<br />
Fore<strong>st</strong> 199 207 218 4.0% 5.3%<br />
Glenwood 221 239 263 8.1% 10.0%<br />
Hammond 250 271 318 8.4% 17.3%<br />
Hudson 595 1,144 1,962 92.3% 71.5%<br />
Kinnickinnic 336 364 492 8.3% 35.2%<br />
Pleasant Valley 111 128 150 15.3% 17.2%<br />
Richmond 385 467 530 21.3% 13.5%<br />
Rush River 154 151 173 -1.9% 14.6%<br />
St. Joseph 759 974 1,259 28.3% 29.3%<br />
Somerset 583 722 963 23.8% 33.4%<br />
Springfield 267 268 299 .4% 12.0%<br />
Stanton 340 353 363 3.8% 2.8%<br />
Star Prairie 631 761 1,079 20.6% 41.8%<br />
Troy 795 1,033 1,328 29.9% 28.6%<br />
Warren 250 327 437 30.8% 33.6%<br />
Villages<br />
Baldwin 678 822 1,144 21.2% 39.2%<br />
Deer Park 92 98 94 6.5% -4.1%<br />
Hammond 367 406 438 10.6% 7.9%<br />
North Hudson 753 1,122 1,358 49.0% 21.0%<br />
Roberts 281 389 402 38.4% 3.3%<br />
Somerset 318 417 659 31.1% 58.0%<br />
Spring Valley* 1 0 0 -100% 0.0%<br />
Star Prairie 165 201 215 21.8% 7.0%<br />
Wilson 58 57 69 -1.7% 21.1%<br />
Woodville 282 371 460 31.6% 24.0%<br />
Cities<br />
Glenwood 379 418 491 10.3% 17.5%<br />
Hudson 2,055 2,634 3,831 28.2% 45.4%<br />
New Richmond 1,665 2,025 2,657 21.6% 31.2%<br />
River Falls** 535 715 1,002 33.6% 40.1%<br />
St. Croix County 14,924 18,519 24,263 24.1% 31.0%<br />
source: U.S. Census.<br />
* Portion <strong>of</strong> Spring Valley located in St. Croix County only. **Portion <strong>of</strong> River Falls located in St. Croix County only.<br />
84 Housing Information
Table 2.2<br />
Seasonal Units – 2000 – St. Croix County Municipalities<br />
Seasonal Housing Units<br />
Municipality Total Housing Units Units % <strong>of</strong> Total<br />
Towns<br />
Baldwin 315 3 1.0%<br />
Cady 264 4 1.5%<br />
Cylon 232 1 0.4%<br />
Eau Galle 320 6 1.9%<br />
Emerald 244 2 0.8%<br />
Erin Prairie 234 4 1.7%<br />
Fore<strong>st</strong> 218 3 1.4%<br />
Glenwood 263 2 0.8%<br />
Hammond 318 1 0.3%<br />
Hudson 1,962 6 0.3%<br />
Kinnickinnic 492 5 1.0%<br />
Pleasant Valley 150 1 0.7%<br />
Richmond 530 0 0.0%<br />
Rush River 173 1 0.6%<br />
St. Joseph 1,259 45 3.6%<br />
Somerset 963 15 1.6%<br />
Springfield 299 6 2.0%<br />
Stanton 363 0 0.0%<br />
Star Prairie 1,079 58 5.4%<br />
Troy 1,328 53 4.0%<br />
Warren 437 6 1.4%<br />
Villages<br />
Baldwin 1,144 2 0.2%<br />
Deer Park 94 0 0.0%<br />
Hammond 438 0 0.0%<br />
North Hudson 1,358 15 1.1%<br />
Roberts 402 2 0.5%<br />
Somerset 659 5 0.8%<br />
Spring Valley* 0 0 0.0%<br />
Star Prairie 215 0 0.0%<br />
Wilson 69 0 0.0%<br />
Woodville 460 2 0.4%<br />
Cities<br />
Glenwood 491 2 0.4%<br />
Hudson 3,831 22 0.6%<br />
New Richmond 2,657 5 0.2%<br />
River Falls** 1,002 4 0.4%<br />
St. Croix County 24,263 281 1.2%<br />
source: U.S. Census.<br />
*Portion <strong>of</strong> Spring Valley located in St. Croix County only. **Portion <strong>of</strong> River Falls located in St. Croix County only.<br />
St. Croix County Conditions and Trends Report 85
Table 2.3<br />
Housing Characteri<strong>st</strong>ics – 1980 to 2000 – St. Croix County<br />
1980 1990 2000<br />
Total Housing Units 14,924 18,519 24,263<br />
Total Seasonal 211 270 281<br />
Total Vacant 554 881 853<br />
Total Occupied Units 14,159 17,638 23,410<br />
Owner Occupied Units 10,795 13,212 17,881<br />
Renter Occupied Units 3,364 4,426 5,529<br />
Single Family Units* 11,415 13,907 18,613<br />
Multi-Family Units 2,493 3,310 4,519<br />
Mobile Homes 805 1,302 1,131<br />
source: U.S. Census<br />
*In 1980 seasonal units are not included in single family unit totals. In 1990 and 2000 they are included.<br />
86 Housing Information
Table 2.4<br />
Units in Structure – 2000 – St. Croix County Municipalities<br />
Municipality<br />
1-Unit<br />
Detached<br />
1-Unit<br />
Attached<br />
2 Units<br />
3-4 Units<br />
5 or more<br />
Units<br />
Towns<br />
Baldwin 296 0 0 0 0<br />
Cady 229 3 0 0 0<br />
Cylon 218 0 0 3 0<br />
Eau Galle 301 0 11 1 0<br />
Emerald 223 4 2 3 1<br />
Erin Prairie 233 0 0 0 0<br />
Fore<strong>st</strong> 197 5 0 3 0<br />
Glenwood 234 0 8 0 0<br />
Hammond 320 0 6 0 0<br />
Hudson 1,898 31 64 0 7<br />
Kinnickinnic 444 8 16 0 0<br />
Pleasant Valley 120 6 9 0 4<br />
Richmond 464 4 12 6 0<br />
Rush River 163 2 0 0 0<br />
St. Joseph 1,158 5 31 0 0<br />
Somerset 881 18 15 25 0<br />
Springfield 243 0 2 0 0<br />
Stanton 349 5 6 0 0<br />
Star Prairie 880 19 10 0 0<br />
Troy 1,120 10 60 10 0<br />
Warren 416 2 6 2 0<br />
Villages<br />
Baldwin 601 54 116 59 245<br />
Deer Park 82 0 3 4 13<br />
Hammond 292 6 26 33 47<br />
North Hudson 987 93 64 107 102<br />
Roberts 182 6 24 8 42<br />
Somerset 304 46 34 97 154<br />
Spring Valley* 0 0 0 0 0<br />
Star Prairie 157 2 19 5 9<br />
Wilson 58 0 4 0 0<br />
Woodville 248 2 23 28 82<br />
Cities<br />
Glenwood 326 22 35 32 31<br />
Hudson 1,980 388 185 199 1,059<br />
New Richmond 1,551 123 162 265 507<br />
River Falls** 482 109 48 21 304<br />
St. Croix County 17,637 973 1,001 911 2,607<br />
source: U.S. Census.<br />
Portion <strong>of</strong> Spring Valley located in St. Croix County only.**Portion <strong>of</strong> River Falls located in St. Croix County only.<br />
St. Croix County Conditions and Trends Report 87
Table 2.5<br />
Year Structure Built – 2000 – St. Croix County Municipalities<br />
Municipality<br />
1990 to<br />
March ‘00<br />
1980 to<br />
1989<br />
1970 to<br />
1979<br />
1960 to<br />
1969<br />
1940 to<br />
1959<br />
1939 or<br />
earlier<br />
Baldwin 41 26 46 31 18 142<br />
Cady 57 26 48 16 18 105<br />
Cylon 36 20 45 18 22 90<br />
Eau Galle 67 32 62 15 27 121<br />
Emerald 49 25 36 13 21 104<br />
Erin Prairie 40 33 56 13 18 80<br />
Fore<strong>st</strong> 17 14 42 2 20 124<br />
Glenwood 40 20 33 9 31 124<br />
Hammond 63 39 56 22 50 98<br />
Hudson 891 552 404 44 34 84<br />
Kinnickinnic 153 86 107 50 35 54<br />
Pleasant Valley 29 12 25 5 16 56<br />
Richmond 116 94 149 58 14 90<br />
Rush River 32 19 23 9 9 79<br />
St. Joseph 350 242 334 90 59 170<br />
Somerset 304 186 251 54 54 150<br />
Springfield 50 33 47 13 34 120<br />
Stanton 51 12 117 69 52 97<br />
Star Prairie 409 161 223 88 71 122<br />
Troy 327 263 382 139 67 105<br />
Warren 100 83 116 34 18 82<br />
Villages<br />
Baldwin 339 161 188 80 94 278<br />
Deer Park 12 12 9 7 19 45<br />
Hammond 82 34 95 52 63 113<br />
North Hudson 286 322 305 184 90 178<br />
Roberts 85 69 104 47 36 66<br />
Somerset 254 91 103 27 79 83<br />
Spring Valley* 0 0 0 0 0 0<br />
Star Prairie 35 34 24 16 41 45<br />
Wilson 11 7 4 6 11 27<br />
Woodville 116 78 93 19 64 95<br />
Cities<br />
Glenwood 95 56 82 17 92 152<br />
Hudson 1,184 530 584 336 524 671<br />
New Richmond 633 454 398 226 431 501<br />
River Falls** 221 191 221 142 123 104<br />
St. Croix County 6,575 4,017 4,812 1,951 2,355 4,555<br />
source: U.S. Census<br />
*Portion <strong>of</strong> Spring Valley located in St. Croix County only. **Portion <strong>of</strong> River Falls located in St. Croix County only.<br />
88 Housing Information
Table 2.6<br />
Housing Value <strong>of</strong> Specified Owner-Occupied Units – 2000 – St. Croix County Municipalities<br />
Less than<br />
$50,000<br />
$50,000 -<br />
$99,999<br />
$100,000 -<br />
$149,000<br />
$150,000 -<br />
$199,999<br />
$200,000 –<br />
$299,999<br />
$300,000 –<br />
$499,999<br />
$500,000<br />
or more<br />
St. Croix County Conditions and Trends Report 89<br />
Median<br />
Value<br />
Towns<br />
Baldwin 4 22 49 26 9 0 0 133,300<br />
Cady 5 17 14 7 7 0 0 110,700<br />
Cylon 9 24 31 3 0 0 0 100,800<br />
Eau Galle 3 26 23 18 8 2 0 118,300<br />
Emerald 15 14 14 22 9 0 0 133,300<br />
Erin Prairie 0 9 40 32 10 2 0 147,700<br />
Fore<strong>st</strong> 9 36 7 4 2 0 0 81,700<br />
Glenwood 11 36 18 2 7 0 0 86,000<br />
Hammond 6 33 75 49 13 2 3 132,700<br />
Hudson 5 17 265 772 396 111 12 185,500<br />
Kinnickinnic 2 21 88 68 38 4 0 149,700<br />
Pleasant<br />
Valley 2 1 14 7 6 0 0 140,000<br />
Richmond 0 65 126 81 58 0 0 141,400<br />
Rush River 7 19 12 14 3 0 0 103,800<br />
St. Joseph 0 66 121 320 323 70 8 186,500<br />
Somerset 0 43 171 141 82 25 2 156,000<br />
Springfield 6 36 6 8 0 0 0 78,600<br />
Stanton 6 43 89 28 14 0 0 123,800<br />
Star Prairie 12 80 268 119 69 22 0 139,700<br />
Troy 0 35 189 220 249 125 20 193,600<br />
Warren 0 14 117 69 39 0 0 144,900<br />
Villages<br />
Baldwin 12 161 299 62 11 7 0 114,000<br />
Deer Park 8 40 21 0 0 0 0 86,300<br />
Hammond 9 118 110 21 0 0 0 100,900<br />
North Hudson 6 149 321 231 117 40 13 143,400<br />
Roberts 4 43 77 25 5 0 0 116,300<br />
Somerset 2 112 146 17 6 0 0 106,200<br />
Spring Valley* 0 0 0 0 0 0 0 0<br />
Star Prairie 0 48 56 15 0 0 0 106,800<br />
Wilson 7 9 6 0 0 0 0 74,000<br />
Woodville 5 112 60 25 2 0 0 95,700<br />
Cities<br />
Glenwood 37 147 47 14 2 0 0 82,400<br />
Hudson 29 292 858 464 260 90 34 139,900<br />
New<br />
Richmond 27 545 616 136 74 34 0 108,100<br />
River Falls** 9 135 290 82 11 0 0 123,700<br />
St. Croix<br />
County 257 2,568 4,644 3,102 1,830 534 92 139,500<br />
source: U.S. Census.<br />
*Portion <strong>of</strong> Spring Valley located in St. Croix County only. **Portion <strong>of</strong> River Falls located in St. Croix County only.
Table 2.7<br />
Contract Rent (Renter-Occupied Units) – 2000 – St. Croix County Municipalities<br />
Municipality<br />
Less than<br />
$200<br />
$200 to<br />
$299<br />
$300 to<br />
$499<br />
Rents<br />
$500 to<br />
$749<br />
$750 to<br />
$999<br />
$1,000 or<br />
more<br />
Towns<br />
Baldwin 2 0 3 4 0 2<br />
Cady 0 2 4 2 0 0<br />
Cylon 0 3 6 9 0 0<br />
Eau Galle 0 4 10 8 1 0<br />
Emerald 3 0 3 4 0 0<br />
Erin Prairie 0 0 5 10 0 0<br />
Fore<strong>st</strong> 0 2 5 2 0 0<br />
Glenwood 2 0 0 9 0 0<br />
Hammond 0 2 7 2 7 2<br />
Hudson 0 0 9 67 38 35<br />
Kinnickinnic 0 5 3 18 9 0<br />
Pleasant Valley 0 0 5 14 0 0<br />
Richmond 4 4 6 19 6 0<br />
Rush River 0 0 3 3 0 0<br />
St. Joseph 0 0 12 9 8 0<br />
Somerset 0 0 33 23 10 7<br />
Springfield 2 0 8 7 0 0<br />
Stanton 0 0 12 21 0 0<br />
Star Prairie 0 3 14 38 18 8<br />
Troy 0 10 10 70 0 0<br />
Warren 0 0 5 5 0 2<br />
Villages<br />
Baldwin 18 40 119 156 99 9<br />
Deer Park 8 0 7 10 0 0<br />
Hammond 7 13 51 51 7 2<br />
North Hudson 0 0 25 209 68 5<br />
Roberts 2 6 10 56 17 12<br />
Somerset 6 11 44 182 43 5<br />
Spring Valley* 0 0 0 0 0 0<br />
Star Prairie 4 0 17 27 3 0<br />
Wilson 0 0 2 2 0 0<br />
Woodville 23 11 65 35 0 4<br />
Cities<br />
Glenwood 9 4 61 57 8 4<br />
Hudson 46 90 143 715 268 117<br />
New Richmond 62 68 240 321 157 42<br />
River Falls** 54 91 43 170 72 12<br />
St. Croix County 241 375 987 2,334 838 274<br />
source: U.S. Census.<br />
*Portion <strong>of</strong> Spring Valley located in St.Croix County only. **Portion <strong>of</strong> River Falls located in St. Croix County only.<br />
90 Housing Information
Table 2.8<br />
Owner-Occupied Housing Co<strong>st</strong>s as a Percentage <strong>of</strong> Household Income – 1999<br />
St. Croix County Municipalities<br />
Monthly Housing Co<strong>st</strong>s as a Percentage <strong>of</strong> Household Income<br />
Municipality<br />
Less<br />
than 15%<br />
15.0% to<br />
19.9%<br />
20.0% to<br />
24.9%<br />
25.0% to<br />
29.9%<br />
30.0% to<br />
34.9%<br />
35.0%<br />
or more<br />
St. Croix County Conditions and Trends Report 91<br />
Total Units<br />
Towns<br />
Baldwin 47 22 23 6 4 8 110<br />
Cady 15 15 5 5 7 3 50<br />
Cylon 22 24 4 8 0 9 67<br />
Eau Galle 16 24 12 12 3 11 80<br />
Emerald 19 11 10 5 7 22 74<br />
Erin Prairie 35 15 27 4 2 10 93<br />
Fore<strong>st</strong> 40 6 7 4 1 0 58<br />
Glenwood 21 22 11 16 2 2 74<br />
Hammond 61 18 34 14 17 34 181<br />
Hudson 543 349 316 156 67 147 1,578<br />
Kinnickinnic 57 29 51 32 12 40 221<br />
Pleasant Valley 12 12 4 2 0 0 30<br />
Richmond 116 94 63 20 13 24 330<br />
Rush River 31 6 5 9 0 4 55<br />
St. Joseph 277 207 155 88 28 153 908<br />
Somerset 136 86 111 31 36 60 464<br />
Springfield 28 9 9 5 5 0 56<br />
Stanton 64 48 24 20 2 20 180<br />
Star Prairie 155 130 103 72 34 76 570<br />
Troy 238 195 142 73 73 117 838<br />
Warren 88 56 28 14 15 36 239<br />
Villages<br />
Baldwin 209 113 87 52 49 42 552<br />
Deer Park 38 17 13 1 0 0 69<br />
Hammond 67 71 43 24 29 22 258<br />
North Hudson 260 183 156 121 42 115 877<br />
Roberts 58 26 23 14 7 24 154<br />
Somerset 87 63 46 37 16 34 283<br />
Spring Valley* 0 0 0 0 0 0 0<br />
Star Prairie 40 25 27 11 6 10 119<br />
Wilson 4 6 3 4 0 5 22<br />
Woodville 83 29 28 26 19 19 204<br />
Cities<br />
Glenwood 122 37 22 16 13 35 245<br />
Hudson 667 416 346 240 107 251 2,027<br />
New Richmond 508 259 221 186 112 146 1,432<br />
River Falls** 206 135 63 46 5 72 527<br />
St. Croix County 4,370 2,758 2,222 1,374 733 1,551 13,027<br />
source: U.S. Census..<br />
Portion <strong>of</strong> Spring Valley located in St. Croix County only.**Portion <strong>of</strong> River Falls located in St. Croix County only.
Table 2.9<br />
Renter-Occupied Housing Co<strong>st</strong>s as a Percentage <strong>of</strong> Household Income – 1999<br />
St. Croix County Municipalities<br />
Monthly Housing Co<strong>st</strong>s as a Percentage <strong>of</strong> Household Income<br />
Less<br />
than 15%<br />
15.0% -<br />
19.9%<br />
20.0% -<br />
24.9%<br />
25.0% -<br />
29.9%<br />
30.0% -<br />
34.9%<br />
35.0%<br />
or more<br />
Total Units<br />
Towns<br />
Baldwin 4 5 0 2 0 0 13<br />
Cady 4 0 0 0 2 2 12<br />
Cylon 6 5 4 3 0 0 26<br />
Eau Galle 15 7 0 0 0 1 23<br />
Emerald 4 0 5 0 0 1 10<br />
Erin Prairie 10 3 2 0 0 0 23<br />
Fore<strong>st</strong> 6 0 0 3 0 0 9<br />
Glenwood 0 5 0 0 6 0 13<br />
Hammond 7 2 3 2 2 4 20<br />
Hudson 27 9 0 40 20 53 166<br />
Kinnickinnic 14 8 9 0 0 4 40<br />
Pleasant Valley 7 3 3 0 4 2 56<br />
Richmond 0 4 12 0 0 23 39<br />
Rush River 3 3 0 0 0 0 6<br />
St. Joseph 9 0 0 8 0 12 29<br />
Somerset 19 24 0 2 6 22 82<br />
Springfield 6 4 5 0 0 2 22<br />
Stanton 7 12 0 6 2 4 39<br />
Star Prairie 29 12 11 9 3 17 84<br />
Troy 29 21 19 0 0 21 102<br />
Warren 7 0 0 0 0 5 18<br />
Villages<br />
Baldwin 99 75 58 76 22 111 445<br />
Deer Park 8 0 10 4 0 3 27<br />
Hammond 51 22 25 11 4 16 139<br />
North Hudson 83 90 44 13 14 63 307<br />
Roberts 12 28 26 12 5 16 103<br />
Somerset 59 64 43 36 38 49 296<br />
Spring Valley* 0 0 0 0 0 0 5<br />
Star Prairie 17 9 5 0 9 11 3<br />
Wilson 0 2 0 0 2 0 7<br />
Woodville 41 20 29 17 7 20 188<br />
Cities<br />
Glenwood 32 22 15 21 10 43 146<br />
Hudson 244 281 235 151 122 346 1,399<br />
New Richmond 208 121 135 98 72 246 934<br />
River Falls** 71 27 109 74 0 161 445<br />
St. Croix County 1,138 888 807 588 350 1,258 5,251<br />
source: U.S. Census.<br />
Portion <strong>of</strong> Spring Valley located in St. Croix County only.**Portion <strong>of</strong> River Falls located in St. Croix County only.<br />
92 Housing Information
Table 2.10<br />
Housing Unit Projections – 2000 to 2030 – St. Croix County Municipalities<br />
Municipality 2000<br />
Proj.<br />
2005<br />
Proj.<br />
2010<br />
Proj.<br />
2015<br />
Proj.<br />
2020<br />
Proj.<br />
2025<br />
Proj.<br />
2030<br />
% Change<br />
2000-2030<br />
Towns<br />
Baldwin 315 336 354 378 402 422 441 40.0<br />
Cady 264 293 319 350 383 411 440 66.7<br />
Cylon 232 248 261 277 293 308 321 38.4<br />
Eau Galle 320 362 405 449 493 535 576 80.0<br />
Emerald 244 276 305 339 374 407 439 79.9<br />
Erin Prairie 234 240 249 263 276 287 297 26.9<br />
Fore<strong>st</strong> 218 233 244 260 275 288 301 38.1<br />
Glenwood 263 299 329 366 403 437 472 79.5<br />
Hammond 318 513 638 779 927 1,073 1,221 284.0<br />
Hudson 1,962 2,394 2,876 3,414 3,978 4,529 5,090 159.4<br />
Kinnickinnic 492 575 653 744 837 928 1,019 107.1<br />
Pleasant Valley 150 169 186 206 228 247 268 78.7<br />
Richmond 530 836 1,032 1,250 1,483 1,710 1,942 266.4<br />
Rush River 173 184 198 214 233 248 264 52.6<br />
St. Joseph 1,259 1,367 1,525 1,711 1,904 2,086 2,268 80.1<br />
Somerset 963 1,189 1,388 1,614 1,854 2,085 2,320 140.9<br />
Springfield 299 340 372 411 451 487 523 74.9<br />
Stanton 363 368 379 393 406 414 421 16.0<br />
Star Prairie 1,079 1,293 1,488 1,712 1,947 2,172 2,402 122.6<br />
Troy 1,328 1,597 1,846 2,133 2,433 2,721 3,014 127.0<br />
Warren 437 512 588 674 766 850 938 114.6<br />
Villages<br />
Baldwin 1,144 1,492 1,774 2,098 2,437 2,768 3,105 171.4<br />
Deer Park 94 93 95 97 99 101 101 7.4<br />
Hammond 438 634 759 901 1,051 1,198 1,347 207.5<br />
North Hudson 1,358 1,453 1,588 1,755 1,927 2,085 2,243 65.2<br />
Roberts 402 567 668 786 909 1,028 1,149 185.8<br />
Somerset 659 937 1,153 1,398 1,656 1,908 2,168 229.0<br />
Spring Valley* 0 0 0 0 0 0 0 0<br />
Star Prairie 215 238 264 294 326 355 383 78.1<br />
Wilson 69 74 84 92 101 109 110 59.4<br />
Woodville 460 541 608 696 787 875 962 109.1<br />
Cities<br />
Glenwood 491 511 550 597 645 690 731 48.9<br />
Hudson 3,831 5,015 5,983 7,097 8,263 9,407 10,573 180.7<br />
New Richmond 2,657 3,221 3,722 4,306 4,914 5,502 6,096 129.4<br />
River Falls* 1,002 1,110 1,247 1,410 1,581 1,741 1,902 89.8<br />
St. Croix County* 24,263 29,546 34,173 39,517 45,105 50,487 55,944 130.6<br />
source: U.S. Census.<br />
Portion <strong>of</strong> Spring Valley located in St. Croix County only.**Portion <strong>of</strong> River Falls located in St. Croix County only.<br />
St. Croix County Conditions and Trends Report 93
Table 2.11<br />
Household Projections – 2000 to 2030 – St. Croix County Municipalities<br />
Municipality 2000<br />
Proj.<br />
2005<br />
Proj.<br />
2010<br />
Proj.<br />
2015<br />
Proj.<br />
2020<br />
Proj.<br />
2025<br />
Proj.<br />
2030<br />
% Change<br />
2000-2030<br />
Towns<br />
Baldwin 307 327 345 368 392 411 430 40.1<br />
Cady 255 283 308 338 370 397 425 66.7<br />
Cylon 227 243 255 271 287 301 314 38.3<br />
Eau Galle 307 347 389 431 473 513 553 80.1<br />
Emerald 236 267 295 328 362 394 425 80.1<br />
Erin Prairie 227 233 242 255 268 278 288 26.9<br />
Fore<strong>st</strong> 203 217 227 242 256 268 280 37.9<br />
Glenwood 254 289 318 353 389 422 456 79.5<br />
Hammond 314 507 630 769 915 1,059 1,206 284.1<br />
Hudson 1,925 2,349 2,822 3,349 3,903 4,443 4,994 159.4<br />
Kinnickinnic 483 564 641 730 822 911 1,000 107.0<br />
Pleasant Valley 145 163 180 199 220 239 259 78.6<br />
Richmond 524 827 1,019 1,236 1,466 1,691 1,920 266.4<br />
Rush River 171 182 196 212 230 245 261 52.6<br />
St. Joseph 1,193 1,295 1,445 1,621 1,804 1,977 2,149 80.1<br />
Somerset 9271 1,145 1,336 1,554 1,785 2,077 2,233 140.9<br />
Springfield 285 324 355 392 430 464 499 75.1<br />
Stanton 352 357 368 381 394 401 408 15.9<br />
Star Prairie 1,006 1,205 1,387 1,596 1,815 2,025 2,239 122.6<br />
Troy 1,250 1,503 1,738 2,008 2,290 2,561 2,837 127.0<br />
Warren 426 499 573 657 744 829 914 114.6<br />
Subtotal: 11,017 13,126 15,069 17,290 19,615 21,836 24,090 118.7<br />
Villages<br />
Baldwin 1,115 1,454 1,729 2,045 2,375 2,698 3,026 171.4<br />
Deer Park 91 90 92 94 96 98 98 7.7<br />
Hammond 433 627 750 891 1,039 1,184 1,332 207.6<br />
North Hudson 1,315 1,407 1,538 1,699 1,866 2,019 2,172 65.2<br />
Roberts 392 553 651 766 886 1,002 1,120 185.7<br />
Somerset 635 903 1,111 1,347 1,596 1,839 2,089 229.0<br />
Spring Valley* 1 235 260 290 321 350 378 78.3<br />
Star Prairie 212 2 2 2 2 2 2 100.0<br />
Wilson 66 73 80 88 97 104 112 69.7<br />
Woodville 446 525 590 675 763 848 933 109.2<br />
Subtotal: 4,706 5,869 6,803 7,897 9,041 10,144 11,262 139.31<br />
Cities<br />
Glenwood 460 479 515 559 604 646 685 48.9<br />
Hudson 3,687 4,826 5,758 6,830 7,952 9,053 10,175 176.0<br />
New Richmond 2,561 3,105 3,588 4,151 4,737 5,303 5,876 129.4<br />
River Falls* 979 1,101 1,237 1,399 1,568 1,727 1,887 92.7<br />
Subtotal: 7,687 9,511 11,098 12,939 14,861 16,729 18,623 142.27<br />
St. Croix County* 23,410 28,506 32,970 38,126 43,517 48,709 53,975 130.6<br />
source: Wisconsin Department <strong>of</strong> Admini<strong>st</strong>ration, Demographic Services Center, October 2008.<br />
Projections are Pre-Release Version for Research and Analysis Only.<br />
94 Housing Information
Table 2.12<br />
Housing Characteri<strong>st</strong>ics – 1980 to 2000<br />
St. Croix County Municipalities<br />
Municipal Unit 1980 1990 2000<br />
Town <strong>of</strong> Baldwin 1980 1990 2000<br />
Total Housing Units 274 288 315<br />
Total Seasonal 0 1 3<br />
Total Vacant 8 8 8<br />
Total Occupied Units 266 280 307<br />
Owner Occupied Units 237 243 291<br />
Renter Occupied Units 29 37 16<br />
Single Family Units 264 272 296<br />
Multi-Family Units 2 1 0<br />
Mobile Homes 8 15 8<br />
Town <strong>of</strong> Cady 1980 1990 2000<br />
Total Housing Units 248 240 264<br />
Total Seasonal 4 2 4<br />
Total Vacant 22 23 9<br />
Total Occupied Units 222 217 255<br />
Owner Occupied Units 191 196 230<br />
Renter Occupied Units 31 21 25<br />
Single Family Units 221 221 232<br />
Multi-Family Units 10 1 0<br />
Mobile Homes 13 18 38<br />
Town <strong>of</strong> Cylon 1980 1990 2000<br />
Total Housing Units 229 227 232<br />
Total Seasonal 1 4 1<br />
Total Vacant 8 18 5<br />
Total Occupied Units 220 209 227<br />
Owner Occupied Units 195 183 202<br />
Renter Occupied Units 25 26 25<br />
Single Family Units 212 201 218<br />
Multi-Family Units 6 2 3<br />
Mobile Homes 10 24 10<br />
Town <strong>of</strong> Eau Galle 1980 1990 2000<br />
Total Housing Units 286 269 320<br />
Total Seasonal 5 5 6<br />
Total Vacant 13 13 13<br />
Total Occupied Units 268 256 307<br />
Owner Occupied Units 243 228 273<br />
Renter Occupied Units 25 28 34<br />
Single Family Units 249 252 301<br />
Multi-Family Units 6 3 12<br />
Mobile Homes 26 14 11<br />
St. Croix County Conditions and Trends Report 95<br />
269
Table 2.12 continued<br />
Housing Characteri<strong>st</strong>ics – 1980 to 2000<br />
St. Croix County Municipalities<br />
Municipal Unit 1980 1990 2000<br />
Town <strong>of</strong> Emerald 1980 1990 2000<br />
Total Housing Units 189 203 244<br />
Total Seasonal 0 2 2<br />
Total Vacant 11 12 8<br />
Total Occupied Units 178 191 236<br />
Owner Occupied Units 157 154 215<br />
Renter Occupied Units 21 37 21<br />
Single Family Units 166 177 227<br />
Multi-Family Units 4 2 10<br />
Mobile Homes 19 24 15<br />
Town <strong>of</strong> Erin Prairie 1980 1990 2000<br />
Total Housing Units 193 208 234<br />
Total Seasonal 0 1 4<br />
Total Vacant 4 10 7<br />
Total Occupied Units 189 198 227<br />
Owner Occupied Units 152 167 193<br />
Renter Occupied Units 37 31 34<br />
Single Family Units 164 192 233<br />
Multi-Family Units 10 0 0<br />
Mobile Homes 19 16 7<br />
Town <strong>of</strong> Fore<strong>st</strong> 1980 1990 2000<br />
Total Housing Units 199 207 218<br />
Total Seasonal 0 2 3<br />
Total Vacant 10 12 15<br />
Total Occupied Units 189 195 203<br />
Owner Occupied Units 163 169 188<br />
Renter Occupied Units 26 26 15<br />
Single Family Units 188 189 202<br />
Multi-Family Units 0 0 3<br />
Mobile Homes 11 18 14<br />
Town <strong>of</strong> Glenwood 1980 1990 2000<br />
Total Housing Units 221 239 263<br />
Total Seasonal 0 2 2<br />
Total Vacant 7 14 9<br />
Total Occupied Units 214 225 254<br />
Owner Occupied Units 186 180 221<br />
Renter Occupied Units 28 45 33<br />
Single Family Units 196 203 234<br />
Multi-Family Units 3 5 8<br />
Mobile Homes 22 31 15<br />
96 Housing Information
Table 2.12 continued<br />
Housing Characteri<strong>st</strong>ics – 1980 to 2000<br />
St. Croix County Municipalities<br />
Municipal Unit 1980 1990 2000<br />
Town <strong>of</strong> Hammond 1980 1990 2000<br />
Total Housing Units 250 271 318<br />
Total Seasonal 0 1 1<br />
Total Vacant 8 8 4<br />
Total Occupied Units 242 263 314<br />
Owner Occupied Units 215 224 286<br />
Renter Occupied Units 27 39 28<br />
Single Family Units 244 250 320<br />
Multi-Family Units 4 8 6<br />
Mobile Homes 2 13 2<br />
Town <strong>of</strong> Hudson 1980 1990 2000<br />
Total Housing Units 595 1,144 1,962<br />
Total Seasonal 4 5 6<br />
Total Vacant 20 36 37<br />
Total Occupied Units 571 1,108 1,925<br />
Owner Occupied Units 517 1,045 1,790<br />
Renter Occupied Units 54 63 135<br />
Single Family Units 551 1,113 1,929<br />
Multi-Family Units 36 21 71<br />
Mobile Homes 4 10 9<br />
Town <strong>of</strong> Kinnickinnic 1980 1990 2000<br />
Total Housing Units 336 364 492<br />
Total Seasonal 6 7 5<br />
Total Vacant 16 17 9<br />
Total Occupied Units 314 347 483<br />
Owner Occupied Units 262 289 434<br />
Renter Occupied Units 52 58 49<br />
Single Family Units 289 322 452<br />
Multi-Family Units 27 17 16<br />
Mobile Homes 14 25 14<br />
Town <strong>of</strong> Pleasant Valley 1980 1990 2000<br />
Total Housing Units 111 128 150<br />
Total Seasonal 0 0 1<br />
Total Vacant 2 3 5<br />
Total Occupied Units 109 125 145<br />
Owner Occupied Units 82 98 109<br />
Renter Occupied Units 27 27 36<br />
Single Family Units 94 113 126<br />
Multi-Family Units 17 12 13<br />
Mobile Homes 0 3 4<br />
St. Croix County Conditions and Trends Report 97
Table 2.12 continued<br />
Housing Characteri<strong>st</strong>ics – 1980 to 2000<br />
St. Croix County Municipalities<br />
Municipal Unit 1980 1990 2000<br />
Town <strong>of</strong> Richmond 1980 1990 2000<br />
Total Housing Units 385 467 530<br />
Total Seasonal 0 1 0<br />
Total Vacant 11 14 6<br />
Total Occupied Units 374 453 524<br />
Owner Occupied Units 326 383 464<br />
Renter Occupied Units 48 70 60<br />
Single Family Units 325 384 468<br />
Multi-Family Units 30 45 18<br />
Mobile Homes 30 38 35<br />
Town <strong>of</strong> Rush River 1980 1990 2000<br />
Total Housing Units 154 151 173<br />
Total Seasonal 4 1 1<br />
Total Vacant 5 7 2<br />
Total Occupied Units 150 144 171<br />
Owner Occupied Units 15 128 160<br />
Renter Occupied Units 130 16 11<br />
Single Family Units 140 142 165<br />
Multi-Family Units 4 0 0<br />
Mobile Homes 6 9 6<br />
Town <strong>of</strong> St. Joseph 1980 1990 2000<br />
Total Housing Units 759 974 1,259<br />
Total Seasonal 52 64 45<br />
Total Vacant 39 89 66<br />
Total Occupied Units 668 885 1,193<br />
Owner Occupied Units 585 804 1,112<br />
Renter Occupied Units 83 81 81<br />
Single Family Units 618 875 1,163<br />
Multi-Family Units 33 41 31<br />
Mobile Homes 56 58 51<br />
Town <strong>of</strong> Somerset 1980 1990 2000<br />
Total Housing Units 583 722 963<br />
Total Seasonal 26 23 15<br />
Total Vacant 30 54 36<br />
Total Occupied Units 530 668 927<br />
Owner Occupied Units 460 589 848<br />
Renter Occupied Units 70 79 79<br />
Single Family Units 492 619 899<br />
Multi-Family Units 38 44 40<br />
Mobile Homes 30 59 60<br />
98 Housing Information
Table 2.12 continued<br />
Housing Characteri<strong>st</strong>ics – 1980 to 2000<br />
St. Croix County Municipalities<br />
Municipal Unit 1980 1990 2000<br />
Town <strong>of</strong> Springfield 1980 1990 2000<br />
Total Housing Units 267 268 299<br />
Total Seasonal 3 2 6<br />
Total Vacant 9 13 14<br />
Total Occupied Units 255 255 285<br />
Owner Occupied Units 210 208 260<br />
Renter Occupied Units 45 47 25<br />
Single Family Units 233 216 243<br />
Multi-Family Units 6 4 2<br />
Mobile Homes 25 48 52<br />
Town <strong>of</strong> Stanton 1980 1990 2000<br />
Total Housing Units 340 353 363<br />
Total Seasonal 0 1 0<br />
Total Vacant 8 15 11<br />
Total Occupied Units 332 338 352<br />
Owner Occupied Units 268 268 303<br />
Renter Occupied Units 64 70 49<br />
Single Family Units 291 291 354<br />
Multi-Family Units 14 9 6<br />
Mobile Homes 35 53 38<br />
Town <strong>of</strong> Star Prairie 1980 1990 2000<br />
Total Housing Units 631 761 1,079<br />
Total Seasonal 75 78 58<br />
Total Vacant 25 94 73<br />
Total Occupied Units 531 667 1,006<br />
Owner Occupied Units 457 579 908<br />
Renter Occupied Units 74 88 98<br />
Single Family Units 446 605 899<br />
Multi-Family Units 17 15 10<br />
Mobile Homes 93 141 165<br />
Town <strong>of</strong> Troy 1980 1990 2000<br />
Total Housing Units 795 1,033 1,328<br />
Total Seasonal 29 42 53<br />
Total Vacant 33 74 78<br />
Total Occupied Units 733 959 1,250<br />
Owner Occupied Units 602 825 1,139<br />
Renter Occupied Units 131 134 111<br />
Single Family Units 585 842 1,130<br />
Multi-Family Units 65 46 70<br />
Mobile Homes 116 145 83<br />
St. Croix County Conditions and Trends Report 99
Table 2.12 continued<br />
Housing Characteri<strong>st</strong>ics – 1980 to 2000<br />
St. Croix County Municipalities<br />
Municipal Unit 1980 1990 2000<br />
Town <strong>of</strong> Warren 1980 1990 2000<br />
Total Housing Units 250 327 437<br />
Total Seasonal 0 3 6<br />
Total Vacant 4 11 11<br />
Total Occupied Units 246 316 426<br />
Owner Occupied Units 219 285 401<br />
Renter Occupied Units 27 31 25<br />
Single Family Units 241 303 418<br />
Multi-Family Units 0 13 8<br />
Mobile Homes 0 11 7<br />
Village <strong>of</strong> Baldwin 1980 1990 2000<br />
Total Housing Units 678 822 1,144<br />
Total Seasonal 0 4 2<br />
Total Vacant 28 21 29<br />
Total Occupied Units 650 801 1,115<br />
Owner Occupied Units 469 517 655<br />
Renter Occupied Units 181 284 460<br />
Single Family Units 442 494 655<br />
Multi-Family Units 177 248 420<br />
Mobile Homes 59 80 65<br />
Village <strong>of</strong> Deer Park 1980 1990 2000<br />
Total Housing Units 92 98 94<br />
Total Seasonal 0 0 0<br />
Total Vacant 2 4 3<br />
Total Occupied Units 90 94 91<br />
Owner Occupied Units 67 64 67<br />
Renter Occupied Units 23 30 24<br />
Single Family Units 79 75 82<br />
Multi-Family Units 12 9 20<br />
Mobile Homes 1 14 2<br />
Village <strong>of</strong> Hammond 1980 1990 2000<br />
Total Housing Units 367 406 438<br />
Total Seasonal 0 1 0<br />
Total Vacant 18 9 5<br />
Total Occupied Units 349 397 433<br />
Owner Occupied Units 241 261 293<br />
Renter Occupied Units 108 136 140<br />
Single Family Units 222 247 298<br />
Multi-Family Units 112 118 106<br />
Mobile Homes 33 41 35<br />
100 Housing Information<br />
98
Table 2.12 continued<br />
Housing Characteri<strong>st</strong>ics – 1980 to 2000<br />
St. Croix County Municipalities<br />
Municipal Unit 1980 1990 2000<br />
Village <strong>of</strong> North Hudson 1980 1990 2000<br />
Total Housing Units 753 1122 1,358<br />
Total Seasonal 3 4 15<br />
Total Vacant 26 40 43<br />
Total Occupied Units 724 1,082 1,315<br />
Owner Occupied Units 539 77 1,022<br />
Renter Occupied Units 185 311 293<br />
Single Family Units 592 839 1,080<br />
Multi-Family Units 745 272 273<br />
Mobile Homes 5 11 12<br />
Village <strong>of</strong> Roberts 1980 1990 2000<br />
Total Housing Units 281 389 402<br />
Total Seasonal 0 2 2<br />
Total Vacant 11 23 10<br />
Total Occupied Units 270 366 392<br />
Owner Occupied Units 212 266 287<br />
Renter Occupied Units 59 100 105<br />
Single Family Units 161 156 188<br />
Multi-Family Units 45 84 74<br />
Mobile Homes 75 149 145<br />
Village <strong>of</strong> Somerset 1980 1990 2000<br />
Total Housing Units 318 417 659<br />
Total Seasonal 0 0 5<br />
Total Vacant 10 11 24<br />
Total Occupied Units 308 406 635<br />
Owner Occupied Units 186 215 333<br />
Renter Occupied Units 122 191 302<br />
Single Family Units 227 248 350<br />
Multi-Family Units 88 166 285<br />
Mobile Homes 3 3 2<br />
St. Croix County Conditions and Trends Report 101
Table 2.12 continued<br />
Housing Characteri<strong>st</strong>ics – 1980 to 2000<br />
St. Croix County Municipalities<br />
Municipal Unit 1980 1990 2000<br />
Village <strong>of</strong> Star Prairie 1980 1990 2000<br />
Total Housing Units 165 201 215<br />
Total Seasonal 0 0 0<br />
Total Vacant 20 8 3<br />
Total Occupied Units 145 193 212<br />
Owner Occupied Units 104 139 156<br />
Renter Occupied Units 41 54 56<br />
Single Family Units 123 151 159<br />
Multi-Family Units 36 45 33<br />
Mobile Homes 6 5 3<br />
Village <strong>of</strong> Wilson 1980 1990 2000<br />
Total Housing Units 58 57 69<br />
Total Seasonal 2 0 0<br />
Total Vacant 3 3 3<br />
Total Occupied Units 53 54 66<br />
Owner Occupied Units 45 44 59<br />
Renter Occupied Units 8 10 7<br />
Single Family Units 52 49 58<br />
Multi-Family Units 2 0 4<br />
Mobile Homes 2 8 4<br />
Village <strong>of</strong> Woodville 1980 1990 2000<br />
Total Housing Units 282 371 460<br />
Total Seasonal 0 0 2<br />
Total Vacant 10 19 14<br />
Total Occupied Units 272 352 446<br />
Owner Occupied Units 200 251 304<br />
Renter Occupied Units 72 101 142<br />
Single Family Units 191 195 250<br />
Multi-Family Units 61 90 133<br />
Mobile Homes 30 86 80<br />
City <strong>of</strong> Glenwood 1980 1990 2000<br />
Total Housing Units 379 418 491<br />
Total Seasonal 0 1 2<br />
Total Vacant 15 18 31<br />
Total Occupied Units 364 400 460<br />
Owner Occupied Units 265 284 315<br />
Renter Occupied Units 99 116 145<br />
Single Family Units 274 295 348<br />
Multi-Family Units 72 72 98<br />
Mobile Homes 33 51 48<br />
102 Housing Information
Municipal Unit 1980 1990 2000<br />
City <strong>of</strong> Hudson 1980 1990 2000<br />
Total Housing Units 2,055 2,634 3831<br />
Total Seasonal 0 7 22<br />
Total Vacant 55 119 144<br />
Total Occupied Units 2000 2,515 3,687<br />
Owner Occupied Units 1272 1,480 2,224<br />
Renter Occupied Units 728 1,035 1,463<br />
Single Family Units 1352 1,629 2,368<br />
Multi-Family Units 703 977 1,443<br />
Mobile Homes 0 28 18<br />
City <strong>of</strong> New Richmond 1980 1990 2000<br />
Total Housing Units 1665 2,025 2,657<br />
Total Seasonal 0 4 5<br />
Total Vacant 59 47 96<br />
Total Occupied Units 1,606 1,978 2,561<br />
Owner Occupied Units 1,042 1,285 1,619<br />
Renter Occupied Units 564 693 942<br />
Single Family Units 1,185 1,325 1,674<br />
Multi-Family Units 462 649 934<br />
Mobile Homes 18 51 35<br />
City <strong>of</strong> River Falls* 1980 1990 2000<br />
Total Housing Units 535 715 1,002<br />
Total Seasonal 0 0 4<br />
Total Vacant 4 14 8<br />
Total Occupied Units 531 701 994<br />
Owner Occupied Units 296 390 539<br />
Renter Occupied Units 235 311 455<br />
Single Family Units 305 422 591<br />
Multi-Family Units 229 291 373<br />
Mobile Homes 1 2 38<br />
source: U.S. Census<br />
*Portion <strong>of</strong> River Falls located in St. Croix County only.<br />
St. Croix County Conditions and Trends Report 103
Map 2.1<br />
Housing Unit Change – 1980-2000 – St. Croix County Municipalities<br />
104 Housing Information
3. TRANSPORTATION INFORMATION<br />
Element Context<br />
Transportation facilities have a significant influence on land use, development, and<br />
quality <strong>of</strong> life for County residents. This section includes a review <strong>of</strong> transportation<br />
facilities found in St. Croix County, including highways, rail, airports, bike facilities,<br />
pede<strong>st</strong>rian facilities, and transit. Transportation types primarily recreational in nature,<br />
such as snowmobile, ATV, and hiking trails, are not discussed in this section, but can be<br />
found in the community facilities and natural resources sections. For reference, a map <strong>of</strong><br />
the County’s roads, airports, and railroads can be found on the following page.<br />
St. Croix County, its local municipalities, and the State <strong>of</strong> Wisconsin together provide<br />
nearly the entire roadway infra<strong>st</strong>ructure for inter-<strong>county</strong> movements, intra-city<br />
movements, and the demands <strong>of</strong> new growth. This road sy<strong>st</strong>em also allows the<br />
movement <strong>of</strong> buses, bicycles, and pede<strong>st</strong>rians. A well-maintained and planned<br />
transportation sy<strong>st</strong>em can aid in economic development, support a variety <strong>of</strong> land uses,<br />
provide links among community facilities, and facilitate the provision <strong>of</strong> various public<br />
and emergency services.<br />
This element will function as a guide to identifying the County’s exi<strong>st</strong>ing and proposed<br />
road network, identifying major transportation needs, and supporting the goals and<br />
objectives <strong>of</strong> the other elements <strong>of</strong> the St. Croix County Comprehensive Plan.<br />
This section was drafted in the context <strong>of</strong> regional, <strong>st</strong>ate, and national transportation<br />
planning guidelines and principles. Numerous exi<strong>st</strong>ing State and local transportation<br />
plans <strong>of</strong> regional significance are noted in Special Addendum: Inventory <strong>of</strong> Exi<strong>st</strong>ing<br />
Plans, Programs, & Land Use Policies in We<strong>st</strong> Central Wisconsin and are considered in<br />
the development <strong>of</strong> this plan. Transportation issues, needs, and <strong>st</strong>rategies specific to<br />
individual communities will be addressed in their respective plans.<br />
St. Croix County Conditions and Trends Report 105
1<br />
W<br />
67,300<br />
Map 3.1 – St. Croix County Roads, Airports, and Railroads<br />
N<br />
S<br />
E<br />
12,700<br />
13,800<br />
Rail<br />
County<br />
Local<br />
State<br />
US<br />
Airport<br />
5<br />
3 5 "!<br />
"! 6 4<br />
Traffic Count Location<br />
3 5 "!<br />
"! 3 5<br />
#<br />
.-, 94<br />
#<br />
#<br />
1 2<br />
5,500<br />
13,700<br />
#<br />
31<br />
# 4<br />
#<br />
29<br />
30 #<br />
6<br />
6,800<br />
#<br />
8<br />
2,100<br />
13,300<br />
19<br />
34<br />
#<br />
11,000<br />
# 4,100<br />
# 7<br />
32<br />
#<br />
#<br />
1,600<br />
7,500<br />
17,300<br />
18<br />
9<br />
4,700<br />
#<br />
33<br />
#<br />
#<br />
6,700<br />
35<br />
#<br />
(/ 12<br />
960<br />
40,800<br />
13<br />
4,200<br />
6 5 "!<br />
e#<br />
#<br />
16,80014<br />
10,300<br />
6 5 "! #<br />
"! 65<br />
New Richmond<br />
Municipal Airport<br />
St. Croix County<br />
106 Transportation Information<br />
6 4 "!<br />
Union P acific Railroad<br />
17<br />
#<br />
15<br />
16 #<br />
36<br />
#<br />
4,300<br />
#<br />
10<br />
#<br />
37<br />
8,300<br />
#<br />
1,100<br />
4,400<br />
2,100<br />
1,800<br />
38 #<br />
1,100 # 39<br />
20<br />
3,100<br />
e#<br />
#<br />
"! 4 6<br />
# 21<br />
23<br />
24<br />
(/ 63<br />
(/ 63<br />
(/ 63<br />
Baldwin Air<strong>st</strong>rip<br />
(/ 12<br />
6 4 "!<br />
Wisconsin Central Limi ted Rai lroad<br />
#<br />
#<br />
4,200<br />
4,600<br />
4,400<br />
4,100<br />
#<br />
#<br />
3,400<br />
31,600<br />
820 # 25<br />
2,300<br />
.-, 94<br />
1,500<br />
#<br />
#<br />
11 12<br />
28<br />
3<br />
22<br />
1,100<br />
# 40<br />
1,400<br />
41<br />
#<br />
27<br />
12 8 "!<br />
26 #<br />
12 8 "!<br />
#<br />
1,800<br />
"! 2 9<br />
1 70 "!
Background Data/Exi<strong>st</strong>ing Conditions<br />
Highways<br />
St. Croix County is served by 1,923 miles <strong>of</strong><br />
roads under <strong>st</strong>ate, <strong>county</strong> and local<br />
jurisdiction (see Table 3.1). Major<br />
north/south highways include WIS 35, WIS<br />
65, US 63, and WIS 128. Inter<strong>st</strong>ate Highway<br />
94, US 12, and WIS 64 are major ea<strong>st</strong>/we<strong>st</strong><br />
highways.<br />
Table 3.1 - Road Mileage by Jurisdiction - 2008<br />
Jurisdiction Miles Percent <strong>of</strong> Total<br />
State 204.1 10.6<br />
County 338.6 17.6<br />
Towns 1117.8 58.1<br />
Villages 106.3 5.5<br />
Cities 156.1 8.1<br />
TOTAL 1922.9 100.0<br />
source: WisDOT, Wisconsin Information Sy<strong>st</strong>em for Local Roads,<br />
January 1, 2008.<br />
In St. Croix County, Inter<strong>st</strong>ate 94 is the only highway classified as backbone routes in the<br />
Wisconsin Department <strong>of</strong> Transportation (WisDOT) Corridors 2020 Plan. US 63 is<br />
identified as a Connector route. The backbone sy<strong>st</strong>em is a collection <strong>of</strong> multilane<br />
highways such as the inter<strong>st</strong>ate sy<strong>st</strong>em and much <strong>of</strong> the <strong>st</strong>ate trunk highway sy<strong>st</strong>em that<br />
serve longer interregional trips within the <strong>st</strong>ate and between Wisconsin and the nation.<br />
The Connector routes are a set <strong>of</strong> two- and four-lane highways that connect key<br />
communities and regional economic centers to the backbone routes.<br />
Roads can be generally classified into three<br />
categories - arterials, collectors and local roads.<br />
The type <strong>of</strong> service it provides determines a<br />
road’s classification. Typically, arterials provide<br />
the lea<strong>st</strong> amount <strong>of</strong> access and highe<strong>st</strong> level <strong>of</strong><br />
mobility, while local <strong>st</strong>reets provide the mo<strong>st</strong><br />
access and lowe<strong>st</strong> level <strong>of</strong> mobility. Collector<br />
roads provide a combination <strong>of</strong> access and<br />
mobility.<br />
The functional classification <strong>of</strong> the rural areas <strong>of</strong><br />
the County is shown on Map 3.2. Three<br />
communities have are over the population<br />
threshold <strong>of</strong> 5,000 persons, considered to be<br />
“urban” for the purposes <strong>of</strong> functional<br />
classification: Hudson, New Richmond, and<br />
River Falls (See Maps 3.3, 3.4, and 3.5).<br />
The backbone and connector routes, which link Wisconsin’s economic and tourism<br />
centers, are all classified as arterials and are designed to provide a high level <strong>of</strong> mobility<br />
between communities. Typically, arterials accommodate higher levels <strong>of</strong> traffic at higher<br />
speeds than collectors. The actual number <strong>of</strong> vehicles that a road can accommodate is<br />
determined by a number <strong>of</strong> factors, including the number <strong>of</strong> travel lanes, po<strong>st</strong>ed speed<br />
limit and the level <strong>of</strong> access the road provides. Generally, a two-lane road can<br />
accommodate up to 13,500 vehicles per day. A four-lane road with a median can<br />
accommodate between 13,500 and 30,000 vehicles per day.<br />
St. Croix County Conditions and Trends Report 107
St. Croix County is directly on the Inter<strong>st</strong>ate 94 corridor, the principal arterial between<br />
Minneapolis-St. Paul and de<strong>st</strong>inations to the ea<strong>st</strong>, such as Milwaukee and Chicago.<br />
Traffic on the Eau Claire-Hudson portion <strong>of</strong> the Inter<strong>st</strong>ate, which runs through St. Croix<br />
County, has been growing significantly. This <strong>st</strong>retch <strong>of</strong> Inter<strong>st</strong>ate 94 experiences traffic<br />
volumes <strong>of</strong> 40,000 to 70,000 vehicles a day and is the second mo<strong>st</strong>-traveled segment <strong>of</strong><br />
inter<strong>st</strong>ate highway in the State <strong>of</strong> Wisconsin. By 2020, average daily traffic volumes at<br />
the I-94 bridge over the St. Croix River are projected to exceed 85,000 vehicles per day.<br />
As shown in Table 3.2, traffic volumes have been generally increasing throughout the<br />
County. In some cases in Table 3.2, a particular highway segment’s count can show a<br />
decline when alternative routes are con<strong>st</strong>ructed or improved.<br />
Of the State and US highways located in St. Croix County, the State Highway Plan 2020<br />
identified Inter<strong>st</strong>ate 94 from the St. Croix River to US 63 (Baldwin exit), WIS 65<br />
between New Richmond and WIS 12, and a small piece <strong>of</strong> WIS 35 from North Hudson to<br />
Houlton as facilities that would experience moderate conge<strong>st</strong>ion by the year 2020 if no<br />
capacity expansion improvements were made. Extreme or severe conge<strong>st</strong>ion were<br />
projected for WIS 64 from Houlton to New Richmond, a small segment <strong>of</strong> WIS 35<br />
through Hudson, and WIS 63 from Inter<strong>st</strong>ate 94 into Baldwin. Only WIS 64 was already<br />
a legislatively approved major project. This project has since been completed.<br />
108 Transportation Information
Table 3.2 - Traffic Volume Hi<strong>st</strong>ory (1997-2006)<br />
Map ID<br />
(Map 3.1) Location<br />
1997 2000 2004 2006<br />
Percent<br />
Change (2001-<br />
2006)<br />
1 I-94 (at St. Croix River) 67,400 # 72,800 * 67,300 67,300 $ 0.00% -0.15%<br />
2 I-94 (we<strong>st</strong> <strong>of</strong> WIS 65) 30,400 # 39,700 * 40,800 35,500 -14.93% 14.37%<br />
3 I-94 (we<strong>st</strong> <strong>of</strong> County B) 28,900 # 30,100 * 31,600 32,600 3.07% 11.35%<br />
4 WIS 35 (south <strong>of</strong> Vine St. - Hudson) 14,000 15,000 13,800 12,400 -11.29% -12.90%<br />
5 WIS 35/WIS 64 (north <strong>of</strong> County E) 9,000 11,300 12,700 11,900 -6.72% 24.37%<br />
6 WIS 35/WIS 64 (we<strong>st</strong> <strong>of</strong> County I) 9,500 10,600 13,700 8,100 -69.14% -17.28%<br />
7 WIS 35 (north <strong>of</strong> WIS 64) 4,000 5,400 6,800 5,800 -17.24% 31.03%<br />
8 WIS 35 (north <strong>of</strong> County H) 3,000 3,600 4,100 3,700 -10.81% 18.92%<br />
9 WIS 64 (we<strong>st</strong> <strong>of</strong> WIS 65) 6,200 5,900 6,700 9,400 28.72% 34.04%<br />
10 WIS 64 (ea<strong>st</strong> <strong>of</strong> WIS 65) 4,000 5,400 4,400 3,900 -12.82% -2.56%<br />
11 WIS 64 (ea<strong>st</strong> <strong>of</strong> US 63) 4,100 4,400 4,600 4,500 -2.22% 8.89%<br />
12 WIS 64 (ea<strong>st</strong> <strong>of</strong> WIS 128) 1,100 1,400 1,500 1,500 $ 0.00% 26.67%<br />
13 WIS 65 (south <strong>of</strong> County H) 4,600 4,200 4,200 4,900 14.29% 6.12%<br />
14 WIS 65(north <strong>of</strong> 11th St. - New Rich.) 16,700 16,700 16,800 17,900 6.15% 6.70%<br />
15 WIS 65 (south <strong>of</strong> County G) 5,300 6,700 8,300 8,200 -1.22% 35.37%<br />
16 WIS 65/US 12 (V. Roberts) 6,200 7,300 10,300 8,900 -15.73% 30.34%<br />
17 WIS 65 (north <strong>of</strong> County JJ) 3,500 3,600 4,300 4,300 0.00% 18.60%<br />
18 WIS 35 (north <strong>of</strong> County U) 10,600 12,400 11,000 13,900 20.86% 23.74%<br />
19 WIS 35 (north <strong>of</strong> County FF) 10,200 11,100 $ 17,300 16,900 -2.37% 39.64%<br />
20 WIS 46 (north <strong>of</strong> County H) 3,900 3,900 4,200 4,200 $ 0.00% 7.14%<br />
21 WIS 46 (north <strong>of</strong> WIS 64) 3,000 3,400 3,100 3,500 11.43% 14.29%<br />
22 US 63 (north <strong>of</strong> WIS 64) 3,200 3,200 3,400 4,000 15.00% 20.00%<br />
23 US 63 (north <strong>of</strong> County DD) 4,100 4,500 4,400 4,700 6.38% 12.77%<br />
24 US 63 (south <strong>of</strong> I-94) 2,700 4,800 4,100 4,500 8.89% 40.00%<br />
25 WIS 128 (south <strong>of</strong> County S) 890 760 820 810 -1.23% -9.88%<br />
26 Wis 128 (north <strong>of</strong> US 12) 1,600 2,300 2,300 2,300 0.00% 30.43%<br />
27 WIS 128 (north <strong>of</strong> WIS 29) 1,100 1,700 1,800 1,700 -5.88% 35.29%<br />
28 US 12 (we<strong>st</strong> <strong>of</strong> County BB) 2,900 2,700 3,600 3,100 -16.13% 6.45%<br />
29 Carmicheal Rd. (north <strong>of</strong> I-94) 10,200 11,400 13,300 12,800 -3.91% 20.31%<br />
30 County F (north <strong>of</strong> County MM) 3,800 5,300 5,500 4,800 -14.58% 20.83%<br />
31 County V (south <strong>of</strong> County E) 1,600 1,900 2,100 2,100 $ 0.00% 23.81%<br />
32 County I (south <strong>of</strong> V. Somerset) 1,800 2,400 1,600 3,300 51.52% 45.45%<br />
33 County A (north <strong>of</strong> County E) 3,000 3,800 4,700 4,500 -4.44% 33.33%<br />
34 County A (south <strong>of</strong> County I) 4,600 6,400 7,500 8,700 13.79% 47.13%<br />
35 County E (we<strong>st</strong> <strong>of</strong> WIS 65) 560 640 960 960 $ 0.00% 41.67%<br />
36 County M (Ea<strong>st</strong> <strong>of</strong> County JJ) 910 1,400 1,100 1,100 $ 0.00% 17.27%<br />
37 County G (we<strong>st</strong> <strong>of</strong> County GG) 1,800 2,100 2,100 2,300 8.70% 21.74%<br />
38 County T (north <strong>of</strong> County E) 1,300 1,400 1,800 1,900 5.26% 31.58%<br />
39 County T (north <strong>of</strong> County M) 870 1,000 1,100 1,100 $ 0.00% 20.91%<br />
40 County D (north <strong>of</strong> County G) 930 1,400 1,400 1,400 $ 0.00% 33.57%<br />
41 County B (south <strong>of</strong> County N) 940 1,100 1,100 1,100 $ 0.00% 14.55%<br />
source: Wisconsin Highway Traffic Volume Data, WisDOT. # denotes 1999 counts; * denotes 2001 counts; $ denotes count fromprevious cycle<br />
St. Croix County Conditions and Trends Report 109<br />
Percent<br />
Change<br />
(1993-2006)
Map 3.2 – St. Croix County Rural Functional Classification<br />
110 Transportation Information
Map 3.3 – Hudson/N. Hudson Urban Functional Classification<br />
St. Croix County Conditions and Trends Report 111
Map 3.4 – New Richmond Urban Functional Classification<br />
112 Transportation Information
Map 3.5 – River Falls (part) Urban Functional Classification<br />
St. Croix County Conditions and Trends Report 113
Table 3.3 – Local Road mileage by Municipality and Jurisdiction<br />
County Jurisdiction Municipal Jurisdiction<br />
Municipality Gross Road County Municpal<br />
Name<br />
Miles Miles Miles Arterial Collector Local Arterial Collector Local<br />
T. Baldwin 67.32 14.60 52.72 10.28 4.32 52.72<br />
T. Cady 57.38 11.45 45.93 6.75 4.70 45.93<br />
T. Cylon 47.31 9.30 38.01 0.65 8.65 38.01<br />
T. Eau Galle 65.68 17.49 48.19 11.46 6.03 48.19<br />
T. Emerald 64.16 17.71 46.45 8.94 8.77 46.45<br />
T. Erin Prairie 65.21 18.04 47.17 14.95 3.09 47.17<br />
T. Fore<strong>st</strong> 61.54 15.29 46.25 6.10 9.19 46.25<br />
T. Glenwood 64.34 18.00 46.34 13.26 4.74 46.34<br />
T. Hammond 74.68 16.20 58.48 16.20 58.48<br />
T. Hudson 109.06 10.62 98.44 5.41 4.90 0.31 4.08 10.45 83.91<br />
T. Kinnickinnic 64.65 21.42 43.23 0.51 13.35 7.56 43.23<br />
T. Pleasant Valley 36.80 17.95 18.85 12.08 5.87 18.85<br />
T. Richmond 82.61 15.79 66.82 2.97 12.82 0.20 1.10 65.52<br />
T. Rush River 34.73 13.46 21.27 9.36 4.10 21.27<br />
T. Somerset 115.69 15.00 100.69 11.83 3.17 6.75 93.94<br />
T. Springfield 57.11 22.85 34.26 10.69 12.16 34.26<br />
T. Stanton 55.66 13.06 42.60 0.11 11.92 1.03 0.03 42.57<br />
T. Star Prairie 81.84 19.57 62.27 2.06 17.51 0.08 1.00 61.19<br />
T. St. Joseph 86.17 21.21 64.96 0.27 20.94 11.41 53.55<br />
T. Troy 102.85 14.96 87.89 6.71 4.16 4.09 0.06 12.72 75.11<br />
T. Warren 53.06 6.13 46.93 6.13 3.03 43.90<br />
Village <strong>of</strong> Baldwin 23.64 0.18 23.46 0.18 0.88 22.58<br />
V. Deer Park 3.65 0.62 3.03 0.37 0.25 3.03<br />
V. Hammond 12.40 0.00 12.40 2.29 10.11<br />
V. North Hudson 17.45 0.00 17.45 3.80 13.65<br />
V. Roberts 12.86 0.03 12.83 0.03 2.06 10.77<br />
V. Somerset 16.78 0.00 16.78 2.81 13.97<br />
V. Spring Valley 1.27 0.98 0.29 0.98 0.29<br />
V. Star Prairie 6.97 2.07 4.90 2.07 4.90<br />
V. Wilson 4.33 0.00 4.33 4.33<br />
V. Woodville 11.30 0.46 10.84 0.46 2.11 8.73<br />
C. Glenwood Springs 9.79 1.06 8.73 1.06 0.25 8.48<br />
C. Hudson 70.64 0.19 70.45 0.19 11.62 6.84 51.99<br />
C. New Richmond 58.38 2.27 56.11 1.42 0.69 0.16 3.55 5.11 47.45<br />
C. River Falls 21.53 0.68 20.85 0.36 0.32 1.32 0.83 18.70<br />
TOTALS 1718.84 338.64 1380.20 20.01 228.68 89.95 20.94 73.44 1285.82<br />
source: Wisconsin Information Sy<strong>st</strong>em for Local Roads, WisDOT, January 1, 2008.<br />
Highway Projects in the County<br />
Various con<strong>st</strong>ruction and repair projects are programmed for the State highways in St.<br />
Croix County between 2008 and 2013. A total <strong>of</strong> 102 miles are scheduled for<br />
improvement over this six-year period (See Table 3.4).<br />
114 Transportation Information
Hwy Project Title<br />
35 North Hudson - Houlton Road<br />
63 Ellsworth - Baldwin Road<br />
63 Baldwin - Clear Lake Road<br />
63 Baldwin - Clear Lake Road<br />
63 Baldwin - Deer Park Road<br />
63 Ellsworth - Baldwin Road<br />
64<br />
New Richmond - Connorsville<br />
Road<br />
64 New Richmond - Connorsville<br />
35 River Falls - Hudson Road<br />
65 River Falls - Roberts Road<br />
65 River Falls - Roberts<br />
94 Hudson - Menomonie<br />
94 Hudson - Menomonie<br />
35 River Falls - Hudson Road<br />
35 Hudson - Somerset Road<br />
63 Baldwin - Clear Lake Road<br />
E<strong>st</strong>imated<br />
Project Co<strong>st</strong><br />
$1,000,000 -<br />
$1,999,999<br />
$3,000,000 -<br />
$3,999,999<br />
$250,000 -<br />
$499,999<br />
$500,000 -<br />
$749,999<br />
$250,000 -<br />
$499,999<br />
$3,000,000 -<br />
$3,999,999<br />
$3,000,000 -<br />
$3,999,999<br />
$250,000 -<br />
$499,999<br />
$2,000,000 -<br />
$2,999,999<br />
$2,000,000 -<br />
$2,999,999<br />
$100,000 -<br />
$249,999<br />
$5,000,000 -<br />
$5,999,999<br />
$8,000,000 -<br />
$8,999,999<br />
$1,000,000 -<br />
$1,999,999<br />
$500,000 -<br />
$749,999<br />
$4,000,000 -<br />
$4,999,999<br />
Year<br />
(SFY)<br />
Project Description<br />
2008 Mill and resurface exi<strong>st</strong>ing roadway.<br />
2008<br />
2008<br />
2008<br />
2008<br />
Surface mill and repave the exi<strong>st</strong>ing roadway with new blacktop.<br />
Replace the signal lights intersections at Fern Street and Cedar Street<br />
and upgrade left turn lanes.<br />
The USH 63 bridge over the Branch <strong>of</strong> Dry Run Creek will be replaced<br />
with a new <strong>st</strong>ructure and approaches.<br />
Widen roadway to the ea<strong>st</strong> to con<strong>st</strong>ruct a left turn lane, through lane and<br />
right turn lane for USH 63 north bound approach.<br />
Replace the USH 63 bridge over the Rush River (B-55-0610) and<br />
recon<strong>st</strong>ruct the approaches at the exi<strong>st</strong>ing location.<br />
2009 Surface mill and repave the exi<strong>st</strong>ing roadway with new blacktop.<br />
2009<br />
2009<br />
2010<br />
2010<br />
2010<br />
2010<br />
Mill and relay exi<strong>st</strong>ing asphaltic surface and overlay with new blacktop.<br />
Replace the Willow River Bridge and upgrade CTH T intersection<br />
withturn lanes.<br />
Highway safety improvement, recon<strong>st</strong>ructing the CTH T intesection at<br />
STH 64.<br />
Mill the exi<strong>st</strong>ing pavement and relay the old pavement and base and add<br />
a new new layer <strong>of</strong> black top.<br />
Mill and relay exi<strong>st</strong>ing asphaltic surface and overlay with new blacktop.<br />
Replace beam guard and exi<strong>st</strong>ing permanent signing as necessary.<br />
Bridge rehabilitation, overlay the bridge deck on STH 65 over the CNW<br />
Railroad.<br />
Resurface Inter<strong>st</strong>ate 94 from STH 65 to CTH T. This will be a third<br />
overlay and will be night con<strong>st</strong>ruction.<br />
2010 Repaint WB IH 94 St Croix River Bridge.<br />
2011<br />
2011<br />
2011<br />
63 Baldwin - Clear Lake Road $100,000 or less 2011<br />
63 Baldwin - Clear Lake Road<br />
63 Baldwin - Clear Lake Road<br />
64<br />
Table 3.4 - WisDOT 6-year Plan Projects for St. Croix County<br />
New Richmond - Connorsville<br />
Road<br />
94 Hudson - Menomonie<br />
94 Hudson - Menomonie<br />
128 Elmwood - Glenwood City Road<br />
$100,000 -<br />
$249,999<br />
$1,000,000 -<br />
$1,999,999<br />
$1,000,000 -<br />
$1,999,999<br />
$3,000,000 -<br />
$3,999,999<br />
$3,000,000 -<br />
$3,999,999<br />
$250,000 -<br />
$499,999<br />
2011<br />
2011<br />
2011<br />
Remove at grade intersection and con<strong>st</strong>ruct new bridge for CTH 'FF'<br />
over STH 35.<br />
Bridge rehabilitaion overlay the exi<strong>st</strong>ing Lake Mallalieu bridge (B-55-<br />
0073) deck with concrete.<br />
Recondition the exi<strong>st</strong>ing roadway and improve the intersections at CTH<br />
E, CTH G and the north and south bound passing lanes.<br />
Pavement replacement, partial removal <strong>of</strong> exi<strong>st</strong>ing asphalt,mill and relay<br />
exi<strong>st</strong>ing asphalt and repave with new asphalt. No interesction<br />
improvements are proposed for this project.<br />
Con<strong>st</strong>ruct a single Lane Roundabout at the intersections <strong>of</strong> USH 63,<br />
STH 64 and STH 46.<br />
Pavement replacement, partial removal <strong>of</strong> exi<strong>st</strong>ing asphalt,mill and relay<br />
exi<strong>st</strong>ing asphalt and repave with new asphalt. No interesction<br />
improvements are proposed for this project.<br />
Mill the exi<strong>st</strong>ing surface and repave with new blacktop, replace beam<br />
guard and permanent signing as necessary.<br />
2011 Resurface exi<strong>st</strong>ing pavement.<br />
2011 Resurface exi<strong>st</strong>ing pavement.<br />
2011<br />
Bridge rehabilitation, re-decking the exi<strong>st</strong>ing CNW Railroad B-55-0008<br />
<strong>st</strong>ructure.<br />
St. Croix County Conditions and Trends Report 115
Table 3.4 - WisDOT 6-year Plan Projects for St. Croix County (cont.)<br />
Hwy Project Title<br />
63 Baldwin - Clear Lake Road<br />
65 River Falls - Roberts<br />
94 Hudson - Menomonie<br />
94 Hudson - Menomonie<br />
94 Hudson - Menomonie<br />
35 Village North Hudson, 6th Street<br />
35 River Falls - Hudson Road<br />
94 Hudson - Menomonie<br />
94 Hudson - Menomonie<br />
94 Hudson - Menomonie<br />
94 Hudson - Menomonie<br />
E<strong>st</strong>imated<br />
Project Co<strong>st</strong><br />
$1,000,000 -<br />
$1,999,999<br />
$1,000,000 -<br />
$1,999,999<br />
$2,000,000 -<br />
$2,999,999<br />
$15,000,000 or<br />
greater<br />
$1,000,000 -<br />
$1,999,999<br />
$500,000 -<br />
$749,999<br />
$9,000,000 -<br />
$9,999,999<br />
$3,000,000 -<br />
$3,999,999<br />
$3,000,000 -<br />
$3,999,999<br />
$3,000,000 -<br />
$3,999,999<br />
$3,000,000 -<br />
$3,999,999<br />
Year<br />
(SFY)<br />
2012<br />
2012<br />
Project Description<br />
Pavement replacement, partial removal <strong>of</strong> exi<strong>st</strong>ing asphalt,mill and relay<br />
exi<strong>st</strong>ing asphalt and repave with new asphalt. No interesction<br />
improvements are proposed for this project.<br />
Milling the exi<strong>st</strong>ing surface and repave with new blacktop, replace<br />
beam guard and permanent signing as necessary.<br />
2012 Replace the exi<strong>st</strong>ing CTH B bridge (B-55-0014) over Inter<strong>st</strong>ate 94.<br />
2012<br />
2012<br />
Replacement <strong>of</strong> STH 65 bridge <strong>of</strong> IH 94 and con<strong>st</strong>ruction <strong>of</strong> the portion<br />
<strong>of</strong> STH 65 between the ramp termini that will fit with an ultimate 4-lane<br />
STH 65 expressway bypass <strong>of</strong> the Village <strong>of</strong> Roberts.<br />
Roadway Maintenance, concrete patches at various locations on<br />
Inter<strong>st</strong>ate Highway 94.<br />
2013 Roadway maintenance<br />
2013<br />
source: Six Year Highway Improvement Program: 2008-2013, WisDOT, 2008.<br />
Eliminating the at grade crossing <strong>of</strong> Radio Road and STH 35 with a<br />
new bridge (diamond interchange) at the exi<strong>st</strong>ing location.<br />
2013 Resurface exi<strong>st</strong>ing pavement.<br />
2013 Resurface exi<strong>st</strong>ing pavement.<br />
2013 Resurface exi<strong>st</strong>ing pavement.<br />
2013 Resurface exi<strong>st</strong>ing pavement.<br />
116 Transportation Information
Bridges<br />
There are a total <strong>of</strong> 284 bridges in St. Croix County.<br />
WisDOT generally defines a bridge as any <strong>st</strong>ructure<br />
spanning 20 feet or more that carries motor vehicle traffic.<br />
Of these bridges, 100 are under State ownership and<br />
maintenance, 62 are owned by the County, and 122 are<br />
under local ownership (See Table 3.5).<br />
State and local bridges are inspected at lea<strong>st</strong> once every two<br />
years. WisDOT is responsible for inspections <strong>of</strong> all bridges<br />
along the <strong>st</strong>ate highway sy<strong>st</strong>em. Municipalities handle<br />
inspections for bridges along the local roadway sy<strong>st</strong>em.<br />
WisDOT and local governments follow federal guidelines<br />
in their bridge inspection and maintenance procedures.<br />
Bridges are rated and categorized in terms <strong>of</strong> their<br />
functional and <strong>st</strong>ructural situation.<br />
Functionally obsolete is an engineering term frequently<br />
used to describe older bridges that no longer meet modern<br />
geometric <strong>st</strong>andards. For example, it could refer to a bridge<br />
with narrow lanes or shoulders. A bridge classified as<br />
functionally obsolete does not mean the bridge is unsafe<br />
for public travel. Structurally deficient is an engineering<br />
term used to describe a bridge with one or more elements<br />
that will require attention. The classification does not<br />
mean the bridge is unsafe for travel. For example, it could<br />
refer to a combination <strong>of</strong> elements on a bridge such as<br />
potholes on a bridge deck or ru<strong>st</strong> on metal trusses. These<br />
have little to no impact on a bridge’s overall safe<br />
function. Depending on the extent <strong>of</strong> the <strong>st</strong>ructural<br />
deficiency, the bridge may be load-po<strong>st</strong>ed until<br />
improvements are completed.<br />
There are 3 bridges under <strong>st</strong>ate ownership that are classified<br />
as either <strong>st</strong>ructurally deficient or functionally obsolete, or<br />
both, as well as 12 under <strong>county</strong> or local ownership (See<br />
Table 3.6).<br />
Table 3.5 - Ownership <strong>of</strong> Bridges<br />
Owner<br />
# <strong>of</strong><br />
Bridges<br />
State <strong>of</strong> Wisconsin 100<br />
St. Croix County 62<br />
T. Baldwin 6<br />
T. Cady 6<br />
T. Cylon 8<br />
T. Eau Galle 10<br />
T. Emerald 14<br />
T. Erin Prairie 9<br />
T. Fore<strong>st</strong> 5<br />
T. Glenwood 8<br />
T. Hammond 10<br />
T. Hudson 2<br />
T. Kinnickinnic 8<br />
T. Pleasant Valley 1<br />
T. Richmond 9<br />
T. Rush River 5<br />
T. St. Joseph 0<br />
T. Somerset 0<br />
T. Springfield 3<br />
T. Stanton 0<br />
T. Star Prairie 1<br />
T. Troy 1<br />
T. Warren 1<br />
V. Baldwin 3<br />
V. Deer Park 0<br />
V. Hammond 0<br />
V. North Hudson 0<br />
V. Roberts 0<br />
V. Somerset 1<br />
V. Spring Valley* 0<br />
V. Star Prairie 0<br />
V. Wilson 0<br />
V. Woodville 2<br />
C. Glenwood City 0<br />
C. Hudson 4<br />
C. New Richmond 1<br />
C. River Falls* 2<br />
Total 282<br />
* only for portions in St.Croix County<br />
source:WisDOT, 2008.<br />
St. Croix County Conditions and Trends Report 117
Table 3.6 - Functionally Obsolete and Structurally Deficient Bridges in St. Croix County<br />
State<br />
Bridge<br />
Year<br />
I.D. Owner Location Bridge On Bridge Over Built Deficiency<br />
S.D. AND<br />
P550943 County T. Erin Prairie CTH T Kinnickinnic River 1974 F.O.<br />
S.D. AND<br />
B550628 State T. Erin Prairie USH 63 Br. Dry Run Creek 1939 F.O.<br />
S.D. AND<br />
P550950 Town T. Glenwood W. Boundary Rd. Sand Creek 1975 F.O.<br />
S.D. AND<br />
B550159 County T. Kinnickinnic CTH J Kinnickinnic River 1936 F.O.<br />
S.D. AND<br />
P550940 Town T. Rush River 50th Ave Rush River 1960 F.O.<br />
S.D. AND<br />
B550919 State T. St. Joseph STH 64 St. Croix River 1931 F.O.<br />
B550180 State T. Somerset CTH I STH 35/64 2004 F.O.<br />
S.D. AND<br />
P550920 Town T. Warren 150th St Kinnickinnic River 1945 F.O.<br />
B550024 County V. Star Prairie CTH M<br />
Carmichael RD<br />
Apple River 1957 F.O.<br />
B550133 City C. Hudson<br />
NB<br />
Carmichael RD<br />
Albert Road 1991 F.O.<br />
B550132 City C. Hudson<br />
SB Albert Road 1991 F.O.<br />
S.D. AND<br />
P550709 City C. Hudson Walnut St St. Croix River 1940 F.O.<br />
C. New<br />
STH 64-STH 65-<br />
B550091 City Richmond Knowles Ave Willow River 1924 F.O.<br />
B550140 City C. River Falls Main St. Kinnickinnic River 1992 F.O.<br />
S.D. AND<br />
B550223 City C. River Falls New Ca<strong>st</strong>le Dr. Wet Land 2003 F.O.<br />
source: WisDOT, 2008.<br />
118 Transportation Information
Ru<strong>st</strong>ic Roads Sy<strong>st</strong>em<br />
The Ru<strong>st</strong>ic Roads Sy<strong>st</strong>em in Wisconsin was created<br />
by the 1973 <strong>st</strong>ate legislature to help citizens and local<br />
units <strong>of</strong> government preserve what remains <strong>of</strong><br />
Wisconsin's scenic, lightly traveled country roads for<br />
the leisurely enjoyment <strong>of</strong> bikers, hikers and<br />
motori<strong>st</strong>s. Unique brown and yellow signs mark the<br />
routes <strong>of</strong> all <strong>of</strong>ficially designated Ru<strong>st</strong>ic Roads.<br />
These routes provide bikers, hikers and motori<strong>st</strong>s<br />
with an opportunity to casually travel through some<br />
<strong>of</strong> Wisconsin's scenic countryside. All Ru<strong>st</strong>ic Roads<br />
remain under local jurisdiction and are eligible for the<br />
same <strong>st</strong>ate aid as other public highways.<br />
There are three ru<strong>st</strong>ic roads in St. Croix County (See Map 3.6). Two (#3 and #4) are in<br />
the Glen Hills area south <strong>of</strong> Glenwood City and north <strong>of</strong> Wilson. Ru<strong>st</strong>ic Road #3 follows<br />
the we<strong>st</strong>ern edge <strong>of</strong> the wooded Glen Hills County Park and area farmland for 3.6 miles.<br />
Ru<strong>st</strong>ic Road #4 borders the ea<strong>st</strong> side <strong>of</strong> the County Park for 4.6 miles.<br />
St. Croix County's third designated Ru<strong>st</strong>ic Road (#13) passes through hilly terrain across<br />
the scenic Willow River. This route meanders along Trout Brook Road for 3 miles<br />
through heavily wooded areas pa<strong>st</strong> several artesian wells.<br />
Map 3.6 Ru<strong>st</strong>ic Roads in St. Croix County<br />
Ru<strong>st</strong>ic Roads 3 and 4<br />
source: WisDOT travel information website<br />
Officially designated Ru<strong>st</strong>ic Road sign<br />
Ru<strong>st</strong>ic Road 13<br />
St. Croix County Conditions and Trends Report 119
Access Management<br />
Access management includes planning the number and location <strong>of</strong> driveways on<br />
roadways. This practice helps maintain safe and efficient traffic movement on roadways,<br />
and access to and from property, particularly in more urban areas. Road function and<br />
safety increase as the number <strong>of</strong> access points decrease.<br />
WisDOT employs three types <strong>of</strong> access control authorized by <strong>st</strong>ate <strong>st</strong>atutes. They are<br />
referred to as Wisconsin Statutes (Wis. Stats.) 84.09, 84.25 and 84.295. A short summary<br />
<strong>of</strong> the <strong>st</strong>ate <strong>st</strong>atutes follows, but it should be noted that the actual content <strong>of</strong> the <strong>st</strong>atutes is<br />
significantly more detailed, and many special <strong>conditions</strong> and provisions are not included<br />
in this text. The type <strong>of</strong> access control that is imposed on various highway road segments<br />
influences how that segment is managed.<br />
• Wis. Stats. 84.09 (purchase access control) – WisDOT acquires land by gift,<br />
devise, purchase or condemnation to e<strong>st</strong>ablish, extend or improve transportation<br />
facilities.<br />
• Wis. Stats. 84.25 (admini<strong>st</strong>rative access control) – WisDOT designates some rural<br />
portions <strong>of</strong> the <strong>st</strong>ate trunk highway sy<strong>st</strong>em as controlled-access highways where<br />
<strong>st</strong>udies show that the potential exi<strong>st</strong>s for traffic volumes to exceed 2,000 vehicles<br />
per 24-hour day.<br />
• Wis. Stats. 84.295 (freeway and expressway access control) – WisDOT<br />
designates highways with greater than 4,000 vehicles per day as freeways or<br />
expressways when it is determined that the volume and character <strong>of</strong> traffic<br />
warrants the con<strong>st</strong>ruction or acquisition <strong>of</strong> right-<strong>of</strong>-way to accommodate a fourlane<br />
highway.<br />
Access control is in effect on all <strong>st</strong>ate and federal highways in St. Croix County. WIS 64<br />
from the St. Croix River to STH 65 in New Richmond has Wis. Stats. 84.09 access<br />
control in effect. WIS 64 is con<strong>st</strong>ructed to freeway <strong>st</strong>andards (no access except via grade<br />
separated interchanges) from 150 th Avenue (St. Joseph/Somerset town line) to WIS 35 in<br />
Somerset. From WIS 35 to WIS 65, WIS 64 is con<strong>st</strong>ructed to expressway <strong>st</strong>andards;<br />
access is only available at public road intersections.<br />
It is planned to designate WIS 64 from the new Stillwater Bridge location to 150 th<br />
Avenue as a freeway under Wis. Stats. 84.295 as part <strong>of</strong> the bridge approach project. In<br />
addition, it is planned to designate WIS 64 from 150 th Avenue to 110 th Street in the Town<br />
<strong>of</strong> Star Prairie as a freeway and from 110 th Street to WIS 65 as an expressway; these<br />
designations are expected to take place in the next two to four years.<br />
Designated Truck Routes<br />
Truck routes are designed to accommodate semi-trucks and include roadside<br />
accommodations at re<strong>st</strong> areas for temporary parking. Long truck routes also <strong>of</strong>ten<br />
include private truck parking and fueling <strong>st</strong>ations along the routes.<br />
120 Transportation Information
The following highways are designated as long truck routes in St. Croix County:<br />
Inter<strong>st</strong>ate 94 (all)<br />
US 63 (all)<br />
WIS 35 (River Falls to Hudson)<br />
WIS 64 (New Richmond to ea<strong>st</strong>)<br />
WIS 65 (River Falls to New Richmond)<br />
WIS 128 (WIS 29 to WIS 170/Glenwood City)<br />
WIS 170 (WIS 128 to Boyceville)<br />
There additional highways, or portions there<strong>of</strong>, are re<strong>st</strong>ricted truck routes, such as US 12,<br />
WIS 29, and parts <strong>of</strong> WIS 35, 64, 65, 79, and 128. No County highways are designated<br />
truck routes.<br />
Transit<br />
The only urban public transit services available in St. Croix County are shared ride taxi<br />
sy<strong>st</strong>ems in New Richmond and River Falls which provide door-to-door service. Both<br />
services have lift-equipped vans which comply with Americans with Disabilities (ADA)<br />
requirements. These services are available within five miles <strong>of</strong> each respective city and<br />
receive federal and <strong>st</strong>ate operating funds to assi<strong>st</strong> with operating expenses.<br />
The St. Croix County Department <strong>of</strong> Aging and Aging Disability Resource Center<br />
maintains a fleet <strong>of</strong> vans that provide demand responsive service during limited weekday<br />
hours at the following senior nutrition sites:<br />
Baldwin mini bus: 8 + 1 wheelchair M-TH 9:30-12:30<br />
Deer Park 2 mini-vans: 7 each M-TH 10:00-1:00<br />
Glenwood City mini-bus: 14 M-TH 10:00-1:30<br />
mini-van: 4 + 1 wheelchair<br />
Hammond mini-van: 6 T&TH 10:30-1:30<br />
Hudson bus: 12 + 1 wheelchair M-F 10:00-2:00<br />
New Richmond bus: 12 + 2 wheelchair M-F<br />
Roberts mini-van: 6 M&W 11:00-1:00<br />
Somerset mini-van: 14 M-TH 10:00-1:00<br />
Woodville mini-van:7 M-TH 9:30-1:00<br />
St. Croix County Aging also coordinates a volunteer, demand-response service for<br />
seniors and those with disabilities. The County is also participating in a multi-<strong>county</strong><br />
collaborative effort working with the New Freedom Transportation Program admini<strong>st</strong>ered<br />
by the Center for Independent Living for We<strong>st</strong>ern Wisconsin based in Menomonie. The<br />
New Freedom Program provides a volunteer-based, demand responsive transportation<br />
service in the County to those persons with disabilities <strong>of</strong> all ages. 48-hour advance<br />
notice is required and wheel-chair assessable vans are not available. County residents<br />
ages 60 years and older may also contact Interfaith Caregivers <strong>of</strong> St. Croix County for<br />
transportation services, especially for medical reasons.<br />
St. Croix County Conditions and Trends Report 121
Other private transit services for specific purposes or populations do exi<strong>st</strong> in the County.<br />
St. Croix Indu<strong>st</strong>ries provides fixed route and special event transportation for their<br />
program participants. Hudson Hospital <strong>of</strong>fers demand responsive service to clients<br />
within 15 minutes <strong>of</strong> the hospital. Baldwin Care Center and Park View Home in<br />
Woodville also <strong>of</strong>fer transportation for their residents.<br />
Private-pay transportation service is also available from three primary firms. Great<br />
Rivers Transit based in Minneapolis <strong>of</strong>fers daily commuter service from Park and Ride<br />
lots in River Falls and Hudson to Minneapolis and St. Paul for a monthly subscription; a<br />
casual ridership subscription is also available. New Richmond Transport, Inc and<br />
Northwoods Transport in Rice Lake also <strong>of</strong>fer demand-responsive transportation service.<br />
A new intercity bus service began on July 17, 2008, between Minneapolis/St. Paul,<br />
Minnesota and Milwaukee, Wisconsin, with intermediate <strong>st</strong>ops in Hudson, Menomonie,<br />
Eau Claire, Chippewa Falls, Stanley, Abbotsford, Wausau, Wittenberg, Shawano, Green<br />
Bay, Manitowoc, and Sheboygan. The service runs once in each direction daily, and<br />
allows for connections with Greyhound Lines from Eau Claire to Tomah and Madison,<br />
and from Green Bay to Appleton, Oshkosh, and Fond du Lac. The service is initially<br />
being funded by a federal grant through the Supplemental Transportation Rural<br />
Assi<strong>st</strong>ance Program (STRAP), received by the City <strong>of</strong> Stanley.<br />
Bicycles<br />
St. Croix County currently only has two <strong>of</strong>f-road trails <strong>of</strong> County or regional significance<br />
for bicycling, though some communities have internal trail or path sy<strong>st</strong>ems. Both trails<br />
follow old railroad grades. The Willow River trail runs through a portion <strong>of</strong> Willow<br />
River State Park and it has been proposed to extend this trail to the northea<strong>st</strong>, eventually<br />
connecting with the Cattail State Trail in Amery and the Wild Rivers State Trail in Rice<br />
Lake.<br />
The Wildwood Trail <strong>st</strong>retches for seven miles between Woodville through the Town <strong>of</strong><br />
Eau Galle. Residents in the Spring Valley area have been working on plans for the<br />
eventual extension <strong>of</strong> this trail to Spring Valley and Elmwood.<br />
On March 18 th , 2008, the St. Croix County Parks and Recreation Bicycle and Pede<strong>st</strong>rian<br />
Plan was adopted which discusses these potential projects and other potential bicycle<br />
route and trail improvements. Map 3.7 is the bicycling suitability map from this plan;<br />
suitability is based on traffic volumes and pavement width including shoulders. Traffic<br />
volume data for all town and <strong>county</strong> roads is not available, though mo<strong>st</strong> rural, paved<br />
roads without such data are safe biking facilities due to low traffic volumes.<br />
Map 3.8 shows the Plan’s recommended bicycle sy<strong>st</strong>em. The Plan recommendations<br />
focus on the unincorporated areas <strong>of</strong> the County, though local plans from towns, villages,<br />
and cities were considered. Please see Appendix B <strong>of</strong> the Plan if information on these<br />
local plans are needed. The Plan also reviews and reflects State plans, such as State<br />
suitability ratings, regional connecting trails/routes, and the proposed St. Croix River<br />
122 Transportation Information
Crossing Loop Trail. Recommendations from the St. Croix County Bicycle<br />
Transportation Plan (1995) and County Outdoor Recreation Plan (2006) were also<br />
considered.<br />
Pede<strong>st</strong>rian Facilities<br />
As its name sugge<strong>st</strong>s, the St. Croix County Parks and Recreation Bicycle and Pede<strong>st</strong>rian<br />
Plan identifies many trails and on-road routes which are also appropriate for pede<strong>st</strong>rian<br />
use in the County, though much <strong>of</strong> the analysis focuses on bicycling.<br />
Pede<strong>st</strong>rian facilities exi<strong>st</strong>, at varying levels, within the incorporated communities <strong>of</strong> St.<br />
Croix County. While some cities and villages have a fairly consi<strong>st</strong>ent network <strong>of</strong><br />
sidewalks, at lea<strong>st</strong> in the older sections, some other cities and villages tend to have<br />
sidewalks in their downtown commercial areas, with some connections to residential or<br />
in school areas, but not throughout the community.<br />
All <strong>of</strong> the cities and villages within St. Croix County have to address the need for<br />
pede<strong>st</strong>rians to safely cross <strong>st</strong>ate or <strong>county</strong> highways. All incorporated communities<br />
currently have a State highway which passes through their communities. With increasing<br />
traffic volumes <strong>of</strong> mo<strong>st</strong> <strong>of</strong> these highways, the potential for pede<strong>st</strong>rian-vehicle accidents<br />
is increasing. These highways and, in the case <strong>of</strong> the City <strong>of</strong> Hudson, Inter<strong>st</strong>ate 94 can be<br />
barriers to the movement <strong>of</strong> pede<strong>st</strong>rian traffic from residential to commercial areas or<br />
other de<strong>st</strong>inations.<br />
It is common for new school buildings to be built on the outskirts <strong>of</strong> communities, were<br />
land is more plentiful and less expensive, but making it difficult or dangerous for <strong>st</strong>udents<br />
to walk or bike to school. The resulting traffic at school arrival and dismissal times<br />
worsens the problem.<br />
As discussed in other parts <strong>of</strong> this section, there are numerous transportation projects<br />
planned or proposed for St. Croix County, including new highway bypasses which will<br />
impact pede<strong>st</strong>rian traffic. Some communities in the County, such as the City <strong>of</strong> New<br />
Richmond, have adopted pede<strong>st</strong>rian or sidewalk plans, though pede<strong>st</strong>rian facilities are<br />
more <strong>of</strong>ten addressed by communities in a less-comprehensive fashion as part <strong>of</strong> their<br />
subdivision design process or outdoor recreation planning.<br />
A federal program, Safe Routes to School, is available to assi<strong>st</strong> communities with<br />
planning, infra<strong>st</strong>ructure improvements, enforcement, and education to make walking and<br />
biking to school safer, and to encourage <strong>st</strong>udents to do so. To date, only the City <strong>of</strong> River<br />
Falls has successfully acquired Safe Routes to School funding in St. Croix County.<br />
St. Croix County Conditions and Trends Report 123
Map 3.7 – St. Croix County Bicycling Suitability Ratings<br />
source: St. Croix County Parks and Recreation Bicycle and Pede<strong>st</strong>rian Plan, 2008<br />
124 Transportation Information
Map 3.8 – St. Croix County Bicycle Sy<strong>st</strong>em Recommendations<br />
source: St. Croix County Parks and Recreation Bicycle and Pede<strong>st</strong>rian Plan, 2008<br />
St. Croix County Conditions and Trends Report 125
Safety<br />
Along with the significant increase in traffic volumes over the pa<strong>st</strong> 10 years, St. Croix<br />
County has also experienced increases in <strong>report</strong>ed crashes. Crashes are up nearly 20<br />
percent, overall, though injuries and fatalities have remained relatively con<strong>st</strong>ant. (See<br />
Table 3.7 and Figure 3.1). Crashes on local roads have increased mo<strong>st</strong> dramatically,<br />
approximately thirty-nine percent from 1998 to 2007. This may be due to the growth in<br />
the increase in numbers <strong>of</strong> vehicles on local roads with limited capacity. The number <strong>of</strong><br />
<strong>report</strong>ed crashes involving bicycles or pede<strong>st</strong>rians is small, making trending difficult. It<br />
is generally accepted that the actual occurrence <strong>of</strong> bicycle and pede<strong>st</strong>rian crashes far<br />
outnumbers those that are <strong>report</strong>ed. The annual count <strong>of</strong> crashes for municipalities in the<br />
County, from 2003 to 2007, is shown on Table 3.8.<br />
Table 3.7 – St. Croix County Crash Hi<strong>st</strong>ory (1998-2007)<br />
Data Item 1998 1999 2000 2001 2002 2003 2004 2005 2006 2007<br />
All Crashes 1520 1701 1868 1871 1924 2137 2006 2037 1858 2022<br />
On State Hwys 810 902 1037 970 936 1072 1062 1038 983 1008<br />
On County Hwys 305 354 351 373 446 453 407 461 354 394<br />
On Local Roads 405 445 480 528 542 612 537 538 521 620<br />
Total Injuries 682 670 821 773 658 689 712 668 631 658<br />
Total Fatalities 20 15 18 16 20 20 15 12 10 17<br />
Bicycle crashes 6 7 9 2 3 5 9 8 9 4<br />
Pede<strong>st</strong>rian crashes 15 5 7 9 13 7 12 12 8 6<br />
source: Wisconsin Traffic Operations and Safety Laboratory; WisTransPortal Crash Database; Crash Data Retrieval Facility,<br />
Version 1.1.3, July 16, 2008.<br />
Figure 3.1 – St. Croix County Crashes by Highway Type (1998-2007)<br />
number <strong>of</strong> crashes<br />
1200<br />
1000<br />
800<br />
600<br />
400<br />
200<br />
Total Crashes by Highway Type (1998-2007)<br />
0<br />
1998 1999 2000 2001 2002 2003 2004 2005 2006 2007<br />
years<br />
On State Hwys<br />
On County Hwys<br />
On Local Roads<br />
source: Wisconsin Traffic Operations and Safety Laboratory; WisTransPortal Crash Database; Crash Data Retrieval Facility,<br />
Version 1.1.3, July 16, 2008.<br />
126 Transportation Information
Table 3.8 - Highway Crashes by Municipality<br />
Municipality 2003 2004 2005 2006<br />
2007<br />
T. Baldwin 66 44 52 47 70<br />
T. Cady 83 72 77 65 76<br />
T. Cylon 37 34 53 44 40<br />
T. Eau Galle 101 76 75 92 69<br />
T. Emerald 27 26 27 34 36<br />
T. Erin Prairie 41 28 42 27 31<br />
T. Fore<strong>st</strong> 29 15 25 25 18<br />
T. Glenwood 25 35 36 36 40<br />
T. Hammond 47 31 37 38 48<br />
T. Hudson 175 193 138 151 190<br />
T. Kinnickinnic 57 69 62 72 72<br />
T. Pleasant Valley 43 32 37 25 35<br />
T. Richmond 75 69 68 61 60<br />
T. Rush River 31 44 41 41 27<br />
T. Somerset 130 118 117 133 145<br />
T. Springfield 58 42 61 50 25<br />
T. Stanton 56 40 38 39 49<br />
T. Star Prairie 59 91 79 74 58<br />
T. St. Joseph 142 126 137 124 117<br />
T. Troy 110 100 87 90 76<br />
T. Warren 100 90 84 70 89<br />
V. Baldwin 52 50 53 43 53<br />
V. Deer Park 0 0 2 0 0<br />
V. Hammond 11 12 11 5 11<br />
V. North Hudson 18 11 26 19 16<br />
V. Roberts 4 7 8 8 20<br />
V. Somerset 26 24 27 14 8<br />
V. Spring Valley 0 0 0 0 0<br />
V. Star Prairie 3 5 5 1 4<br />
V. Wilson 4 1 4 3<br />
V. Woodville 8 2 6 4 6<br />
C. Glenwood Springs 20 13 5 9 12<br />
C. Hudson 331 338 282 247 294<br />
C. New Richmond 106 107 120 112 144<br />
C. River Falls 60 62 68 54 80<br />
Totals 2135 2006 1987 1858 2022<br />
source: Wisconsin Traffic Operations and Safety Laboratory; WisTransPortal Crash Database;<br />
Crash Data Retrieval Facility, Version 1.1.3, July 16, 2008.<br />
St. Croix County Conditions and Trends Report 127
Commuting Patterns<br />
Residents <strong>of</strong> St. Croix County are employed in a wide array <strong>of</strong> locations, within their own<br />
community, elsewhere in the County, in other Wisconsin and Minnesota counties (See<br />
Table 3.9). Of the 34,428 employed residents <strong>report</strong>ed, 18.7 percent work in the city,<br />
village, or town in which they reside. This would include those that work at home, and<br />
mo<strong>st</strong> <strong>of</strong> those working family farms. Ju<strong>st</strong> less than 30 percent <strong>of</strong> workers <strong>report</strong>ed that<br />
they work in a St. Croix County community other than the one in which they reside.<br />
Those working in other Wisconsin counties include 7.6 percent <strong>of</strong> employed St. Croix<br />
County residents, with Eau Claire employing the highe<strong>st</strong> percent, at 3.7 percent. The<br />
mo<strong>st</strong> significant <strong>st</strong>ati<strong>st</strong>ic is that 43.5 percent <strong>of</strong> working St. Croix County residents<br />
commute to a job in Minnesota. Mo<strong>st</strong> <strong>of</strong> those are employed in Washington and Ramsey<br />
counties, 15.2 and 15.0 percent, respectively.<br />
St. Croix County has six State-recognized Park and Ride lots for commuters:<br />
US 63/WIS 64 Intersection (Town <strong>of</strong> Cylon) parking for 24 vehicles<br />
I-94/US 63 (Village <strong>of</strong> Baldwin) parking for 36 vehicles<br />
I-94/WIS 65 (Village <strong>of</strong> Roberts) parking for 48 vehicles<br />
WIS 35/65 (City <strong>of</strong> River Falls) parking for 124 vehicles<br />
I-94/Carmichael Road (City <strong>of</strong> Hudson) parking for 168 vehicles<br />
I-94/Old WIS 35 (City <strong>of</strong> Hudson) parking for 74 vehicles<br />
The Minneapolis/St. Paul Metropolitan Area’s MetroTransit also coordinates a rideshare<br />
program which encompasses parts <strong>of</strong> we<strong>st</strong>ern Wisconsin.<br />
Railroads<br />
Rail service is an important component <strong>of</strong> the local economic market. Many indu<strong>st</strong>ries<br />
prefer to have direct access to rail service. Rail service in St. Croix County is provided<br />
by two railroads as shown on Map 3.9.<br />
The Union Pacific (UP) Railroad operates the former Chicago-Northwe<strong>st</strong>ern mainline<br />
between Minneapolis-St. Paul and Chicago. This line serves the St. Croix County<br />
communities <strong>of</strong> Hudson, Roberts, Baldwin, Hammond, Woodville, and Wilson. The<br />
Wisconsin Central Limited (WCL) line to the north provides shipper connections in<br />
Minnesota for the communities <strong>of</strong> Somerset and New Richmond.<br />
No passenger rail service is currently available. However, a group <strong>of</strong> local governments<br />
and business leaders are working together as the We<strong>st</strong> Central Wisconsin Rail Coalition<br />
to promote passenger rail service between Minneapolis/St. Paul and Chicago with a route<br />
through We<strong>st</strong> Central Wisconsin.<br />
128 Transportation Information
St. Croix County Conditions and Trends Report 129<br />
Community <strong>of</strong> Work Trip Origin<br />
Glenwood City<br />
Hudson<br />
Cities<br />
New Richmond<br />
River Falls<br />
Baldwin<br />
Deer Park<br />
Hammond<br />
North Hudson<br />
Roberts<br />
Villages<br />
Somerset<br />
Star Prairie<br />
Wilson<br />
Woodville<br />
Baldwin<br />
Cady<br />
De<strong>st</strong>ination w/in origin<br />
community<br />
182 1320 1238 279 420 15 93 157 64 144 34 18 157 144 96 48 77 68 47 92 75 88 424 65 45 80 51 203 203 61 53 63 231 107 6442<br />
De<strong>st</strong>ination outside community;<br />
w/in St. Croix County<br />
Den<strong>st</strong>inations in<br />
other Wisconsin<br />
counties<br />
Cylon<br />
Eau Galle<br />
203 502 541 224 536 50 310 677 205 162 102 48 231 240 119 152 236 214 195 90 205 256 1091 236 86 394 130 413 342 229 330 689 628 251 10317<br />
Barron 4 11 4 2 2 4 3 2 3 2 3 8 2 2 2 9 2 2 67<br />
Brown 2 2<br />
Burnett 9 4 2 6 21<br />
Chippewa 3 5 2 3 3 16<br />
Columbia 2 2<br />
Dane 10 2 3 3 18<br />
Dodge 11 11<br />
Douglas 16 16<br />
Dunn 45 11 25 12 15 6 4 51 12 4 15 28 2 19 2 5 46 4 306<br />
Eau Claire 5 15 14 8 13 7 6 6 2 4 2 8 6 3 2 4 2 6 2 115<br />
Fond du Lac 5 3 8<br />
Grant 11 11<br />
Kewaunee 3 3<br />
Milwaukee 9 9<br />
Monroe 1 3 6 10<br />
Outagamie 3 3<br />
Pepin 6 6<br />
Pierce 6 94 75 338 30 3 26 29 11 4 2 9 10 15 56 41 6 2 6 20 35 136 23 25 8 11 23 6 4 6 189 23 1272<br />
Polk 18 19 95 2 11 47 4 6 2 25 30 4 2 45 2 23 14 49 14 9 18 32 23 46 27 86 5 658<br />
Rock 4 4<br />
Sauk 6 6<br />
Shawano 1 7 8<br />
Washburn 2 2<br />
Washington 8 4 2 2 2 18<br />
Winnebago 5 2 2 3 12<br />
Anoka 19 39 3 4 2 17 2 8 2 3 2 2 6 2 1 23 2 2 39 2 3 5 15 18 221<br />
Blue Earth 3 8 11<br />
Carlton 2 2<br />
Carver 10 12 6 2 2 3 3 10 3 51<br />
Chisago 1 9 5 15<br />
Dakota 5 249 47 41 20 24 84 42 13 8 5 4 7 17 4 7 4 22 182 13 9 26 20 37 37 5 18 26 14 35 1025<br />
Douglas 6 6<br />
Fillmore 4 4<br />
Goodhue 17 9 18 12 2 3 2 2 3 14 3 2 5 92<br />
Hennepin 13 688 121 70 62 9 20 224 46 63 15 31 27 23 6 16 13 14 9 8 17 444 66 6 62 9 262 89 21 24 75 257 59 2869<br />
Hou<strong>st</strong>on 2 2<br />
Isanti 9 3 2 1 15<br />
Mahnomen 8 8<br />
De<strong>st</strong>inations in McLeod 2 11 2 2 3 4 24<br />
Minnesota counties Meeker 2 2<br />
Mille Lacs 11 5 2 11 2 4 3 2 3 9 3 2 57<br />
Olm<strong>st</strong>ed 5 10 2 6 23<br />
Pennington 2 2<br />
Ramsey 42 891 397 93 113 8 75 436 89 103 29 5 41 37 32 26 43 27 33 18 16 75 750 100 20 90 32 383 246 31 38 231 485 138 5173<br />
Rice 9 10 1 2 3 25<br />
Scott 6 12 2 4 2 1 1 2 3 1 2 36<br />
Sherburne 2 2 2 1 3 10<br />
St. Louis 5 2 7<br />
Stearns 6 2 8<br />
Tail 2 2<br />
Waseca 1 1<br />
Washington 22 755 501 108 106 11 45 388 80 233 52 9 38 34 18 28 40 24 67 27 14 40 567 123 21 143 17 494 454 20 71 359 219 117 5245<br />
Wright 2 3 7 3 3 5 2 25<br />
Other<br />
Total by home<br />
5 12 6 2 4 3 6 26 6 4 7 9 4 6 4 104<br />
community 554 4662 3164 1210 1386 152 622 2035 578 775 277 111 543 521 411 327 510 391 387 326 374 544 3634 759 217 882 290 1883 1500 439 578 1575 2048 763<br />
source: U.S. Bureau <strong>of</strong> the Census, Census Transportation Planning Package, 2000<br />
Emerald<br />
Erin Prairie<br />
Fore<strong>st</strong><br />
Glenwood<br />
Hammond<br />
Hudson<br />
Kinnickinnic<br />
Towns<br />
Pleasant Valley<br />
Richmond<br />
Rush River<br />
St. Joseph<br />
Somerset<br />
Springfield<br />
Stanton<br />
Star Prairie<br />
Troy<br />
Warren<br />
Total by workplace<br />
Table 3.9 – Commuting Patterns <strong>of</strong> St. Croix County Residents by Municipality
Map 3.9 - Railroad Ownership in We<strong>st</strong> Central Wisconsin<br />
Intermodal Facilities<br />
source: excerpted from “Wisconsin Railroads-2006” map, Bureau <strong>of</strong> Planning, WisDOT, (January, 2006); and Wisconsin Rail Issues and Opportunities<br />
Report, WisDOT, 2004.<br />
130 Transportation Information
Air Transportation<br />
The New Richmond Regional Airport is the only public airport located in St. Croix<br />
County and is the fifth large<strong>st</strong> municipal airport in Wisconsin with two runways and<br />
averaging 122 flights per day and about 180 aircraft based in privately owned hangars. A<br />
number <strong>of</strong> projects for the New Richmond Regional Airport are included in the WisDOT<br />
Airport Improvement Plan 2008-2012 (See Table 3.10 for li<strong>st</strong>ing <strong>of</strong> major projects). The<br />
2008 con<strong>st</strong>ruction projects are underway. Land acquisitions and zoning efforts have also<br />
begun or are proposed for the near future.<br />
Table 3.10 - Major Airport Improvement Projects<br />
New Richmond Regional Airport<br />
Con<strong>st</strong>ruction<br />
Year Scheduled Improvements<br />
2008 Design approach lighting sy<strong>st</strong>em.<br />
Recon<strong>st</strong>ruct runway 14/32; con<strong>st</strong>ruct and pave bla<strong>st</strong> pads; con<strong>st</strong>ruct taxiway to NW corporate<br />
hangar area; pavement marking and airfield lighting; safety area grading.<br />
2008 Develop land use zoning ordinance<br />
2009 Land acquisition for ALS and land reimbursement<br />
Development NE hangar area.<br />
Approach lighting sy<strong>st</strong>em (MALSF).<br />
Strengthen parallel taxiway and taxiways in S hangar area; expand S hangar area.<br />
Recon<strong>st</strong>ruct S. GA apron.<br />
2010 Purchase SRE and con<strong>st</strong>ruct SRE building<br />
2011 In<strong>st</strong>all water and sewer mains<br />
2012 Con<strong>st</strong>ruct a helicopter landing and hangar area<br />
source: 5-Year Airport Improvement Program, WisDOT Bureau <strong>of</strong> Aeronautics, (February, 2008).<br />
A smaller private air<strong>st</strong>rip located northwe<strong>st</strong> <strong>of</strong> Baldwin is open from May through<br />
November, averages 38 flights per week, and is used heavily by parachuti<strong>st</strong>s during the<br />
summer months. The nearby Lake Elmo airport (approximately 10 miles from Hudson in<br />
Minnesota) or the Minneapolis-St. Paul International Airport provide the primary<br />
scheduled passenger and commercial air services for St. Croix County.<br />
Water Transportation<br />
There is no significant passenger or freight water transportation in St. Croix County. The<br />
neare<strong>st</strong> commercial port is in Duluth-Superior on Lake Superior located approximately<br />
100 miles north and barge traffic does not extend up the St. Croix River from the<br />
Mississippi River. Water transportation within the County is primarily recreational in<br />
nature (e.g., canoeing, fishing, water-skiing) occurring throughout the County on its<br />
many rivers and lakes, with some larger recreational boats and sailboats on Lake St.<br />
Croix. Paddlewheel and other riverboat excursions are also available along the St. Croix<br />
River for sight-seeing and dinner cruises.<br />
St. Croix County Conditions and Trends Report 131
Relevant Transportation Plans<br />
Since transportation sy<strong>st</strong>ems are mo<strong>st</strong> <strong>of</strong>ten multi-jurisdictional in nature, it is important<br />
to consider exi<strong>st</strong>ing State, County, and local plans and programs during local planning<br />
efforts. Federal, State, County, and local plans and programs addressing transportation<br />
are discussed in Addendum: Inventory <strong>of</strong> Exi<strong>st</strong>ing Plans, Programs, & Land Use Policies<br />
in We<strong>st</strong> Central Wisconsin.<br />
Some goals from applicable the State plans include:<br />
• WisDOT Five-year Airport Improvement Program: Maintain exi<strong>st</strong>ing facilities <strong>of</strong><br />
the <strong>st</strong>ate’s airport sy<strong>st</strong>em.<br />
• WisDOT Five-year Airport Improvement Program: Expand facilities to meet the<br />
needs <strong>of</strong> commercial passenger and cargo airlines serving Wisconsin.<br />
• Wisconsin Bicycle Transportation Plan 2020: Increase levels <strong>of</strong> bicycling<br />
throughout Wisconsin doubling the number <strong>of</strong> trips made by bicycles by the year<br />
2010.<br />
• Wisconsin Bicycle Transportation Plan 2020: Reduce crashes involving bicycli<strong>st</strong>s<br />
and motor vehicles by at lea<strong>st</strong> 10 percent by the year 2010.<br />
The Inventory in the special addendum includes a synopsis <strong>of</strong> each <strong>of</strong> the key<br />
transportation projects and <strong>st</strong>udies underway in our region. Pertinent to St. Croix County,<br />
this discussion includes:<br />
• St. Croix River Crossing (MINN 36/WIS 64)<br />
• US 63/WIS 64 Environmental Assessment<br />
• US 63 (I-94 to WIS 64) Environmental Assessment<br />
• WIS 65 (I-94 to Paperjack) Environmental Assessment<br />
• We<strong>st</strong> Central Regional Freeway Sy<strong>st</strong>em Executive Summary<br />
• We<strong>st</strong> Central Wisconsin Rail Coalition<br />
132 Transportation Information
Summary<br />
St. Croix County’s highway sy<strong>st</strong>em is well-developed and maintained, and serves<br />
automobile users particularly well, though traffic volumes are increasing over much <strong>of</strong><br />
the County. The availability <strong>of</strong> other modes <strong>of</strong> transportation such as transit, bicycle, and<br />
pede<strong>st</strong>rian facilities may not be meeting needs as more people use these modes out <strong>of</strong><br />
necessity, environmental concerns, convenience, or for health reasons.<br />
Key to the future <strong>of</strong> transportation in and around St. Croix County over the next several<br />
decades are increasing commuter traffic, aging <strong>of</strong> the population, the rising co<strong>st</strong> <strong>of</strong><br />
operating a vehicle, and changing technology.<br />
The following summarizes the exi<strong>st</strong>ing <strong>conditions</strong> and <strong>trends</strong> <strong>of</strong> transportation in St.<br />
Croix County:<br />
• There are 1,923 miles <strong>of</strong> public road in St. Croix County, under the jurisdiction <strong>of</strong><br />
the State <strong>of</strong> Wisconsin, St. Croix County, or local governments.<br />
• Traffic volumes in St. Croix County have been generally increasing, and<br />
moderate to severe conge<strong>st</strong>ion is anticipated on several highways by 2020 if no<br />
improvements are made.<br />
• The County’s portion <strong>of</strong> Inter<strong>st</strong>ate 94 is the second mo<strong>st</strong> heavily travelled<br />
segment <strong>of</strong> inter<strong>st</strong>ate highway in the State <strong>of</strong> Wisconsin, with projections<br />
exceeding 85,000 vehicles per day at the St. Croix River bridge by 2020.<br />
• WisDOT’s six year highway plan includes between $88,000,000 and<br />
$110,000,000 in projects within St. Croix County.<br />
• Vehicle crashes on public roadways increased nearly 20 percent from 1998 to<br />
2007. Crashes on local roads (not State or County highways) increased<br />
approximately 39 percent.<br />
• There are 282 bridges in St. Croix County, fifteen <strong>of</strong> which (5.3 percent) are<br />
classified as either functionally obsolete or <strong>st</strong>ructurally deficient. This does not<br />
mean that they are unsafe for travel.<br />
• Public transit in the County is limited to shared ride taxi services available in the<br />
cities <strong>of</strong> New Richmond and River Falls, and immediately surrounding areas.<br />
These services have lift-equipped vans which are in compliance with the<br />
Americans with Disabilities Act (ADA).<br />
• The St. Croix County Aging Department provides demand-response transit for<br />
limited hours on weekdays for nine senior nutrition sites. The Department also<br />
coordinates a volunteer, demand-response service for seniors and those with<br />
disabilities. Similar volunteer-based programs are coordinated by the New<br />
Freedom Transportation Program and the Interfaith Caregivers <strong>of</strong> St. Croix<br />
County.<br />
St. Croix County Conditions and Trends Report 133
• Great Rivers Transit <strong>of</strong>fers a private subscription-based bus service to the Twin<br />
Cities from Park and Ride lots in River Falls and Hudson. A new intercity bus<br />
service between the Twin Cities, Green Bay, and Milwaukee, makes a <strong>st</strong>op in<br />
Hudson.<br />
• The St. Croix County Parks and Recreation Bicycle and Pede<strong>st</strong>rian Plan was<br />
adopted in 2008. This plan includes a suitability analysis, bicycle sy<strong>st</strong>em<br />
recommendations, and a review <strong>of</strong> exi<strong>st</strong>ing local bike plans.<br />
• Only 18.7 percent <strong>of</strong> employed persons living in St. Croix County work in the<br />
same town, village, or city where they live; ju<strong>st</strong> less than 30 percent work in a<br />
different St. Croix County community; 7.6 percent work in another Wisconsin<br />
<strong>county</strong>, mo<strong>st</strong>ly in Eau Claire County; and 43.5 percent work in Minnesota.<br />
• Two active rail lines transverse the County—Union Pacific railroad and<br />
Wisconsin Central Limited. No passenger service is available, though such<br />
service is being promoted by the We<strong>st</strong> Central Wisconsin Rail Coalition.<br />
• St. Croix County has one public airport—New Richmond Regional Airport—<br />
which is the fifth large<strong>st</strong> municipal airport in Wisconsin and averages 122 flights<br />
per day.<br />
134 Transportation Information
4. UTILITIES AND COMMUNITY FACILITIES<br />
INFORMATION<br />
Element Context<br />
Utilities and community facilities provide the foundation on which a community is built<br />
and maintained. Utilities include sanitary sewer, <strong>st</strong>orm sewer and water sy<strong>st</strong>ems, and<br />
electricity, natural gas, telecommunications, and solid wa<strong>st</strong>e disposal sy<strong>st</strong>ems.<br />
Community facilities include parks, schools, health and safety services, and libraries,<br />
among other things. Utilities and community facilities contribute to the quality <strong>of</strong> life in<br />
St. Croix County and affect the community’s ability to attract and retain residents,<br />
visitors, businesses, and indu<strong>st</strong>ries.<br />
The State <strong>of</strong> Wisconsin Comprehensive Planning Law (§66.1001) requires that<br />
comprehensive plans include a “compilation <strong>of</strong> objectives, policies, goals, maps and<br />
programs to guide the future development <strong>of</strong> utilities and community facilities in the<br />
local governmental unit”. This section <strong>of</strong> the St. Croix County Conditions and Trends<br />
Report provides an inventory <strong>of</strong> many <strong>of</strong> the utilities and community facilities in the<br />
County which are typically included in comprehensive plans.<br />
Since the availability, condition, and capacity <strong>of</strong> utilities and community facilities <strong>of</strong>ten<br />
change frequently, and since much <strong>of</strong> this information is only available at a local level,<br />
this inventory may need to be further supplemented during County and local planning<br />
efforts. For example, information not included here which may be needed during the<br />
development <strong>of</strong> local plans includes:<br />
� condition and availability <strong>of</strong> public <strong>st</strong>ructures or major equipment (e.g., town<br />
halls, fleet vehicles, heavy equipment)<br />
� service areas and capacity <strong>of</strong> utilities and treatment sy<strong>st</strong>ems (e.g., sewer, water,<br />
<strong>st</strong>ormwater, natural gas, fiber optic)<br />
� condition, capacity, and location <strong>of</strong> parks and libraries<br />
� analysis <strong>of</strong> capacity <strong>of</strong> exi<strong>st</strong>ing facilities (e.g., child care, schools, elderly<br />
services) compared to current and projected population<br />
Such supplemental information may be needed more frequently in incorporated<br />
communities and urban areas, while this inventory should provide the bulk <strong>of</strong> the<br />
community facility and utility information needed for rural towns where public utilities<br />
and facilities are more limited. Facilities located in the City <strong>of</strong> River Falls and Village <strong>of</strong><br />
Spring Valley are generally not included here given that these communities are largely<br />
located in Pierce County.<br />
St. Croix County Conditions and Trends Report 135
Inventory <strong>of</strong> Utilities<br />
While this subsection provides a basic inventory <strong>of</strong> utilities, a more detailed discussion <strong>of</strong><br />
related issues, needs, and policies related to the provision <strong>of</strong> utilities within a community<br />
can be found in the utilities and community facilities element <strong>of</strong> each individual<br />
community’s comprehensive plan.<br />
Sanitary Sewer and Wa<strong>st</strong>ewater Treatment<br />
Several major federal laws have been enacted over the pa<strong>st</strong> 100 years to protect our<br />
nation’s waters, and each <strong>of</strong> these laws imposed subsequently greater re<strong>st</strong>rictions upon<br />
the discharge <strong>of</strong> pollution into lakes, rivers, and <strong>st</strong>reams. With the passage <strong>of</strong> the 1972<br />
Clean Water Act, all discharges <strong>of</strong> pollution required a permit, the use <strong>of</strong> be<strong>st</strong><br />
management practices was encouraged, and billions <strong>of</strong> dollars were provided to con<strong>st</strong>ruct<br />
sewage treatment plants.<br />
Fourteen St. Croix County communities have collection and treatment facilities for the<br />
proper treatment <strong>of</strong> wa<strong>st</strong>ewater, which includes three sanitary di<strong>st</strong>ricts (see Table 4.1).<br />
Table 4.1—Municipal Wa<strong>st</strong>ewater Sy<strong>st</strong>ems in St. Croix County<br />
Municipality/Di<strong>st</strong>rict<br />
Emerald/Glenwood Sanitary Di<strong>st</strong>rict #1<br />
Fore<strong>st</strong> Sanitary Di<strong>st</strong>rict #1<br />
Richmond Sanitary Di<strong>st</strong>rict #1<br />
Village <strong>of</strong> Baldwin<br />
Village <strong>of</strong> Deer Park<br />
Village <strong>of</strong> Hammond<br />
Village <strong>of</strong> Roberts<br />
Village <strong>of</strong> Somerset<br />
Village <strong>of</strong> Star Prairie<br />
Village <strong>of</strong> Wilson<br />
Village <strong>of</strong> Woodville<br />
City <strong>of</strong> Glenwood City<br />
City <strong>of</strong> Hudson<br />
City <strong>of</strong> New Richmond<br />
source: Wisconsin Department <strong>of</strong> Natural Resources<br />
Monthly<br />
Design Flow<br />
(GPD)<br />
Monthly<br />
Average Flow<br />
(GPD)<br />
Con<strong>st</strong>ruction<br />
Year<br />
This data is currently not available via the Wisconsin DNR database.<br />
For more information, please contact the community’s public works<br />
department or engineering firm.<br />
In addition, there are two private entities not shown in Table 4.1 which discharge<br />
sufficient volumes <strong>of</strong> treated effluent to require State municipal wa<strong>st</strong>ewater permits—St.<br />
Croix Meadows and Travel Centers <strong>of</strong> America.<br />
136 Utilities and Community Facilities Information
The City <strong>of</strong> Hudson, Village <strong>of</strong> North Hudson, and the Towns <strong>of</strong> Hudson, St. Joseph, and<br />
Troy, and we<strong>st</strong>ern one-half <strong>of</strong> the Town <strong>of</strong> Warren are part <strong>of</strong> the Hudson Urban Area<br />
which is required to maintain a sewer service area plan. The St. Croix County Planning<br />
Department is the designated agency responsible for managing the plan at the local level.<br />
For more information on sewer service area planning, please refer to the Addendum:<br />
Inventory <strong>of</strong> Programs, Plans, and Land Use Policies in We<strong>st</strong> Central Wisconsin<br />
developed by We<strong>st</strong> Central Wisconsin Regional Planning Commission.<br />
On-Site Septic Sy<strong>st</strong>ems<br />
Nearly all development in St. Croix County that is not located in a city, village, or<br />
sanitary di<strong>st</strong>rict shown in Table 4.1 uses private on-site sewer sy<strong>st</strong>ems. These sy<strong>st</strong>ems<br />
can be divided into three basic types, with pretreatment increasing in use:<br />
Figure 4.1 – Typical Septic Sy<strong>st</strong>em<br />
source: U.S. Environmental Protection Agency.<br />
Homeowner’s Guide to Septic Sy<strong>st</strong>ems, rev. March 2005.<br />
In-Ground Gravity Sy<strong>st</strong>ems –<br />
Mo<strong>st</strong> sy<strong>st</strong>ems in St. Croix County<br />
include a gravity flow design where<br />
wa<strong>st</strong>e flows from the home to the<br />
septic tank and from the septic tank<br />
into a soil absorption field (see<br />
Figure 4.1). The wa<strong>st</strong>ewater is<br />
purified as it moves down through<br />
the soil and into the groundwater.<br />
Pressurized Sy<strong>st</strong>ems – Typically,<br />
pressurized sy<strong>st</strong>ems can either be a<br />
mound, at-grade, or in-ground.<br />
These sy<strong>st</strong>ems either add a lift pump<br />
to pump the <strong>st</strong>orage chamber or<br />
incorporate a mound absorption area<br />
to increase soil depth for purification<br />
purposes.<br />
For all conventional sy<strong>st</strong>ems, a soil<br />
depth <strong>of</strong> at lea<strong>st</strong> three feet is needed to adequately purify the wa<strong>st</strong>ewater before it<br />
discharges into the groundwater. As noted in Chapter 5 some areas <strong>of</strong> the naturally<br />
occurring soil in St. Croix County is unsui<strong>table</strong> for proper operation <strong>of</strong> in-ground gravity<br />
or pressurized on-site sewer sy<strong>st</strong>ems; therefore, when new sy<strong>st</strong>ems are con<strong>st</strong>ructed, it is<br />
common for soil to be imported to the site to help ensure that the new sy<strong>st</strong>em operates<br />
properly.<br />
Holding Tank Sy<strong>st</strong>ems – Lots along lakeshores and in areas <strong>of</strong> high groundwater <strong>table</strong>s<br />
<strong>of</strong>ten lack the required soil depth or drain field area requirements for conventional septic<br />
sy<strong>st</strong>ems. As a result, residents may be using a holding tank to dispose <strong>of</strong> their<br />
wa<strong>st</strong>ewater. A holding tank is an underground <strong>st</strong>orage unit with no outlet into the soil.<br />
The <strong>contents</strong> <strong>of</strong> the tank mu<strong>st</strong> be pumped regularly and transferred to a proper disposal<br />
St. Croix County Conditions and Trends Report 137
facility. This type <strong>of</strong> wa<strong>st</strong>er disposal sy<strong>st</strong>em is particularly prevalent in lakefront<br />
development areas where lot sizes prohibit full septic sy<strong>st</strong>ems.<br />
Pretreatment sy<strong>st</strong>ems have been gaining in popularity for difficult sites or poor soils, or<br />
when an exi<strong>st</strong>ing private septic sy<strong>st</strong>em is failing on a small lot. Larger commercial<br />
operations in areas without municipal sewer may also be required to pre-treat wa<strong>st</strong>ewater.<br />
These sy<strong>st</strong>ems reduce the high levels <strong>of</strong> organic matter through aeration by treating<br />
wa<strong>st</strong>ewater in conjunction with a <strong>st</strong>andard gravity or pressurized sy<strong>st</strong>em.<br />
The Wisconsin Department <strong>of</strong> Commerce (COMM) regulates the siting, design,<br />
in<strong>st</strong>allation and inspection <strong>of</strong> mo<strong>st</strong> private on-site sewage sy<strong>st</strong>ems in the State. In 2000,<br />
the State adopted a revised private sy<strong>st</strong>em policy called COMM 83. The revised policy<br />
allows for conventional sewage sy<strong>st</strong>ems and advanced pre-treatment sewage sy<strong>st</strong>ems.<br />
There are several types <strong>of</strong> on-site disposal sy<strong>st</strong>em designs authorized for use today:<br />
conventional (underground), mound, pressure di<strong>st</strong>ribution, at-grade holding tank, and<br />
sand filter sy<strong>st</strong>ems. Sanitary permits are required under <strong>st</strong>ate law. To obtain a permit,<br />
one mu<strong>st</strong> contact a Wisconsin-licensed ma<strong>st</strong>er plumber who will complete the necessary<br />
forms and obtain the sanitary permit. The plumber is also responsible for in<strong>st</strong>alling the<br />
private sewage sy<strong>st</strong>em.<br />
Under COMM 83, Wisconsin counties can further regulate private on-site wa<strong>st</strong>e disposal<br />
sy<strong>st</strong>ems through a sanitary code. St. Croix County has adopted the St. Croix County<br />
Sanitary Ordinance (Chapter 12) which is enforced through the County Planning and<br />
Zoning Department. The Zoning Office will review and file soil te<strong>st</strong>s, issue State and<br />
County sanitary permits, and inspect the sy<strong>st</strong>em during in<strong>st</strong>allation. St. Croix County<br />
does not allow the use <strong>of</strong> holding tanks for new con<strong>st</strong>ruction and includes groundwater<br />
contamination prevention language due to a high susceptibility in some areas due to<br />
unique kar<strong>st</strong> and glacial topography.<br />
The Wisconsin Fund admini<strong>st</strong>ered by the Wisconsin Department <strong>of</strong> Commerce provides<br />
funding assi<strong>st</strong>ance to eligible landowners for the replacement or rehabilitation <strong>of</strong> failing<br />
private on-site wa<strong>st</strong>ewater treatment sy<strong>st</strong>ems.<br />
Water Supply<br />
In the 1974 Safe Drinking Water Act, Congress mandated that safe drinking water be<br />
provided to and paid for by the consumer. Today, Wisconsin water providers mu<strong>st</strong><br />
provide an abundant water supply to their cu<strong>st</strong>omers that is not only safe, but also free <strong>of</strong><br />
objectionable ta<strong>st</strong>e and odor, turbidity, and <strong>st</strong>aining elements. While the amount <strong>of</strong> water<br />
treatment varies from community to community, water is typically treated for corrosion<br />
control, disinfection, and fluoridation prior to consumption.<br />
St. Croix County communities receive their water from groundwater sources.<br />
Groundwater sources in the area include drilled wells, dug wells, and screened wells with<br />
and without gravel packs. Drilled wells are typically the deepe<strong>st</strong> wells and access large<br />
aquifers that are lower than the aquifers tapped for shallow private wells. Dug wells are<br />
138 Utilities and Community Facilities Information
considered the lea<strong>st</strong> desirable type, as they lack the 60-foot casing and cement grout now<br />
required <strong>of</strong> newly con<strong>st</strong>ructed wells to prevent contamination. Mo<strong>st</strong> dug wells in the area<br />
have been replaced. As will be discussed in Section 5, unique subsurface geologic<br />
<strong>conditions</strong> exi<strong>st</strong> in St. Croix County which increases the susceptibility <strong>of</strong> groundwater to<br />
contamination in some areas.<br />
Table 4.2 shows the active municipal and community water supply sy<strong>st</strong>ems in St. Croix<br />
County.<br />
Table 4.2 – Municipal and Community Water Sy<strong>st</strong>ems in St. Croix County<br />
Sy<strong>st</strong>em Name/Owner<br />
Municipality or<br />
P.O. Address<br />
Approx.<br />
Population<br />
Served<br />
# <strong>of</strong> Wells<br />
Baldwin Waterworks Village <strong>of</strong> Baldwin 3,301 2<br />
Glenwood City Waterworks City <strong>of</strong> Glenwood City 1,102 2<br />
Hammond Waterworks Village <strong>of</strong> Hammond 1,614 2<br />
Hudson Waterworks City <strong>of</strong> Hudson 11,353 7<br />
New Richmond Waterworks<br />
City <strong>of</strong> New Richmond and<br />
Town <strong>of</strong> Star Prairie (pt.)<br />
6,312 4<br />
North Hudson Waterworks Village <strong>of</strong> North Hudson 3,626 2<br />
Roberts Waterworks Village <strong>of</strong> Roberts 1,323 2<br />
Somerset Waterworks Village <strong>of</strong> Somerset 1,736 2<br />
Star Prairie Waterworks Village <strong>of</strong> Star Prairie 644 1<br />
Wilson Waterworks Village <strong>of</strong> Wilson 170 1<br />
Woodville Waterworks Village <strong>of</strong> Woodville 1,100 2<br />
Country View Court 1 683 200 th Avenue, Somerset 75 1<br />
Country View Court 2 683 200 th Avenue, Somerset 49 1<br />
Fox Court River Falls 90 1<br />
Hilltop Court Mobile Homes CTH “M”, River Falls 64 2<br />
Huntington Mobile Home Park New Richmond 52 1<br />
New Richmond E<strong>st</strong>ates 1563 Highway 65, New Rich. 95 1<br />
Riverside Mobile Home Court 1 1442 CTH “K”, New Rich. 70 1<br />
Riverside Mobile Home Court 2 1442 CTH “K”, New Rich. 80 1<br />
St. Croix Meadows Mobile Home Court Houlton 170 1<br />
Troy Glen Court 403 Highway 35, Hudson 150 1<br />
Wall Street Village 2140 CTH “C”, New Rich. 191 1<br />
source: Wisconsin Department <strong>of</strong> Natural Resources. Drinking Water Sy<strong>st</strong>em database as <strong>of</strong> 7/30/08<br />
The Village <strong>of</strong> Deer Park is the only incorporated area without a municipal water sy<strong>st</strong>em.<br />
The eleven non-municipal, community water sy<strong>st</strong>ems are trailer courts.<br />
With the exception <strong>of</strong> the population served by public sy<strong>st</strong>ems identified in Table 4.2, the<br />
far majority <strong>of</strong> remaining St. Croix County residents depend on individual private wells<br />
for their water supply needs. These wells draw water from the upper aquifer, which can<br />
be more susceptible to contamination. Potential exceptions are two general areas which<br />
the Wisconsin DNR has designated as deepwell casing areas due to groundwater<br />
contamination—one area in the Town <strong>of</strong> Star Prairie and one area in the Towns <strong>of</strong><br />
Hudson and Warren.<br />
St. Croix County Conditions and Trends Report 139
Each <strong>of</strong> these areas has related requirements for private wells, such as increased te<strong>st</strong>ing<br />
and the in<strong>st</strong>allation <strong>of</strong> whole-house, point-<strong>of</strong>-entry, activated-carbon filter treatment<br />
sy<strong>st</strong>ems. In some cases, landowners have elected to use bottled water for drinking. Plans<br />
are underway to expand City <strong>of</strong> New Richmond municipal water into the impacted area<br />
<strong>of</strong> the Town <strong>of</strong> Star Prairie area to address these concerns. This groundwater topic is<br />
discussed in greater detail within the natural resources sub-section <strong>of</strong> Section 5. For land<br />
divisions within these well advisory areas (e.g., deep well casing areas), certified survey<br />
maps and subdivision plats mu<strong>st</strong> include disclosures before recording. And, as required<br />
on occasion in the pa<strong>st</strong>, special <strong>st</strong>udies can be required for the identification <strong>of</strong> closed<br />
depressions.<br />
Water <strong>st</strong>orage facilities are classified as pressure tanks, ground reservoirs, or elevated<br />
<strong>st</strong>orage tanks. The majority <strong>of</strong> public water <strong>st</strong>orage facilities in the area are elevated<br />
<strong>st</strong>orage facilities such as water towers. The capacity <strong>of</strong> the elevated <strong>st</strong>orage facilities is a<br />
critical component <strong>of</strong> providing adequate fire protection via fire hydrants and related<br />
facilities. Capacity issues regarding water <strong>st</strong>orage will be addressed in individual<br />
comprehensive planning and capital improvements planning efforts.<br />
Stormwater Management<br />
Stormwater management is important in order to reduce or prevent soil erosion, mitigate<br />
flooding, and limit run-<strong>of</strong>f <strong>of</strong> pollutants, nutrients, and sediment to water bodies.<br />
Communities approach <strong>st</strong>ormwater management in a wide variety <strong>of</strong> ways and solutions<br />
are <strong>of</strong>ten site specific.<br />
For mo<strong>st</strong> <strong>of</strong> St. Croix County, as well as for mo<strong>st</strong> rural areas in the State, <strong>st</strong>ormwater<br />
facilities are limited to ditches along roadways, combined with culverts under roads and<br />
drives. Many farmers also use drainage tile in their fields to drain <strong>st</strong>ormwater in low<br />
areas. More developed areas, villages, and cities have a varying range <strong>of</strong> ditches, <strong>st</strong>orm<br />
water retention areas, curb and gutter, and <strong>st</strong>orm sewer. Mo<strong>st</strong> sy<strong>st</strong>ems in both urban and<br />
rural settings use a combination <strong>of</strong> engineered <strong>st</strong>ormwater solutions and natural<br />
approaches which take advantage <strong>of</strong> exi<strong>st</strong>ing swales, creeks, ponds, or other potential<br />
<strong>st</strong>orage areas.<br />
Currently, municipalities in Census-defined urbanized areas and municipalities with more<br />
than 10,000 population are required by State and Federal law 1 to develop a <strong>st</strong>ormwater<br />
program with measurable goals, required permitting, and educational efforts for<br />
municipal-owned <strong>st</strong>ormwater conveyances which discharge to public waters. We<strong>st</strong><br />
central Wisconsin includes only one census-defined urbanized area (consi<strong>st</strong>ing <strong>of</strong> fifteen<br />
municipalities total) in the Eau Claire/Chippewa Falls area. Outside <strong>of</strong> this urbanized<br />
1 Rules applicable to <strong>st</strong>ormwater management can be found in the Federal Clean Water Act and Chapter<br />
NR 216, Wis. Admin. Code and are regulated through the EPA’s National Pollutant Discharge Elimination<br />
Sy<strong>st</strong>em (NPDES) and permitted under the Wisconsin Pollutant Discharge Elimination Sy<strong>st</strong>em (WPDES).<br />
More information can be found at: http://www.dnr.<strong>st</strong>ate.wi.us/run<strong>of</strong>f/<strong>st</strong>ormwater.htm.<br />
140 Utilities and Community Facilities Information
area, only the cities <strong>of</strong> Hudson and Menomonie exceed the 10,000 population threshold<br />
in our region.<br />
State law also requires landowners to develop an erosion control plan and obtain<br />
necessary Wisconsin DNR erosion control and <strong>st</strong>ormwater discharge permits for all<br />
con<strong>st</strong>ruction sites where one or more acres <strong>of</strong> land will be di<strong>st</strong>urbed. The exceptions to<br />
this are for public buildings and Wisconsin DOT projects which have special regulations.<br />
The lack <strong>of</strong> a Federal or State mandate does not limit a municipality’s ability to plan for<br />
or regulate <strong>st</strong>ormwater. The County’s subdivision regulations cover all unincorporated<br />
areas <strong>of</strong> the County and include a site plan review process, <strong>st</strong>ormwater management<br />
requirements, and erosion controls. In addition, ten towns (Baldwin, Cylon, Hudson,<br />
Kinnickinnic, Pleasant Valley, St. Joseph, Somerset, Stanton, Troy, and Warren) and all<br />
<strong>of</strong> the villages and cities have adopted local subdivision regulations. The Cities <strong>of</strong><br />
Hudson, New Richmond, and River Falls, and the Village <strong>of</strong> North Hudson, have adopted<br />
erosion control regulations and management practices as part <strong>of</strong> their subdivision<br />
ordinances.<br />
Cities, villages, and towns with village powers may create a <strong>st</strong>ormwater utility that is<br />
responsible for maintaining and managing the surface water management sy<strong>st</strong>em.<br />
Stormwater utilities have the ability to charge fees to generate revenue to support these<br />
activities. A <strong>st</strong>ormwater management plan describes community-wide surface water<br />
management needs. This local tool is useful in determining actions to improve surface<br />
water quality and <strong>st</strong>ormwater detention <strong>st</strong>orage needs. Stormwater detention facilities are<br />
typically ponds that collect <strong>st</strong>orm water and help prevent damage caused by large<br />
rainfalls and small-scale flooding.<br />
The City <strong>of</strong> River Falls created a <strong>st</strong>ormwater utility in 1998 and the City <strong>of</strong> New<br />
Richmond created its utility in 2004. The Cities <strong>of</strong> Hudson and New Richmond and the<br />
Villages <strong>of</strong> Baldwin and Woodville have developed <strong>st</strong>ormwater management plans and/or<br />
ordinances. The Village <strong>of</strong> Hammond is currently working on a <strong>st</strong>ormwater management<br />
plan. Many other communities and the County have undertaken a range <strong>of</strong> significant<br />
<strong>st</strong>ormwater improvements in recent years.<br />
State funding for local governments is available to address land management activities<br />
which contribute to urban and rural run<strong>of</strong>f in priority watershed areas. A large area <strong>of</strong><br />
northea<strong>st</strong>ern St. Croix County falls within the Upper Willow River and South Fork Hay<br />
River Priority Watersheds for which projects have been completed. Much <strong>of</strong> the<br />
southwe<strong>st</strong>ern portion <strong>of</strong> the County falls within the Kinnickinnic River Priority<br />
Watershed and included sites for critical attention. A clu<strong>st</strong>er <strong>of</strong> lakes in northwe<strong>st</strong>ern St.<br />
Croix County have been designated for a Priority Lake Project.<br />
Stormwater flooding has been an increasing concern in St. Croix County. The St. Croix<br />
County Natural Hazards Mitigation Plan identifies <strong>st</strong>ormwater flooding issues and<br />
“hotspots” for the County and each municipality which participated in the plan. The<br />
recommendations <strong>of</strong> this plan may be useful for local comprehensive planning efforts.<br />
St. Croix County Conditions and Trends Report 141
Telecommunications Facilities<br />
In broad terms, telecommunications facilities allow users to communicate and share data<br />
over long geographic di<strong>st</strong>ances. Telecommunications facilities and networks are critical<br />
components to public safety, economic development, and quality <strong>of</strong> life. Inventorying<br />
telecommunications facilities is difficult given the quickly changing nature <strong>of</strong><br />
technology, ever-expanding service areas, and the multitude <strong>of</strong> providers in a deregulated<br />
market. Further, detailed service area maps for all telecommunication options are not<br />
available. Communities may need to identify their specific telecommunications issues<br />
and goals, prior to obtaining specific information and maps from their local<br />
telecommunications providers.<br />
With the adoption <strong>of</strong> the 1996 Federal Telecommunications Act regulating wireless<br />
communications providers, local government action on telecommunications has<br />
commonly focused on wireless communications towers. Access to wireless, seamless<br />
communication networks is becoming increasingly important in the modern world. Due<br />
to the increase in use <strong>of</strong> wireless communication for public safety, business, and personal<br />
use, con<strong>st</strong>ructing telecommunication towers is an issue that many municipalities are<br />
addressing more <strong>of</strong>ten than in the pa<strong>st</strong>. St. Croix County has adopted a wireless<br />
communications ordinance as part <strong>of</strong> Chapter 17 <strong>of</strong> its Code <strong>of</strong> Ordinances.<br />
Table 4.3 shows the telephone providers for St. Croix County municipalities, some <strong>of</strong><br />
which <strong>of</strong>fer other telecommunications services, such as cable and Internet access. Mo<strong>st</strong><br />
<strong>of</strong> St. Croix County has access to broadband (high-speed) Internet via telephone or cable<br />
lines, though some gaps do exi<strong>st</strong>. As an alternative, some <strong>of</strong> these areas may have<br />
broadband access via other means (e.g., satellite).<br />
142 Utilities and Community Facilities Information
Table 4.3 – Telephone Providers in St. Croix County<br />
Municipality<br />
Amery Telcom Inc<br />
Baldwin Broadband LLC<br />
Baldwin Cellcom Inc<br />
Baldwin Telecom, Inc.<br />
CenturyTel <strong>of</strong> NW Wisc LLC<br />
Charter Fiberlink, LLC<br />
Clear Lake Telephone Co, LLC<br />
Closecall America<br />
Comca<strong>st</strong> Phone <strong>of</strong> Wisc, LLC<br />
Frontier Communications St. Croix LLC<br />
Matrix Telecom, Inc.<br />
MCI Metro Access Trans Services, LLC<br />
Navigator Telecommunications LLC<br />
Nextgen Communication, LLC<br />
Powercom Corporation<br />
Sage Telecom Inc<br />
Somerset Telephone Co, Inc.<br />
Spring Valley Tel Long Di<strong>st</strong>ance<br />
Spring Valley Telephone Co, Inc.<br />
Talk America, Inc.<br />
St. Croix County Conditions and Trends Report 143<br />
Telephone USA <strong>of</strong> Wiscconsin LLC<br />
We<strong>st</strong> Wisconsin Telcom Coop Inc<br />
Towns<br />
Baldwin X X<br />
Cady X X X X<br />
Cylon X X X X<br />
Eau Galle X X<br />
Emerald X X<br />
Erin Prairie X X X<br />
Fore<strong>st</strong> X X<br />
Glenwood X<br />
Hammond X X X<br />
Hudson X X X X X X<br />
Kinnickinnic X X X X X X<br />
Pleasant Valley X X X X X X X<br />
Richmond X<br />
Rush River X X<br />
St. Joseph/Houlton X X X X X X X X X<br />
Somerset X X X X X X<br />
Springfield X X X X<br />
Stanton X X<br />
Star Prairie X X X<br />
Troy X X X<br />
Warren X X X X X X X<br />
Villages<br />
Baldwin X<br />
Deer Park X<br />
Hammond X<br />
North Hudson X X X X X<br />
Roberts X X X X X X<br />
Somerset X<br />
Spring Valley (part) X X<br />
Star Prairie X<br />
Wilson X X<br />
Woodville X X<br />
Cities<br />
Glenwood City X X<br />
Hudson X X X X X X X X X<br />
New Richmond X X X<br />
River Falls (part) X X X X X X<br />
source: Public Service Commission <strong>of</strong> Wisconsin. Local Service Providers database as <strong>of</strong> 7/31/08<br />
Wisconsin Bell Inc
Due to its high bandwidth and low data loss, fiber optic is preferred, if not required, for<br />
many technology businesses and information services. Fiber optic communicates by<br />
sending light through optical fiber as opposed to traditional electrical transmission by<br />
copper wire. Fiber optic does come with a higher price tag however, and is more difficult<br />
to splice into. For many communities, providing fiber optic service to their indu<strong>st</strong>rial or<br />
business park(s) is a priority. The economic development section <strong>of</strong> the Addendum:<br />
Inventory <strong>of</strong> Programs, Plans, and Land Use Policies in We<strong>st</strong> Central Wisconsin<br />
compiled by WCWRPC as part <strong>of</strong> the regional comprehensive planning effort includes a<br />
<strong>table</strong> <strong>of</strong> the indu<strong>st</strong>rial parks in St. Croix County and whether fiber optic is available.<br />
Power Plants, Sub<strong>st</strong>ations, and Transmission Lines<br />
Power plants are indu<strong>st</strong>rial facilities that generate electricity for di<strong>st</strong>ribution to a large<br />
area. Sub<strong>st</strong>ations are indu<strong>st</strong>rial in<strong>st</strong>allations at which electricity is received from one or<br />
more power <strong>st</strong>ations for conversion from alternating to direct current, reducing the<br />
voltage or switching before di<strong>st</strong>ribution by a low-tension network for general<br />
consumption.<br />
Transmission lines are the large<strong>st</strong> electric lines on the landscape. These lines generate<br />
the mo<strong>st</strong> public intere<strong>st</strong> because they are the mo<strong>st</strong> noticeable electric lines and because <strong>of</strong><br />
the potential human and animal health side affects associated with them. Transmission<br />
lines transport electricity from power plants to sub<strong>st</strong>ations and operate at several<br />
thousand volts (typically ranging from 46,000 to 345,000 volts), <strong>st</strong>and anywhere between<br />
60 and 100 feet tall, and serve several hundred thousand cu<strong>st</strong>omers.<br />
The Public Service Commission (PSC) is the branch <strong>of</strong> the Wisconsin State government<br />
with the overall responsibility <strong>of</strong> regulating electric utilities. Map 4.2 at the end <strong>of</strong> this<br />
section shows the primary electric transmission lines, sub<strong>st</strong>ations, and line owners in we<strong>st</strong><br />
central Wisconsin. If more specific information on power plants, sub<strong>st</strong>ations, or<br />
transmission lines is needed, communities should contract the PSC, line owners, or their<br />
local electric utility.<br />
Electric Utilities<br />
Electric service is provided to St. Croix County by Xcel Energy, Pierce-Pepin Electric<br />
Cooperative, St. Croix Electric Cooperative, and municipal electric services in the Cities<br />
<strong>of</strong> New Richmond and River Falls. Approximate electric utility service areas for we<strong>st</strong><br />
central Wisconsin are included on Map 4.2 at the end <strong>of</strong> this section.<br />
Natural Gas Utilities<br />
Natural gas is provided to the St. Croix County by four difference gas companies. Large<br />
rural areas <strong>of</strong> the County do not have access to natural gas. Map 4.3 at the end <strong>of</strong> this<br />
section shows those communities which have natural gas service in we<strong>st</strong> central<br />
144 Utilities and Community Facilities Information
Wisconsin and the natural gas transmission lines. Service areas are shown by town,<br />
though natural gas service may not be available in all areas shown.<br />
Inventory <strong>of</strong> Educational Facilities<br />
St. Croix County residents are served by a<br />
wide assortment <strong>of</strong> educational facilities at<br />
the elementary, primary, secondary, and<br />
po<strong>st</strong>-secondary levels. In addition, some<br />
facilities <strong>of</strong>fer preschool, kindergarten,<br />
special education, religious, business,<br />
indu<strong>st</strong>rial, trade, and vocational training.<br />
The specialized educational opportunities,<br />
such as Head Start, tend to be clu<strong>st</strong>ered in<br />
the larger communities. Overall,<br />
municipalities in the County generally have<br />
a limited role in the planning and function<br />
<strong>of</strong> educational facilities, primarily relying<br />
on the educational in<strong>st</strong>itution itself for<br />
required planning and operations.<br />
Non-Public Schools<br />
Seven private schools serve St. Croix County residents as shown in Table 4.4. The<br />
majority <strong>of</strong> these schools do not have grade levels above 8 th grade. Local communities<br />
typically do not participate in the planning and function <strong>of</strong> these private schools.<br />
Table 4.4 – Private Schools in St. Croix County (2008)<br />
Public School<br />
Di<strong>st</strong>rict Area Private Schools<br />
2008<br />
Enrollment<br />
Baldwin-Woodville Area Baldwin Chri<strong>st</strong>ian School 57<br />
Dokime Chri<strong>st</strong>ian Classical Academy 6<br />
Peniel Chri<strong>st</strong>ian School 12<br />
Hudson St. Patrick Catholic School 377<br />
Trinity Lutheran School 118<br />
New Richmond St. Marys School 169<br />
Somerset St. Anne Grade School 157<br />
source: Wisconsin Department <strong>of</strong> Public In<strong>st</strong>ruction<br />
Hudson School Di<strong>st</strong>rict<br />
St. Croix County Conditions and Trends Report 145
Public Schools<br />
Public education for grades K-12 is available for all Wisconsin residents. Table 4.5 li<strong>st</strong>s<br />
the public school facilities for di<strong>st</strong>ricts headquartered within St. Croix County and their<br />
2008 enrollment. A school di<strong>st</strong>rict map for St. Croix County is included at the end <strong>of</strong> this<br />
section (see Map 4.4).<br />
Table 4.5 – Public Schools in St. Croix County<br />
Di<strong>st</strong>rict<br />
Public Schools<br />
2008<br />
Enrollment<br />
Baldwin-Woodville Area Baldwin-Woodville High 451<br />
Greenfield Elementary 595<br />
Viking Middle 473<br />
Glenwood City Glenwood City Elementary 405<br />
Glenwood City High 238<br />
Glenwood City Jr. high 99<br />
Transitional Skills Center 13<br />
Hudson Houlton Elementary 218<br />
Hudson High 1,716<br />
Hudson Middle 1,167<br />
Hudson Prairie Elementary 656<br />
North Hudson Elementary 473<br />
Rock Elementary 638<br />
Willow River Elementary 476<br />
New Richmond New Richmond Ea<strong>st</strong> Elementary 554<br />
New Richmond We<strong>st</strong> Elementary 698<br />
New Richmond Middle 603<br />
New Richmond High 883<br />
NR4Kids Charter School 188<br />
St. Croix Central St. Croix Central Elementary 557<br />
St. Croix Central Middle 376<br />
St. Croix Central High 354<br />
Somerset Somerset Elementary 702<br />
Somerset Middle 449<br />
Somerset High 440<br />
Total Enrollment 13,422<br />
source: Wisconsin Department <strong>of</strong> Public In<strong>st</strong>ruction<br />
146 Utilities and Community Facilities Information
Cooperative Educational Service Agencies (CESAs)<br />
CESA agencies were e<strong>st</strong>ablished in 1965 to replace <strong>county</strong> school supervisors. The<br />
<strong>st</strong>ate’s 12 regional CESAs <strong>of</strong>fer a variety <strong>of</strong> leadership and program services that link the<br />
<strong>st</strong>ate’s 428 school di<strong>st</strong>ricts with each other and with the Department <strong>of</strong> Public In<strong>st</strong>ruction.<br />
CESA’s provide specific programs identified by school di<strong>st</strong>ricts as priorities; <strong>of</strong>ten<br />
several schools jointly share CESA services. All public school di<strong>st</strong>ricts in St. Croix<br />
County fall within CESA Di<strong>st</strong>rict #11 which is located in Turtle Lake.<br />
Vocational, Technical, and Adult Education<br />
Wisconsin has a very <strong>st</strong>rong technical college sy<strong>st</strong>em that works closely with indu<strong>st</strong>ry,<br />
businesses, and the public sector to provide practical workforce training in a wide variety<br />
<strong>of</strong> fields. The State is divided into sixteen vocational di<strong>st</strong>ricts with a technical college<br />
serving each di<strong>st</strong>rict with a variety <strong>of</strong> classes, seminars, and vocational degree programs.<br />
Map 4.1 – Vocational Di<strong>st</strong>ricts in the Region<br />
source: Wisconsin Technical College Sy<strong>st</strong>em webpage.<br />
http://www.wtcsy<strong>st</strong>em.edu/colleges.htm<br />
Technical college programs include<br />
apprenticeships, <strong>st</strong>aff development,<br />
agriculture, marketing, driver education,<br />
health careers, law enforcement, home<br />
economics, trade and indu<strong>st</strong>rial, and<br />
adult education. Also, clinics and<br />
seminars are held throughout the year.<br />
St. Croix County is located within two<br />
vocational di<strong>st</strong>ricts. The Wisconsin<br />
Indianhead Technical College (WITC)<br />
vocational di<strong>st</strong>rict (see Map 4.1) has a<br />
campus in the City <strong>of</strong> New Richmond.<br />
According to the WITC website<br />
(www.witc.edu), nearly 1 in 9 residents<br />
in their di<strong>st</strong>rict have taken some sort <strong>of</strong><br />
class through a WITC campus, branch<br />
campus, or outreach center.<br />
Wisconsin Indianhead Technical College has additional regional campuses in Rice Lake,<br />
Ashland, and Superior with branch campuses in Hayward and Ladysmith and an outreach<br />
center in Spooner. Total 2007-2008 WITC enrollment for credit courses was 7,382,<br />
while noncredit enrollment exceeded 20,000.<br />
Some St. Croix County residents also attend courses at Chippewa Valley Technical<br />
College (CTVC) which has campuses in Chippewa Falls, Eau Claire, Menomonie, River<br />
Falls, and an outreach center in Neillsville. CVTC’s enrollment for credit courses was<br />
8,855 in 2007-2008, while noncredit enrollment was 10,741.<br />
St. Croix County Conditions and Trends Report 147
University <strong>of</strong> Wisconsin Sy<strong>st</strong>em<br />
The University <strong>of</strong> Wisconsin sy<strong>st</strong>em <strong>of</strong> public universities consi<strong>st</strong>s <strong>of</strong> two doctoral<br />
research universities (UW-Madison and UW-Milwaukee), eleven comprehensive<br />
universities, thirteen two-year colleges, and the Statewide UW-Extension sy<strong>st</strong>em.<br />
We<strong>st</strong> central Wisconsin is particularly blessed with three comprehensive universities,<br />
being home to UW-Eau Claire, UW-Stout (Menomonie), and UW-River Falls (see Table<br />
4.6). Of the thirteen University <strong>of</strong> Wisconsin colleges in the State <strong>of</strong>fering associates<br />
degrees, UW-Barron County located in Rice Lake is the only one located in we<strong>st</strong> central<br />
Wisconsin. Residents may also access associates-degree programming via the Internetbased<br />
UW Colleges Online.<br />
Table 4.6 – Enrollment <strong>of</strong> UW Campuses in We<strong>st</strong> Central Wisconsin<br />
Campus<br />
1998-99<br />
Enrollment<br />
2007-08<br />
Enrollment<br />
% change<br />
UW-Eau Claire 10852 10854 0.02%<br />
UW-River Falls 5617 6452 14.87%<br />
UW-Stout 7731 8477 9.65%<br />
UW-Barron County 491 606 23.42%<br />
source: University <strong>of</strong> Wisconsin sy<strong>st</strong>em<br />
University <strong>of</strong> Wisconsin-Extension partners closely with <strong>county</strong> governments to provide<br />
supportive services to all residents, businesses, and governments. This is a very active<br />
expression <strong>of</strong> the “Wisconsin Idea”, which is a philosophy that the University <strong>of</strong><br />
Wisconsin Sy<strong>st</strong>em is a partner in improving the quality <strong>of</strong> life <strong>of</strong> all Wisconsin residents<br />
through education.<br />
Other Colleges and Universities<br />
There are no independent colleges or universities located in we<strong>st</strong> central Wisconsin<br />
which are fully accredited, degree-granting, and a member <strong>of</strong> the Wisconsin Association<br />
<strong>of</strong> Independent Colleges and Universities.<br />
148 Utilities and Community Facilities Information
Inventory <strong>of</strong> Other Community Facilities and Services<br />
In mo<strong>st</strong> cases, the planning and operations <strong>of</strong> the following community facilities and<br />
services occurs at the local or facility level. Often, the local community may only be<br />
marginally involved, with mo<strong>st</strong> planning and operational decisions made by the private<br />
entity that operates the facility or provides the service. As such, the majority <strong>of</strong> the<br />
specific circum<strong>st</strong>ances, needs, issues, or policies associated with these community<br />
facilities and services are addressed in the individual community plans and not in this<br />
<strong>conditions</strong> and <strong>trends</strong> <strong>report</strong>. Given that the County is increasing in population, some<br />
corresponding increases in the level <strong>of</strong> services can be anticipated.<br />
Libraries<br />
Communities in St. Croix County are served by the following primary libraries:<br />
� Baldwin Public Library<br />
� Deer Park Public Library<br />
� Glenwood City Public Library<br />
� Hammond Community Library<br />
� Hudson Area Joint Library<br />
� Carleton A. Friday Memorial Library (New Richmond)<br />
� Hazel Mackin Community Library (Roberts)<br />
� Somerset Public Library<br />
� Woodville Community Library<br />
Some communities or intere<strong>st</strong> groups (e.g., hi<strong>st</strong>orical societies) may also have small-scale<br />
collections <strong>of</strong> books and related resources at other facilities. Library facilities are also<br />
available at the Technical College, UW-River Falls, and in adjacent communities outside<br />
<strong>of</strong> St. Croix County (e.g., River Falls).<br />
The nine public St. Croix County libraries are members <strong>of</strong> the Indianhead Federated<br />
Library Sy<strong>st</strong>em, a <strong>st</strong>ate-funded library agency serving ten counties in we<strong>st</strong> central<br />
Wisconsin. The Library Sy<strong>st</strong>em assi<strong>st</strong>s and connects these local libraries through the<br />
sharing <strong>of</strong> materials, computer library cataloging, training assi<strong>st</strong>ance, cataloging <strong>of</strong><br />
materials, web ho<strong>st</strong>ing, and outreach support.<br />
The planning and operation <strong>of</strong> libraries are the primarily the responsibility <strong>of</strong> the library<br />
board, <strong>of</strong>ten working collaboratively with the local school di<strong>st</strong>rict, library sy<strong>st</strong>em, and<br />
community.<br />
St. Croix County Conditions and Trends Report 149
Solid Wa<strong>st</strong>e Disposal and Recycling Facilities<br />
Solid wa<strong>st</strong>e is commonly referred to as garbage, trash, refuse or rubbish. Solid wa<strong>st</strong>e<br />
disposal is one <strong>of</strong> the more expensive community inve<strong>st</strong>ments made. An adequate solid<br />
wa<strong>st</strong>e disposal sy<strong>st</strong>em is important in attracting business and indu<strong>st</strong>ry. Indu<strong>st</strong>ry usually<br />
generates more wa<strong>st</strong>e than residential uses, and all generated solid wa<strong>st</strong>e requires proper<br />
disposal.<br />
With the exception <strong>of</strong> the villages <strong>of</strong> Deer Park and Wilson, the incorporated<br />
municipalities contract with private refuse haulers for curb-side garbage collection. Five<br />
towns also have municipal contracts for curb-side garbage collection—Eau Galle,<br />
Hudson, St. Joseph, Star Prairie, and Warren. The remaining communities <strong>of</strong>fer garbage<br />
collection at dump<strong>st</strong>ers at town facilities or individual household contract for curbside<br />
pickup. There are at lea<strong>st</strong> nine private refuse haulers that operate in St. Croix County that<br />
<strong>of</strong>fer door-to-door and roll-<strong>of</strong>f or dump<strong>st</strong>er service. Some <strong>of</strong> these providers, and others,<br />
<strong>of</strong>fer recycling collection and processing services.<br />
There are nine responsibility units for recycling in St. Croix County, including the<br />
County: Towns <strong>of</strong> Cady, Cylon, Fore<strong>st</strong>, and Warren, the Villages <strong>of</strong> Roberts and Wilson,<br />
and the City <strong>of</strong> Glenwood City. The County covers all municipalities outside these other<br />
communities.<br />
Mo<strong>st</strong> communities with curb-side garbage collection also have curb-side recycling. Mo<strong>st</strong><br />
other municipalities have a recycling drop-<strong>of</strong>f located at their community hall or<br />
shop/maintenance building. Some communities may be considering moving to a curbside<br />
garbage and recycling program.<br />
St. Croix County has adopted a recycling ordinance with<br />
mandatory separation <strong>of</strong> recyclable materials covering those<br />
municipalities for which it is the responsibility unit. A<br />
Recycling Compliance Assurance Plan e<strong>st</strong>ablishes related<br />
enforcement guidelines. This regulation is currently being<br />
expanded into a solid wa<strong>st</strong>e ordinance and, given the<br />
County’s growth, the County is contemplating the creation <strong>of</strong><br />
a solid wa<strong>st</strong>e management plan.<br />
The St. Croix County Planning and Zoning Department maintains an excellent webpage<br />
(http://www.co.saint-<strong>croix</strong>.wi.us/Departments/Recycling) covering the County’s<br />
recycling program, including what can be recycled, drop-<strong>of</strong>f locations, and contact<br />
information.<br />
The County’s recycling program webpage also includes information on the County’s<br />
special collection services. As State grant assi<strong>st</strong>ance allows, St. Croix County conducts a<br />
combined household/agricultural “Clean Sweep” twice a year to provide residents a safe<br />
means <strong>of</strong> disposing hazardous chemicals, paints, solvents, etc.<br />
150 Utilities and Community Facilities Information
In 2008, the County also <strong>of</strong>fered appliance collection for a small fee on June 7 th , and<br />
September 20 th and electronics collection on June 14 th and September 6 th at a total <strong>of</strong><br />
seven different locations. Wa<strong>st</strong>e tire recycling was <strong>of</strong>fered on June 7 th at four sites. The<br />
County’s recycling program also has initiatives to assi<strong>st</strong> apartments, schools, and<br />
businesses with meeting the County’s recycling ordinance requirements.<br />
For more information on recycling in St. Croix County, please contact the Recycling<br />
Program within the Planning and Zoning Department (715-386-4675) or visit their<br />
website.<br />
Law Enforcement<br />
Law enforcement services fall under the <strong>st</strong>atewide Wisconsin mutual aid agreement, with<br />
additional support and coordination through Wisconsin Emergency Management—<br />
Emergency Police Services in times <strong>of</strong> crisis. Overall, mo<strong>st</strong> planning and operations<br />
related to law enforcement occurs at the local level, though there is a high level <strong>of</strong><br />
coordination with the County on communications and overall emergency management<br />
concerns.<br />
The following con<strong>st</strong>itute the primary law enforcement agencies in St. Croix County:<br />
� Baldwin Police Department – P.O. Box 117, Baldwin 54002<br />
� Glenwood Police Department – P.O. Box 368, Glenwood City 54013<br />
� Hammond Police Department – P.O. Box 299, Hammond 54015<br />
� Hudson Police Department – P.O. Box 221 Walnut Street, Hudson 54016<br />
� New Richmond Police Department – 156 Ea<strong>st</strong> 1 <strong>st</strong> Street, New Richmond 54017<br />
� North Hudson Police Department – 400 7 th Street N, Hudson 54016<br />
� River Falls Police Department – 111 North 2 nd Street, River Falls 54022<br />
� Roberts Police Department – 107 E. Maple Street, Roberts 54023<br />
� Somerset Police Department – P.O. Box 158, Somerset 54026<br />
� Star Prairie Police Department – 310 Hill Avenue P.O. Box 3, Star Prairie 54026<br />
� Woodville Police Department – 102 S. Main Street, Woodville 54028<br />
� St. Croix County Sheriff’s Department – 1101 Carmichael Rd, Hudson 54016<br />
� UW-River Falls Safety/Security – 27 South Hall, River Falls 54022<br />
� Wisconsin State Patrol<br />
St. Croix County Emergency Management provides additional support to the County’s<br />
emergency response providers and local governments through emergency operations<br />
planning, training, coordination, crisis response, and recovery. In addition to County and<br />
local emergency operating plans which encompass the entire County, the St. Croix<br />
County Natural Hazards Mitigation Plan was adopted in 2008 which identifies proactive<br />
<strong>st</strong>rategies to mitigate the potential impacts <strong>of</strong> a natural hazard event.<br />
St. Croix County Conditions and Trends Report 151
Fire Departments<br />
Eleven fire departments provide fire protection for St. Croix County communities, and<br />
each gives mutual aid to neighboring departments in responding to large-scale<br />
emergencies. The fire di<strong>st</strong>ricts for St. Croix County are shown on Map 4.5 at the end <strong>of</strong><br />
this section. Overall, mo<strong>st</strong> planning and operations related to fire departments occurs at<br />
the local level, though there is a high level <strong>of</strong> coordination with the County on<br />
communications and overall emergency management concerns.<br />
Ambulance<br />
There are nine ambulance providers serving St. Croix County as shown on Map 4.6 at the<br />
end <strong>of</strong> this section. Overall, mo<strong>st</strong> planning and operations related to ambulance and<br />
rescue services occurs at the local level or is undertaken by the private, contracted firm,<br />
though some coordination occurs with local hospitals and with the County on<br />
communications and emergency management.<br />
Fir<strong>st</strong> Responders<br />
Fir<strong>st</strong> responders are trained in medical techniques, medical equipment, patient<br />
assessment, and emergency scene management beyond basic fir<strong>st</strong> aid. Fir<strong>st</strong> responders<br />
respond directly from their home (or other location) to the scene <strong>of</strong> an emergency. At the<br />
scene, the responders provide critical medical care until an ambulance arrives. Fir<strong>st</strong><br />
responders are sometimes associated with local fire departments, and many firefighters<br />
also have fir<strong>st</strong> responder training.<br />
Responders receive 59 hours <strong>of</strong> certified training and are State licensed, with many going<br />
on to be licensed as Emergency Medical Technicians (EMTs). EMTs require up to 756<br />
hours <strong>of</strong> training prior to certification, while full paramedics require 1,200 hours. Mo<strong>st</strong><br />
fir<strong>st</strong> responders are volunteers who mu<strong>st</strong> complete a bi-annual 30-hour refresher course,<br />
in addition to specialized and local (<strong>of</strong>ten monthly) training programs.<br />
Fir<strong>st</strong> responder service is contracted by the local municipality. St. Croix County has ten<br />
fir<strong>st</strong> responder/EMS services based in the County:<br />
• Baldwin Area EMS/United Fire & Rescue<br />
• Deer Park<br />
• Glenwood City<br />
• Hammond<br />
• St. Croix EMS (Hudson)<br />
• New Richmond Area Ambulance and Rescue Service<br />
• Roberts/Warren Fire & Rescue<br />
• St. Joseph Fire Department & Ambulance<br />
• Somerset<br />
• Star Prairie<br />
152 Utilities and Community Facilities Information
Hazardous Materials Response<br />
St. Croix County does not have a<br />
County Level “B” Hazardous Materials<br />
Response Team, though all fire<br />
departments have been trained to the<br />
operations level. As needed, the We<strong>st</strong><br />
Central Wisconsin Regional Response<br />
Team, based in the Chippewa Falls and<br />
Eau Claire Fire Departments, can be<br />
contacted for additional reconnaissance<br />
and research support. This Level A<br />
team can also be reque<strong>st</strong>ed to respond to<br />
the mo<strong>st</strong> serious <strong>of</strong> spills and releases<br />
requiring the highe<strong>st</strong> level <strong>of</strong> skin and<br />
respiratory protective gear. This<br />
WC WI Regional Response Team Practice Drill<br />
includes all chemical, biological, or<br />
radiological emergencies requiring vapor-tight Level A gear with self-contained<br />
breathing apparatus.<br />
Planning and exercises regarding hazard materials is coordinated through the St. Croix<br />
County Emergency Management Office in conjunction with the St. Croix County Local<br />
Emergency Preparedness Committee. Every six years, the County participates in<br />
Federally required training involving the Prairie Island Nuclear Generating Facility due<br />
to the County’s location within the Inge<strong>st</strong>ion Pathway Zone. For more information on<br />
hazardous materials incidents and the Prairie Island facility, please refer to the St. Croix<br />
County All Hazards Mitigation Plan.<br />
Medical Facilities<br />
Medical facilities are becoming increasingly important regional assets, improving the<br />
health <strong>of</strong> residents, while <strong>of</strong>fering an important source <strong>of</strong> employment and a better quality<br />
<strong>of</strong> life. Overall, mo<strong>st</strong> planning and operations related to medical facilities is undertaken<br />
by the private hospital or clinic, and includes little involvement <strong>of</strong> the local community.<br />
Table 4.7 li<strong>st</strong>s the general medical clinics and hospitals in St. Croix County.<br />
St. Croix County Conditions and Trends Report 153
Table 4.7 – Clinics and Hospitals in St. Croix County<br />
Baldwin Baldwin Area Medical Center 25 beds<br />
Baldwin Clinic<br />
Hudson Hudson Hospital (and Specialty Clinic) 25 beds<br />
Hudson Physicians (WWMA)<br />
New Richmond We<strong>st</strong>fields (Holy Family) Hospital 25 beds<br />
St. Croix County Health Center 180 beds<br />
Family Medical Surgical Center<br />
New Richmond Clinic (WWMA)<br />
Somerset Somerset Clinic (Stillwater Medical Group)<br />
source: St. Croix County Emergency Management, Wisconsin Department <strong>of</strong> Health Services<br />
Child Care Services<br />
Wisconsin State Law requires that anyone caring for four or more children under the age<br />
<strong>of</strong> seven years who are unrelated to the provider mu<strong>st</strong> obtain a license through the<br />
Department <strong>of</strong> Children and Families. Table 4.8 is a li<strong>st</strong> <strong>of</strong> State licensed child care<br />
facilities in St. Croix County for family child care (up to 8 children), group child care (9<br />
or more children) and camps. Over half <strong>of</strong> the County’s child care facilities are licensed<br />
for family child care. Ju<strong>st</strong> under 40% <strong>of</strong> the total County licensed capacity is in the<br />
centers in the Hudson area, excluding the two YMCA camps.<br />
Communities may need to consider population and demographic <strong>trends</strong> compared to the<br />
capacity <strong>of</strong> available child care in their area to help determine if child care needs <strong>of</strong> the<br />
community are being met.<br />
154 Utilities and Community Facilities Information
Table 4.8 – Licensed Child Care Facilities in St. Croix County<br />
City Day Care Name Capacity<br />
Baldwin CAROLYN'S CARE-A-LOT FAM DC CENTER 8<br />
COMMUNITY PRESCHOOL INC 20<br />
JENI'S DAY CARE 8<br />
L & S CHILDCARE CTR LLC 16<br />
PLAY LEARN & GROW DAY CARE 8<br />
TAMMY'S LITTLE TYKES 8<br />
TEDDY BEAR PLAYGROUND 8<br />
TONYA'S TOTS DAY CARE 8<br />
Emerald TURTLE TYKES DAY CARE 8<br />
Glenwood City BEARY SPECIAL CHILD CARE 8<br />
COUNTRY CARE DAY CARE 8<br />
JANE'S DAY CARE 8<br />
KIDDY COUNTRY CARE 8<br />
Hammond HOLLY'S DAYCARE 8<br />
THE HAMMOND PRESCHOOL 8<br />
TINY TOTS 8<br />
Hudson BEANE SPROUTS CC & LEARN CTR 85<br />
BEAR BUDDIES CHILD DEV CTR 120<br />
BETHEL HIGHLANDS PRESCH 65<br />
BUSY BEES DAY CARE 8<br />
COUNTRY KIDS DAYCARE 8<br />
COVE COUNTRY PRESCHOOL 8<br />
EARLY START DAY CARE 8<br />
HUDSON COMMUNITY CHILDREN'S CTR 60<br />
JACKIE'S CHILD CARE 8<br />
JANSEN'S DAY CARE 8<br />
JOYFUL NOISE PRESCHOOL 15<br />
JOYLAND DAY CARE 8<br />
KIM'S LEARNING HOUSE CHILD CARE 8<br />
KINDERCARE LEARNING CTR 138<br />
LOVE THE LITTLE ONES CHILD CARE 8<br />
MANDY'S FAMILY CHILDCARE 7<br />
MELISSA'S FAMILY CHILD CARE 8<br />
MS BUTTERFLY'S 8<br />
PEANUT GALLERY (THE) 8<br />
PRECIOUS MEMORIES CHILD CARE 8<br />
PUMPKIN PATCH CHILD CARE 8<br />
SIMPLY FIRST PRESCHOOL & CHILDCARE 8<br />
ST CROIX VALLEY YMCA SACC 72<br />
STEP BY STEP 8<br />
SUGAR AND SPICE DAY CARE 8<br />
TERRIFIC TOTS DAYCARE 8<br />
TERRI'S TOTS 8<br />
THE LEARNING CIRCLE 24<br />
TIME FOR TOTS CHILD CARE 8<br />
TINA'S FAMILY DAY CARE 6<br />
TRACY WALK'S DAYCARE 8<br />
TRINITY FAMILY CENTER 88<br />
TRINITY LUTHERAN PRESCHOOL & CC 83<br />
VALLEY VIEW DAY CARE 8<br />
WINGS FOR FLYING FCC 8<br />
YMCA CAMP ST CROIX 49<br />
YMCA CHILD CARE 80<br />
St. Croix County Conditions and Trends Report 155
Table 4.8 – Licensed Child Care Facilities in St. Croix County (cont.)<br />
City Day Care Name Capacity<br />
New Richmond ANGELA'S FAMILY CHILD CARE 8<br />
BEAR BUDDIES CHILD DEV CTR 110<br />
BUSY BEE DAY CARE 8<br />
CARLA'S CHILD CARE 8<br />
FIRST LUTH CHURCH CHILD CARE CTR 55<br />
HANSEN'S LEARNING CENTER 76<br />
LAURIE'S LITTLE LEARNERS 8<br />
LITTLE RAYS OF SUNSHINE DAY CARE 8<br />
NEW RICHMOND AREA YMCA 45<br />
NEW RICHMOND AREA YMCA - EAST SAC 40<br />
NEW RICHMOND AREA YMCA CHILD CARE 52<br />
NEW RICHMOND AREA YMCA SAC 37<br />
NEW RICHMOND CESA #11 HEAD START 19<br />
NOAH'S ARK PRESCHOOL 20<br />
PRIMARILY KIDS FIRST LLC 45<br />
RONDA'S HOME AWAY FROM HOME 20<br />
River Falls ABUNDANT LIFE CHRISTIAN LEARN CTR 60<br />
BEANE SPROUTS CHILD CARE 41<br />
CHILDREN OF FAITH PRESCHOOL 16<br />
GLORIA'S DAY CARE 8<br />
JANICE'S COUNTRY CARE 8<br />
LITTLE ADVENTURES CHILD CARE CTR 50<br />
LOLLIPOP LAND CHILD CARE 30<br />
PRIMARY COLORS 8<br />
Roberts DAISY HILL 100<br />
DIANE'S DAY CARE 8<br />
JANET'S HOME CHILD CARE 8<br />
ST CROIX DISCOVERY PRESCHOOL 42<br />
STORYBOOK FARM LEARNING CTR 8<br />
YMCA - ROBERTS SAC 35<br />
Somerset CINDY'S CHRISTIAN DAY CARE 8<br />
COUNTRY MUNCHKINS 8<br />
FOUR SEASONS CHILD CARE INC 90<br />
FOUR SEASONS CHILD CARE SCHOOL AGE 20<br />
JANIE'S JUNGLE GYM 7<br />
KINDER-GARDEN FAMILY CHILD CARE 8<br />
LIL' ENGINES CHILD CARE & PRESCH 8<br />
SANDY'S DAY CARE 8<br />
Woodville KIDS VIEW LEARNING CENTER 24<br />
NONA'S LITTLE HAPPY FACES DAY CARE 8<br />
SOWMAN'S LOVING DAY CARE 8<br />
source: Wisconsin Department <strong>of</strong> Children & Families, July 2008.<br />
156 Utilities and Community Facilities Information
Assi<strong>st</strong>ed Living Facilities, Nursing Homes, and Senior Programs<br />
Senior care facilities are becoming increasingly important regional assets to meet the<br />
changing needs <strong>of</strong> our aging population in a manner that permits residents to age with<br />
dignity. Since 1982, the State <strong>of</strong> Wisconsin has maintained a moratorium on the<br />
con<strong>st</strong>ruction <strong>of</strong> new nursing home beds due to high vacancy rates. This has created a<br />
problem in some areas, meanwhile encouraging the use <strong>of</strong> alternative assi<strong>st</strong>ed-living<br />
approaches. In 2005, St. Croix County nursing homes were at 86.7% capacity, which is<br />
about even with the State overall average. The actual availability <strong>of</strong> beds at any given<br />
time in St. Croix County can vary, and there are occasional waiting li<strong>st</strong>s.<br />
St. Croix County has a variety <strong>of</strong> assi<strong>st</strong>ed living facilities. The higher co<strong>st</strong>s <strong>of</strong> many <strong>of</strong><br />
these facilities, combined with decreased access to related governmental support,<br />
sometimes encourages residents to choose nursing care over assi<strong>st</strong>ed living. As the baby<br />
boomer generation ages, demand for such facilities is expected to increase. And with<br />
advances in medicines and technology, there has been an increasing trend in the provision<br />
<strong>of</strong> "in-home care” as an alternative to group homes or nursing care, which is also less<br />
co<strong>st</strong>ly overall.<br />
Table 4.9 li<strong>st</strong>s the assi<strong>st</strong>ed living facilities and nursing homes in St. Croix County, along<br />
with their capacities. These facilities are organized by five types:<br />
Adult Day Care provides services for part <strong>of</strong> a day, primarily on weekdays, in a group<br />
setting to adults who need assi<strong>st</strong>ance with activities <strong>of</strong> daily living, supervision, or<br />
protection. Adult day care centers are not licensed by the State, but may be certified. St.<br />
Croix County did not have any adult day care facilities as <strong>of</strong> July 2008.<br />
Adult Family Homes provides residence and care for up to four adults <strong>of</strong> minimum age<br />
18 who are not related to the operator, with up to seven hour per week <strong>of</strong> nursing care per<br />
resident. Counties certify one- and two-bed adult family homes, while the State licenses<br />
homes with three or four adults.<br />
Community-Based Residential Facilities are a place where five or more adults reside<br />
who receive care, treatment, or services that are above the level <strong>of</strong> room and board, but<br />
includes not more than three hours <strong>of</strong> nursing care (at the intermediate level or below) per<br />
week per resident. These facilities <strong>of</strong>ten provide services to a particular group, such as<br />
persons with dementia, developmental disabilities, or mental health problems. CBRFs<br />
are licensed by the State.<br />
Residential Care Apartment Complexes are independent-living apartments where five<br />
or more adults reside which are provided up to 28 hours per week <strong>of</strong> supportive and/or<br />
nursing services. These complexes may be a di<strong>st</strong>inct part <strong>of</strong> a nursing home or<br />
community-based residential facility and are certified by the State.<br />
Nursing Homes provide con<strong>st</strong>ant nursing care and supportive services to residents who<br />
have significant deficiencies with activities <strong>of</strong> daily living. Residents are typically the<br />
St. Croix County Conditions and Trends Report 157
elderly, younger adults with physical disabilities, and those requiring rehabilitative<br />
therapies. Nursing homes are licensed by the State.<br />
Communities may need to consider population and demographic <strong>trends</strong> compared to the<br />
capacity <strong>of</strong> available assi<strong>st</strong>ed living facilities and nursing homes in their area to help<br />
determine if needs are being met. And with St. Croix County’s aging population, the<br />
availability <strong>of</strong> such facilities could be a potential issue for the future.<br />
There is a large variety <strong>of</strong> additional supportive services available to the elderly and those<br />
with disabilities, ranging from in-home support to transportation to financial services to<br />
social activities. Such services are provided through a mix <strong>of</strong> governmental and nonpr<strong>of</strong>it<br />
in<strong>st</strong>itutions, <strong>of</strong>ten relying on volunteer support. Senior information and lunches are<br />
available at ten sites in St. Croix County:<br />
� Baldwin – 400 Center Street<br />
� Deer Park – 121 Front Street<br />
� Glenwood City – 316 W. Oak Street<br />
� Hammond – 1289 Charlotte Street<br />
� Hudson – 1320 Wisconsin Street<br />
� New Richmond – 351 Arch Avenue<br />
� River Falls – 119 Union Street<br />
� Roberts – 312 N. Park Street<br />
� Somerset – 748 Highway 35<br />
� Woodville – 102 S. Main Street<br />
For more information on aging and disability programs in St. Croix County, please<br />
contact the St. Croix County Office <strong>of</strong> Aging (715-537-6225) or visit its Aging and<br />
Disability Resource Center webpage: (http://www.co.saint-<strong>croix</strong>.wi.us/Departments/<br />
Aging/).<br />
158 Utilities and Community Facilities Information
Table 4.9 – Assi<strong>st</strong>ed Living Facilities in St. Croix County<br />
City Facility Type Facility Name<br />
Capacity<br />
or # <strong>of</strong><br />
Beds<br />
Baldwin Adult Family Home Aurora Res. Alternatives Inc. 039 4<br />
CBRF-Dev. Disabled Aurora Res. Alternatives Inc. 075 6<br />
CBRF-Adv. Age/Dementia Comforts <strong>of</strong> Home-Baldwin 15<br />
CBRF-Dev. Disabled Aurora Res. Alternatives Inc. 023 6<br />
Nursing Home Baldwin Care Center 65<br />
Residential Care Apts. Birchwood Apartments 21<br />
Glenwood City Nursing Home Glenhaven Inc 44<br />
Hammond Adult Family Home REM - Ridgeway 3<br />
Adult Family Home REM - Wisconsin Inc. Ridgeway 3<br />
Nursing Home American Heritage Care Center 55<br />
Residential Care Apts. Heritage Court Apartmets 17<br />
Hudson Adult Family Home Aurora Res. Alternatives Inc. 030 4<br />
Adult Family Home Aurora Res. Alternatives Inc. 032 A 4<br />
Adult Family Home Aurora Res. Alternatives Inc. 036 4<br />
Adult Family Home Aurora Res. Alternatives Inc. 031 4<br />
Adult Family Home REM Wisconsin III Inc. 3<br />
Adult Family Home REM Wisconsin III Inc. 3<br />
Adult Family Home REM Wisconsin III Inc. - Wheatgrass 3<br />
Adult Family Home REM-Namekagon Loop 4<br />
CBRF-Other Burkwood Inc 29<br />
CBRF-Adv. Age/Dementia Comforts <strong>of</strong> Home-Hudson 41<br />
CBRF-Other Exodus House 12<br />
Nursing Home Chri<strong>st</strong>ian Community Home 81<br />
Residential Care Apts. Pine Ridge Assi<strong>st</strong>ed Living 39<br />
New Richmond Adult Family Home Aurora Res. Alternatives Inc. 006 4<br />
Adult Family Home Aurora Res. Alternatives Inc. 037 4<br />
Adult Family Home Essence - Paradigm Services Inc 4<br />
Adult Family Home Meadow View 4<br />
Adult Family Home Northgate 4<br />
Adult Family Home Northside 4<br />
Adult Family Home Pine View 4<br />
CBRF-Adv. Age/Dementia The Deerfield 17<br />
CBRF-Adv. Age/Dementia Our House Assi<strong>st</strong>ed Care, LLC 15<br />
CBRF-Dev. Disabled Aurora Res. Alternatives Inc. 099 5<br />
CBRF-Adv. Age/Dementia Arthur-Rose LLC 8<br />
CBRF-Other Aurora Res. Alternatives Inc. 005 8<br />
CBRF-Dev. Disabled Aurora Res. Alternatives Inc. 033 8<br />
Nursing Home New Richmond Meadows 61<br />
Nursing Home St. Croix Health Center 72<br />
Residential Care Apts. The Deerfield RCAC 17<br />
River Falls Nursing Home Kinnic Long Term Care 68<br />
Nursing Home Lutheran Home-River Falls 60<br />
Woodville Nursing Home Park View Home Inc 56<br />
source: Wisconsin Department <strong>of</strong> Health Services, July 2008.<br />
St. Croix County Conditions and Trends Report 159
Parks and Recreation Facilities<br />
Visitors and residents <strong>of</strong> St. Croix County have many recreational opportunities. The<br />
majority <strong>of</strong> park and recreational planning in St. Croix County occurs at the local level<br />
or, for County and State facilities, under the direction <strong>of</strong> St. Croix County Parks<br />
Department and the Wisconsin Department <strong>of</strong> Natural Resources, respectively. Any<br />
specific circum<strong>st</strong>ances, issues, or policies associated with parks and recreational facilities<br />
specific to a community will be addressed in the utilities and community facilities<br />
element <strong>of</strong> the respective, individual community plan.<br />
Recreation facilities in the County are<br />
largely associated with the County’s<br />
natural resources. St. Croix County<br />
boa<strong>st</strong>s 7,615 surface acres <strong>of</strong> fishing<br />
lakes and 80.9 miles <strong>of</strong> trout <strong>st</strong>reams, in<br />
addition to its rivers (e.g., Willow,<br />
Kinnickinnic, Apple, St. Croix). The St.<br />
Croix, Willow, and Apple are popular<br />
canoe waters. Tubing on the Apple<br />
River in the Somerset area is a<br />
regionally known attraction. The Float-<br />
Rite Amphitheatre in Somerset draws<br />
thousands each summer to outdoor<br />
Troy Breach, Town <strong>of</strong> Troy<br />
concerts. Only four lakes-Bass Lake,<br />
Cedar Lake, Lake Mallalieu, and Lake<br />
St. Croix-are large enough to accommodate water skiing and larger pleasure boats.<br />
Outdoor enthusia<strong>st</strong>s can also enjoy six golf courses and three shooting ranges which are<br />
open to the public.<br />
During winter months, snowmobilers can enjoy over 200 miles <strong>of</strong> groomed, public<br />
snowmobile trails and cross-country skiing is available at numerous <strong>of</strong> locations (e.g.,<br />
Home<strong>st</strong>ead Parklands, Glen Hills Park, Willow River State Park, numerous golf courses).<br />
The Badlands Recreation Area in the Town <strong>of</strong> Hudson is popular for snowboarding, snow<br />
tubing, and skiing. Many communities also provide ice-skating rinks.<br />
St. Croix County currently only has two <strong>of</strong>f-road recreation trails <strong>of</strong> County or regional<br />
significance. The Willow River trail runs through a portion <strong>of</strong> Willow River State Park<br />
and it has been proposed to extend this trail to the northea<strong>st</strong>, eventually connecting with<br />
the Cattail State Trail in Amery and the Wild Rivers State Trail in Rice Lake.<br />
The Wildwood Trail <strong>st</strong>retches for seven miles between Woodville through the Town <strong>of</strong><br />
Eau Galle. Residents in the Spring Valley area have been working on plans for the<br />
eventual extension <strong>of</strong> this trail to Spring Valley and Elmwood. On March 18 th , 2008, the<br />
St. Croix County Parks and Recreation Bicycle and Pede<strong>st</strong>rian Plan was adopted which<br />
discusses these potential projects and other potential trail improvements. Many<br />
communities have also e<strong>st</strong>ablished their own trail sy<strong>st</strong>ems and plans.<br />
160 Utilities and Community Facilities Information
No complete inventory <strong>of</strong> all parks and recreation areas in the County exi<strong>st</strong>s. Some<br />
recreation areas may be on private land or maintained by a community organization,<br />
while school facilities (e.g., playgrounds, ballfields, basketball courts) are <strong>of</strong>ten used by<br />
the public for outdoor recreation in many communities. And the definition <strong>of</strong> parks and<br />
recreation areas can vary significantly by community. For in<strong>st</strong>ance, in a rural area, a<br />
small, unimproved pull-out for fishing along a river bank may perform an important<br />
recreational function.<br />
Table 4.10 is a li<strong>st</strong> <strong>of</strong> the primary<br />
County and municipal recreational<br />
facilities in St. Croix County. Data for<br />
Table 4.10 was taken from the St.<br />
Croix County Outdoor Recreation<br />
Plan which was la<strong>st</strong> updated in 2006,<br />
comprehensive plans on file at<br />
WCWRPC, and community webpages.<br />
Not included are mo<strong>st</strong> boat ramps,<br />
trails, unimproved waysides, school<br />
facilities, and State lands. In many<br />
cases, communities will need to update<br />
and amend this li<strong>st</strong> and consider<br />
resident demand for park facilities<br />
during their comprehensive planning<br />
efforts<br />
Somerset Village Park<br />
Privately owned facilities are also not li<strong>st</strong>ed in Table 4.10, such as those provided by a<br />
community group or maintained by a homeowners’ association. For in<strong>st</strong>ance, at lea<strong>st</strong> ten<br />
different homeowners’ associations provide parks for their residents in the Town <strong>of</strong><br />
Hudson. Many communities require developers to provide such parks as part <strong>of</strong> their<br />
development or make payments towards parkland in lieu <strong>of</strong> dedications. Some towns<br />
work cooperatively with and contribute to neighboring incorporated areas in the<br />
development <strong>of</strong> parklands, such as the partnership between the Town <strong>of</strong> Somerset and<br />
Village <strong>of</strong> Somerset.<br />
Many <strong>of</strong> the available nature-based outdoor recreational amenities (e.g., County, Wildlife<br />
Areas) are discussed in the Agricultural, Natural, and Cultural Resources section <strong>of</strong> this<br />
<strong>report</strong>. Bicycling is covered previously in the Transportation section. If State grant<br />
funding is being considered for outdoor recreation amenities, a State-reviewed outdoor<br />
recreation plan, adopted within the la<strong>st</strong> five years, is a required prerequisite.<br />
St. Croix County Conditions and Trends Report 161
Table 4.10 – Primary Parks in St. Croix County<br />
Owner Facility Facility Type Location Notes<br />
Federal (U.S. Army CoE) Eau Galle Recreation Area park/camp T. Eau Galle, Cady 750 ac, eque<strong>st</strong>rian trails<br />
Federal (Ntnl Park Srvc) St. Croix National Scenic Riverway special along St. Croix River <strong>of</strong>fice, boat launches<br />
State <strong>of</strong> Wisconsin Willow River State Park park/camp T. Hudson, St. Joseph 2,891 acres<br />
Emerald Wayside (STH 63) wayside T. Emerald 2 acres<br />
Houlton Wayside (STH 35) wayside T. St. Joseph 1 acre<br />
Hudson Touri<strong>st</strong> Info Center (I-94) wayside C. Hudson on Carmichael Road<br />
Kinnickinnic Wayside (STH 65) wayside T. Kinnickinnic hi<strong>st</strong>orical marker<br />
Barron County Apple River Undeveloped Property conservation T. Star Prairie 59 acres; fishing<br />
Bass Lake Boat Landing boat ramp T. Somerset fishing<br />
Glen Hills Park park/camp T. Springfield 700 acres<br />
Home<strong>st</strong>ead Parklands-Perch Lake park/day use T. St. Jospeph under development<br />
Pine Lake Park park/day use T. Erin Prairie fishing<br />
Troy Beach beach/day use T. Troy 7 acres<br />
Stanton County Fore<strong>st</strong> fore<strong>st</strong> T. Kinnickinnic 80 acres; hunting<br />
Kinnickinnic County Fore<strong>st</strong> fore<strong>st</strong> T. Kinnickinnic 80 acres; hunting<br />
Town <strong>of</strong> Cylon Cylon Community Park park picnic area<br />
Town <strong>of</strong> Hudson Hudson Town Park park/sports Town Hall, ballfields<br />
Town <strong>of</strong> Pleasant Valley Town Hall Play Area park at Town Hall playground, picinic<br />
Town <strong>of</strong> St. Joseph St. Joseph Town Park sports CTH E & V baseball, sledding, skiing<br />
Town <strong>of</strong> Stanton Town Hall Play Area park at Town Hall playground, picinic<br />
Town <strong>of</strong> Troy Glover Park park/sports Glover Road 40 ac<br />
Pemble's Access conservancy seasonal use<br />
Village <strong>of</strong> Baldwin Bailey Park park E. Main St. playground<br />
Baldwin Winter Green park/camp Hwy 63 sledding, primitive camp.<br />
Mill Pond Park park/sports E. Maple St. s<strong>of</strong>tball, soccer, etc.<br />
Little Creek Park park/sports 6th Ave. playground, basketball<br />
Windmill Park park/wayside Hwy 63 & Park St touri<strong>st</strong> center<br />
Village <strong>of</strong> Deer Park Deer Park Community Park park/sports Main St. s<strong>of</strong>tball, volleyball, etc<br />
Village <strong>of</strong> Hammond Hammond Community Park park/sports Park St. s<strong>of</strong>tball, skating, playground<br />
Village Recreation Area park Hwy 12 1 ac, playground<br />
Hiking/Walking Trail trail around the village 2.5 miles<br />
Village <strong>of</strong> North Hudson Brown's Beach beach 3rd Ave. 50-foot sand beach<br />
Eagle Woods Park park Deer Path playground<br />
Glen Oaks Park park 4th St. playground, hi<strong>st</strong>ory, basketb<br />
Green's Woodcre<strong>st</strong> Park park/open Partridge Lane trails<br />
Jensen Memorial Park open Lund Street passive rec.<br />
Pepper Fe<strong>st</strong> Park park/events 7th St. Pepperfe<strong>st</strong>, skating, playgrd<br />
Sommers Landing Park park/sports North End Rd. soccer<br />
St. Croix Station Park fore<strong>st</strong> Station Lane 8.59 ac<br />
Webset Park fore<strong>st</strong> Web<strong>st</strong>er St. 2.55 ac<br />
Woodcre<strong>st</strong> Park park 10th St. playground, trail<br />
Village <strong>of</strong> Roberts Roberts Community Park park/sports fe<strong>st</strong>ival, s<strong>of</strong>tball, playground<br />
Village <strong>of</strong> Somerset Somerset Village Park park/sports River St. baseball, canoe access, trail<br />
Veteran's Memorial Park park/sports Parnell St. memorial, playgrd, volleyb<br />
Larry Forre<strong>st</strong> Memorial Park park/sports playground, ballfields<br />
Village <strong>of</strong> Star Prairie Star Prairie Community Park park/sports ballfield, tennis, playground<br />
River Island Park park along Apple River fishing, canoeing<br />
Lyngaas Nature Center conservancy Saratoga Avenue 25 ac, trails<br />
Village <strong>of</strong> Wilson Wilson Community Park park/sports Wilson & Main s<strong>of</strong>tball, playground<br />
Village <strong>of</strong> Woodville Steven Memorial Park park/sports s<strong>of</strong>tball, playground, etc<br />
162 Utilities and Community Facilities Information
Table 4.10 – Primary Parks in St. Croix County continued<br />
Owner Facility Facility Type Location Notes<br />
City <strong>of</strong> Glenwood City Hinman Park park/sports 6th St. beach, playground<br />
Glenwood City Picnic Area park Hwy. 128 8 acres<br />
Glenwood City Ballfield sports/events County Fairgrounds<br />
City Skating Rink sports E. Oak St. 0.5 acres<br />
City <strong>of</strong> Hudson Anderson Park park River Ridge Rd. playground, tennis, basketb<br />
Birkmose Park park/hi<strong>st</strong>oric Coulee Road Indian burials; overlook<br />
Bridge Street Area open North Street views <strong>of</strong> St. Croix and Lake<br />
Burton Field sports 9th & 10th Sts. ballfields, skating, playgrd<br />
Coons Hill open Wisconsin St. sledding<br />
Grandview Park sports CTH UU ballfields, skating, volleyball<br />
Hilltop Park Hegen St.<br />
Lakefront Park park/beach on St. Croix swimming, sailboat, seawall<br />
Prospect Park park Wisconsin St. overlook, nature area<br />
Vine St. Square open Vine St. 5 ac, sledding<br />
Web<strong>st</strong>er Park open Laurel Ave. 2 ac, playfield<br />
Williams Park park Laurel Ave. 4 ac, playground<br />
City <strong>of</strong> New Richmond Hatfield Lake Regional Park park/sports Hatfield Lake 45 ac, ballfields, camping<br />
Cherokee Park open River Drive 1.75 ac, small back<strong>st</strong>op<br />
Citizen Field (Armory) sports/events 3rd St. Ea<strong>st</strong> football, baseball, Fe<strong>st</strong>ival<br />
Cyclone Park hi<strong>st</strong>orical STH 65 hi<strong>st</strong>orical marker<br />
Glover Park park/events 1<strong>st</strong> St. hi<strong>st</strong>oric, concerts<br />
Greaton Park park Grand Ave 3.6 ac play area<br />
Hemenway Park park 2nd St. Ea<strong>st</strong> fishing<br />
MaRita Park park Minnesota Ave 0.6 ac<br />
Mary Park park/events Green Ave. North playground, sports, art fair<br />
Mill Pond Walk trail at Mill Pond trail<br />
Monette Park park/sports Somerset St. playground, basketball, baseb<br />
New Richmond Nature Center conservation STH 64 1 mile nature trail<br />
Northside Park park 2nd Ave. playground, ice skating<br />
Paperjack & Greenway Park park/special CTH GG playground, prairie, museum<br />
Pine Bluff Park open Grand Ave. 9.5 ac; undeveloped<br />
Sports Center sports 5th St. ice skating<br />
Victoria/Memorial Park park STH 64 field games<br />
Woodland Creek Park park CTH A playground<br />
Doar Prairie Savana conservation we<strong>st</strong> side undeveloped<br />
Fox Run Park undeveloped ea<strong>st</strong> side undeveloped<br />
Ted McCabe Park Business 64<br />
L.G. Peterson Park Business 64<br />
Unnamed Park undeveloped 140th St. undeveloped<br />
St. Croix County Conditions and Trends Report 163
Cemeteries<br />
Table 4.11 li<strong>st</strong>s the cemeteries in St. Croix County as identified at the St. Croix County<br />
USGenWeb site (http://www.rootsweb.ance<strong>st</strong>ry.com/~wiSt. Croix/) and in the book<br />
Cemetery Locations in Wisconsin compiled by Linda Herrick and Wendy Uncapher.<br />
This li<strong>st</strong> does not necessarily include all smaller cemeteries, family plots, or Native<br />
American burial sites. Further, some <strong>of</strong> these cemeteries may be no longer in use. As<br />
needed, each individual community plan may identify any additional known cemeteries<br />
and any issues, needs, or policies related to those cemeteries in their community.<br />
Table 4.11 – St. Croix County Cemeteries<br />
Towns Cemeteries<br />
Baldwin Immanuel Evangelical Lutheran<br />
Cady Wilson<br />
Saint Michael<br />
Cylon Holy Rosary<br />
Cylon Methodi<strong>st</strong><br />
Eau Galle Brookville<br />
Emerald Greenwood<br />
Erin Prairie Saint Patrick's Catholic<br />
Fore<strong>st</strong> Fore<strong>st</strong><br />
Immanuel<br />
Saint John's Lutheran<br />
Glenwood St. Johns (may be in City)<br />
Hammond Catholic<br />
Hudson Saint Patrick's Catholic<br />
Kinnickinnic Kinnickinnic<br />
Pleasant Valley Pleasant Valley<br />
Richmond Boardman<br />
Rush River North Rush River<br />
Woodside<br />
Mt. Olivet (part in Pierce Co.)<br />
St. Joseph Houlton<br />
Pioneer<br />
Somerset German Lutheran Emmanuel<br />
Springfield Oakwood<br />
Stanton Stanton Township Catholic<br />
Star Prairie St. Croix Co. Poor Farm & Asylum<br />
Oakland<br />
Troy German Settlement/Schwalen<br />
Mann<br />
Warren Warren<br />
164 Utilities and Community Facilities Information
Dams<br />
Table 4.11 –St. Croix County Cemeteries continued<br />
Villages Cemeteries<br />
Baldwin Baldwin<br />
Peace<br />
Deer Park Calvary<br />
Hammond Old Hammond<br />
Hawkins<br />
Saint Mary's Catholic<br />
Somerset Hillside<br />
Saint Anne's Catholic<br />
Wilson Saint Bridget's Catholic<br />
Woodville Lone Pine<br />
Southside<br />
Sunset Memorial<br />
Cities Cemeteries<br />
Glenwood City Glenwood City<br />
Hudson Willow River<br />
New Richmond Immaculate Conception Catholic<br />
New Richmond<br />
River Falls Greenwood<br />
In total, St. Croix County has 59 dams, mo<strong>st</strong> being small earthen works for live<strong>st</strong>ock or<br />
recreational ponds and flowages. Only 16 dams have more than 10-acre feet <strong>of</strong> normal<br />
<strong>st</strong>orage. In mo<strong>st</strong> cases, if one <strong>of</strong> the smaller dams failed, the run<strong>of</strong>f down<strong>st</strong>ream would<br />
be hardly noticed. There may be the potential to remove some <strong>of</strong> the older smaller dams<br />
which no longer serve a function, in order to improve water quality and lower the risk <strong>of</strong><br />
failure. There has been no significant flooding due to dam failure since at lea<strong>st</strong> the mid-<br />
1960s.<br />
The following is a li<strong>st</strong> <strong>of</strong> those governments which own dams, dikes, or levees in St.<br />
Croix County:<br />
St. Croix County (10) 10 Dams in the Glen Hills/Glenwood City area<br />
St. Croix County, et. al. Lake Mallalieu/Lower Power Dam<br />
City <strong>of</strong> New Richmond Mill Pond Dam<br />
City <strong>of</strong> Hudson (2) Hudson #1 & #2 (unrated)<br />
Cedar Lake Improv. Di<strong>st</strong>rict Cedar Lake Dam (Small)<br />
Wisconsin DNR Little Falls Dam (High Hazard, Large)<br />
U.S. Fish & Wildlife (2) Prairie Flats 1 & 3 (Small)<br />
St. Croix County Conditions and Trends Report 165
There are nine high hazard dams in the County, six <strong>of</strong> which are owned by the County in<br />
the Glen Hills area (up<strong>st</strong>ream <strong>of</strong> Glenwood City and Downing), the Mill Pond Dam in<br />
New Richmond, the Riverdale Dam owned by Xcel Energy (up<strong>st</strong>ream <strong>of</strong> Somerset), and<br />
the WisDNR Little Falls Dam (up<strong>st</strong>ream <strong>of</strong> Hudson). One <strong>of</strong> the County-owned high<br />
hazard dams may be downgraded to low hazard in the near future if documentation<br />
regarding zoning down<strong>st</strong>ream is provided to WisDNR. The County also has two<br />
significant hazard dams—one in the Glenwood Hills area owned by the County and the<br />
Apple River Falls Dam owned by Xcel Energy. All <strong>of</strong> these dams are highly regulated,<br />
inspected regularly, and have emergency action plans on file with the St. Croix County<br />
Emergency Management <strong>of</strong>fice.<br />
For additional details on the dams <strong>of</strong> St. Croix County, their hazard ratings, and some key<br />
development <strong>trends</strong> in dam shadows, please see the St. Croix County Natural Hazards<br />
Mitigation Plan.<br />
Other Government Facilities<br />
No comprehensive li<strong>st</strong> <strong>of</strong> every<br />
Town <strong>of</strong> Hudson Hall<br />
government facility in St. Croix County<br />
exi<strong>st</strong>s. Such facilities can range from<br />
admini<strong>st</strong>rative and recreation buildings to<br />
airports and dams. Utilities, such as<br />
municipal wa<strong>st</strong>ewater, have corresponding<br />
facilities. The law enforcement and<br />
emergency services identified previously<br />
also have associated facilities, though<br />
some <strong>of</strong> these services may be co-located<br />
with other municipal functions. The<br />
following government facilities or related services have been discussed in other sections<br />
<strong>of</strong> this <strong>report</strong>:<br />
Airports & Transportation Infra<strong>st</strong>ructure see transportation section<br />
Public Wa<strong>st</strong>ewater Treatment Facilities (14) previously in this section<br />
Municipal & Community Water Sy<strong>st</strong>ems (11) previously in this section<br />
Law Enforcement & Emergency Services previously in this section<br />
Parks and Outdoor Recreation Facilities previously in this section<br />
Schools previously in this section<br />
Libraries previously in this section<br />
Dams previously in this section<br />
St. Croix County and each local municipal government has at lea<strong>st</strong> one <strong>st</strong>ructure in which<br />
admini<strong>st</strong>rative functions are carried out and services are provided. Towns, villages, and<br />
smaller cities typically have a single hall or municipal building, while larger villages,<br />
cities, and counties may have multiple buildings. Separate <strong>st</strong>ructures are also required for<br />
road, highway, public works, and maintenance; these sites may include recycling drop-<strong>of</strong>f<br />
facilities as well. In towns, the “town shop” is <strong>of</strong>ten co-located with the town hall, but<br />
166 Utilities and Community Facilities Information
not in all cases. Mo<strong>st</strong> counties have a primary Highway Department facility, with a<br />
number <strong>of</strong> smaller ancillary facilities for the <strong>st</strong>orage <strong>of</strong> vehicles, salt, sand, etc.,<br />
<strong>st</strong>rategically located throughout the <strong>county</strong>.<br />
The following is a very brief li<strong>st</strong> <strong>of</strong> other primary critical government facilities in St.<br />
Croix County which may be <strong>of</strong> importance during comprehensive planning efforts:<br />
� St. Croix County Government Center (Hudson)<br />
� St. Croix County Health Center (T. <strong>of</strong> Star Prairie)<br />
� St. Croix County Highway Department (Hammond)<br />
� St. Croix County Agricultural Services and Education Center<br />
(Baldwin)<br />
� Baldwin Village Hall and Public Works/Maintenance<br />
� Deer Park Village Hall and Public Works/Maintenance<br />
� Hammond Village Hall and Public Works/Maintenance<br />
� Somerset Village Hall and Public Works/Maintenance<br />
� Star Prairie Village Hall and Public Works/Maintenance<br />
� Wilson Village Hall and Public Works/Maintenance<br />
� Woodville Village Hall and Public Works/Maintenance<br />
� Glenwood City City Hall and Public Works/Maintenance<br />
� Hudson City Hall and Public Works/Maintenance<br />
� New Richmond City Hall and Public Works/Maintenance<br />
� Rice Lake City Hall and Public Works/Maintenance<br />
� Town Halls and Shops (21)<br />
The above li<strong>st</strong> is not complete and does not include Federal and State facilities (e.g. po<strong>st</strong><br />
<strong>of</strong>fices, DNR <strong>of</strong>fices). As part <strong>of</strong> their individual comprehensive planning efforts, each<br />
community may need to supplement the above li<strong>st</strong>, identify issues related to their<br />
facilities (e.g., availability, capacity, condition), and develop corresponding plan policies<br />
to address local concerns.<br />
Summary<br />
Utilities and community facilities in St. Croix County vary from small-scale facilities<br />
serving primarily local needs to regional facilities and networks serving large portions <strong>of</strong><br />
the County’s population. As municipalities grow and change, the infra<strong>st</strong>ructure, essential<br />
services, and related community facilities mu<strong>st</strong> evolve as well.<br />
This section presented an initial inventory <strong>of</strong> the principal utilities and community<br />
facilities <strong>of</strong> St. Croix County. During local planning efforts, this section may need to be<br />
supplemented to include additional facilities and details, and analyzed more closely to<br />
identify issues and community needs.<br />
St. Croix County Conditions and Trends Report 167
Utilities and Community Facilities Maps<br />
Map 4.2 – Electric Service in We<strong>st</strong> Central Wisconsin<br />
source: Wisconsin Public Service Commission<br />
168 Utilities and Community Facilities Information
Map 4.3 – Natural Gas Service in We<strong>st</strong> Central Wisconsin<br />
source: Wisconsin Public Service Commission<br />
St. Croix County Conditions and Trends Report 169
Map 4.4 – St. Croix County School Di<strong>st</strong>ricts<br />
source: U.S. Census TIGER Files, 2000<br />
170 Utilities and Community Facilities Information
Map 4.5 – St. Croix County Fire Di<strong>st</strong>ricts<br />
source: St. Croix County Land Information Office<br />
St. Croix County Conditions and Trends Report 171
Map 4.6 – St. Croix County Ambulance Service Areas<br />
source: St. Croix County Land Information Office<br />
172 Utilities and Community Facilities Information
5. AGRICULTURAL, NATURAL, AND CULTURAL<br />
RESOURCES INFORMATION<br />
Element Context<br />
St. Croix County’s hi<strong>st</strong>ory and development is rooted in its natural resources. Prior to<br />
settlement by those <strong>of</strong> European heritage, St. Croix County was covered in a variety <strong>of</strong><br />
different ecosy<strong>st</strong>ems including prairie, fore<strong>st</strong>, and marshland. The early settlers included<br />
traders and farmers, which both made a living from the natural resources from the land.<br />
By 1881, wheat became the main farm crop, along with oats, corn, potatoes, barley, rye,<br />
and hay for dairying. At the turn <strong>of</strong> the century, dairying became even more prominent.<br />
During the 20 th Century, agriculture, as a percentage <strong>of</strong> the economy, declined as more<br />
manufacturing, retail, and pr<strong>of</strong>essional employment opportunities arose in communities<br />
along the Inter<strong>st</strong>ate Highway 94 corridor. Even though the agricultural indu<strong>st</strong>ry<br />
decreased, well over half <strong>of</strong> the County’s land base remains in agricultural production.<br />
Concurrently, there has been significant growth pressure from the Twin Cities in the<br />
southwe<strong>st</strong>ern portion <strong>of</strong> the County. As outward migration progresses, this growth is<br />
beginning to impact additional areas to the north and ea<strong>st</strong>.<br />
During the fir<strong>st</strong> decade <strong>of</strong> the 21 <strong>st</strong> Century, the agriculture and natural resource indu<strong>st</strong>ries<br />
<strong>of</strong> St. Croix County have experienced a lift from both the increased intere<strong>st</strong> and<br />
inve<strong>st</strong>ment in local and organic food and renewable energy. The increase in demand for<br />
local and/or organic food has grown significantly since the turn <strong>of</strong> the century. This has<br />
helped exi<strong>st</strong>ing family farms and has provided a cataly<strong>st</strong> for new farms to <strong>st</strong>art in St.<br />
Croix County. In addition, the abundance <strong>of</strong> farmland and natural areas are providing St.<br />
Croix County an opportunity to take advantage <strong>of</strong> the growing renewable energy and bioenergy<br />
indu<strong>st</strong>ries. St. Croix County is currently experiencing a wide range <strong>of</strong> indu<strong>st</strong>ries,<br />
public entities, farms, and individuals that are utilizing farmland and natural areas as a<br />
source to pr<strong>of</strong>it from and/or save resources by using renewable resources and bio-energy.<br />
Scattered throughout St. Croix County remain many unique hi<strong>st</strong>orical <strong>st</strong>ructures and sites<br />
that are important ve<strong>st</strong>iges <strong>of</strong> its pa<strong>st</strong>. Through these changes, it is the characteri<strong>st</strong>ics <strong>of</strong><br />
St. Croix County’s natural and cultural resources that continue to define the local<br />
communities and provide the corner<strong>st</strong>one for the quality <strong>of</strong> life for local residents. Clean<br />
and abundant water is needed for drinking, indu<strong>st</strong>ry, and agriculture. Prime farmlands<br />
continue to provide the basis for the agricultural economy and for the preservation <strong>of</strong> the<br />
County’s rural character. A diversity <strong>of</strong> other natural habitats are protected and managed<br />
for ae<strong>st</strong>hetic value, recreational purposes, economic importance, and a healthy ecosy<strong>st</strong>em.<br />
Cultural and hi<strong>st</strong>oric resources are identified and preserved for their social and economic<br />
value.<br />
This section describes the exi<strong>st</strong>ing <strong>conditions</strong> <strong>of</strong> the agricultural, natural, and cultural<br />
resources <strong>of</strong> St. Croix County. These resources provide the foundation for mo<strong>st</strong>, if not all,<br />
St. Croix County Conditions and Trends Report 173
<strong>of</strong> the other comprehensive plan elements, and they may be discussed in numerous other<br />
places within the comprehensive plan. To plan for the future, a firm under<strong>st</strong>anding <strong>of</strong> the<br />
resource base <strong>of</strong> the community is needed.<br />
This provides an important context for developing objectives, policies, goals, maps, and<br />
programs for the conservation and promotion <strong>of</strong> the effective management <strong>of</strong> the<br />
agricultural, natural, and cultural resources for each participating community, as required<br />
by Wisconsin comprehensive planning legislation (Wis. Stat. § 66.1001(2)(e)). It should<br />
also be noted that under Wisconsin Comprehensive Planning Law, the term “cultural<br />
resources” includes hi<strong>st</strong>oric buildings and <strong>st</strong>ructures as well as ancient and hi<strong>st</strong>oric<br />
archeological sites.<br />
This element is further organized into six sub-sections:<br />
� Agricultural Resources<br />
� Natural Resources - Physical Features<br />
� Natural Resources - Sensitive Lands<br />
� Cultural Resources<br />
� Exi<strong>st</strong>ing Agricultural, Natural, and Cultural Programs<br />
� Summary and Conclusion<br />
Considerable portions <strong>of</strong> this element are adapted from the U.S. Census Bureau, U.S.<br />
Department <strong>of</strong> Agriculture, Wisconsin Department <strong>of</strong> Revenue, Wisconsin Department <strong>of</strong><br />
Natural Resources, Wisconsin State Hi<strong>st</strong>orical Society, and Soil Survey <strong>of</strong> St. Croix<br />
County, Wisconsin, among other sources.<br />
The maps for this section will be located in Appendix A: St. Croix County Resource<br />
Maps. In addition, the maps will be located in the St. Croix County Resource and Land<br />
Use Atlas DVD-ROM.<br />
Agricultural Resources<br />
Local Agricultural Indu<strong>st</strong>ry Trends<br />
Although not as dominant as an indu<strong>st</strong>ry as some surrounding counties, agriculture is an<br />
important element <strong>of</strong> the social and economic characteri<strong>st</strong>ics <strong>of</strong> St. Croix County.<br />
Changes in agriculture due to socio-economic <strong>conditions</strong> and the development pressures<br />
to convert agricultural land to other uses can have pr<strong>of</strong>ound impacts in St. Croix County<br />
and surrounding communities. The majority <strong>of</strong> agricultural land in St. Croix County is<br />
located in the we<strong>st</strong>ern and southern halves <strong>of</strong> the <strong>county</strong> (Map 5.1).<br />
In 2002, there were 130 more farms in St. Croix County than in 1978. Between 1992 and<br />
2002, there was an increase <strong>of</strong> 473 farms in the <strong>county</strong> (See Figure 5.1). The average<br />
farm size decreased from 211 acres in 1978 to 166 acres in 2002. Again analyzing<br />
between 1992 and 2002, average farm sizes dropped from 222 acres to 166 acres. From<br />
1978 to 2002, the number <strong>of</strong> farms increased by 7.5 percent and average farm size<br />
decreased 21 percent. Between 1992 and 2002, these numbers are a 34% increase in total<br />
174 Agricultural, Natural, and Cultural Resources Information
farms and a decrease <strong>of</strong> 25% for average farm size. This data shows that St. Croix County<br />
is experiencing a highly significant increase in small farms. It needs to be noted that the<br />
U.S. Census Bureau defines “farm” as any place from which $1,000 or more <strong>of</strong><br />
agricultural products were produced and sold, or normally would have been sold during<br />
the census year.<br />
Figure 5.1 - Number and Average Size <strong>of</strong> Farms - 1978 to 2002 – St. Croix County<br />
Source: U.S. Department <strong>of</strong> Agriculture, Census <strong>of</strong> Agriculture<br />
Number <strong>of</strong> Farms<br />
2,000<br />
1,800<br />
1,600<br />
1,400<br />
1,200<br />
1,000<br />
1978 1982 1987 1992 1997 2002<br />
Year<br />
Farms Acres/Farm<br />
This trend can be at lea<strong>st</strong> partially attributed to the out-migration <strong>of</strong> people living in the<br />
Twin City Metropolitan Area to rural areas, as St. Croix County is located in the Twin<br />
City MSA and is in the commuter shed for workers employed in the Twin Cities. The<br />
trend <strong>of</strong> an increasing number <strong>of</strong> farms and decreasing average farm size is the direct<br />
opposite <strong>of</strong> mo<strong>st</strong> areas in Wisconsin and the United States. The St. Croix County trend<br />
can be deceiving in the sense that many <strong>of</strong> these newer farms are not producing crops and<br />
much <strong>of</strong> their land is not in cultivation. The majority <strong>of</strong> these newer farms can be<br />
classified as hobby farms or large lot residential uses with limited live<strong>st</strong>ock.<br />
According to the USDA, farmland declined by 55,654 acres (87 square miles) or 15<br />
percent, between 1978 and 2002 (See Table 5.1). Farm acres accounted for 78 percent <strong>of</strong><br />
the total land area in the <strong>county</strong> in 1978 and 66 percent in 2002. As shown in Table 5.2,<br />
in 2002, approximately 90 percent <strong>of</strong> the farms in St. Croix County were non-corporation<br />
individual or family farms.<br />
Table 5.1 - Acres in Farmland – 1987 to 2002 – St. Croix County<br />
1978 1982 1987 1992 1997 2002<br />
Acres 365,832 352,472 334,028 308,460 342,478 310,178<br />
Percent <strong>of</strong> County Land Area 78% 76% 71% 65% 73% 66%<br />
Source: U.S. Department <strong>of</strong> Agriculture, National Agricultural Stati<strong>st</strong>ics Service<br />
St. Croix County Conditions and Trends Report 175<br />
300<br />
250<br />
200<br />
150<br />
100<br />
50<br />
0<br />
Acres
Table 5.2 - Number <strong>of</strong> Farms by Ownership – 1987 to 2002 – St. Croix County<br />
Ownership 1978 1982 1987 1992 1997 2002<br />
Individual/Family Farms 1,537 1,505 1,346 1,193 1,681 1,672<br />
Partnership 167 178 175 127 120 109<br />
Corporation – Family 23 50 51 59 64 64<br />
Corporation – Other 1 1 2 5 9 3<br />
Other (Coop, Tru<strong>st</strong>, etc...) 6 7 2 7 21 16<br />
Source: U.S. Department <strong>of</strong> Agriculture, National Agricultural Stati<strong>st</strong>ics Service<br />
The towns <strong>of</strong> Erin Prairie (16,831), Emerald (15,837), Hammond (15,652), and Fore<strong>st</strong><br />
(15,238) have the greate<strong>st</strong> number <strong>of</strong> assessed agricultural acres (See Table 5.3). In<br />
comparison, the towns <strong>of</strong> Hudson, Pleasant Valley, Rush River, Saint Joseph, and Star<br />
Prairie all have less than 9,000 assessed acres in agricultural use.<br />
The assessed agricultural acreage has declined by 90,051 acres from 1990 to 2007 in St.<br />
Croix County. The large<strong>st</strong> loss, which was 7,298 acres, occurred in Somerset. Other<br />
sub<strong>st</strong>antial losses occurred in the towns <strong>of</strong> Star Prairie (-7,176), Richmond (-6,029), and<br />
Eau Galle (-5,999). The cities and villages that also saw large agricultural land losses<br />
were Wilson (-713), Glenwood City (-490), and Star Prairie (-304). The City <strong>of</strong> New<br />
Richmond experienced an increase <strong>of</strong> 1,308 acres.<br />
In total, this amounted to a 26.5 percent reduction in assessed agricultural land in St.<br />
Croix County from 1990 to 2007. That is a loss <strong>of</strong> about 1.6 percent per year during that<br />
period. Of the towns, Hudson (-69 percent), Star Prairie (-50.4 percent), Somerset (-41.2<br />
percent), Saint Joseph (-35.4 percent), Eau Galle (-33.9 percent), and Richmond (-33.3)<br />
had the large<strong>st</strong> percentage reductions in agricultural land. Of the cities and villages, the<br />
large<strong>st</strong> percentage losses <strong>of</strong> assessed agricultural lands occurred in the City <strong>of</strong> Hudson<br />
(-100 percent) and Village <strong>of</strong> Somerset (-88.8 percent). At the same time, the majority <strong>of</strong><br />
the incorporated communities had percentage losses <strong>of</strong> over 30 percent. Hammond and<br />
New Richmond’s increases can be attributed to annexation.<br />
The number <strong>of</strong> dairy farms in<br />
St. Croix County has<br />
continued to decrease over<br />
the pa<strong>st</strong> two decades, with<br />
228 dairy farms comprising<br />
12 percent <strong>of</strong> the total farms<br />
in 2002. In 1987, St. Croix<br />
County was home to 671<br />
dairy farms (42.5 percent <strong>of</strong><br />
the total farms), which was<br />
443 more dairy farms than<br />
exi<strong>st</strong>ed in 2002. This is a 66<br />
percent decrease in the<br />
number <strong>of</strong> dairy farms in St.<br />
Croix County between 1987<br />
and 2002. With the County’s<br />
increase in smaller non-<br />
Dairy farm in St. Croix County.<br />
176 Agricultural, Natural, and Cultural Resources Information
traditional farms, the 12 percent <strong>of</strong> total farms can also be defined as misleading, since<br />
many farms are not traditional crop producing operations. However, the 66 percent<br />
reduction <strong>of</strong> dairy farms over a 15 year time span is extremely significant.<br />
Table 5.3 Assessed Agricultural Parcels and Acreage by Municipality – 1990 and 2007 – St.<br />
Croix County<br />
Total Parcels Total Acres<br />
1990 2007 # Change 1990 2007 # Change % Change<br />
TOWNS<br />
Baldwin 649 589 -60 18,601 14,325 -4,276 -23.0<br />
Cady 558 587 29 16,266 14,408 -1,858 -11.4<br />
Cylon 503 458 -45 15,039 12,179 -2,860 -19.0<br />
Eau Galle* 669 585 -84 17,703 11,704 -5,999 -33.9<br />
Emerald 614 589 -25 19,371 15,837 -3,534 -18.2<br />
Erin Prairie 597 539 -58 19,770 16,831 -2,939 -14.9<br />
Fore<strong>st</strong> 564 538 -26 20,108 15,238 -4,870 -24.2<br />
Glenwood 617 621 4 19,152 13,972 -5,180 -27.0<br />
Hammond 642 644 2 20,064 15,652 -4,412 -22.0<br />
Hudson 334 122 -212 8,136 2,524 -5,612 -69.0<br />
Kinnickinnic 664 637 -27 17,907 14,196 -3,711 -20.7<br />
Pleasant Valley 338 313 -25 10,577 8,942 -1,635 -15.5<br />
Richmond 588 479 -109 18,092 12,063 -6,029 -33.3<br />
Rush River 341 330 -11 10,088 8,188 -1,900 -18.8<br />
Saint Joseph 426 312 -114 11,340 7,328 -4,012 -35.4<br />
Somerset 738 483 -255 17,706 10,408 -7,298 -41.2<br />
Springfield 610 519 -91 18,408 12,899 -5,509 -29.9<br />
Stanton 563 494 -69 17,594 14,087 -3,507 -19.9<br />
Star Prairie 535 311 -224 14,230 7,054 -7,176 -50.4<br />
Troy 634 477 -157 16,840 12,124 -4,716 -28.0<br />
Warren 621 524 -97 18,764 13,678 -5,086 -27.1<br />
TOTALS 11,805 10,151 -1,654 345,756 253,637 -92,119 -26.6<br />
VILLAGES<br />
Baldwin 25 16 -9 305 264 -41 -13.4<br />
Deer Park 10 11 1 326 196 -130 -39.9<br />
Hammond 18 30 12 513 690 177 34.5<br />
North Hudson 0 0 0 0 0 0 n/a<br />
Roberts 0 16 16 0 56 56 n/a<br />
Somerset 16 2 -14 259 29 -230 -88.8<br />
Star Prairie 34 29 -5 800 496 -304 -38.0<br />
Spring Valley** n/a 4 4 n/a 64 n/a n/a<br />
Wilson 37 19 -18 935 222 -713 -76.3<br />
Woodville 16 12 -4 315 135 -180 -57.1<br />
TOTAL 156 139 -17 3453 2152 -1,301 -37.7<br />
CITIES<br />
Glenwood City 39 15 -24 805 315 -490 -60.9<br />
Hudson 11 0 -11 270 0 -270 -100.0<br />
New Richmond 7 36 29 136 1,444 1,308 961.8<br />
River Falls 20 8 -12 286 107 -179 -62.6<br />
TOTAL 77 59 -18 1497 1866 369 24.6<br />
COUNTY TOTAL 12038 10349 -1689 350,706 257,655 -93,051 -26.5<br />
Source: Wisconsin Department <strong>of</strong> Revenue<br />
* Eau Galle did not have information available for 1990, so 1989 data was used.<br />
** Spring Valley did not have information available for 1989, 1990, and 1991.<br />
St. Croix County Conditions and Trends Report 177
Hay and silage production was the mo<strong>st</strong> common crop in 2002, with 904 farms producing<br />
hay on more than 58,000 acres. Corn production for grain and silage and soybeans<br />
represents the next mo<strong>st</strong> common use <strong>of</strong> these agricultural lands, with 253 farms using<br />
approximately 13,500 acres for seed and grain production, and an additional 230 farms<br />
cultivating 32,000 acres for soybeans. In 2002, St. Croix County ranked fir<strong>st</strong> in<br />
Wisconsin for number <strong>of</strong> quail and 113 th nationally. The County ranked number six in the<br />
<strong>st</strong>ate for number <strong>of</strong> turkeys. Analyzing the increase in farms and decreasing size <strong>of</strong><br />
average number <strong>of</strong> acres, it should be noted that St. Croix County ranks number seven in<br />
the <strong>st</strong>ate for number <strong>of</strong> horses, ponies, mule, burros, and donkeys, which usually do not<br />
need as many acres as cultivation. This again shows that a no<strong>table</strong> amount <strong>of</strong> farms in the<br />
<strong>county</strong> do not take part in traditional farming.<br />
Figure 5.2 - Number <strong>of</strong> Farm and Dairy Farms - 1987 to 2002 – St. Croix County<br />
Number <strong>of</strong> Farms<br />
2,000<br />
1,800<br />
1,600<br />
1,400<br />
1,200<br />
1,000<br />
800<br />
600<br />
400<br />
200<br />
0<br />
1987 1992 1997 2002<br />
Year<br />
Source: U.S. Department <strong>of</strong> Agriculture, Census <strong>of</strong> Agriculture<br />
Total Farms Dairy Farms<br />
2,000<br />
1,800<br />
1,600<br />
1,400<br />
1,200<br />
1,000<br />
Over the pa<strong>st</strong> few years, St. Croix County has seen an increase in the number <strong>of</strong> farms<br />
that are supplying the growing number <strong>of</strong> consumers that want to purchase local food<br />
and/or organic food. Specifically for certified organic operations, in 2002, St. Croix<br />
County had seven certified organic farms. At this time, there are currently dozens <strong>of</strong><br />
farms in St. Croix County that support the local and/or organic markets. These direct<br />
market farms are marketing themselves locally and regionally. Due to the County’s close<br />
proximity to the Twin Cities and Eau Claire, there are extensive markets for these farms.<br />
In addition, St. Croix County currently has weekly farmers markets in Hudson during the<br />
summer and fall months. In addition, numerous farmers’ markets are located in adjacent<br />
counties, and in many cases are closer than the one in Hudson for residents in St. Croix<br />
County.<br />
178 Agricultural, Natural, and Cultural Resources Information<br />
800<br />
600<br />
400<br />
200<br />
0<br />
Number <strong>of</strong> Farms
Direct market farms have a variety <strong>of</strong> impacts on the environment and economy.<br />
Environmentally, farms that are organic pollute the land, ground water, or surface water<br />
on-site and down<strong>st</strong>ream significantly less than farms that are not organic. Second, these<br />
farms reduce the amount <strong>of</strong> energy used for the transportation aspect <strong>of</strong> agriculture.<br />
Economically, the money that is spent purchasing food from these local farms initially<br />
<strong>st</strong>ay in the local/regional economy, as opposed to being sent to different regions <strong>of</strong> the<br />
<strong>county</strong> and/or outside the U.S. The money spent on direct market food is <strong>of</strong>ten circulated<br />
in the local economy several times, which is important in creating a su<strong>st</strong>ainable local<br />
economy. La<strong>st</strong>ly, with purchasing local food, in mo<strong>st</strong> cases the food is significantly better<br />
quality (e.g. freshness, ta<strong>st</strong>e) than food that is transported from outside the region.<br />
A sample <strong>of</strong> St. Croix County direct market farms that cater to local and/or organic<br />
market:<br />
- Bass Lake Cheese Factory<br />
- Blue Cloud Farms<br />
- Blue Collar Farm<br />
- Blue Gentian Farm<br />
- Blue Ridge Growers<br />
- Do-Re-Mi Farm<br />
- Grass Roots Meat<br />
- K-Lund Angus Farm<br />
- King Sting Honey<br />
- Lake Country Land School CSA<br />
- Leverty’s Trees<br />
- My Si<strong>st</strong>er’s Garden<br />
- OK Gardens<br />
- Pure Sun Family Farm<br />
- Silver Bison Ranch and Shop<br />
- Threshing Table Farm<br />
- VanSomeren Gardens<br />
- Wolf Honey Farm<br />
- Willow River Tree<br />
At the same time that St. Croix County is experiencing an increase in the number <strong>of</strong><br />
direct market farms, St. Croix County has also seen an increase in the intere<strong>st</strong> and<br />
inve<strong>st</strong>ment in renewable energy, primarily from the wood sector. At this time, several<br />
farms, companies, and individuals are working on creating fuel from local sources. In<br />
addition, a variety <strong>of</strong> on-site bio-diesel and <strong>st</strong>raight vege<strong>table</strong> oil production operations<br />
can be found throughout the County. In regards to energy use, different units <strong>of</strong><br />
government and school di<strong>st</strong>ricts in St. Croix County are heating buildings from local<br />
wood feed<strong>st</strong>ock. La<strong>st</strong>ly, St. Croix County has seen an increase in companies that are<br />
manufacturing goods to support this inve<strong>st</strong>ment and entrepreneurship. As a whole, the<br />
local and organic agricultural market and renewable energy market are playing a<br />
significant role in the County’s economy.<br />
St. Croix County Conditions and Trends Report 179
Left to right: Anaerobic dige<strong>st</strong>er at Emerald Dairy / Reverse osmosis machine at Emerald Dairy. Emerald Dairy has an<br />
anaerobic dige<strong>st</strong>er which reduces the amount <strong>of</strong> methane released on the farm. At the same time, the dairy is<br />
experimenting with additional value added products as the result <strong>of</strong> warm water creation.<br />
Prime Agricultural Lands<br />
Prime agricultural land is the land that is be<strong>st</strong> suited for food, feed, forage, fiber, and oil<br />
seed crops. It may be cultivated land, pa<strong>st</strong>ure, woodland, or other land, but it is not<br />
exi<strong>st</strong>ing urban and developed land or water areas. The soil qualities, growing season and<br />
moi<strong>st</strong>ure supply are those needed for a well managed soil to produce a su<strong>st</strong>ained high<br />
yield <strong>of</strong> crops in an economic manner. Prime agricultural land is able to produce the<br />
highe<strong>st</strong> yields with the minimal inputs <strong>of</strong> energy and economic resources.<br />
The Natural Resources Conservation Service (NRCS), formerly known as the Soil<br />
Conservation Service (SCS), has e<strong>st</strong>ablished a sy<strong>st</strong>em <strong>of</strong> soils classification to uniformly<br />
evaluate the potential suitability <strong>of</strong> soils for agriculture production. The Capability<br />
Classification <strong>of</strong> Soils is published as part <strong>of</strong> the Soil Survey <strong>of</strong> St. Croix County,<br />
Wisconsin.<br />
The capability classification is a grouping <strong>of</strong> soils that shows, in a general way, how<br />
sui<strong>table</strong> soils are for mo<strong>st</strong> kinds <strong>of</strong> farming. The capability classification sy<strong>st</strong>em is<br />
intended to help decision-makers evaluate areas for their desirability for continued<br />
agricultural productivity. It does this by considering characteri<strong>st</strong>ics and suitability for<br />
supporting various crops and activities, and is based on the limitations <strong>of</strong> the soils, risk <strong>of</strong><br />
damage as they are used, and the way they respond to treatment. Soils are classified in<br />
capability classes, subclasses, and units in accordance with the degree and kind <strong>of</strong> their<br />
permanent limitations, but without consideration <strong>of</strong> major and generally expensive landforming<br />
that would change the slope, depth, or other characteri<strong>st</strong>ics <strong>of</strong> the soil, and<br />
without consideration <strong>of</strong> possible but unlikely major reclamation projects.<br />
Class I, II, and III soils are considered prime farmland under the classification sy<strong>st</strong>em and<br />
are each defined as:<br />
� Class I -- Class I soils have few limitations that re<strong>st</strong>rict their use.<br />
180 Agricultural, Natural, and Cultural Resources Information
� Class II -- Class II soils have some limitations that reduce the choice <strong>of</strong> plants or<br />
require moderate conservation practices.<br />
� Class III -- Class III soils have severe limitations that reduce the choice <strong>of</strong> plants or<br />
require special conservation practices, or both. They can be cultivated safely with<br />
special precautions.<br />
Of the total land acres in St. Croix County, 344,327 acres (538 square miles) are<br />
classified as Class I, II, and III soils by the NRCS. These soils make up 73 percent <strong>of</strong> the<br />
total land acres <strong>of</strong> the <strong>county</strong> (See Table 5.4). Of the total area in St. Croix County, no<br />
soils are Class I, 54.5 percent are Class II soils, and 18.5 percent are Class III soils.<br />
Table 5.4<br />
Soil Capability Classification for Potentially Productive Agricultural Lands – St. Croix<br />
County<br />
Soils Acres Percent <strong>of</strong> Total Land<br />
Acreage<br />
Class I 0 0<br />
Class II 256,919 54.5<br />
Class III 87,408 18.5<br />
Total Classes I, II & III 344,327 73%<br />
Source: St. Croix County Soil Survey<br />
Map 5.2 shows soils that are classified as Class I, II, and III. These are areas where the<br />
soils and other land characteri<strong>st</strong>ics are likely to be highly suited for agricultural activity.<br />
The value <strong>of</strong> these lands is associated with not only their soil class, but also with their<br />
size, present use and any regulatory framework for their protection. Preserving these<br />
prime farmlands helps su<strong>st</strong>ain the County’s agricultural economy and rural character.<br />
Natural Resources – Physical Features<br />
The following primary physical features <strong>of</strong> St. Croix County are discussed in this<br />
subsection:<br />
� Topography<br />
� Geology<br />
� Soils<br />
� Mineral Resources<br />
� Watersheds and Surface Waters<br />
� Groundwater<br />
� Air quality<br />
Topography<br />
The topography <strong>of</strong> St. Croix County ranges from gently rolling to <strong>st</strong>eep ridges along<br />
<strong>st</strong>ream valleys. Local relief in the County ranges from almo<strong>st</strong> 1,300 feet in the ea<strong>st</strong>ern hill<br />
area down to 675 feet in the southwe<strong>st</strong> (Map 5.3). About 65 percent <strong>of</strong> the soils in St.<br />
Croix County are considered nearly level or gently sloping with only about 15 percent<br />
classified as moderately to very <strong>st</strong>eep. Generally, the more rugged topography can be<br />
St. Croix County Conditions and Trends Report 181
found in southern parts <strong>of</strong> the County and along the ea<strong>st</strong>ern edge, while the central part <strong>of</strong><br />
the <strong>county</strong> is a gently undulating plain.<br />
Topography is an important factor in determining flood risks and vulnerabilities. Mo<strong>st</strong><br />
surface waters drain to the south and we<strong>st</strong>, toward the St. Croix and Mississippi River,<br />
with the exception <strong>of</strong> far ea<strong>st</strong>ern portions <strong>of</strong> the County, such as the areas surrounding<br />
Glenwood City and Wilson, which drain towards Dunn County to the ea<strong>st</strong>.<br />
Approximately 85 percent <strong>of</strong> the County is classified as uplands, which may be less<br />
prone to the vulnerabilities associated with large flooding events, but where <strong>st</strong>ormwater<br />
or flash flooding may be a more common problem. Stormwater erosion and flash<br />
flooding can be a significant concern for those areas with moderate to <strong>st</strong>eep topography,<br />
in particular where development interrupts natural drainage sy<strong>st</strong>ems.<br />
Geology<br />
St. Croix County’s geology is diverse. The <strong>county</strong> is made up <strong>of</strong> Paleozoic Rocks. Within<br />
this range, the County consi<strong>st</strong>s <strong>of</strong> Cambrian Group, Prairie Du Chien Group, Ancell<br />
Group, and Sinnipee Group. St. Croix County is mo<strong>st</strong>ly Ground Moraine. The northwe<strong>st</strong><br />
portion <strong>of</strong> the County consi<strong>st</strong>s <strong>of</strong> both Recessional Moraines and Pitted Outwash. This<br />
diverse geologic pattern creates a landscape that changes from one location to another<br />
within the County<br />
Closed depressions (or sinkholes) are common in St. Croix County. Closed depressions<br />
and the resulting kettles in the we<strong>st</strong>ern and northwe<strong>st</strong>ern parts <strong>of</strong> the County were<br />
typically formed from the melt <strong>of</strong> glacial ice within buried glacial deposits. In the ea<strong>st</strong>ern<br />
parts <strong>of</strong> the County, closed depressions and the resulting sinkholes are common when<br />
lime<strong>st</strong>one bedrock was eroded, which is referred to as kar<strong>st</strong> development. Since closed<br />
depressions sometimes <strong>of</strong>fer minimal soil layers between the bottom <strong>of</strong> the depressions<br />
and the bedrock underneath, they are a significant potential source <strong>of</strong> groundwater<br />
contamination. The hazards materials incidents section <strong>of</strong> the St. Croix County All<br />
Hazards Mitigation Plan and the groundwater section <strong>of</strong> this document <strong>of</strong>fer more<br />
discussion on closed depressions and related groundwater concerns.<br />
Soils<br />
Soil properties are an important factor in how land is used. Soils determine how<br />
productive farmland is, and the type and amount <strong>of</strong> development that can be reasonably<br />
supported based on the various soil characteri<strong>st</strong>ics. In fact, the be<strong>st</strong> use <strong>of</strong> the land is<br />
<strong>of</strong>ten dictated by the types <strong>of</strong> soils there are in an area. Subsequently, identifying and<br />
reviewing soil suitability interpretations, for specific urban and rural land uses, are<br />
essential for physical development planning and determining the mo<strong>st</strong> sui<strong>table</strong> land use.<br />
The following is a li<strong>st</strong>ing <strong>of</strong> the generalized soils located in St. Croix County and<br />
corresponds to Map 5.4 located in Appendix A. Each association contains several major<br />
and minor soils in a pattern that varies throughout the association. The soils within an<br />
association differ in many properties such as drainage, wetness, slope, and depth to<br />
182 Agricultural, Natural, and Cultural Resources Information
edrock. These characteri<strong>st</strong>ics affect the suitability <strong>of</strong> the land for agriculture and for<br />
development. For these reasons, the generalized information provided in this <strong>report</strong> is<br />
intended to be used for general policy and planning purposes, and not to provide<br />
information for site-specific applications.<br />
Amery-Cromwell Association<br />
Burkhardt-Chetek-Sattre Association<br />
Plainfield-Boone Association<br />
Ritchey-Derinda-Whalan Association<br />
Santiago-Jewett-Magnor Association<br />
Santiago-Otterholt-Arland Association<br />
Sattre-Pillot-Antigo Association<br />
Vlasaty-Skyberg Association<br />
Based on the St. Croix County Soil Survey, and the National Resource Conservation<br />
Service’s (formerly Soil Conservation Service) mo<strong>st</strong> recent interpretation <strong>of</strong> soil<br />
limitations, nearly all land area in St. Croix County has severe limitations for septic tank<br />
absorption fields, with the remaining few percent having slight or moderate limitations.<br />
Severe limitations can require special design, significant increases in con<strong>st</strong>ruction co<strong>st</strong>s,<br />
increased maintenance, or be unsui<strong>table</strong> for private sanitary sy<strong>st</strong>ems.<br />
Mineral Resources<br />
There are no metallic mining operations in St. Croix County. According to the Wisconsin<br />
Department <strong>of</strong> Natural Resources, there are currently no known metallic mineral deposits<br />
or occurrences in sufficient tonnage and grade in St. Croix County to warrant extraction.<br />
St. Croix County has 23 operating non-metallic mining sites permitted under Chapter NR<br />
135 <strong>of</strong> the Wisconsin Admini<strong>st</strong>rative Code, which includes three sites operated by the St.<br />
Croix County Highway Department. Mo<strong>st</strong> other mine sites are privately operated,<br />
primarily for road aggregate, concrete mix and con<strong>st</strong>ruction fill. Chapter NR 135 covers<br />
annual permitting by local governments and the reclamation <strong>of</strong> non-metallic mine sites.<br />
Supplies <strong>of</strong> sand and gravel are available throughout St. Croix County. The northwe<strong>st</strong>ern<br />
third <strong>of</strong> the <strong>county</strong> has the dense<strong>st</strong> concentration <strong>of</strong> potential sand and gravel deposits<br />
(Map 5.5). The soils among<strong>st</strong> glacial outwash are the mo<strong>st</strong> likely sources for sand and<br />
gravel as the melting waters <strong>of</strong> the glacier were mo<strong>st</strong> active in sorting and depositing<br />
high-quality sand and gravel in this area. Where the bedrock is at or near the surface <strong>of</strong><br />
the ground are areas that are possibly more suited for quarrying <strong>st</strong>one. It is helpful to<br />
identify the locations <strong>of</strong> these deposits so potential extraction sites can be considered<br />
before development occurs. Development almo<strong>st</strong> always precludes extraction, while<br />
these lands can <strong>of</strong>ten be reclaimed for development after extraction is complete.<br />
Sand and gravel deposits in the County that have a relatively higher potential for<br />
extraction based on the National Resources Conservation Service’s late<strong>st</strong> Soil Survey <strong>of</strong><br />
St. Croix County, Wisconsin. Other local <strong>conditions</strong>, such as access/egress, exi<strong>st</strong>ing<br />
St. Croix County Conditions and Trends Report 183
development, current land uses, ownership, and public sentiment may preclude extraction<br />
at some <strong>of</strong> these locations. As communities begin to develop local land use goals, these<br />
maps should be considered to reduce potential land use conflicts. Such mineral resources<br />
are important raw material inputs to help achieve the County’s land use plan goal for<br />
continuing to provide safe, efficient, and adequate community facilities.<br />
Watersheds & Surface Waters<br />
Lakes, ponds, rivers, <strong>st</strong>reams, intermittent waterways, and natural drainageways make up<br />
the surface waters <strong>of</strong> St. Croix County. These resources are all water bodies, <strong>st</strong>anding <strong>st</strong>ill<br />
or flowing, navigable and intermittent, and include natural drainageways that collect and<br />
channel overland rainwater or snowmelt run<strong>of</strong>f. Natural drainageways are characterized<br />
by intermittent <strong>st</strong>reams, threads, rills, gullies, and drywashes that periodically contribute<br />
water to fir<strong>st</strong>-order <strong>st</strong>reams. There are also many artificial drainageways where the<br />
natural drainageways have been altered by human activity. All <strong>of</strong> these features have the<br />
ability to transport sediment and pollutants and are affected by their watersheds.<br />
St. Croix County has a total surface water area <strong>of</strong> 9,598 acres or 15 square miles (see<br />
Map 5.6). The St. Croix River and its man-made lake (Lake St. Croix) is the large<strong>st</strong><br />
surface water in St. Croix County. Approximately half <strong>of</strong> the 9,336-acre Lake St. Croix is<br />
located on the Wisconsin side <strong>of</strong> the <strong>st</strong>ate border with Minnesota. The St. Croix River is<br />
also no<strong>table</strong> since it has been designated by Congress as the Lower St. Croix National<br />
Scenic Riverway. With this designation, the National Park Service works with local<br />
jurisdictions to manage and protect this waterway.<br />
At 416 acres, Bass Lake in the towns <strong>of</strong> Somerset and St. Joseph is the large<strong>st</strong> inland<br />
surface water entirely within the County, though a considerable portion <strong>of</strong> the 1,107-acre<br />
Cedar Lake in the Town <strong>of</strong> Star Prairie is also in St. Croix County. Other lakes <strong>of</strong><br />
considerable size include Lake Mallalieu (270 acres), Little Falls Lake (172 acres),<br />
Squaw Lake (129 acres), and Pine Lake (107 acres). A portion <strong>of</strong> the 150-acre Eau Galle<br />
Lake/Lake George is located in the Town <strong>of</strong> Cady.<br />
A watershed is an area <strong>of</strong> land that drains or “sheds” its water to a lake, river, <strong>st</strong>ream, or<br />
wetland. Some water-sheds encompass several hundred square miles, while others may<br />
be small, covering only a few square miles that drain into a lake. This is important to<br />
under<strong>st</strong>and since the effects <strong>of</strong> natural and human activities in one area can have a direct<br />
impact on other areas. The surface waters <strong>of</strong> St. Croix County fall within two major<br />
drainage sy<strong>st</strong>ems - the St. Croix River Basin and the Lower Chippewa River Basin (See<br />
Map 5.7). Surface waters in the we<strong>st</strong>ern two-thirds <strong>of</strong> the County, including the Apple,<br />
Kinnickinnic, and Willow Rivers, fall within the St. Croix River Basin. The ea<strong>st</strong>ern third<br />
<strong>of</strong> the County, including the Hay and Eau Galle Rivers, are part <strong>of</strong> the Lower Chippewa<br />
River Basin. The exception is the Rush River in the south-central part <strong>of</strong> the County<br />
which flows directly into the Mississippi River.<br />
Similar to surrounding counties, the source <strong>of</strong> nearly all po<strong>table</strong> water is groundwater.<br />
However, surface water can be a major source <strong>of</strong> groundwater recharge, and in the case<br />
184 Agricultural, Natural, and Cultural Resources Information
<strong>of</strong> St. Croix County, a factor in maintaining the County’s natural and recreational values.<br />
Consequently, there is also significant concern for under<strong>st</strong>anding the impacts <strong>of</strong><br />
development on the surface water resources in the County.<br />
Water Quality by Watershed<br />
In general, the water quality in the Lower Chippewa River Basin and St. Croix River<br />
Basin is a concern. The major concern is from added nutrients and sediment from run-<strong>of</strong>f,<br />
primarily from agricultural land and also urban areas. The basins include the following<br />
watersheds: Trout Brook, Lower Apple River, Lower Willow River, Kinnickinnic River,<br />
Upper Willow River, Trimbelle River and Isabelle Creek, Rush River, and Eau Galle<br />
River watersheds. Surface and ground water quality can be affected by a wide variety <strong>of</strong><br />
point and non-point sources, including agricultural run-<strong>of</strong>f, <strong>st</strong>ormwater from parking lots<br />
and roads, soil erosion, and spills <strong>of</strong> hazardous materials. The risk <strong>of</strong> water contamination<br />
increases as development occurs. These finding are important for individual communities<br />
to consider as they develop local land use and natural resources goals and <strong>st</strong>rategies for<br />
their respective communities. Communities may select to participate in or support<br />
exi<strong>st</strong>ing County or State programs to protect their water resources or implement local<br />
educational or regulatory programs.<br />
Impaired Waters<br />
According to the Wisconsin Department <strong>of</strong> Natural Resources, numerous water bodies in<br />
St. Croix County are on the 2006 impaired waters li<strong>st</strong> due to water quality concerns.<br />
These water bodies are:<br />
� Ea<strong>st</strong> Twin Lake - phosphorus<br />
� Eau Galle River –sedimentation<br />
� Lake George (Spring Valley Reservoir) – phosphorus<br />
� St. Croix River (entire length along St. Croix County) – polychlorobiphenyls<br />
� We<strong>st</strong> Twin Lake – phosphorus<br />
In addition, Glen Lake in St. Croix County is impaired by atmospheric deposition <strong>of</strong><br />
mercury. This body <strong>of</strong> water has a fish consumption advisory. Other water bodies are at<br />
similar risk, since many <strong>of</strong> the native soils <strong>of</strong> the area have high levels <strong>of</strong> phosphorus. St.<br />
Croix County Land & Water Conservation Department is actively working to minimize<br />
soil erosion through be<strong>st</strong> management practices to reduce such impacts.<br />
The plentiful surface waters are generally healthy. At the same time, many are suffering<br />
from the results <strong>of</strong> the soil erosion in the form <strong>of</strong> sedimentation. The native soils <strong>of</strong> the<br />
area contain a high level <strong>of</strong> phosphorous. This creates a situation <strong>of</strong> reduced habitat and<br />
high weed growth levels in the lakes and <strong>st</strong>reams. There is an approach <strong>of</strong> planning high<br />
levels <strong>of</strong> soil conservation on the land to protect the waters <strong>of</strong> St. Croix County.<br />
St. Croix County Conditions and Trends Report 185
Out<strong>st</strong>anding and Exceptional Resource Waters<br />
Through its Wisconsin's Out<strong>st</strong>anding and Exceptional Resource Waters Program, the<br />
Wisconsin Department <strong>of</strong> Natural Resources is working to maintain the water quality in<br />
Wisconsin's cleane<strong>st</strong> waters. These waters have been classified into out<strong>st</strong>anding and<br />
exceptional waters. Out<strong>st</strong>anding resource water is defined as a lake or <strong>st</strong>ream that has<br />
excellent water quality, high recreational and ae<strong>st</strong>hetic value, high-quality fishing, and is<br />
free from point source or non-point source pollution. Exceptional resource water is<br />
defined as a <strong>st</strong>ream that exhibits the same high-quality resource values as out<strong>st</strong>anding<br />
waters, but that may be impacted by point source pollution or have the potential for future<br />
discharge from a small sewer community. St. Croix County has four waters categorized<br />
as out<strong>st</strong>anding resources and six exceptional resource waters identified (See Table 5.5).<br />
Table 5.5 - Out<strong>st</strong>anding and Exceptional Waters – St. Croix County<br />
Out<strong>st</strong>anding Waters Exceptional Waters<br />
Bass Lake – All Apple River – From NSP plant below CTH "I" to Mouth<br />
Kinnickinnic River – Above STH 35 Cady Creek – 0.4 mile in S34 SESE (T28N R15W)<br />
Perch Lake – All Parker Creek – Lower. .4<br />
St. Croix River - Between the northern boundary <strong>of</strong> the<br />
Hudson city limits and the Polk County border<br />
Source: Wisconsin Department <strong>of</strong> Natural Resources 2008<br />
Point Source Discharges<br />
Race Branch, Willow River – All<br />
St. Croix River - From northern boundary <strong>of</strong> Hudson city<br />
limits to the Pierce County border<br />
Willow River - From end <strong>of</strong> Class II portion into delta in<br />
Lake Mallalieu<br />
Private and public sewer sy<strong>st</strong>ems and wa<strong>st</strong>ewater discharges are two potential sources <strong>of</strong><br />
water pollutants. Since 2004, St. Croix County has seen a significant and consi<strong>st</strong>ent<br />
decrease in the number <strong>of</strong> issued permits for private sewer sy<strong>st</strong>ems. In 2004, there were<br />
853 permits issued, and in 2007, there were 365 permits issued. At the same time, every<br />
new sy<strong>st</strong>em increases the number and density <strong>of</strong> private sewage sy<strong>st</strong>ems in the County.<br />
This can lead to nitrates in the groundwater. There are 17 municipal and sanitary di<strong>st</strong>rict<br />
wa<strong>st</strong>ewater treatment plants that discharge to either surface or ground water in St. Croix<br />
County and four permitted indu<strong>st</strong>rial discharges in St. Croix County (See Table 5.6).<br />
Groundwater<br />
Groundwater is an important natural resource in St. Croix County. Under<strong>st</strong>anding how<br />
groundwater is used in the County and how it can become contaminated is important to<br />
under<strong>st</strong>anding the relationship between land use and groundwater quality.<br />
The fir<strong>st</strong> <strong>st</strong>ep in this process is to under<strong>st</strong>and the source <strong>of</strong> groundwater. As rain and<br />
snow fall to the ground, some runs <strong>of</strong>f into the lakes, rivers, and <strong>st</strong>reams; some<br />
evaporates; and some is used by plants. The re<strong>st</strong> trickles down through the soil and<br />
subsoil material. This water eventually reaches a saturated zone that comprises<br />
186 Agricultural, Natural, and Cultural Resources Information
groundwater. These saturated zones, called aquifers, are geologic formations that can<br />
<strong>st</strong>ore and transmit water. The concept <strong>of</strong> water moving from the land’s surface into<br />
groundwater is the <strong>st</strong>arting point for thinking about the relationship between land use and<br />
groundwater quality. Nearly anything that is dumped, spilled, or spread on the ground can<br />
seep down to groundwater. This groundwater is then used by residents for drinking,<br />
farming, and other activities. Groundwater can also return to the surface as springs or as<br />
discharge to lakes, river, and <strong>st</strong>reams.<br />
Protecting groundwater means modifying or even prohibiting certain activities in areas<br />
where contaminants can easily enter the groundwater. This can mean changing the type<br />
<strong>of</strong> septic sy<strong>st</strong>em required, or limiting the concentration <strong>of</strong> development in areas that are<br />
mo<strong>st</strong> susceptible to contamination.<br />
Table 5.6 - Permitted Municipal and Indu<strong>st</strong>rial Discharges to Surface and Groundwater<br />
St. Croix County<br />
Water Body Owner Type<br />
Baldwin Creek Baldwin Municipal WWTF<br />
Willow River Deer Park Municipal WWTF<br />
Groundwater Emerald Glenwood Sanitary and Municipal WWTF<br />
Groundwater Fore<strong>st</strong> Sanitary Di<strong>st</strong>rict<br />
Groundwater/wetland tributary to Tiffany<br />
Creek Glenwood City Municipal WWTF<br />
Groundwater Hammond Municipal WWTF<br />
St. Croix River Hudson Municipal WWTF<br />
Willow River New Richmond Municipal WWTF<br />
Ground water Richmond Sanitary Di<strong>st</strong>rict<br />
Ea<strong>st</strong> Twin Lake Roberts Municipal WWTF<br />
Apple River Somerset Municipal WWTF<br />
Groundwater St. Croix Meadows Municipal WWTF<br />
Apple River Star Prairie Municipal WWTF<br />
Groundwater (dome<strong>st</strong>ic water only) Travel Centers <strong>of</strong> America Municipal WWTF<br />
Wilson Creek Wilson Municipal WWTF<br />
Groundwater Woodville Municipal WWTF<br />
Groundwater/Lohn Creek Cady Cheese Indu<strong>st</strong>rial<br />
Groundwater/Cady Creek Foremo<strong>st</strong> Farms USA COOP Indu<strong>st</strong>rial<br />
Groundwater/Willow River Lakeside Foods Indu<strong>st</strong>rial<br />
Groundwater Nor Lake Indu<strong>st</strong>rial<br />
Source: Wisconsin Department <strong>of</strong> Natural Resources<br />
The Wisconsin Department <strong>of</strong> Natural Resources has developed the Groundwater<br />
Contamination Susceptibility Model (GCSM) used to e<strong>st</strong>imate the susceptibility <strong>of</strong> the<br />
groundwater based on particular natural resource characteri<strong>st</strong>ics. The natural resource<br />
St. Croix County Conditions and Trends Report 187
characteri<strong>st</strong>ics include bedrock depth, bedrock type, soil characteri<strong>st</strong>ics, surficial<br />
deposits, and water <strong>table</strong> depth. The GCSM assigned a value to each <strong>of</strong> the resource<br />
characteri<strong>st</strong>ics. A weighting scheme was also developed to indicate the <strong>st</strong>rength <strong>of</strong> each<br />
resource characteri<strong>st</strong>ic in e<strong>st</strong>imating groundwater contamination susceptibility. The<br />
result <strong>of</strong> the analysis is a groundwater susceptibility map available for the State <strong>of</strong><br />
Wisconsin which shows that we<strong>st</strong>ern and northwe<strong>st</strong>ern portions <strong>of</strong> St. Croix County<br />
generally have the highe<strong>st</strong> groundwater susceptibility ratings.<br />
The hazard materials incidents section <strong>of</strong> the St. Croix County All Hazards Mitigation<br />
Plan discusses the key ground contamination concerns in St. Croix County. The<br />
preponderance <strong>of</strong> closed depressions in the County significantly increases these risks as<br />
contaminants at the surface may not be given the opportunity to be adequately filtered by<br />
soils, but, in<strong>st</strong>ead, are passed more directly from the surface to the aquifer. In addition,<br />
two deep well casing areas have been e<strong>st</strong>ablished by Wisconsin DNR in which private<br />
well requirements, special te<strong>st</strong>ing, and special treatment sy<strong>st</strong>ems have been implemented<br />
due to groundwater contamination. In the Town <strong>of</strong> Star Prairie area, municipal water is<br />
being extended to address these concerns. The second deep well casing area is quite<br />
large, extending from the Town <strong>of</strong> Warren we<strong>st</strong> through a large portion <strong>of</strong> the Town <strong>of</strong><br />
Hudson. Four atrazine prohibition areas also exi<strong>st</strong> in St. Croix County.<br />
Additional analysis <strong>of</strong> the County’s groundwater can be found in the <strong>report</strong> entitled An<br />
Introduction to Groundwater in St. Croix County completed in May 2006 by the UW-<br />
Extension and UW-Stevens Point. The USGS is also currently completing a groundwater<br />
modeling effort which includes St. Croix County.<br />
Air Quality<br />
Air quality is an important issue in St. Croix County. Under<strong>st</strong>anding how air quality is<br />
impacted in the County and how it can become contaminated is important to under<strong>st</strong>and.<br />
St. Croix County is experiencing an increase in lesser air quality. One major attribute to<br />
this is the increase in burning wood. A major contributor to this are outdoor wood boilers,<br />
which can create localized environments that have unhealthy levels <strong>of</strong> air quality. Some<br />
<strong>of</strong> the major components <strong>of</strong> wood smoke are on EPA’s li<strong>st</strong> <strong>of</strong> six “criteria pollutants” in<br />
the National Ambient Air Quality Standard (NAAQS), including ozone, carbon<br />
monoxide, nitrous oxides, particulate matter, and sulfur dioxide. The adoption <strong>of</strong> local<br />
ordinances regulating outdoor wood <strong>st</strong>oves is currently the be<strong>st</strong> way to address the issue<br />
proactively. This issue will only increase due to the increases in other fuels and a<br />
renewed intere<strong>st</strong> in using local and renewable resources for energy. In addition, air<br />
pollution from the Twin Cities impacts St. Croix County.<br />
Natural Resources – Sensitive Lands<br />
In addition to the more di<strong>st</strong>inct physical land features, there are other environmentally<br />
sensitive and valued land resources that should be considered for the potential impacts <strong>of</strong><br />
growth and development activities. These areas, referred to as sensitive lands, should be<br />
identified and evaluated for their significance as a valued resource in the County. In<br />
188 Agricultural, Natural, and Cultural Resources Information
addition, growth and development policies and management techniques will need to be<br />
e<strong>st</strong>ablished to affect the desired impacts on these resources.<br />
The following are the Sensitive Lands that are briefly reviewed and discussed in this<br />
section:<br />
� Shorelands<br />
� Floodplains<br />
� Wetlands<br />
� Steep Slopes<br />
� Fore<strong>st</strong>s and Woodlands<br />
� Grasslands and Prairie<br />
� Wildlife, Wildlife Habitat, and Open Space<br />
� Parks and Recreational Resources<br />
Shorelands<br />
Shorelands provide valuable habitat for both aquatic and terre<strong>st</strong>rial animals and<br />
vegetation, and also act as buffers and thus serve to protect water quality. Shorelands are<br />
also considered prime residential building areas because <strong>of</strong> their scenic beauty.<br />
Recognizing this conflict, and to maintain the environmental, recreational, and<br />
economical quality <strong>of</strong> our water resources, the State <strong>of</strong> Wisconsin requires counties to<br />
adopt and enforce a shoreland ordinance.<br />
As required by the State, shorelands are defined as:<br />
� all land within 1,000 feet <strong>of</strong> the ordinary high water mark <strong>of</strong> a lake, pond, or flowage;<br />
or<br />
� all land within 300 feet <strong>of</strong> the ordinary high water mark <strong>of</strong> a river or <strong>st</strong>ream or to the<br />
landward side <strong>of</strong> the floodplain, whichever is greater.<br />
Each <strong>county</strong> mu<strong>st</strong> meet or exceed the minimum <strong>st</strong>ate <strong>st</strong>andards for shoreland protection.<br />
The identified shoreland areas are based on the <strong>st</strong>andards as defined in the St. Croix<br />
County Shoreland Zoning Ordinance.<br />
Floodplains<br />
One sensitive land feature that mo<strong>st</strong> residents are aware <strong>of</strong> is the floodplain, which are the<br />
flood-prone lands adjacent to water bodies. Floodplains can be desirable development<br />
areas due to the proximity to lakes, rivers, and <strong>st</strong>reams, but pose problems by possibly<br />
putting residents and property at risk. Development in floodplains can also affect the<br />
environmental quality <strong>of</strong> the waterway.<br />
To better protect the residents <strong>of</strong> throughout the <strong>st</strong>ate, and to minimize the loss <strong>of</strong><br />
property, the State <strong>of</strong> Wisconsin, under Wisconsin Statute 87.30(1), requires counties,<br />
cities, and villages to adopt and enforce floodplain zoning. In addition, Wisconsin<br />
St. Croix County Conditions and Trends Report 189
Admini<strong>st</strong>rative Code NR116, Floodplain Management Program, has been promulgated<br />
for the protection <strong>of</strong> property and public inve<strong>st</strong>ments from the effects <strong>of</strong> flooding.<br />
Development within the floodplain is usually assessed through the use <strong>of</strong> the Flood<br />
Insurance Rate Maps (FIRM) developed by the Federal Emergency Management Agency<br />
(FEMA). The floodplains at the end <strong>of</strong> this element have been identified for St. Croix<br />
County based on the FEMA flood insurance maps (see Map 5.8). It is important to<br />
remember that this map is no sub<strong>st</strong>itute for site-specific analysis. Natural and human<br />
changes in the landscape and the age and accuracy <strong>of</strong> the flood insurance maps has, in<br />
some cases, limited their reliability for identifying and designating floodplains.<br />
Wetlands<br />
There are a number <strong>of</strong> wetland areas within the watersheds that can affect water levels <strong>of</strong><br />
rivers and creeks flowing through St. Croix County (see Map 5.9). Wetlands are defined<br />
by the State Statute as “an area where water is at, near, or above the land surface long<br />
enough to be capable <strong>of</strong> supporting aquatic or hydrophytic (water-loving) vegetation and<br />
which has soils indicative <strong>of</strong> wet <strong>conditions</strong>.” Wetlands may be seasonal or permanent<br />
and are commonly referred to as swamps, marshes, or bogs. Wetland plants and soils<br />
have the capacity to <strong>st</strong>ore and filter pollutants, replenish groundwater supplies, <strong>st</strong>ore<br />
floodwaters, and maintain <strong>st</strong>ream flows.<br />
Steep Slopes<br />
It is generally more desirable, both environmentally and economically, to avoid <strong>st</strong>eep<br />
slopes and disrupting natural drainageways with con<strong>st</strong>ruction and land development.<br />
Problems with erosion and run<strong>of</strong>f pollution can occur with development on <strong>st</strong>eep slopes,<br />
and flooding and wet basements can occur with drainageway disruptions.<br />
Steep slopes are any area where the gradient <strong>of</strong> the land is 13 percent or greater (each<br />
percent <strong>of</strong> slope is measured as one unit in elevation for every 100 horizontal units).<br />
Areas having <strong>st</strong>eep slopes can be categorized into three levels, 13 percent to 20 percent<br />
slope, 21 percent to 24 percent, and 25 percent and greater.<br />
Development on slopes <strong>of</strong> 13 percent to 20 percent should consider direct run<strong>of</strong>f into<br />
lakes, rivers, or <strong>st</strong>reams, follow <strong>st</strong>ate approved con<strong>st</strong>ruction site erosion control<br />
<strong>st</strong>andards, and in<strong>st</strong>itute be<strong>st</strong> management practices to control on-site run<strong>of</strong>f and pollution.<br />
Land with slopes <strong>of</strong> 21 percent or greater represent a definite limiting environmental<br />
condition. Development on these slopes results in high con<strong>st</strong>ruction co<strong>st</strong>s and severe<br />
erosion with resultant negative impacts to surface and ground waters. Development on<br />
slopes <strong>of</strong> 21 percent or greater is highly discouraged.<br />
Based on the Soil Survey for St. Croix County, there are 78,100 acres that potentially<br />
have a slope <strong>of</strong> 13 percent or greater representing 9.8 percent <strong>of</strong> the total land base. Of<br />
this, 12,700 acres (1.9 percent) have slopes <strong>of</strong> 21 percent or greater and .3 percent have a<br />
slope <strong>of</strong> 25 percent and greater. The majority <strong>of</strong> these <strong>st</strong>eep slopes are located in the<br />
190 Agricultural, Natural, and Cultural Resources Information
we<strong>st</strong>ern and ea<strong>st</strong> central portions <strong>of</strong> the <strong>county</strong>. These relief changes can be seen on Map<br />
5.10. Additional localized and site-specific variations in topography and slope may exi<strong>st</strong>.<br />
Glacial activity created some scenic topography, but may also be very sensitive to<br />
development activities.<br />
Fore<strong>st</strong>s and Woodlands<br />
Fore<strong>st</strong>s and woodlands are an important feature <strong>of</strong> St. Croix County. In fact, its fore<strong>st</strong>s<br />
are the second mo<strong>st</strong> extensive land use and land cover after agriculture. The large<strong>st</strong><br />
concentrations <strong>of</strong> woodlands occur on the peripheries <strong>of</strong> the County (See Map 5.11).<br />
Mo<strong>st</strong> significant, the dense<strong>st</strong> patches <strong>of</strong> fore<strong>st</strong>s are located on the we<strong>st</strong>ern and ea<strong>st</strong>ern<br />
edges <strong>of</strong> the County. There are also some fore<strong>st</strong>s on the northern border <strong>of</strong> the County.<br />
Assessed fore<strong>st</strong> acreage increased by roughly 13,977 acres, or almo<strong>st</strong> 22 square miles,<br />
between 1990 and 2007 (see Table 5.7). This was a 38.6 percent increase. Between 1990<br />
and 2007 the towns <strong>of</strong> Eau Galle (476 percent), Glenwood (154 percent), and Hammond<br />
(147) saw the large<strong>st</strong> percentage increases in assessed fore<strong>st</strong>ed acreage. In 2007, the<br />
towns <strong>of</strong> Fore<strong>st</strong> (4,999), Eau Galle (4,045), Somerset (3,664), Cylon (3,542), and<br />
Emerald (3,499) had the greate<strong>st</strong> amount <strong>of</strong> assessed fore<strong>st</strong>ed acreage, respectively. At<br />
the same time, Hudson (372), Pleasant Valley (620), Rush River (772), and Hammond<br />
(787) had the lea<strong>st</strong> amount <strong>of</strong> assessed fore<strong>st</strong>ed acreage. The greate<strong>st</strong> percentage<br />
decreases occurred in the towns <strong>of</strong> Hudson (-46 percent) and Somerset (-28 percent).<br />
In St. Croix County, woodlands are an important part <strong>of</strong> the environment, ae<strong>st</strong>hetics, and<br />
economy. Woodlands provide:<br />
� Habitat for a variety <strong>of</strong> plants and animals;<br />
� The basic resource for many wood-based indu<strong>st</strong>ries, including the expanding bioenergy<br />
sector;<br />
� Resources for the agricultural community;<br />
� An environment for recreational activities; and<br />
� For the scenic beauty <strong>of</strong> the landscape and the rural character <strong>of</strong> the <strong>county</strong>.<br />
Woodlands managed according to approved fore<strong>st</strong> management practices can support<br />
varying and sometimes complementary objectives, such as timber production and wildlife<br />
habitat. On the other hand, <strong>st</strong>rict preservation <strong>of</strong> woodlands would be unusual and<br />
reserved for the mo<strong>st</strong> rare and unique <strong>st</strong>ands in the County.<br />
Unmanaged development and the fragmentation <strong>of</strong> woodlands in residential lots can<br />
diminish or eliminate a woodlands capacity to provide wood products, habitat for plants<br />
and animals, and ae<strong>st</strong>hetic quality. St. Croix County has experienced a loss <strong>of</strong> some<br />
woodland acres, in part due to the subdividing <strong>of</strong> woodlands into residential lots. Because<br />
woodlands are considered a valued resource for these reasons, significant woodlands are<br />
<strong>of</strong>ten protected from conversion to other uses or properly managed in order to retain their<br />
desirable characteri<strong>st</strong>ics. For example, residential development in woodland areas could<br />
St. Croix County Conditions and Trends Report 191
use conservation design techniques in order to allow for development and preserve the<br />
environmental and ae<strong>st</strong>hetic value.<br />
Table 5.7 - Assessed Fore<strong>st</strong> and AG Fore<strong>st</strong> Parcels and Acreage by Town - 1990 - 2007 – St.<br />
Croix County<br />
Total Parcels Total Acres<br />
1990 -<br />
1990 -<br />
# 2007 %<br />
# 2007 %<br />
Town 1990 2007* Change Change 1990 2007* Change Change<br />
Baldwin 109 175 66 60.6 882 1,747 865 98.1<br />
Cady 215 200 -15 -7.0 3,649 3,060 -589 -16.1<br />
Cylon 264 253 -11 -4.2 3,753 3,542 -211 -5.6<br />
Eau Galle** 54 388 334 618.5 702 4,045 3,343 476.2<br />
Emerald 126 268 142 112.7 1,757 3,499 1,742 99.1<br />
Erin Prairie 75 119 44 58.7 993 1,651 658 66.3<br />
Fore<strong>st</strong> 127 296 169 133.1 2,434 4,999 2,565 105.4<br />
Glenwood 116 333 217 187.1 1,273 3,240 1,967 154.5<br />
Hammond 33 152 119 360.6 319 787 468 146.7<br />
Hudson 54 38 -16 -29.6 694 372 -322 -46.4<br />
Kinnickinnic 241 271 30 12.4 2,332 2,901 569 24.4<br />
Pleasant Valley 109 88 -21 -19.3 543 620 77 14.2<br />
Richmond 98 99 1 1.0 928 1,013 85 9.2<br />
Rush River 46 79 33 71.7 449 772 323 71.9<br />
Saint Joseph 192 190 -2 -1.0 2,340 2,233 -107 -4.6<br />
Somerset 374 255 -119 -31.8 5,116 3,664 -1,452 -28.4<br />
Springfield 99 221 122 123.2 1,839 3,258 1,419 77.2<br />
Stanton 176 152 -24 -13.6 1,395 1,567 172 12.3<br />
Star Prairie 110 244 134 121.8 1,594 3,200 1,606 100.8<br />
Troy 189 174 -15 -7.9 2,209 1,905 -304 -13.8<br />
Warren 95 139 44 46.3 965 2,068 1,103 114.3<br />
TOTALS 2,902 4,134 1,232 42.5 36,166 50,143 13,977 38.6<br />
Source: Wisconsin Department <strong>of</strong> Revenue<br />
* Between 2003 and 2007, the Department <strong>of</strong> Revenue changed the classification sy<strong>st</strong>em and included the category “AG Fore<strong>st</strong>”. This<br />
alteration has in mo<strong>st</strong> cases influenced the comparison <strong>of</strong> 2007 data and the data from the previous three years.<br />
** 1990 data was not available, so 1996 data was used.<br />
Grasslands and Prairie<br />
Many parts <strong>of</strong> St. Croix County were originally covered by prairie, mo<strong>st</strong> <strong>of</strong> which does<br />
not remain today. Exi<strong>st</strong>ing grassland areas are spread throughout the <strong>county</strong> (Map 5.12).<br />
The northwe<strong>st</strong>ern part <strong>of</strong> the <strong>county</strong> has larger patches <strong>of</strong> grassland which are<br />
intermingled with fore<strong>st</strong>s and woodlands.<br />
Prairie is the term used to describe the grassland type that predominated Wisconsin prior<br />
to Euro-American settlement. Prairies are dominated by grasses and sedges, lack trees<br />
and tall shrubs, and are home to a rich variety <strong>of</strong> plants and animals. Within the prairie<br />
designation there are variations due to soils and climate. Prairies continue to be a<br />
threatened plant community in Wisconsin. The reduction <strong>of</strong> prairie in the <strong>st</strong>ate means that<br />
an e<strong>st</strong>imated 20 percent <strong>of</strong> the original grassland plants are considered rare in the <strong>st</strong>ate.<br />
Consequently, many species <strong>of</strong> plants and animals associated with Wisconsin prairies are<br />
endangered, threatened or <strong>of</strong> special concern.<br />
192 Agricultural, Natural, and Cultural Resources Information
There are few high quality prairie remnants remaining. Research shows it will take more<br />
than the preservation <strong>of</strong> these remnants to recover or retain the biodiversity this<br />
ecosy<strong>st</strong>em can <strong>of</strong>fer. Degraded areas that were once prairie can <strong>of</strong>ten be re<strong>st</strong>ored with<br />
moderate effort to yield a habitat sui<strong>table</strong> for mo<strong>st</strong> <strong>of</strong> the associated plant and animal<br />
species. Even certain managed agricultural and live<strong>st</strong>ock practices can accommodate the<br />
maintenance <strong>of</strong> the open habitats needed by many grassland species. Grasslands can be<br />
re<strong>st</strong>ored and maintained through preserving a certain amount <strong>of</strong> open space for this type<br />
<strong>of</strong> cover as development occurs. Hence, development can occur in such a way that it can<br />
maintain sufficient grasslands for its habitat value while preserving the rural character <strong>of</strong><br />
the landscape.<br />
Wildlife, Wildlife Habitat, and Open Space<br />
Scattered throughout St. Croix County are various federal, <strong>st</strong>ate, and local wildlife,<br />
fishery, natural, and scientific areas, including private conservancy areas. These <strong>of</strong>ten<br />
encompass one or more <strong>of</strong> the sensitive land areas discussed previous (e.g., wetlands,<br />
fore<strong>st</strong>s, shorelands, prairies). These areas are managed as open space to provide<br />
important feeding, breeding, ne<strong>st</strong>ing, cover, and other habitat values to a wide variety <strong>of</strong><br />
plant and animal species. Agricultural lands can also provide important open space and<br />
wildlife habitat, while maintaining the rural character <strong>of</strong> the area.<br />
Rare and Endangered Species and Natural Communities<br />
According to the Wisconsin Department <strong>of</strong> Natural Resources Natural Hi<strong>st</strong>ory<br />
Inventory, St. Croix County is home to 47 animal species, 27 plant species, and<br />
23 natural communities that can be considered rare or endangered.<br />
The Natural Hi<strong>st</strong>ory Inventory is a <strong>st</strong>atewide inventory <strong>of</strong> known locations <strong>of</strong> rare<br />
and endangered species and communities. This information is for general<br />
planning purposes only, and the lack <strong>of</strong> known occurrences in an area does not<br />
mean that no significant endangered resources are present. These species and<br />
communities are li<strong>st</strong>ed on Map 5.14, provided by the Wisconsin Department <strong>of</strong><br />
Natural Resources. The specific locations <strong>of</strong> some resources may not be mapped<br />
due to their sensitive nature and in order to minimize impacts.<br />
Four species found within St. Croix County have Federal protection <strong>st</strong>atus<br />
designated by the U.S. Fish and Wildlife Service:<br />
Spectaclecase (Mussel) Candidate<br />
Higgens’ Eye (Mussel) Endangered Species<br />
Winged Mapleleaf (Mussel) Endangered Species<br />
Prairie Bush-clover (Plant) Threatened Species<br />
Twenty-two (22) St. Croix County species have been categorized as endangered<br />
by the Wisconsin Department <strong>of</strong> Natural Resources:<br />
Brook Grass (Plant)<br />
Buckhorn (Mussel)<br />
St. Croix County Conditions and Trends Report 193
Butterfly (Mussel)<br />
Carolina Anemone (Plant)<br />
Cry<strong>st</strong>al Darter (Fish)<br />
Dotted Blazing Star (Plant)<br />
Ebony Shell (Mussel)<br />
Elephant Ear (Mussel)<br />
Goldeye (Fish)<br />
Ground-plum (Plant)<br />
Higgens’ Eye (Mussel)<br />
Loggerhead Shrike (Bird)<br />
Prairie Bush-clover (Plant)<br />
Purple Wartyback (Mussel)<br />
Red-necked Grebe (Bird)<br />
Regal Fritillary (Butterfly)<br />
Rough Rattlesnake-root (Plant)<br />
Skipjack Herring (Fish)<br />
Small Skullcap (Plant)<br />
Snuffbox (Mussel)<br />
Spectacle Case (Mussel)<br />
Winged Mapleleaf (Mussel)<br />
A threat to some <strong>of</strong> these natural communities is invasive plant and animal<br />
specific. There are 21 noted invasive plant species in St. Croix County.<br />
Specifically, the Reed Canary Grass and Eurasian Water-Milfoil pose significant<br />
threats in the County. Other invasives, such as Gypsy Moth and Butternut Canker<br />
have become e<strong>st</strong>ablished in St. Croix County. In addition, Emerald Ash has now<br />
been found in Washington and Ozaukee counties and could pose a threat in the<br />
future.<br />
State Natural Areas<br />
Currently, Apple River Canyon is the only State Natural Area in St. Croix<br />
County. State Natural Areas are managed to protect rare plants, animals, or native<br />
landscapes. State Natural Areas may be part <strong>of</strong> a larger State Wildlife Area,<br />
though permitted recreational activities may be less intensive. Apple River<br />
Canyon features a deep (100-140 feet), narrow (150 feet) gorge along the Apple<br />
River about two miles up<strong>st</strong>ream from its confluence with the St. Croix River. The<br />
Apple River is a shallow <strong>st</strong>ream flanked by <strong>st</strong>eep high cliffs on both sides. The<br />
canyon lies a few miles south <strong>of</strong> the limits <strong>of</strong> Glacial Lake Grantsburg, and<br />
presumably the gorge was formed during the period <strong>of</strong> drainage <strong>of</strong> the lake. The<br />
vegetation is diverse due to the nearly ea<strong>st</strong>-we<strong>st</strong> orientation <strong>of</strong> a segment <strong>of</strong> the<br />
gorge, creating north and south walls with contra<strong>st</strong>ing sunlight, moi<strong>st</strong>ure, and<br />
temperature <strong>conditions</strong>. On the upland to the north is an oak fore<strong>st</strong>: on the southfacing<br />
upper slope a <strong>st</strong>rip <strong>of</strong> prairie grasses; on the south-facing cliffs a few<br />
lichens and mosses; on the lowe<strong>st</strong> talus slope a floodplain fore<strong>st</strong>; on north-facing<br />
talus a northern dry-mesic fore<strong>st</strong>; on northern cliffs, cryptogams; and on the upper<br />
194 Agricultural, Natural, and Cultural Resources Information
slope a narrow prairie. Apple River Canyon is owned by the DNR and was<br />
designated a State Natural Area in 1978.<br />
Wisconsin’s Land Legacy Report<br />
The Wisconsin Department <strong>of</strong> Natural Resources has completed a draft <strong>st</strong>udy that<br />
identifies unique places that are critical to meeting Wisconsin’s future<br />
conservation and recreation needs for the next 50 years. A range <strong>of</strong> criteria were<br />
used in determining these places, including: high quality ecosy<strong>st</strong>ems, out<strong>st</strong>anding<br />
scenic beauty, accessibility, recreational opportunities, size <strong>of</strong> the resource,<br />
networks between resources, and water quality protection. The following<br />
locations in St. Croix County were identified as important legacy places:<br />
Kinnickinnic River, Lower St. Croix River, and We<strong>st</strong>ern Prairie Habitat<br />
Re<strong>st</strong>oration Area.<br />
Parks and Recreational<br />
Resources<br />
Visitors and residents <strong>of</strong> St.<br />
Croix County have many<br />
opportunities to enjoy the natural<br />
resources <strong>of</strong> the <strong>county</strong> through<br />
parks, trails, and other public<br />
lands (See Table 5.8). It also<br />
owns 59 acres along the Apple<br />
River, which is a popular<br />
location for tubing. The County<br />
owns a seven-mile recreational<br />
trail running from the Village <strong>of</strong><br />
Woodville to the St. Croix<br />
Troy Beach in Town <strong>of</strong> Troy<br />
County line. There are 163 miles<br />
<strong>of</strong> maintained and groomed<br />
snowmobile trails throughout the County. The County has designated 185 miles<br />
<strong>of</strong> <strong>county</strong> roadway as bicycle routes (the County recently completed a bicycle<br />
plan). There are approximately 40 miles <strong>of</strong> designated cross-country ski trails in<br />
St. Croix County and approximately 36 miles <strong>of</strong> hiking trails in <strong>county</strong> and<br />
community parks.<br />
St. Croix County has 196 public and 1,236 private camping sites at eleven<br />
campgrounds. There are approximately 10,273 acres <strong>of</strong> public hunting land in St.<br />
Croix County. There are twelve public and private golf courses in the County.<br />
There are 7,615 surface acres <strong>of</strong> fishing lakes and 27 trout <strong>st</strong>reams that total 81<br />
miles in St. Croix County. There are 15 named lakes and flowages. Only four<br />
bodies <strong>of</strong> water can accommodate water skiing, large pleasure boats or sail boats.<br />
These are: Bass Lake, Cedar Lake, Lake Mallalieu and Lake St. Croix and the St.<br />
Croix River.<br />
St. Croix County Conditions and Trends Report 195
There is one <strong>st</strong>ate park in St. Croix County. Willow River State Park is located in<br />
the southwe<strong>st</strong>ern portion <strong>of</strong> St. Croix County, ea<strong>st</strong> <strong>of</strong> Hudson. The park consi<strong>st</strong>s<br />
<strong>of</strong> 2,891 acres <strong>of</strong> prairie, fore<strong>st</strong>s, and river scenery. Willow River State Park has a<br />
campground, a boat launch, and a 400-foot beach and picnic area centered on<br />
172-acre Little Falls Lake. Willow River State Park draws more than 300,000<br />
visitors each year. The State Department <strong>of</strong> Natural Resources manages the Cylon<br />
Wildlife Area, Cylon Marsh Wildlife Area, and the St. Croix County Islands<br />
Wildlife Area. A full range <strong>of</strong> recreational activities may be pursued at the<br />
Wildlife Areas. In addition, the State Department <strong>of</strong> Natural Resources own 17<br />
additional pieces <strong>of</strong> land that range from urban wetlands to larger native terrains.<br />
They also own the Kinnickinnic River Fishery which includes 2,443 acres <strong>of</strong><br />
parkland and water resources.<br />
In March 2008, St. Croix County completed the County’s 2008 Bicycle and<br />
Pede<strong>st</strong>rian Plan. The Bicycle and Pede<strong>st</strong>rian Facilities Planning Advisory<br />
Committee reviewed and updated goals and objectives from the previous bicycle<br />
transportation plan. The recommendations are intended to provide guidance for<br />
the enhancement <strong>of</strong> the bicycling environment in the County, and encourage intergovernmental<br />
coordination toward that goal, while recognizing the fiscal<br />
con<strong>st</strong>raints under which <strong>county</strong> and local municipalities operate.<br />
Table 5.8 - Parks and Recreational Lands – St. Croix County<br />
County Resource Size Location Notes<br />
Apple River Property 59 acres T <strong>of</strong> Star Prairie hunting, fishing, canoe launch,<br />
Bass Lake Boat Landing two acres Bass Lake – T <strong>of</strong> Somerset boat landing<br />
Glen Hills Park 700 acres four miles S <strong>of</strong> Glenwood 61 camp sites, beach, golf, boat<br />
City<br />
rental, hiking, snowmobile<br />
Home<strong>st</strong>ead Park 80 acres Perch Lake -T <strong>of</strong> St. Joseph fishing, swimming, boat rentals<br />
Kinnickinnic County Fore<strong>st</strong> 80 acres <strong>of</strong> Kinnickinnic hunting, hiking, berry picking<br />
Pine Lake Park 10 acres T <strong>of</strong> Erin Prairie boat landing, picnic shelter,<br />
Stanton County Fore<strong>st</strong> 40 acres T <strong>of</strong> Stanton hunting, hiking, berry picking<br />
Troy Beach five acres T <strong>of</strong> Troy beach, picnic area<br />
Wildwood Trail Seven mile trail V <strong>of</strong> Woodville to T <strong>of</strong> Eau<br />
Galle<br />
year-round trail<br />
State Park & Wildlife Areas Size Location Notes<br />
Willow River State Park 2,900 acres five miles NE <strong>of</strong> Hudson campground, boat launch,<br />
beach<br />
Cylon Wildlife Area 2,285 acres one mile E <strong>of</strong> Deer Park fore<strong>st</strong>ed/wetland<br />
Cylon Marsh Wildlife Area 513 acres four miles N <strong>of</strong> Deer Park fore<strong>st</strong>ed/grass/wetland<br />
St. Croix County Islands W.A 1106 acres three miles NW <strong>of</strong> Somerset grass/wooded/backwaters<br />
Residents and visitors also have the option to enjoy the natural resources <strong>of</strong> St.<br />
Croix County through many privately operated campgrounds, resorts, and other<br />
ventures. Individual cities and villages also maintain their own parks and<br />
recreational activities discussed as part <strong>of</strong> the Utilities and Community Facilities<br />
Element.<br />
196 Agricultural, Natural, and Cultural Resources Information
Cultural Resources<br />
St. Croix County has a long and <strong>st</strong>oried hi<strong>st</strong>ory, with many significant sites. These sites<br />
include Native American encampments, fur trading outpo<strong>st</strong>s, lumbering camps, and<br />
hi<strong>st</strong>oric buildings. Hi<strong>st</strong>oric <strong>st</strong>ructures, sites, and di<strong>st</strong>ricts are <strong>of</strong>ten targeted for hazard<br />
mitigation <strong>st</strong>rategies due to their unique, <strong>of</strong>ten irreplaceable, social value. Such hi<strong>st</strong>oric<br />
resources can also be responsible for defining much <strong>of</strong> a community’s identity.<br />
According to the National Regi<strong>st</strong>er <strong>of</strong> Hi<strong>st</strong>oric Places, St. Croix County has 29 hi<strong>st</strong>oric<br />
properties and four hi<strong>st</strong>oric di<strong>st</strong>ricts that have received federal hi<strong>st</strong>oric landmark<br />
designation (See Table 5.9).<br />
Additional older <strong>st</strong>ructures and homes within St. Croix County also likely qualify for the<br />
National Regi<strong>st</strong>er <strong>of</strong> Hi<strong>st</strong>oric Places. For in<strong>st</strong>ance, the Wisconsin Hi<strong>st</strong>orical Society<br />
maintains the Wisconsin Architecture and Hi<strong>st</strong>ory Inventory (AHI). This is a database <strong>of</strong><br />
approximately 120,000 buildings, <strong>st</strong>ructures, and objects that illu<strong>st</strong>rate Wisconsin's<br />
unique hi<strong>st</strong>ory. The AHI documents a wide range <strong>of</strong> hi<strong>st</strong>oric properties, mo<strong>st</strong>ly privately<br />
owned, such as the round barns, log houses, metal truss bridges, small town commercial<br />
buildings and Queen Anne houses that create Wisconsin's di<strong>st</strong>inct cultural landscape. The<br />
inventory is not comprehensive, and in some cases, the inventory may be dated if<br />
<strong>st</strong>ructures are altered or no longer exi<strong>st</strong>.<br />
Table 5.9 - Sites and Structures on the National Regi<strong>st</strong>er <strong>of</strong> Hi<strong>st</strong>oric Places – St. Croix<br />
County<br />
Hi<strong>st</strong>oric Site Location Municipality Li<strong>st</strong>ed<br />
Bell, Marcus Sears, Farm 1100 Heritage Dr. New Richmond 1988<br />
Bernd, William J., House 210 2 nd St. New Richmond 1988<br />
Bernd, William J., House 143 Arch Av. New Richmond 1988<br />
Chicago, St. Paul, Minneapolis and Bounded by: Gallahad Rd.,<br />
Omaha Railroad Car Shop Hi<strong>st</strong>oric Sommer, 4<br />
Di<strong>st</strong>rict<br />
th North Hudson 1984<br />
. And St. Croix<br />
Streets<br />
Darling, Frederick L., House 617 3 rd St. Hudson 1984<br />
Dwelley, William, House 1002 4 th St. Hudson 1984<br />
Epley, Dr. Frank W., Office 137 3 rd St. New Richmond 1988<br />
Fir<strong>st</strong> English Lutheran Church 354 3 rd St. New Richmond 1988<br />
Glover, Ezra, Jr., House 415 2 nd St. New Richmond 1988<br />
Hudson Public Library 304 Locu<strong>st</strong> St Hudson 1984<br />
Humphrey, Herman L., House 803 Orange St. Hudson 1984<br />
Johnson, Augu<strong>st</strong>, House 427 St. Croix St. Hudson 1984<br />
Johnson, Dr. Samuel C., House 405 Locu<strong>st</strong> St. Hudson 1984<br />
Kell, William H., House 215 Green Ave. New Richmond 1988<br />
Kinnickinnic Church WI J, jct. with WI JJ Kinnickinnic 2000<br />
Lewis Farmhouse Farm Dr. Boardman 1982<br />
Lewis-Williams House 101 3 rd St. Hudson 1985<br />
Merritt, Samuel T., House 904 7 th St. Hudson 1984<br />
Mielke, Joseph, House 326 Second St. W New Richmond 1988<br />
M<strong>of</strong>fat, John S., House 1004 3 rd St Hudson 1974<br />
New Richmond News Building 145 2 nd St. New Richmond 1988<br />
New Richmond Roller Mills Co 201 Knowles Ave. New Richmond 1988<br />
New Richmond We<strong>st</strong> Side Hi<strong>st</strong>oric<br />
Di<strong>st</strong>rict<br />
Bounded by: Willow, Minnesota,<br />
W. 2 nd , S. Washington<br />
New Richmond 1988<br />
Opera Hall Block 516 2 nd St. Hudson 1979<br />
St. Croix County Conditions and Trends Report 197
Phipps, William H., House 1005 3 rd St. Hudson 1987<br />
Second St. Commercial Di<strong>st</strong>rict 1 <strong>st</strong> , 2 nd , Walnut, and Locu<strong>st</strong> Hudson 1984<br />
Sixth St. Hi<strong>st</strong>oric Di<strong>st</strong>rict<br />
6 th St. between Myrtle and Vine<br />
St.<br />
Hudson 1984<br />
Soo Line Depot 120 High St. New Richmond 1988<br />
Soo Line High Bridge Re<strong>st</strong>ricted Somerset 1977<br />
St. Croix County Courthouse 904 3 rd St. Hudson 1982<br />
Stillwater Bridge MN36/WI64 over St. Croix River Houlton 1989<br />
Thompson, Erick J., House 350 2 nd St. New Richmond 1988<br />
Williams, T.E., Block 321 2 nd St. Hudson 1984<br />
Source: National Regi<strong>st</strong>er <strong>of</strong> Hi<strong>st</strong>oric Places < http://www.nationalregi<strong>st</strong>er<strong>of</strong>hi<strong>st</strong>oricplaces.com >. Augu<strong>st</strong> 22, 2008<br />
In St. Croix County, a total <strong>of</strong> 1,452 hi<strong>st</strong>oric places and objects have been identified as<br />
having hi<strong>st</strong>oric value and are on the AHI (See Table 5.10). The majority <strong>of</strong> these places<br />
are privately owned homes. Some locations may have multiple records or hi<strong>st</strong>oric<br />
buildings.<br />
Any development should be reviewed, pursuant to Wisconsin Statute 44.40 (1989),<br />
again<strong>st</strong> the hi<strong>st</strong>oric resource li<strong>st</strong> to determine whether hi<strong>st</strong>oric properties within the area<br />
will be affected. The Wisconsin Hi<strong>st</strong>orical Society should be contacted for a<br />
determination <strong>of</strong> possible impacts on these resources from development. The Hi<strong>st</strong>orical<br />
Society also <strong>st</strong>rongly recommends that all proposed developments be surveyed by a<br />
qualified archeologi<strong>st</strong> to identify any sites.<br />
The Wisconsin Hi<strong>st</strong>orical Society has grant funding available to help local communities<br />
undertake a hi<strong>st</strong>orical survey, with additional grant funds for a variety <strong>of</strong> hi<strong>st</strong>oric<br />
preservation activities. In addition, hi<strong>st</strong>oric commercial <strong>st</strong>ructures on the National<br />
Regi<strong>st</strong>er, or hi<strong>st</strong>oric commercial <strong>st</strong>ructures located in a hi<strong>st</strong>oric di<strong>st</strong>rict, may also qualify<br />
for tax credits. Owner-occupied homes that are eligible for li<strong>st</strong>ing in the National Regi<strong>st</strong>er<br />
do not have to be formally li<strong>st</strong>ed in the National Regi<strong>st</strong>er to be eligible for hi<strong>st</strong>oric<br />
preservation tax credits for rehabilitation projects.<br />
198 Agricultural, Natural, and Cultural Resources Information
Table 5.10 - Architecture and Hi<strong>st</strong>ory Inventory Li<strong>st</strong>ings – St. Croix County<br />
Municipality<br />
# <strong>of</strong> AHI<br />
Records<br />
Towns<br />
Baldwin 6<br />
Cady 13<br />
Cylon 5<br />
Eau Galle 10<br />
Emerald 11<br />
Erin Prairie 8<br />
Fore<strong>st</strong> 7<br />
Glenwood 18<br />
Hammond 3<br />
Hudson 17<br />
Kinnickinnic 9<br />
Pleasant Valley 4<br />
Richmond 9<br />
Rush River 7<br />
Saint Joseph 19<br />
Somerset 8<br />
Springfield 14<br />
Stanton 6<br />
Star Prairie 5<br />
Troy 12<br />
Warren<br />
Villages<br />
8<br />
Baldwin 19<br />
Deer Park 11<br />
Hammond 12<br />
North Hudson 70<br />
Roberts 7<br />
Somerset 15<br />
Star Prairie 6<br />
Spring Valley 0<br />
Wilson 4<br />
Woodville<br />
Cities<br />
7<br />
Glenwood City 28<br />
Hudson 534<br />
New Richmond 427<br />
River Falls 123<br />
Source: Wisconsin Hi<strong>st</strong>orical Society< http://www. wisconsinhi<strong>st</strong>ory.org/>. 2008.<br />
St. Croix County Conditions and Trends Report 199
Summary<br />
Numerous programs at the State and County level are available to assi<strong>st</strong> local<br />
communities in their planning efforts and in the protection <strong>of</strong> local agricultural, natural,<br />
and cultural resources. Protection <strong>of</strong> such resources needs to be balanced with, and can be<br />
complementary to, other community goals as discussed in the other exi<strong>st</strong>ing <strong>conditions</strong><br />
sections.<br />
Agricultural Resources Conditions Summary<br />
• Agriculture is the predominant use <strong>of</strong> the land in St. Croix County. The 2007 assessed<br />
agricultural acreage in the County was 257,655 or about 55 percent <strong>of</strong> the total land<br />
acreage.<br />
• From 1990 to 2007, the County experienced a 26.5 percent reduction in assessed<br />
agricultural land. That is a loss <strong>of</strong> about 1.6 percent per year during that period. Of the<br />
towns, Hudson (-69 percent), Star Prairie (-50.4 percent), Somerset (-41.2 percent),<br />
Saint Joseph (-35.4 percent), Eau Galle (-33.9 percent), and Richmond (-33.3) had the<br />
large<strong>st</strong> percentage reductions in agricultural land. As a whole, St. Croix County<br />
experienced a decrease from 11,805 total parcels <strong>of</strong> assessed farmland to 10,151 from<br />
1990 to 2007.<br />
• The towns <strong>of</strong> Erin Prairie (16,831), Emerald (15,837), Hammond (15,652), and Fore<strong>st</strong><br />
(15,238) have the greate<strong>st</strong> number <strong>of</strong> assessed agricultural acres (See Table 5.3). In<br />
comparison, the towns <strong>of</strong> Hudson, Pleasant Valley, Rush River, Saint Joseph, and Star<br />
Prairie all have less than 9,000 assessed acres in agricultural use.<br />
• In 2002, there were 130 more farms in St. Croix County than in 1978. Between 1992<br />
and 2002, there was an increase <strong>of</strong> 473 farms in the <strong>county</strong>. The average farm size<br />
decreased from 211 acres in 1978 to 166 acres in 2002. This shows a very significant<br />
pattern <strong>of</strong> small “hobby” farms.<br />
• The number <strong>of</strong> dairy farms in St. Croix County has continued to decrease over the pa<strong>st</strong><br />
two decades, with 228 dairy farms comprising 12 percent <strong>of</strong> the total farms in 2002. In<br />
1987, St. Croix County was home to 671 dairy farms (42.5 percent <strong>of</strong> the total farms),<br />
which was 443 more dairy farms than exi<strong>st</strong>ed in 2002. This is a 66 percent decrease in<br />
the number <strong>of</strong> dairy farms in St. Croix County between 1987 and 2002.<br />
• Seventy-three (73) percent <strong>of</strong> the soils in St. Croix County are classified as Class II or<br />
III. There are no Class I soils in the County<br />
• St. Croix County has seen a dramatic increase in the number <strong>of</strong> direct market farms<br />
and intere<strong>st</strong> and inve<strong>st</strong>ment in renewable energy, primarily bio-energy, in the pa<strong>st</strong><br />
decade.<br />
Natural Resources - Physical Features Conditions Summary<br />
• Generally, the topography <strong>of</strong> St. Croix County is lower in the we<strong>st</strong>ern edge <strong>of</strong> the<br />
County abutting the St. Croix River and rises in elevation the further ea<strong>st</strong>.<br />
200 Agricultural, Natural, and Cultural Resources Information
• Based on general soil types, 96.3 percent <strong>of</strong> the County’s land area has severe soil<br />
limitations for septic tank absorption fields. The remaining 3.7 percent <strong>of</strong> the land area<br />
has slight or moderate limitations.<br />
• St. Croix County has 23 operating and licensed non-metallic mining sites. There are<br />
no known metallic mineral deposits in sufficient tonnage or quality to warrant<br />
extraction.<br />
• Sand and gravel resources are available throughout the County, but are more abundant<br />
near rivers, and in the northwe<strong>st</strong> portion <strong>of</strong> the County.<br />
• St. Croix County has a total surface water area <strong>of</strong> 9,598 acres or 15 square miles<br />
• St. Croix County is located in both the St. Croix River Basin and the Lower Chippewa<br />
River Basin.<br />
• In general, the surface water quality in the St. Croix River Basin and the Lower<br />
Chippewa River Basin needs improvement due to agricultural run<strong>of</strong>f and<br />
sedimentation. There are four out<strong>st</strong>anding resource water bodies and six exceptional<br />
resource water bodies.<br />
Natural Resources - Sensitive Lands Conditions Summary<br />
• Approximately 9.8 percent <strong>of</strong> St. Croix County has <strong>st</strong>eep slopes <strong>of</strong> 13 percent or<br />
greater, on which development should be limited or discouraged.<br />
• In 2007, the combined assessed fore<strong>st</strong>land acres in the unincorporated areas (minimal<br />
acres exi<strong>st</strong>ed in incorporated areas) amounted to 50,143 acres or about 10.5 percent <strong>of</strong><br />
the total County acreage.<br />
• Combined, assessed agricultural and fore<strong>st</strong> acres account for 65 percent <strong>of</strong> the<br />
assessed land in the County.<br />
• Assessed fore<strong>st</strong> and AG fore<strong>st</strong> acreage increased by roughly 13,977 acres, or almo<strong>st</strong><br />
22 square miles, between 1990 and 2007. This was a 38.6 percent increase.<br />
• Between 1990 and 2007 the towns <strong>of</strong> Eau Galle (476 percent), Glenwood (154<br />
percent), and Hammond (147) saw the large<strong>st</strong> percentage increases in assessed<br />
fore<strong>st</strong>ed, which now includes AG fore<strong>st</strong>ed acreage. In 2007, the towns <strong>of</strong> Fore<strong>st</strong><br />
(4,999), Eau Galle (4,045), Somerset (3,664), Cylon (3,542), and Emerald (3,499) had<br />
the greate<strong>st</strong> amount <strong>of</strong> assessed fore<strong>st</strong>ed acreage, respectively. Hudson (372), Pleasant<br />
Valley (620), Rush River (772), and Hammond (787) had the lea<strong>st</strong> amount <strong>of</strong> assessed<br />
fore<strong>st</strong>ed acreage.<br />
• St. Croix County is home to 47 animal species, 27 plant species, and 23 natural<br />
communities that can be considered rare or endangered.<br />
• Sensitive habitats can be encroached upon or degraded by invasive species. There are<br />
a variety <strong>of</strong> invasive plants that have been found St. Croix County.<br />
• St. Croix County has one State Natural Area managed to protect local plants, animals,<br />
and/or ecosy<strong>st</strong>ems.<br />
St. Croix County Conditions and Trends Report 201
• St. Croix County has three Wisconsin Land Legacy Places identified in the draft State<br />
plan: Kinnickinnic River, Lower St. Croix River, and We<strong>st</strong>ern Prairie Habitat<br />
Re<strong>st</strong>oration Area.<br />
• St. Croix County has several parks which have a variety <strong>of</strong> recreational opportunities.<br />
Cultural Resources Conditions Summary<br />
• There are 33 locations in St. Croix County on the National Regi<strong>st</strong>er <strong>of</strong> Hi<strong>st</strong>oric Places.<br />
28 <strong>of</strong> the 33 are in either Hudson or New Richmond.<br />
• A total <strong>of</strong> 1,452 hi<strong>st</strong>oric places and objects in St. Croix County have been identified as<br />
having hi<strong>st</strong>oric value and are on the Wisconsin Architecture and Hi<strong>st</strong>ory Inventory.<br />
St. Croix County Natural Resource Map Series<br />
The St. Croix County Resource and Land Use Atlas DVD-ROM contains resource maps<br />
in Adobe Acrobat .pdf format for St. Croix County and each municipality. The <strong>county</strong>wide<br />
maps are also included within Appendix A at the end <strong>of</strong> this <strong>report</strong>. These maps<br />
(Maps 5.1 through 5.15) correspond to the previous discussion within the Agricultural,<br />
Natural, and Cultural Resources Information section.<br />
202 Agricultural, Natural, and Cultural Resources Information
6. ECONOMIC DEVELOPMENT INFORMATION<br />
Element Context<br />
Economic development as part <strong>of</strong> comprehensive planning is the process by which the St.<br />
Croix County community initiates and generates solutions to local economic problems.<br />
The primary purpose <strong>of</strong> economic development initiatives is to promote the <strong>st</strong>abilization,<br />
retention, or expansion <strong>of</strong> the economic base and to provide quality employment<br />
opportunities in the local governmental unit. This includes assi<strong>st</strong>ing exi<strong>st</strong>ing businesses,<br />
encouraging business expansion, recruiting new businesses, and <strong>st</strong>rategically planning<br />
important capital improvements and related infra<strong>st</strong>ructure expenditures. Such endeavors<br />
should be guided by the vision and goals in <strong>county</strong> and local comprehensive plans to<br />
encourage efficiency and ensure a positive impact on the community.<br />
These efforts collectively build long-term local economic capacity so the community is<br />
more self-sufficient and able to better weather economic downturns. As successful<br />
economic development endeavors <strong>st</strong>rengthen and diversify local economies, local<br />
businesses may locate in close proximity to the primary indu<strong>st</strong>ry that supports them.<br />
These secondary or support businesses take advantage <strong>of</strong> economic spillovers <strong>of</strong> the<br />
primary indu<strong>st</strong>ry. A local example <strong>of</strong> this is the close relationship between the exi<strong>st</strong>ing<br />
agriculture and food processing indu<strong>st</strong>ries.<br />
This information should also be considered in the context <strong>of</strong> the economic development<br />
programs, plans, and tools at work in St. Croix County and its communities which are<br />
identified in the Addendum: Inventory <strong>of</strong> Programs, Plans, and Land Use Policies in<br />
We<strong>st</strong> Central Wisconsin compiled by WCWRPC as part <strong>of</strong> the regional comprehensive<br />
planning effort.<br />
The Wisconsin Economy<br />
Perhaps more than many comprehensive plan elements, the local economy and economic<br />
development are influenced by regional, State, national, and global factors. As such,<br />
great uncertainty exi<strong>st</strong>s when analyzing and foreca<strong>st</strong>ing the economy. This section<br />
summarizes recent <strong>trends</strong> in the Wisconsin economy 2 .<br />
Recent Economic Trends<br />
The economy is always in flux, <strong>of</strong>ten occurring in cycles or periods <strong>of</strong> growth, prosperity,<br />
and expansion followed by periods <strong>of</strong> decline, contraction, or recession. There is no<br />
2 Unless otherwise noted, the information in this section was largely extracted from the following two<br />
sources: (1) Winters, Dennis, Chief Economi<strong>st</strong>. Department <strong>of</strong> Workforce Development-Office <strong>of</strong><br />
Economic Advisors. Data Dashboard-Statewide Analysis.<br />
. May 1, 2008. (2) Wisconsin Department <strong>of</strong> Revenue-<br />
Division <strong>of</strong> Research & Policy. Wisconsin Economic Outlook. May 2008.<br />
St. Croix County Conditions and Trends Report 203
eliable methodology to predicting such cycles, and some economi<strong>st</strong>s argue that these<br />
fluctuations are the result <strong>of</strong> “shocks” to the economy in terms <strong>of</strong> productivity or demand<br />
changes, and the use <strong>of</strong> the term “cycle” is a misnomer.<br />
Gross dome<strong>st</strong>ic product is <strong>of</strong>ten used to measure economic cycles, though Wisconsin’s<br />
annual average GDP has been growing quite <strong>st</strong>eadily over the la<strong>st</strong> decade. In<strong>st</strong>ead, in<br />
order to show these economic fluctuations, Figure 6.1 charts the composite index <strong>of</strong><br />
leading indicators between 1990 and May 2008 for Wisconsin.<br />
Leading economic indicators are based on certain economic activities which foreshadow<br />
a forthcoming economic change. In the case <strong>of</strong> Figure 6.1, the composite indicator<br />
includes average work week, overtime, job openings, new business <strong>st</strong>arts, and<br />
unemployment compensation claims.<br />
Figure 6.1 – Composite Index <strong>of</strong> Leading Indicators for Wisconsin (1990-May 2008)<br />
Composite Index <strong>of</strong> Leading Indicators<br />
(1994 avg. = 100)<br />
170<br />
160<br />
150<br />
140<br />
130<br />
120<br />
110<br />
100<br />
90<br />
80<br />
70<br />
1990<br />
1991<br />
1992<br />
1993<br />
1994<br />
1995<br />
source: Wisconsin Office <strong>of</strong> Economic Advisors<br />
1996<br />
1997<br />
1998<br />
Figure 6.1 reflects that Wisconsin <strong>st</strong>rongly felt the economic recession that hit much <strong>of</strong><br />
the world in the early 1990s following the October 1987 Black Monday <strong>st</strong>ock market<br />
collapse, the savings and loan crisis, and the 1990 spike in oil prices at the beginning <strong>of</strong><br />
the Gulf War. This downturn lagged in Wisconsin until 1993-1994.<br />
The Wisconsin economy grew rapidly on the “dot-com bubble” <strong>of</strong> the mid-to-late 1990s,<br />
as an exuberant market and venture capitali<strong>st</strong>s speculated on the <strong>st</strong>ocks <strong>of</strong> dot-com<br />
companies during a period <strong>of</strong> low intere<strong>st</strong>. But in March 2000, the bubble began to bur<strong>st</strong><br />
and by October 2002, $5 trillion in market value <strong>of</strong> technology companies had been lo<strong>st</strong>.<br />
This sudden economic decline is very apparent in Figure 6.1. Also about this time,<br />
204 Economic Development Information<br />
1999<br />
2000<br />
2001<br />
2002<br />
2003<br />
2004<br />
2005<br />
2006<br />
2007<br />
2008
Wisconsin and much <strong>of</strong> the world entered a period <strong>of</strong> manufacturing recession which was<br />
particularly felt in our State.<br />
Between 2004 and 2007, job growth in Wisconsin was relatively <strong>st</strong>rong and the economy<br />
rebounded, though there was a noticeable shift in the new jobs being created. Much <strong>of</strong><br />
this growth was in the services sectors, while the manufacturing indu<strong>st</strong>ry continued to<br />
<strong>st</strong>ruggle with job losses.<br />
The Current Economic Slowdown<br />
Economi<strong>st</strong>s are in disagreement over the current extent <strong>of</strong> the economic slowdown on a<br />
national level and foreca<strong>st</strong>ing the economy’s future. But as <strong>of</strong> May 1, 2008, it was<br />
generally agreed that the U.S. economy overall had not yet entered a period <strong>of</strong> less than<br />
positive growth.<br />
Two significant factors have largely contributed to our nation’s current economic<br />
situation—the downturn in the housing market and escalating oil prices. As <strong>of</strong> May<br />
2008, the single-family residential housing sector had not yet hit bottom; and the market<br />
continues to be plagued by high inventories, uncertain prices, and challenges for<br />
mortgage lenders, especially for those engaging in more risky sub-prime lending.<br />
According to the Wisconsin Realtors Association, home sales in the fir<strong>st</strong> quarter <strong>of</strong> 2008<br />
were down 24.9 percent from the fir<strong>st</strong> quarter <strong>of</strong> 2007. Home prices in Wisconsin held<br />
fairly <strong>st</strong>eady in 2007, though the median home price <strong>st</strong>atewide declined 3.8 percent in the<br />
fir<strong>st</strong> quarter <strong>of</strong> 2008. This decline was <strong>st</strong>ill less than half <strong>of</strong> the 7.7 percent decline<br />
nationwide. Housing permits in Wisconsin have had double-digit annual declines since<br />
2004. According to the Office <strong>of</strong> Economic Advisors’ May 2008 Statewide Analysis,<br />
“[w]hile foreclosures are up in the <strong>st</strong>ate, Wisconsin’s housing sector is not as exposed to<br />
the mortgage/price dilemma as much as other <strong>st</strong>ates such as Arizona, California, Florida,<br />
Nevada, and Ohio.” 3 In fact, Wisconsin ranked 27 th nationally in foreclosures during the<br />
fir<strong>st</strong> quarter <strong>of</strong> 2008.<br />
As shown in Figure 6.2 to<br />
the right, gasoline prices<br />
have increased<br />
tremendously since the mid<br />
part <strong>of</strong> this decade. With<br />
the record-breaking<br />
increases in the co<strong>st</strong> <strong>of</strong> oil,<br />
retail prices in the U.S.<br />
increased by five percent<br />
between June 2007 and<br />
June 2008. 4 Gas prices<br />
jumped by nearly one-third<br />
3 Ibid.<br />
4 Isidore, Chris. CNN Money.com. Inflation: Price Jump Wor<strong>st</strong> Since ’91. June 16,<br />
2008.<br />
Figure 6.2 - Gasoline & Medical Co<strong>st</strong>s Compared to<br />
Consumer Price Index: All Items<br />
220<br />
190<br />
160<br />
130<br />
100<br />
2001 = 100<br />
All items<br />
Gasoline<br />
Medical<br />
70<br />
2001 2002 2003 2004 2005 2006 2007 2008<br />
source: Wisconsin Office <strong>of</strong> Economic Advisors, May 2008.<br />
St. Croix County Conditions and Trends Report 205
during this same time period. This increase in gas and energy prices has had<br />
corresponding increases in food and other commodities, thereby decreasing household<br />
purchasing power and decreasing spending by consumers and businesses. In particular,<br />
automotive sales have been hurt as consumers hold on to their exi<strong>st</strong>ing vehicles longer or<br />
begin to use alternative modes <strong>of</strong> transportation. General Motors has announced its intent<br />
to close its Janesville plant, which primarily makes SUVs, resulting in the loss <strong>of</strong> 2,390<br />
jobs. Major re<strong>st</strong>ructuring and downsizing <strong>of</strong> airlines are also taking place due to<br />
increasing co<strong>st</strong>s, thereby impacting routes, availability, and shipping.<br />
The May unemployment rate for Wisconsin increased from 4.2 percent in 2007 to 4.7<br />
percent in 2008. 5 Yet, the State rate was a full one percent below the national average in<br />
May 2008; and unemployment in Wisconsin has risen at a slower rate during the pa<strong>st</strong><br />
year than the national average. Since mid 2007, employment numbers in Wisconsin have<br />
been relatively flat, while the employment growth rate has been diminishing since 2004.<br />
Even though unemployment has increased and the housing- and automotive-related<br />
indu<strong>st</strong>ries have suffered, the previously referenced Office <strong>of</strong> Economic Advisors’<br />
analysis does <strong>st</strong>ate that other sectors in Wisconsin are doing relatively well. “The weak<br />
dollar is benefitting exports <strong>of</strong> machinery, equipment, and agricultural commodities.<br />
Milk and grain prices are at or near record highs, although high feed prices are cutting<br />
into dairy pr<strong>of</strong>its.” The <strong>report</strong> goes on to note that during the previous year, 9,600 new<br />
jobs were created in the service sector, particular in the health-care indu<strong>st</strong>ry. Business<br />
and pr<strong>of</strong>essional services showed an annual increase <strong>of</strong> 1,800 jobs.<br />
The combination <strong>of</strong> a slowing economy and inflating prices is an added challenge to<br />
address. Intere<strong>st</strong> rate cuts, a primary tool for avoiding an economic recession, can add to<br />
economic pressure. Meanwhile, the reduction in tax revenues related to decreasing<br />
development and new housing <strong>st</strong>arts, combined with quickly escalating gas and<br />
commodity prices, has created a budgetary conundrum for many <strong>st</strong>ate, <strong>county</strong>, and local<br />
governments.<br />
Wisconsin’s Economic Outlook<br />
Foreca<strong>st</strong>ing the economy is difficult at be<strong>st</strong> and such projections are based on hi<strong>st</strong>orical<br />
economic fluctuations, current <strong>trends</strong>, and a variety <strong>of</strong> economic indicators. The<br />
Wisconsin Economic Outlook <strong>report</strong> issued by the Wisconsin Department <strong>of</strong> Revenue-<br />
Division <strong>of</strong> Research and Policy in May 2008 <strong>st</strong>ates that the Wisconsin economy is<br />
expected to slow for 2009 with the number <strong>of</strong> jobs slightly decreasing in 2008 and being<br />
<strong>st</strong>eady in 2009. The following is a brief summary <strong>of</strong> the <strong>report</strong>’s employment outlook by<br />
some key indu<strong>st</strong>ry sectors based on the mo<strong>st</strong> likely foreca<strong>st</strong> scenario:<br />
� Con<strong>st</strong>ruction - continue to decline to reach bottom by the end <strong>of</strong> 2008 and<br />
recovering positive growth toward 2010.<br />
5 Wisconsin Department <strong>of</strong> Workforce Development. May 2008 Local Unemployment Rates Announced.<br />
press release. June 25, 2008.<br />
206 Economic Development Information
� Education, Health, Pr<strong>of</strong>essional, & Business Services - continued growth <strong>of</strong> 1.6%<br />
to 2.4% for 2008 and 2009.<br />
� Trade Transportation & Utilities - mild decreases <strong>of</strong> 0.2% to 0.5%, then<br />
recovering positive growth in 2010.<br />
� Manufacturing – loss <strong>of</strong> 2% <strong>of</strong> jobs in 2008 and 2009, 0.2% loss in 2010, then<br />
recovering job growth in 2011.<br />
� Natural Resources & Mining – job losses in 2008 and 2009, with growth in 2010.<br />
� Leisure & Hospitality – 1.1% decline in 2009, then healthy growth rate thereafter.<br />
� Financial Sector – no growth in 2008, slight growth in 2009, then healthy growth<br />
thereafter.<br />
� Information Sector – slight declines or no increases until 2011.<br />
� Government – 0.6% decline in 2008, slight decrease in 2009, peak in 2010 as the<br />
2010 Census is carried out.<br />
While the economy adju<strong>st</strong>s, opportunities do arise. Consumers are turning more to fuelefficient<br />
vehicles, and the sale <strong>of</strong> hybrid vehicles is increasing. Research and<br />
development funding for alternative energy and energy-reducing technology is on the<br />
increase. Greater attention is being given to the planning and use <strong>of</strong> alternative means <strong>of</strong><br />
passenger and commercial transportation. For in<strong>st</strong>ance, many public transit and Amtrak<br />
services are setting new records. And increased energy co<strong>st</strong>s have increased attention on<br />
land use patterns, alternative building materials, and other related su<strong>st</strong>ainability concepts.<br />
In response to these <strong>trends</strong>, the We<strong>st</strong> Central Wisconsin Regional Comprehensive Plan,<br />
under development by WCWRPC, will include an energy and su<strong>st</strong>ainability section<br />
analyzing and providing advisory recommendations on how these concepts may be<br />
applied within our region.<br />
St. Croix County Economic Pr<strong>of</strong>ile<br />
Economic Data<br />
There is a significant amount <strong>of</strong> background data and information that is available from<br />
various public and private sources that is integrated into this document, including<br />
information from the following sources:<br />
� U.S. Census Bureau data<br />
o American Fact Finder Fact Sheets<br />
o County Business Patterns<br />
o Misc. demographic and other data<br />
� State <strong>of</strong> Wisconsin Department <strong>of</strong> Admini<strong>st</strong>ration<br />
o Demographics Services Center<br />
� State <strong>of</strong> Wisconsin Department <strong>of</strong> Workforce Development<br />
o County Workforce Pr<strong>of</strong>iles<br />
o County Snapshots<br />
o Office <strong>of</strong> Economic Advisors<br />
St. Croix County Conditions and Trends Report 207
� State <strong>of</strong> Wisconsin Department <strong>of</strong> Revenue<br />
o Wisconsin Economic Outlook<br />
� State <strong>of</strong> Wisconsin Department <strong>of</strong> Commerce<br />
� University <strong>of</strong> Wisconsin-Extension<br />
� We<strong>st</strong> Central Wisconsin Regional Planning Commission (WCWRPC)<br />
o County summaries available at www.wcwrpc.org<br />
o Comprehensive Economic Development Strategy<br />
� Indiana Business Research Center USA County Pr<strong>of</strong>iles<br />
� St. Croix County and other local agencies<br />
Given the wealth <strong>of</strong> economic data available at the State, regional, <strong>county</strong>, and local<br />
levels, the plethora <strong>of</strong> specialized business <strong>st</strong>udies, and the wide variety <strong>of</strong> economic<br />
models, no such compilation can truly be comprehensive in scope. As such, a<br />
community may need to consider additional <strong>st</strong>udies focusing on a specific issue or topic<br />
as their planning efforts proceed.<br />
Further, there has been no clear consensus to date in the region on a single particular data<br />
source and those economic indicators which should be used to measure economic vitality,<br />
challenges, and progress, and to allow for comparison between communities and regions.<br />
The State <strong>of</strong> Wisconsin, through the Department <strong>of</strong> Workforce Development-Office <strong>of</strong><br />
Economic Advisors, has developed Wisconsin Regional Metrics Benchmarks with a<br />
common set <strong>of</strong> core economic, demographic, and labor market indicators.<br />
Due to St. Croix County’s inclusion with the Minneapolis-St. Paul-Bloomington, MN-WI<br />
Metropolitan Stati<strong>st</strong>ical Area, some select data comparisons are included for the metro<br />
area as a whole. For ease <strong>of</strong> reference, the metro area is simply referred to as the Twin<br />
Cities MSA in the remainder <strong>of</strong> this section.<br />
Certain types <strong>of</strong> economic data and<br />
foreca<strong>st</strong>s are only available at a <strong>county</strong><br />
or regional level, and inferences mu<strong>st</strong> be<br />
made as to how it may be applicable for<br />
individual communities. However,<br />
earlier in the issues and opportunities<br />
section <strong>of</strong> this <strong>report</strong>, a variety <strong>of</strong><br />
demographic, education, and labor force<br />
data <strong>table</strong>s were provided for St. Croix<br />
County and its municipalities. This<br />
section does not re<strong>st</strong>ate the data <strong>table</strong>s<br />
and maps provided earlier, but, in<strong>st</strong>ead,<br />
builds upon this data to provide an<br />
economic “snapshot” <strong>of</strong> St. Croix<br />
County.<br />
Relationship to the<br />
Issues & Opportunities Section<br />
This section relies heavily on data provided<br />
previously in the issues and opportunities<br />
section (Section 1). The State<br />
Comprehensive Planning Law requires that<br />
the issues and opportunities element<br />
includes a variety <strong>of</strong> economic background<br />
information, including employment<br />
foreca<strong>st</strong>s, educational levels, income levels,<br />
and employment characteri<strong>st</strong>ics. As<br />
appropriate, this section refers back to these<br />
data <strong>table</strong>s in<strong>st</strong>ead <strong>of</strong> repeating them here.<br />
208 Economic Development Information
Demographic Overview<br />
Current demographic <strong>trends</strong>, including population changes and educational attainment,<br />
are important foundational factors in many economic development initiatives. The<br />
population pr<strong>of</strong>ile describes the exi<strong>st</strong>ing and potential labor force that may fill the jobs<br />
located in the region. Educational attainment <strong>st</strong>ati<strong>st</strong>ics are a proxy for the general skill<br />
level <strong>of</strong> the population. And household income allows inferences to be made about<br />
discretionary spending in St. Croix County as a whole.<br />
Population and Labor Force<br />
As <strong>of</strong> January 1, 2008, St. Croix County had an e<strong>st</strong>imated population <strong>of</strong> 79,702. 6<br />
This was a 26.2 percent increase since 2000, which is the highe<strong>st</strong> growth rate in<br />
the State <strong>of</strong> Wisconsin. As shown previously in Table 1.3 and Map 1.1, the<br />
we<strong>st</strong>ern half <strong>of</strong> the County has seen the highe<strong>st</strong> rates <strong>of</strong> growth, with incorporated<br />
communities growing fa<strong>st</strong>er than unincorporated towns.<br />
Overall, the St. Croix County population has been growing primarily from the inmigration<br />
<strong>of</strong> new residents, with a total population increase <strong>of</strong> 16,547 residents<br />
between 2000 to 2008.<br />
Between 2000 and 2030, the Wisconsin Department <strong>of</strong> Admini<strong>st</strong>ration has<br />
projected that St. Croix County’s population will increase by 74,205 residents (or<br />
117.5%). 7 For additional population <strong>st</strong>ati<strong>st</strong>ics by municipality, please see Tables<br />
1.1 to 1.13 in Section 1 <strong>of</strong> this <strong>report</strong>.<br />
Between 1990 and 2000, the County’s median age increased from 31.6 years to<br />
35.0 years, though it was <strong>st</strong>ill the 6 th younge<strong>st</strong> <strong>county</strong> in the State in 2000. The<br />
aging population <strong>of</strong> the region and County is a significant concern for the future<br />
and will place a greater emphasis on job training in the region. 8 Figure 6.3<br />
provides a visual representation <strong>of</strong> St. Croix County’s labor force using<br />
Wisconsin Department <strong>of</strong> Admini<strong>st</strong>ration population projections.<br />
Currently, mo<strong>st</strong> <strong>of</strong> the St. Croix County labor force is between the ages <strong>of</strong> 20 and<br />
44. Unlike many counties <strong>of</strong> the region, the total number <strong>of</strong> County residents<br />
under the age <strong>of</strong> 45 is expected to continue to increase over the next 30 years,<br />
though the growth rate <strong>of</strong> these age groups is expected to slow. Meanwhile, as<br />
Figure 6.3 shows, the number <strong>of</strong> residents over the age <strong>of</strong> 65 almo<strong>st</strong> triples.<br />
In short, while the County’s overall population is expected to increase 67.5<br />
percent from 2005 to 2030, the size <strong>of</strong> the primary workforce (ages 20-64) to<br />
support the local economy will only increase by 38 percent. Meanwhile, the<br />
number <strong>of</strong> seniors age 65 and over increases dramatically.<br />
6 Wisconsin Department <strong>of</strong> Admini<strong>st</strong>ration. Final Population E<strong>st</strong>imates. October 2008.<br />
7 Wisconsin Department <strong>of</strong> Admini<strong>st</strong>ration. Pre-Release Population Projections. October 2008.<br />
8 Dane, Andrew and Gary Paul Green. Labor Market Conditions in Barron County. University <strong>of</strong><br />
Wisconsin-Extension. January 12, 2005.<br />
St. Croix County Conditions and Trends Report 209
Figure 6.3 – St. Croix County Age/Labor Force Projection (2005-2030)<br />
Population by Age Group<br />
36,000<br />
31,000<br />
26,000<br />
21,000<br />
16,000<br />
11,000<br />
6,000<br />
2005 2010 2015 2020 2025 2030<br />
source: Wisconsin Department <strong>of</strong> Admini<strong>st</strong>ration<br />
Year<br />
For additional insight into the St. Croix County labor force, the Office <strong>of</strong><br />
Economic Advisors’ County Workforce Pr<strong>of</strong>iles are an excellent source and are<br />
updated annually.<br />
Housing Market<br />
According to data provided by the US Bureau <strong>of</strong> the Census, the e<strong>st</strong>imated<br />
number <strong>of</strong> single-family residential building permits issued in 1998 was 575<br />
compared to 338 in 2007, a 40.1 percent decrease. Permits for all units decreased<br />
even more sub<strong>st</strong>antially (-63.9%) from 1,022 units in 1998 to 369 units in 2007.<br />
Building permits numbers reflect larger economic <strong>trends</strong> and can vary<br />
significantly from year to year. For in<strong>st</strong>ance, the highe<strong>st</strong> number <strong>of</strong> units issued<br />
permits during the pa<strong>st</strong> decade occurred in 2003 when 1,525 total units valued at<br />
$216.8 million were permitted. This was over $147.9 million more in<br />
con<strong>st</strong>ruction value compared to 2007.<br />
Education<br />
As shown in Table 6.1, <strong>of</strong> the 2000 St. Croix County population that is 25 years<br />
and over, 91.6 percent had a high school education or higher, and 26.3 percent<br />
had a bachelor’s degree or higher. These averages are above the State averages.<br />
but slightly below the averages for the Twin. Compared to a decade earlier, more<br />
County residents are undertaking some type <strong>of</strong> po<strong>st</strong>-secondary education.<br />
210 Economic Development Information<br />
0-19<br />
20-44<br />
45-64<br />
65+<br />
Age Groups
Table 6.1 – St. Croix County Educational Attainment (1990, 2000)<br />
Educational Attainment (residents St. Croix County Twin Cities Wisconsin<br />
25 years or older)<br />
1990 2000 90 to '00 MSA 2000<br />
2000<br />
% % % Change %<br />
Less than high school diploma 15.6 8.4 -46.2 9.4 15.0<br />
High school graduate 38.6 33.3 -13.7 9.1 34.6<br />
Some college, no degree 17.2 23.1 34.3 24.2 20.6<br />
Associate degree 8.3 8.9 7.2 7.7 7.5<br />
Bachelor’s degree or higher 20.3 26.3 29.6 33.3 22.5<br />
High school graduate or higher 84.4 91.6 8.5 90.6 85.1<br />
source: U.S. Census Bureau, 1990, 2000.<br />
The demand for labor in the region is shifting toward more skilled work, although<br />
not as quickly as some other regions in the State. This trend increases the need<br />
for worker training opportunities. A <strong>st</strong>rong, traditional secondary educational<br />
sy<strong>st</strong>em and a variety <strong>of</strong> worker training programs are important factors in<br />
economic development.<br />
There are six K-12 public school di<strong>st</strong>ricts headquartered in St. Croix County.<br />
Wisconsin Indianhead Technical College has a regional campus in New<br />
Richmond, and nearby in Pierce County is UW-River Falls and a Chippewa<br />
Valley Technical College campus. These in<strong>st</strong>itutions meet many <strong>of</strong> the training<br />
needs for many St. Croix County businesses, though select indu<strong>st</strong>ries may require<br />
additional educational support.<br />
For more detailed data on educational attainment by municipality in St. Croix<br />
County, please see Table 1.13 in Section 1 <strong>of</strong> this <strong>report</strong>.<br />
Income and Wages<br />
Summarizing income <strong>st</strong>ati<strong>st</strong>ics yields insight on purchasing power. The 2005<br />
median household income for St. Croix County was $65,684, which was 3 rd in the<br />
State <strong>of</strong> Wisconsin and 139.3 percent <strong>of</strong> the State average. This was also slightly<br />
above the median household income for the Twin Cities <strong>of</strong> $62,223. Figure 6.4<br />
compares St. Croix County’s per capita personal income 9 to State averages.<br />
Unlike the other counties in we<strong>st</strong> central Wisconsin, income levels in St. Croix<br />
County exceeds State averages, but has increasing at a slower rate over the pa<strong>st</strong><br />
five years.<br />
9 Personal income is the income received by persons from all sources.<br />
St. Croix County Conditions and Trends Report 211
Figure 6.4 – St. Croix County vs. State Per Capita Personal Income (1997-2006)<br />
$36,000<br />
$34,000<br />
$32,000<br />
$30,000<br />
$28,000<br />
$26,000<br />
$24,000<br />
$22,000<br />
$20,000<br />
$18,000<br />
$26,004<br />
$24,514<br />
$20,734<br />
source: U.S. Department <strong>of</strong> Commerce – Bureau <strong>of</strong> Economic Analysis.<br />
About 4.7 percent <strong>of</strong> individuals in the County were below the poverty level in 2005, up<br />
from 3.9 percent in 2000. For household income data by municipality, please see Tables<br />
1.21 and 1.22 in Section 1.<br />
Overall average annual wages for St. Croix County increased by 9.5 percent in the<br />
six years from 2001 to 2006 as shown in Table 6.2. The bigge<strong>st</strong> percentage<br />
increase was in the financial activities indu<strong>st</strong>ry, while pr<strong>of</strong>essional and business<br />
Table 6.2 – St. Croix County Average Annual Wages by Indu<strong>st</strong>ry (2001-2006)<br />
for covered employment and wages<br />
Indu<strong>st</strong>ry 2001 2002 2003 2004 2005 2006<br />
% change<br />
'01-'06<br />
Natural Resources 20,047 21,201 22,841 23,628 24,542 24,712 23.3%<br />
Con<strong>st</strong>ruction 37,072 38,176 39,558 41,157 41,569 42,061 13.5%<br />
Manufacturing 34,354 35,540 37,012 38,559 39,115 40,223 17.1%<br />
Trade, Transportation, Utilities 24,715 25,357 26,243 26,492 27,121 27,679 12.0%<br />
Financial Activities 28,176 29,801 32,992 33,899 34,680 36,067 28.0%<br />
Education & Health 27,755 29,533 30,081 31,389 31,863 32,441 16.9%<br />
Information 23,520 24,809 24,457 25,896 27,413 27,727 17.9%<br />
Leisure & Hospitality 9,854 10,281 10,585 10,824 11,157 11,140 13.1%<br />
Pr<strong>of</strong>essional & Business Services 31,771 35,934 38,049 40,249 39,335 40,309 26.9%<br />
Other Services 16,353 15,525 17,210 17,539 19,338 19,035 16.4%<br />
Public Adminini<strong>st</strong>ration 22,716 23,547 28,578 30,338 31,153 32,323 42.3%<br />
All Indu<strong>st</strong>ries 26,763 27,941 29,149 30,206 30,576 31,184 16.5%<br />
source: Wisconsin Department <strong>of</strong> Workforce Development, Office <strong>of</strong> Economic Advisors<br />
Wisconsin (all)<br />
212 Economic Development Information<br />
$34,405<br />
$34,319<br />
$29,022<br />
Wisc. (non-metro)<br />
St. Croix County<br />
1997 1998 1999 2000 2001 2002 2003 2004 2005 2006
services wages decreased. While the County’s household income were above<br />
State average, the 2006 average wage in St. Croix County was $31,184 or about<br />
85 percent <strong>of</strong> the average Wisconsin wage. This discrepancy between household<br />
incomes and wages reflects the high number <strong>of</strong> St. Croix County residents who<br />
commute to the Twin Cities for employment. For 2004 e<strong>st</strong>imated salary and<br />
wages by occupation, please see Table 6.8 later in this section.<br />
Employment Trends<br />
Of St. Croix County residents 16 years <strong>of</strong> age and over, 74.6 percent were in the<br />
labor force as <strong>of</strong> 2006, above the State average. As the monthly employment<br />
rates presented in Figure 6.5 show, St. Croix County experiences a significantly<br />
higher amount <strong>of</strong> employment seasonality compared to State averages, with<br />
increased unemployment during the winter months. For example, in February<br />
2008, the St. Croix County unemployment rate was 5.8 percent, but this dropped<br />
to 4.0 percent by May 2008.<br />
Figure 6.5 – St. Croix Co. & Wisconsin Monthly Unemployment Rate (1990-June 2008)<br />
not seasonally adju<strong>st</strong>ed<br />
Unemployment (%)<br />
10.0<br />
9.0<br />
8.0<br />
7.0<br />
6.0<br />
5.0<br />
4.0<br />
3.0<br />
2.0<br />
1.0<br />
1990<br />
1990<br />
1991<br />
1992<br />
1993<br />
1993<br />
1994<br />
source: Wisconsin Department <strong>of</strong> Workforce Development, Office <strong>of</strong> Economic Advisors<br />
1995<br />
1996<br />
1996<br />
1997<br />
Hi<strong>st</strong>orically since 1990, unemployment in St. Croix County has been below the<br />
State average, dropping to a remarkable low <strong>of</strong> 1.5 percent in November 1999<br />
during this timeframe. However, unemployment in the County has been about 1<br />
St. Croix County Conditions and Trends Report 213<br />
1998<br />
1999<br />
1999<br />
2000<br />
2001<br />
Wisconsin<br />
St. Croix County<br />
2002<br />
Lines are averaged<br />
trend lines (polynomial method)<br />
for relative comparison<br />
purposes only.<br />
2002<br />
2003<br />
2004<br />
2005<br />
2005<br />
2006<br />
2007<br />
2008
percent higher than the annual average unemployment rate for the Twin Cities<br />
MSA since 2002. But the County’s unemployment rate increased significantly<br />
from the 1999 annual average rate <strong>of</strong> 2.3 percent, reaching an annual average <strong>of</strong><br />
5.9 percent in 2003. Since 2003, the County’s annual average unemployment rate<br />
has hovered between 4.7 to 4.9 percent.<br />
Unemployment is not only a reflection <strong>of</strong> job availability, but total available labor<br />
force. Figure 6.6 shows that the St. Croix County labor force grew by over<br />
19,605 persons or 71.8 percent from 1900 to 2007. According to the UW-<br />
Extension 2005 labor market <strong>conditions</strong> <strong>report</strong>, the region’s labor market remains<br />
tight, with mo<strong>st</strong> employers having a difficult time attracting and retaining<br />
qualified workers. 10 Table 1.14 in Section 1 provides unemployment <strong>st</strong>ati<strong>st</strong>ics for<br />
the 1990 and 2000 labor force by municipality.<br />
Figure 6.6 – St. Croix Co. Monthly Total Potential Labor Force (1990-June 2008)<br />
not seasonally adju<strong>st</strong>ed<br />
Total Potential Labor Force<br />
46,000<br />
41,000<br />
36,000<br />
31,000<br />
26,000<br />
27,080<br />
1990<br />
1990<br />
1991<br />
Monthly Labor Force<br />
Avg. Trend Line<br />
1992<br />
1993<br />
1993<br />
source: Wisconsin Department <strong>of</strong> Workforce Development, Office <strong>of</strong> Economic Advisors<br />
1994<br />
1995<br />
1996<br />
10 Dane, Andrew and Gary Paul Green. Labor Market Conditions in Barron County. University<br />
<strong>of</strong> Wisconsin-Extension. January 12, 2005.<br />
214 Economic Development Information<br />
1996<br />
1997<br />
1998<br />
1999<br />
1999<br />
2000<br />
2001<br />
2002<br />
2002<br />
2003<br />
2004<br />
Red line is the<br />
averaged<br />
trend line<br />
(polynomial method).<br />
2005<br />
2005<br />
2006<br />
2007<br />
46,510<br />
2008
Commuting Patterns<br />
Of St. Croix County workers 16 years <strong>of</strong> age and over in 2000, 80.5 percent drove<br />
to work alone; and workers had a mean travel time <strong>of</strong> 26.1 minutes. Figure 6.7<br />
shows that commuting di<strong>st</strong>ances and travel time for St. Croix County resident<br />
workers have been increasing, especially for those travelling farther, with fewer<br />
persons working at home. In 2000, 43.8 percent <strong>of</strong> the St. Croix County<br />
workforce were employed outside the State <strong>of</strong> Wisconsin, primarily commuting to<br />
the Twin Cities for employment. Only 18.7 percent worked in the municipality in<br />
which they resided.<br />
Figure 6.7 – St. Croix County Travel Time to Work (1990, 2000)<br />
# <strong>of</strong> Commuters<br />
14,000<br />
12,000<br />
10,000<br />
8,000<br />
6,000<br />
4,000<br />
2,000<br />
0<br />
source: U.S. Census<br />
1,892 1,625<br />
5,522 6,101<br />
5,764<br />
8,037<br />
4,093<br />
5,696<br />
8,055<br />
Worked at home < 10 min. 10-19 min. 20-29 min. 30+ min.<br />
Travel Time to Work<br />
12,969<br />
Tables 1.18 and 1.19 provide <strong>st</strong>ati<strong>st</strong>ics on travel time to work and place <strong>of</strong> work<br />
for the County and by municipality. Commuting patterns are discussed in greater<br />
detail within the transportation discussion (See Section 3. Transportation).<br />
St. Croix County Conditions and Trends Report 215<br />
1990<br />
2000
Economic Base<br />
While the previous sub-section focused on general economic indicators for St. Croix<br />
County, the following information focuses more on the different indu<strong>st</strong>ry sectors and<br />
occupations which con<strong>st</strong>itute the County’s economic base.<br />
Indu<strong>st</strong>ry Composition<br />
According to <strong>st</strong>ati<strong>st</strong>ics from the US Census Bureau and Bureau <strong>of</strong> Economic<br />
Analysis for St. Croix County:<br />
� In 2000, about 81% <strong>of</strong> the employed workforce were private-sector wage and<br />
salary workers; about 11.6% were government workers and 6.9% were selfemployed<br />
not in an incorporated business<br />
� In 2006, the average income per job in sole proprietorships was about 32.2% <strong>of</strong><br />
the County’s total average wages and salaries per job with employer<br />
contributions.<br />
� Annual average earnings per job in 2006 were $31,421. Annual average earnings<br />
per farm proprietor was -$3,004.<br />
As shown in Table 6.3, the con<strong>st</strong>ruction indu<strong>st</strong>ry has the large<strong>st</strong> number <strong>of</strong><br />
e<strong>st</strong>ablishments, reflecting the County’s high growth rate, though this number was<br />
fairly <strong>st</strong>able in 2005 and 2006.<br />
Table 6.3 – St. Croix County Number <strong>of</strong> E<strong>st</strong>ablishments by Indu<strong>st</strong>ry (1998-2006)<br />
Indu<strong>st</strong>ry Code 1998 1999 2000 2001 2002 2003 2004 2005 2006<br />
%<br />
change<br />
'98-'06<br />
Fore<strong>st</strong>ry, fishing, hunting, and agri. support 4 3 6 6 9 9 7 8 7 75.0%<br />
Mining 3 3 2 3 3 3 4 3 3 0.0%<br />
Utilities 6 4 5 5 5 6 5 4 4 -33.3%<br />
Con<strong>st</strong>ruction 210 223 229 240 280 312 327 345 344 63.8%<br />
Manufacturing 159 155 145 147 151 151 162 160 164 3.1%<br />
Wholesale trade 75 85 87 82 107 93 93 93 97 29.3%<br />
Retail trade 226 226 221 226 238 238 237 245 246 8.8%<br />
Transportation & warehousing 54 61 69 70 72 72 71 71 73 35.2%<br />
Information 27 24 26 27 28 28 30 33 32 18.5%<br />
Finance & insurance 74 81 85 75 96 98 103 108 122 64.9%<br />
Real e<strong>st</strong>ate & rental & leasing 53 57 57 62 73 81 99 105 103 94.3%<br />
Pr<strong>of</strong>essional, scientific & technical services 149 159 175 183 185 193 186 193 206 38.3%<br />
Management <strong>of</strong> companies & enterprises 5 6 6 7 6 7 6 7 6 20.0%<br />
Admin, support, wa<strong>st</strong>e mgt, remediation 85 91 90 98 96 110 111 116 109 28.2%<br />
Educational services 7 10 10 11 14 13 13 18 22 214.3%<br />
Health care and social assi<strong>st</strong>ance 105 101 108 113 130 132 136 140 148 41.0%<br />
Arts, entertainment & recreation 32 32 33 37 40 42 44 49 45 40.6%<br />
Accommodation & food services 134 139 141 149 167 171 173 183 180 34.3%<br />
Other services (except public admini<strong>st</strong>ration) 156 159 168 166 187 184 195 199 197 26.3%<br />
Unclassified/Auxillary e<strong>st</strong>ablishments 15 16 20 16 8 6 7 3 3 -80.0%<br />
Total 1,579 1,635 1,683 1,723 1,895 1,949 2,009 2,083 2,111 33.7%<br />
source: U.S. Census Bureau County Business Patterns<br />
216 Economic Development Information
The con<strong>st</strong>ruction indu<strong>st</strong>ry also had the large<strong>st</strong> number <strong>of</strong> new e<strong>st</strong>ablishments<br />
between 1998 and 2006 with 134, while the fa<strong>st</strong>e<strong>st</strong> growing indu<strong>st</strong>ries in terms <strong>of</strong><br />
new e<strong>st</strong>ablishments were educational services and real e<strong>st</strong>ate/leasing.<br />
Employment by Indu<strong>st</strong>ry<br />
As shown in Table 6.4 below, employment in the services sectors (e.g., financial,<br />
education and health) has been growing at a fa<strong>st</strong>er rate than the goods-producing<br />
sectors in St. Croix County. In fact, manufacturing employment decreased by 7.2<br />
percent from 2001 to 2006.<br />
Table 6.4 – St. Croix County Employment by Indu<strong>st</strong>ry (2001-2006)<br />
Indu<strong>st</strong>ry 2001 2002 2003 2004 2005 2006<br />
% change<br />
'01-'06<br />
Natural resources 288 290 271 289 297 301 4.5%<br />
Con<strong>st</strong>ruction 1477 1586 1640 1771 1791 1631 10.4%<br />
Manufacturing 6640 6040 5400 5653 5723 6159 -7.2%<br />
Trade, Transportation, Utilities 5211 5291 5426 5644 5766 6058 16.3%<br />
Financial activities 914 964 1045 1166 1185 1178 28.9%<br />
Education & Health 4105 4280 4415 4481 4716 4948 20.5%<br />
Information 299 285 272 279 279 290 -3.0%<br />
Leisure & Hospitality 3148 3151 3196 3251 3425 3572 13.5%<br />
Pr<strong>of</strong>essional & Business Services 1883 2052 2283 2064 1960 2093 11.2%<br />
Other services 797 744 765 789 734 840 5.4%<br />
Public Adminini<strong>st</strong>ration 1312 1305 1228 1248 1261 1296 -1.2%<br />
All indu<strong>st</strong>ries 26074 25988 25943 26636 27138 28365 8.8%<br />
source: Wisconsin Department <strong>of</strong> Workforce Development-Office <strong>of</strong> Economic Advisors<br />
These <strong>trends</strong> are consi<strong>st</strong>ent with the hi<strong>st</strong>orical employment data provided<br />
previously for St. Croix County and its municipalities in Tables 1.15 and 1.16.<br />
However, while the hi<strong>st</strong>orical data is arranged by Standard Indu<strong>st</strong>rial<br />
Classification (SIC) code, mo<strong>st</strong> indu<strong>st</strong>ry data available today is organized by the<br />
North American Indu<strong>st</strong>ry Classification Sy<strong>st</strong>em (NAICS), <strong>of</strong>ten making<br />
comparisons between newer and older indu<strong>st</strong>ry data challenging.<br />
Though manufacturing employment decreased from 2001 to 2006 overall, the<br />
indu<strong>st</strong>ry has gained jobs <strong>st</strong>eadily since 2003. Manufacturing remains the large<strong>st</strong><br />
indu<strong>st</strong>ry by employment as represented in Figure 6.8. If <strong>trends</strong> continue as<br />
expected, the second large<strong>st</strong> employment sector—trade, transportation, and<br />
utilities—may have already become the top employment indu<strong>st</strong>ry in the County.<br />
Retail trade employment con<strong>st</strong>itutes the large<strong>st</strong> component <strong>of</strong> the trade,<br />
transportation, and utilities indu<strong>st</strong>ry. While financial activities are the fa<strong>st</strong>er<br />
growing sectors, they <strong>st</strong>ill con<strong>st</strong>itute a small portion <strong>of</strong> St. Croix County’s total<br />
employment.<br />
St. Croix County Conditions and Trends Report 217
Figure 6.8 – St. Croix County Employment by Indu<strong>st</strong>ry (2006)<br />
Pr<strong>of</strong>., Business, & Financial<br />
Services<br />
12%<br />
Leisure & Hospitality<br />
13%<br />
Information & Other<br />
Services<br />
4%<br />
Education & Health<br />
17%<br />
Public Adminini<strong>st</strong>ration<br />
5%<br />
source data:: Wisconsin Department <strong>of</strong> Workforce Development-Office <strong>of</strong> Economic Advisors<br />
Con<strong>st</strong>ruction & Nat.<br />
Resources<br />
7%<br />
Manufacturing<br />
21%<br />
Trade, Transportation,<br />
Utilities<br />
21%<br />
Nine <strong>of</strong> St. Croix County’s top-25 employers are manufacturing companies (see<br />
Table 6.5), consi<strong>st</strong>ing <strong>of</strong> companies which produce pla<strong>st</strong>ics, refrigeration<br />
products, electric motors, fabricated metals and machining, windows and doors,<br />
and packaging materials. Average wages in the manufacturing sector are about<br />
29% higher than overall average wages in the County.<br />
The second-large<strong>st</strong> share <strong>of</strong> jobs was in retail and wholesale trade which<br />
continues to grow. Some <strong>of</strong> the jobs with retail trade employers are seasonal and<br />
part time, and contribute to the reason for the low annual average wage for the<br />
indu<strong>st</strong>ry (see Table 6.6). Wal-Mart is the third large<strong>st</strong> employer in the St. Croix<br />
County and Econo Foods is the 20 th large<strong>st</strong>.<br />
218 Economic Development Information
Table 6.5– St. Croix County Top Employers as <strong>of</strong> March 2007<br />
(with 100+ employees)<br />
Rank Employer Name Indu<strong>st</strong>ry Type<br />
Employee<br />
size range<br />
1 School Di<strong>st</strong>rict <strong>of</strong> Hudson Elementary & secondary schools 500-999<br />
2 County <strong>of</strong> St Croix Executive & legislative <strong>of</strong>fices, combined 500-999<br />
3 Wal-Mart Discount department <strong>st</strong>ores 500-999<br />
4 New Richmond Public School Elementary & secondary schools 250-499<br />
5 Phillips Pla<strong>st</strong>ics Corp All other pla<strong>st</strong>ics product manufacturing 250-499<br />
6 YMCA Civic & social organizations 250-499<br />
7 Nor Lake Inc AC, refrigeration, & forced air heating 250-499<br />
8 Baldwin-Woodville Area School Elementary & secondary schools 250-499<br />
9 Mc Millan Electric Co Motor & generator manufacturing 250-499<br />
10 OEM Fabricators Inc Miscellaneous fabricated metal product mfg. 250-499<br />
11 Hudson Memorial Hospital General medical & surgical hospitals 250-499<br />
12 Baldwin Hospital General medical & surgical hospitals 250-499<br />
13 Clopay Building Products Co Inc Metal window & door manufacturing 100-249<br />
13 Fir<strong>st</strong>site Staffing Inc Temporary help services 100-249<br />
15 Loparex Coated & laminated packaging materials mfg. 100-249<br />
16 We<strong>st</strong>ern Wisconsin Medical Associates Offices <strong>of</strong> physicians, except mental health 100-249<br />
17 Holy Family Hospital General medical & surgical hospitals 100-249<br />
18 United Gear & Assembly Inc Machine shops 100-249<br />
19 Doboy Inc Packaging machinery manufacturing 100-249<br />
20 Econo Foods Supermarkets & other grocery <strong>st</strong>ores 100-249<br />
21 Scientific Molding Corp Ltd All other pla<strong>st</strong>ics product manufacturing 100-249<br />
22 St Croix Central Schools Elementary & secondary schools 100-249<br />
23 Mps Staffing Temporary help services 100-249<br />
24 River Falls Area Hospital General medical & surgical hospitals 100-249<br />
25 City <strong>of</strong> Hudson Ambulance services 100-249<br />
26 Target Discount department <strong>st</strong>ores 100-249<br />
27 County Market Supermarkets & other grocery <strong>st</strong>ores 100-249<br />
28 County Materials Corp Ready-mix concrete manufacturing 100-249<br />
29 Menards Home centers 100-249<br />
30 Donaldson Co Inc Air purification equipment manufacturing 100-249<br />
30 Wiseway Motor Freight Inc General freight trucking, long-di<strong>st</strong>ance TL 100-249<br />
32 Niro Inc Food product machinery manufacturing 100-249<br />
32 Glenwood City School Di<strong>st</strong>rict Elementary & secondary schools 100-249<br />
34 Vital Pla<strong>st</strong>ics Inc All other pla<strong>st</strong>ics product manufacturing 100-249<br />
34 School Di<strong>st</strong>rict <strong>of</strong> Somerset Elementary & secondary schools 100-249<br />
36 Kwik Trip Inc Gasoline <strong>st</strong>ations with convenience <strong>st</strong>ores 100-249<br />
37 Federal Foam Technologies Inc Urethane & other foam product mfg. 100-249<br />
37 Preco Inc Miscellaneous electrical equipment mfg. 100-249<br />
39 McDonald's Limited-service re<strong>st</strong>aurants 100-249<br />
39 Chri<strong>st</strong>ian Community Home Nursing care facilities 100-249<br />
41 S-S-G Corp Gasoline <strong>st</strong>ations with convenience <strong>st</strong>ores 100-249<br />
42 Contour Pla<strong>st</strong>ics Inc All other pla<strong>st</strong>ics product manufacturing 100-249<br />
43 Fleet Farm All other general merchandise <strong>st</strong>ores 100-249<br />
44 NMC Managing <strong>of</strong>fices 100-249<br />
44 Wisconsin Indianhead Technical College Junior colleges 100-249<br />
46 City <strong>of</strong> New Richmond Executive & legislative <strong>of</strong>fices, combined 100-249<br />
47 ShopKo Discount department <strong>st</strong>ores 100-249<br />
48 St Croix Press Inc Commercial lithographic printing 100-249<br />
49 K-Tek Corp Metal <strong>st</strong>amping 100-249<br />
50 QMR Pla<strong>st</strong>ics All other pla<strong>st</strong>ics product manufacturing 100-249<br />
source: Wisconsin Department <strong>of</strong> Workforce Development-Office <strong>of</strong> Economic Advisors<br />
St. Croix County Conditions and Trends Report 219
The third-large<strong>st</strong> share <strong>of</strong> jobs was with education and health entities. This sector<br />
has been growing <strong>st</strong>rongly. Four school di<strong>st</strong>ricts, four hospitals, an ambulance<br />
service, and a physicians’ <strong>of</strong>fices are all ranked within the County’s top 25<br />
employers. The School Di<strong>st</strong>rict <strong>of</strong> Hudson is the large<strong>st</strong> employer in the County.<br />
The YMCA, which is the sixth large<strong>st</strong> employer, may also be included in the<br />
education and health indu<strong>st</strong>ry sector.<br />
A large number <strong>of</strong> St. Croix County employees also provide health services,<br />
helping to make the County government the second large<strong>st</strong> employer in the<br />
County. As <strong>of</strong> 2007, public admini<strong>st</strong>ration jobs con<strong>st</strong>ituted about 5 percent <strong>of</strong> the<br />
County’s employment and decreased between 2001 and 2006.<br />
Given that so many residents commute to Minnesota for work, it is valuable to<br />
compare the St. Croix County employment by indu<strong>st</strong>ry to that <strong>of</strong> the top<br />
employers in the larger Twin Cities MSA. In 2006, the top six indu<strong>st</strong>ries by<br />
employment were:<br />
Education and health services 20.6%<br />
Manufacturing 14.5%<br />
Pr<strong>of</strong>essional, Scientific, Wa<strong>st</strong>e Mgmt. 11.6%<br />
Retail trade 10.9%<br />
Finance, insurance, and real e<strong>st</strong>ate 11.6%<br />
Arts, entertainment, & hospitality 7.9%<br />
As <strong>of</strong> 2000, 5.2 percent <strong>of</strong> St. Croix County jobs were in farming, <strong>of</strong> which 82.7%<br />
were sole proprietors. St. Croix County ranked 26 th among the State’s 72 counties<br />
in the total value <strong>of</strong> agricultural products sold in 2002.<br />
As noted in the U.S. Department <strong>of</strong> Agriculture Censuses, and as discussed<br />
previously in Section 5, the acreage <strong>of</strong> farmland and average farm size has<br />
decreased dramatically over the la<strong>st</strong> 30 years. Even with these changes in<br />
agriculture, St. Croix County farmers sold nearly $98 million worth <strong>of</strong><br />
agricultural products in 2002, which has a significant economic impact.<br />
Seventy-one percent <strong>of</strong> this value was in live<strong>st</strong>ock, poultry, and related products,<br />
rather than crop and nursery products. St. Croix County ranked sixth in the State<br />
in turkey live<strong>st</strong>ock given its proximity to the large turkey processing plants in<br />
Barron County; seventh in the State in horses and donkeys; and fir<strong>st</strong> in the State<br />
in quail live<strong>st</strong>ock. The County also ranked tenth in the State in oat production in<br />
2002.<br />
220 Economic Development Information
Employment by Occupation<br />
Like employment by indu<strong>st</strong>ry, employment by occupation is also difficult to<br />
compare across years due to changing definitions and data-gathering approaches.<br />
Employment by occupation for 1990 and 2000 for each St. Croix County<br />
municipality is included in Table 1.17 in Section 1 <strong>of</strong> this <strong>report</strong>. According to<br />
the 2000 U.S. Census, <strong>of</strong> the St. Croix County employed civilian population 16<br />
years <strong>of</strong> age and over (34,905):<br />
� 33.6% were employed in management, pr<strong>of</strong>essional, and related<br />
occupations<br />
� 24.4% were in sales and <strong>of</strong>fice occupations<br />
� 18.4% were in production, transportation, and material moving<br />
occupations<br />
Together, these three general occupation categories con<strong>st</strong>itute 76.4 percent <strong>of</strong> the<br />
County’s workforce.<br />
Table 6.6 – We<strong>st</strong> Central Wisconsin WDA Region<br />
E<strong>st</strong>imated Employment and Salary by Occupation (2004)<br />
2004 % <strong>of</strong> Total Average<br />
Occupation<br />
EmployEmploy- Annual<br />
mentment Salary<br />
Office and Admini<strong>st</strong>rative Support 27,090 15.6% $27,099<br />
Production 21,580 12.4% $28,765<br />
Sales and Related 17,120 9.8% $27,743<br />
Food Preparation and Serving Related 16,870 9.7% $16,748<br />
Transportation and Material Moving 14,670 8.4% $26,349<br />
Education, Training, and Library 11,010 6.3% $39,300<br />
Healthcare Practitioners and Technical 8,580 4.9% $49,793<br />
Con<strong>st</strong>ruction and Extraction 7,480 4.3% $39,111<br />
In<strong>st</strong>allation, Maintenance, and Repair 6,700 3.9% $34,441<br />
Management 6,070 3.5% $74,714<br />
Healthcare Support 5,830 3.4% $23,325<br />
Business and Financial Operations 5,560 3.2% $48,430<br />
Building and Grounds Cleaning and Maintenance 5,380 3.1% $22,256<br />
Personal Care and Service 4,570 2.6% $19,567<br />
Protective Service 3,260 1.9% $33,184<br />
Architecture and Engineering 2,960 1.7% $55,024<br />
Community and Social Services 2,800 1.6% $38,992<br />
Computer and Mathematical 2,060 1.2% $54,277<br />
Arts, Design, Entertainment, Sports, and Media 1,930 1.1% $33,885<br />
Life, Physical, and Social Science 1,410 0.8% $49,461<br />
Legal 670 0.4% $63,731<br />
Farming, Fishing, and Fore<strong>st</strong>ry 270 0.2% $24,922<br />
Total 173,880 100.0% $32,266<br />
We<strong>st</strong> Central WDA includes Barron, Chippewa, Clark, Dunn, Eau Claire, Pepin, Pierce, Polk and St. Croix Counties.<br />
source: Wisconsin Department <strong>of</strong> Workforce Development-Office <strong>of</strong> Economic Advisors<br />
St. Croix County Conditions and Trends Report 221
Table 6.6 provides additional insight into the occupations <strong>of</strong> our area, but this<br />
information is available at a regional scale. Even so, these numbers are similar to<br />
the 2000 U.S. Census Bureau occupation <strong>st</strong>ati<strong>st</strong>ics for St. Croix County.<br />
The large percentage <strong>of</strong><br />
residents in management<br />
and pr<strong>of</strong>essional<br />
occupations reflects the<br />
County’s proximity to the<br />
Twin Cities. In fact, 39.8<br />
percent <strong>of</strong> employed<br />
residents in the Twin<br />
Cities MSA worked in a<br />
management,<br />
pr<strong>of</strong>essional, or related<br />
job.<br />
Figure 6.9 – We<strong>st</strong> Central Wisconsin<br />
Workforce Development Area<br />
In the We<strong>st</strong> Central<br />
Wisconsin Workforce<br />
Development Area (see<br />
Figure 6.9) which<br />
includes St. Croix<br />
County, <strong>of</strong>fice and<br />
admini<strong>st</strong>rative support<br />
and production are the<br />
mo<strong>st</strong> frequent occupations, though they are below the average annual salary for<br />
the region.<br />
source: Wisconsin Department <strong>of</strong> Workforce Development-Office <strong>of</strong> Economic Advisors<br />
Employment Projections<br />
In November 2003, the Wisconsin Department <strong>of</strong> Workforce Development<br />
(WDWD) released a publication entitled Wisconsin Projections, 2000-2010. This<br />
publication makes economic projections for the State regarding the labor force,<br />
indu<strong>st</strong>ries, and occupations. This information was further supplemented by tenyear<br />
projections (2004-2014) by regional workforce development area (WDA).<br />
This sub-section relies, in large part, on these WDWD documents.<br />
Municipal units within St. Croix County have employment patterns that are<br />
similar to the State. It is anticipated that for the near future, Wisconsin’s total<br />
population will grow more slowly while average age will increase more rapidly<br />
than the nation as a whole, leading to lower participation rates in the workforce.<br />
Wisconsin is also having difficulty attracting international immigrants and<br />
dome<strong>st</strong>ic migrants and retaining its own citizens. Wisconsin will continue to face<br />
the challenge <strong>of</strong> filling job openings.<br />
As shown in Table 6.7, the region’s WDA indu<strong>st</strong>ries that are projected to add the<br />
mo<strong>st</strong> jobs from 2004-2014 are education and health services. Ambulatory health<br />
222 Economic Development Information
case services jobs alone will grow 36.6 percent, reflecting, in part, our region’s<br />
aging demographic. The number <strong>of</strong> total jobs in the manufacturing indu<strong>st</strong>ry is<br />
e<strong>st</strong>imated to remain fairly unchanged during this timeframe. These projections<br />
account for anticipated changes in Wisconsin’s economy within the timeframe,<br />
though unanticipated events may impact accuracy.<br />
TABLE 6.7<br />
We<strong>st</strong> Central Wisconsin WDA Region Indu<strong>st</strong>ry Projections (2004-2014)<br />
Indu<strong>st</strong>ry Title<br />
2004<br />
E<strong>st</strong>imated<br />
Employment<br />
2014<br />
Projected<br />
Employment<br />
2004-2014<br />
Employment<br />
Change<br />
2004-2014<br />
Percentage<br />
Change<br />
Total Non-Farm Employment 173,880 194,330 20,450 11.8%<br />
Con<strong>st</strong>ruction/Mining/Natural<br />
Resources<br />
8,380 9,880 1,500 17.9%<br />
Manufacturing 31,990 32,030 40 0.1%<br />
Paper Manufacturing 1,720 1,720 0 0.0%<br />
Pla<strong>st</strong>ics and Rubber Products<br />
Manufacturing<br />
Computer and Electronic<br />
Product Manufacturing<br />
3,400 3,670 270 7.9%<br />
3,220 3,020 -200 -6.2%<br />
Trade 28,800 30,900 2,100 7.3%<br />
Food and Beverage Stores 5,040 5,250 210 4.2%<br />
Transportation and Utilities<br />
(Including US Po<strong>st</strong>al)<br />
8,270 9,520 1,250 15.1%<br />
Financial Activities 7,010 7,710 700 10.0%<br />
Education and Health Services<br />
(Including gov’t)<br />
Ambulatory Health Care<br />
37,330 45,540 8,210 22.0%<br />
5,540 7,570 2,030 36.6%<br />
Hospitals (Including gov’t) 7,050 8,640 1,590 22.6%<br />
Leisure and Hospitality 17,300 19,930 2,630 15.2%<br />
Information/Pr<strong>of</strong> Services/Other<br />
Services<br />
Government (Excluding US<br />
Po<strong>st</strong>al, State and Local Educ and<br />
Hospitals)<br />
21,470 24,920 3,450 16.1%<br />
13,310 13,930 620 4.7%<br />
We<strong>st</strong> Central WDA includes Barron, Chippewa, Clark, Dunn, Eau Claire, Pepin, Pierce, Polk and St. Croix Counties.<br />
source: Wisconsin Dept. <strong>of</strong> Workforce Development, Bureau <strong>of</strong> Workforce Information, 2006<br />
St. Croix County Conditions and Trends Report 223
Table 6.8 provides the e<strong>st</strong>imated employment by occupation in 2004 and<br />
projected employment occupation for 2014 in the we<strong>st</strong> central WDA. Overall,<br />
total employment is expected to increase by 11.8 percent in the region from 2004<br />
to 2014, with 2,050 new jobs created annually and 4,300 job replacements<br />
annually. The large<strong>st</strong> increase in the total number <strong>of</strong> jobs is expected in the food<br />
preparation- and serving-related occupations. Large employment growth (both<br />
total and percentage) is also expected in the health care practitioners and related<br />
technical occupations. Notably, these two occupation groups have very different<br />
salary and wage e<strong>st</strong>imates.<br />
Table 6.8 – We<strong>st</strong> Central Wisconsin WDA Region Occupation Projections and E<strong>st</strong>imated Wages<br />
(2004-2014)<br />
E<strong>st</strong>imated Employment (<br />
E<strong>st</strong>imated Average<br />
Annual Openings<br />
Average<br />
Annual<br />
Salary<br />
We<strong>st</strong> Central WDA includes Barron, Chippewa, Clark, Dunn, Eau Claire, Pepin, Pierce, Polk and St. Croix Counties.<br />
source: Wisconsin Dept. <strong>of</strong> Workforce Development – Office <strong>of</strong> Economic Advisors<br />
E<strong>st</strong>imated Salary and Wages<br />
(2005)<br />
Entry<br />
Level<br />
Hourly<br />
Wage<br />
Table 6.9 presents 2014 employment and wage projections for the top 10<br />
occupations within the we<strong>st</strong> central WDA. This represents occupation<br />
opportunities in our region that are available to the residents <strong>of</strong> St. Croix County,<br />
though not all <strong>of</strong> these jobs may grow at a similar rate within the County. St.<br />
Croix residents also benefit from job opportunities in the Minneapolis/St. Paul<br />
area. The greate<strong>st</strong> demand for workers in the region are the occupations on the<br />
“Mo<strong>st</strong> Openings” li<strong>st</strong>. This li<strong>st</strong> includes many occupations considered as fir<strong>st</strong>time<br />
or temporary jobs that workers <strong>of</strong>ten leave as other opportunities open up;<br />
turnover is high and wages are low. There are a few exceptions on the li<strong>st</strong>:<br />
regi<strong>st</strong>ered nurses and truck drivers. Both require a greater degree <strong>of</strong> education or<br />
training, and the wage scales also reflect this.<br />
224 Economic Development Information<br />
Experienced<br />
Hourly<br />
Wage<br />
% New Replace-<br />
Occupational Title<br />
2004 2014 Change Change Jobs ments Total<br />
Management 6,070 6,860 790 13.0% 80 110 190 $74,714 $18.55 $44.61<br />
Business and Financial Operations 5,560 6,530 970 17.4% 100 100 200 $48,430 $13.84 $28.01<br />
Computer and Mathematical 2,060 2,570 510 24.8% 50 30 80 $54,277 $16.17 $31.06<br />
Architecture and Engineering 2,960 3,230 270 9.1% 30 70 100 $55,024 $16.79 $31.29<br />
Life, Physical, and Social Science 1,410 1,640 230 16.3% 20 30 50 $49,461 $14.58 $28.38<br />
Community and Social Services 2,800 3,300 500 17.9% 50 50 100 $38,992 $12.79 $21.73<br />
Legal 670 780 110 16.4% 10 10 20 $63,731 $13.59 $39.17<br />
Education, Training, and Library 11,010 12,740 1,730 15.7% 170 240 410 $39,300 $10.82 $22.93<br />
Arts, Design, Entertainment, Sports, and Media 1,930 2,190 260 13.5% 30 40 70 $33,885 $8.74 $20.06<br />
Healthcare Practitioners and Technical 8,580 10,920 2,340 27.3% 230 160 390 $49,793 $11.44 $30.19<br />
Healthcare Support 5,830 7,510 1,680 28.8% 170 90 260 $23,325 $8.91 $12.37<br />
Protective Service 3,260 3,480 220 6.7% 20 100 120 $33,184 $9.02 $19.42<br />
Food Preparation and Serving Related 16,870 19,260 2,390 14.2% 240 670 910 $16,748 $5.91 $9.12<br />
Building and Grounds Cleaning and Maintenance 5,380 6,290 910 16.9% 90 110 200 $22,256 $7.26 $12.42<br />
Personal Care and Service 4,570 5,640 1,070 23.4% 110 110 220 $19,567 $6.80 $10.71<br />
Sales and Related 17,120 18,320 1,200 7.0% 120 610 730 $27,743 $6.74 $16.64<br />
Office and Admini<strong>st</strong>rative Support 27,090 28,170 1,080 4.0% 110 640 750 $27,099 $8.57 $15.26<br />
Farming, Fishing, and Fore<strong>st</strong>ry 270 300 30 11.1%
TABLE 6.9 - We<strong>st</strong> Central Wisconsin WDA Region Occupation Projections (2014)<br />
Fa<strong>st</strong>e<strong>st</strong> Growth<br />
Mo<strong>st</strong> Openings<br />
Top 10 Occupations<br />
Typically Required<br />
Education/Training<br />
We<strong>st</strong> Central WDA includes Barron, Chippewa, Clark, Dunn, Eau Claire, Pepin, Pierce, Polk and St. Croix Counties.<br />
source: Wisconsin Dept. <strong>of</strong> Workforce Development, Bureau <strong>of</strong> Workforce Information, 2006<br />
Average<br />
Wage<br />
Home Health Aides 1-month on-the-job training $9.29<br />
Medical Assi<strong>st</strong>ants 1-12 mo. on-the-job training $12.63<br />
Network and Data Analy<strong>st</strong>s Bachelor’s degree $22.19<br />
Computer S<strong>of</strong>tware Engineers,<br />
Applications<br />
Bachelor’s degree $37.08<br />
Personal and Home Care Aides 1-month on-the-job training $8.82<br />
Dental Assi<strong>st</strong>ants 1-12 mo. on-the-job training $12.50<br />
Dental Hygieni<strong>st</strong>s Associate degree $23.34<br />
Employment, Recruitment &<br />
Placement<br />
Bachelor’s degree $19.67<br />
Medical Records & Health Information Associate degree $12.71<br />
Occupational Therapi<strong>st</strong>s Ma<strong>st</strong>er’s degree $25.53<br />
Cashiers 1-month on-the-job training $7.64<br />
Retail Salespersons 1-month on-the-job training $11.06<br />
Comb Food Prep/Serv Wrk/Incl Fa<strong>st</strong> 1-month on-the-job training $7.04<br />
Waiters/Waitresses 1-month on-the-job training $7.34<br />
Regi<strong>st</strong>ered Nurses Associate’s or Bachelor’s<br />
degree<br />
Laborers/Freight/Stock/Material<br />
Movers/Handlers<br />
Janitors/Cleaners, except<br />
Maids/Housekeeping<br />
$25.83<br />
1-month on-the-job training $10.09<br />
1-month on-the-job training $10.67<br />
Team Assemblers 1-12 mo. on-the-job training $12.94<br />
Stock Clerks/Order Fillers 1-month on-the-job training $9.47<br />
Bartenders 1-month on-the-job training $8.16<br />
St. Croix County Conditions and Trends Report 225
Tourism<br />
The “Fa<strong>st</strong>e<strong>st</strong> Growth” occupations are <strong>of</strong>ten referred to as “hot jobs,” with more<br />
training requirements and better wages. There are <strong>of</strong>ten fewer openings in these<br />
jobs since the li<strong>st</strong> is based on the greate<strong>st</strong> percent change in employment; for<br />
example, an occupation that increases from 5 to 10 jobs increased 100 percent<br />
whereas an occupation that increases from 2,000 to 2,200 jobs increased only 10<br />
percent. A 2005 UW-Extension <strong>st</strong>udy <strong>st</strong>ates that the large<strong>st</strong> demand in the region<br />
continues to be for assemblers, processors, and laborers. 11<br />
St. Croix County <strong>of</strong>fers a wide variety <strong>of</strong> natural, hi<strong>st</strong>orical, and entertainment amenities<br />
and attractions. Tourism and outdoor recreation in the County <strong>of</strong>ten revolve around the<br />
County’s many lakes and water features.<br />
The County has over 7,600 acres <strong>of</strong> fishing lakes and nearly 81 miles <strong>of</strong> trout <strong>st</strong>reams.<br />
Lake St. Croix is large enough to accommodate sailing, while the St. Croix River, a<br />
National Scenic and Wild River, is very popular for canoeing, fishing, and picnicking<br />
along. And at lea<strong>st</strong> four different companies or campgrounds <strong>of</strong>fer tubing on the Apple<br />
River which has become a well known de<strong>st</strong>ination in the region, with large concerts held<br />
each summer at the Float-Rite Amphitheatre in Somerset.<br />
Numerous federal, <strong>st</strong>ate, <strong>county</strong> and municipal parks, trail sy<strong>st</strong>ems, wildlife areas,<br />
campgrounds/resorts, and public hunting grounds <strong>of</strong>fer a variety <strong>of</strong> places to play, picnic,<br />
hike, lodge, and enjoy the outdoors. There are over 18 golf courses within 25 miles <strong>of</strong><br />
the Village <strong>of</strong> Hammond, including the award winning Troy Burne Golf Club. And with<br />
over 200 miles <strong>of</strong> snowmobile trails and cross-country ski trails, St. Croix County is a<br />
year-round de<strong>st</strong>ination. Many <strong>of</strong> these outdoor recreational assets are inventoried in the<br />
community facilities and natural resources sections <strong>of</strong> this <strong>report</strong>.<br />
These natural resources and open spaces attract both visitors and new residents. But<br />
given the County’s close proximity to the Twin Cities, the County has a relatively low<br />
number <strong>of</strong> seasonal and recreational housing units. Only 1.2% <strong>of</strong> the County’s total<br />
housing supply are seasonal or recreational units (61 <strong>st</strong> in the State), with owners choosing<br />
to occupy their homes year-round and commuting to work. In short, St. Croix County<br />
does not have the seasonal resort de<strong>st</strong>inations <strong>of</strong> many counties in the region.<br />
Travelers also can experience the area’s hi<strong>st</strong>ory through museums and hi<strong>st</strong>orical sites,<br />
such as the Octagon House in Hudson or the New Richmond Heritage Center. Visitors<br />
explore the County’s many antique <strong>st</strong>ores and specialty shops, or attend a performance at<br />
the Phipps Center for the Arts. Residents and visitors alike can also enjoy local, fresh<br />
foods at a variety <strong>of</strong> different orchards, vege<strong>table</strong> growers, and numerous specialty farms<br />
and outlets, such as the Silver Bison Ranch near Baldwin.<br />
11 Ibid.<br />
226 Economic Development Information
The Economic Impact <strong>of</strong> Expenditures by Travelers on Wisconsin 2007, compiled by<br />
Davidson-Peterson & Associates, provides insight into the positive economic impacts <strong>of</strong><br />
tourism on the St. Croix County economy. As shown in Figure 6.10, traveler<br />
expenditures in St. Croix County increased by 71.7 percent in the ten years between 1998<br />
and 2007, with large increases between 1998 to 2000.<br />
Figure 6.10 Traveler Expenditures in St. Croix County (1998 to 2007)<br />
$110,000,000<br />
$105,000,000<br />
$100,000,000<br />
$95,000,000<br />
$90,000,000<br />
$85,000,000<br />
$80,000,000<br />
$75,000,000<br />
$70,000,000<br />
$65,000,000<br />
$62,553,567<br />
$78,442,530<br />
$87,776,428 $88,637,687<br />
source: Davidson-Peterson & Associates. Economic Impact <strong>of</strong> Expenditures by Travelers on Wisconsin 2007.<br />
In 2007, travelers spent an e<strong>st</strong>imated $107.4 million in St. Croix County, ranking the<br />
County 34 th in the State for traveler spending. This was a $44.8-million increase from the<br />
amount spent ten years earlier. The <strong>st</strong>udy goes on to e<strong>st</strong>imate that employees in St. Croix<br />
County earned $29.5 million in wages generated from traveler spending, supporting an<br />
e<strong>st</strong>imated 1,339 full-time equivalent jobs. This is significant since the wages earned per<br />
full time equivalent job is higher than State and mo<strong>st</strong> other County averages.<br />
Additionally, an e<strong>st</strong>imated $1.9<br />
million in local revenues (e.g., sales<br />
taxes, property taxes) were collected<br />
in 2007 as a result <strong>of</strong> travelers in St.<br />
Croix County.<br />
As Figure 6.11 shows, travelers are<br />
an important year-round contributor<br />
to the St. Croix County economy<br />
with 17 percent <strong>of</strong> traveler<br />
expenditures made during the winter,<br />
18 percent during the spring, 44<br />
percent during the summer, and 21<br />
percent in the fall in 2007. However,<br />
$94,695,773<br />
$97,548,308<br />
$99,283,900<br />
$98,001,256<br />
$101,897,812<br />
$107,432,881<br />
$60,000,000<br />
1998 1999 2000 2001 2002 2003 2004 2005 2006 2007<br />
Figure 6.11 Seasonality <strong>of</strong> Traveler Expenditures<br />
in St. Croix County (2007)<br />
44%<br />
21%<br />
18%<br />
Winter Spring Summer Fall<br />
source: Davidson-Peterson & Associates. Economic Impact <strong>of</strong><br />
Expenditures by Travelers on Wisconsin 2007.<br />
17%<br />
St. Croix County Conditions and Trends Report 227
given that St. Croix County is located on one <strong>of</strong> the busie<strong>st</strong> Inter<strong>st</strong>ate highways, we<br />
cannot necessarily equate traveler expenditures with tourism expenditures. For many <strong>of</strong><br />
these travelers, St. Croix County may not have been a significant de<strong>st</strong>ination.<br />
In summary, tourism and travelers are a significant part <strong>of</strong> the St. Croix County economy.<br />
While the County is not as popular <strong>of</strong> a resort de<strong>st</strong>ination like many other counties in the<br />
region, it does have many assets which are attractive to visitors and residents alike.<br />
Currently, St. Croix County does not have a <strong>county</strong>-wide tourism council or bureau.<br />
Tourism in St. Croix County is largely promoted by individual community chambers,<br />
such as the Hudson Area Chamber <strong>of</strong> Commerce & Tourism Bureau, and the State <strong>of</strong><br />
Wisconsin Department <strong>of</strong> Tourism.<br />
Environmentally Contaminated Sites<br />
The State Comprehensive Planning Law (§66.1001) <strong>st</strong>ates that the economic<br />
development element “shall also evaluate and promote the use <strong>of</strong> environmentally<br />
contaminated sites for commercial or indu<strong>st</strong>rial uses.”<br />
St. Croix County has five properties actively receiving long-term remedial action<br />
financed under the federal Superfund program:<br />
Rose Metal, Inc. (Baldwin)<br />
Junkers Landfill (Hudson)<br />
Seversen Salvage (T. <strong>of</strong> Cady)<br />
New Richmond Landfill (New Richmond/T. <strong>of</strong> Star Prairie)<br />
In addition, there are eleven archived Superfund sites in the County for which no further<br />
Federal assessment or activities are planned. Not all <strong>of</strong> these active or archived sites are<br />
available for commercial or indu<strong>st</strong>rial use.<br />
However, numerous smaller leaking underground <strong>st</strong>orage tank, environmental repair, and<br />
spill sites are located throughout the County. The Wisconsin Bureau for Remediation<br />
and Redevelopment Tracking Sy<strong>st</strong>em (BRRTS) provides an inventory <strong>of</strong> the<br />
contaminated properties and other activities related to the inve<strong>st</strong>igation and cleanup <strong>of</strong><br />
contaminated soil or groundwater in Wisconsin.<br />
Table 6.10 at the end <strong>of</strong> this section is a li<strong>st</strong> <strong>of</strong> the 245 sites in St. Croix County where<br />
contamination has occurred requiring significant attention, 12 including closed sites where<br />
clean-up has been completed. Of these, 78.4 percent (or 259) are associated with leaking<br />
underground <strong>st</strong>orage tanks (LUSTs). Twenty-one percent (or 52) are environmental<br />
repair (ERP) sites which have contaminated soil or groundwater requiring long-term<br />
attention from non-LUST activities, such as indu<strong>st</strong>rial spills, dumping, buried containers,<br />
and landfills. As could be expected, the large<strong>st</strong> concentration <strong>of</strong> these sites (52) was<br />
located within the City <strong>of</strong> Hudson.<br />
12 Table 6.10 excludes abandoned containers and spills for which no discharge to the environment has been<br />
identified or were cleaned up quickly.<br />
228 Economic Development Information
Many, if not mo<strong>st</strong>, <strong>of</strong> the sites identified in Table 6.10 may currently be in active use and<br />
may not be available for redevelopment activities. Further, communities will need to<br />
consider the appropriateness and land use compatibility <strong>of</strong> the redevelopment <strong>of</strong> such<br />
sites for commercial or indu<strong>st</strong>rial use.<br />
Redevelopment opportunities are not limited to contaminated sites, however. Local<br />
comprehensive planning efforts may need to identify those deteriorating <strong>st</strong>ructures and<br />
under-utilized properties within their communities which have potential for re-use.<br />
Summary<br />
The data presented in this <strong>report</strong> should be kept in mind as communities develop their<br />
economic development <strong>st</strong>rategies. This information can highlight certain weaknesses to<br />
be mitigated, as well as exi<strong>st</strong>ing and potential opportunities to encourage economic<br />
growth and diversification.<br />
For convenience, here are some <strong>of</strong> the highlights <strong>of</strong> the economic development section:<br />
� The St. Croix County economy is impacted by regional, State, national, and<br />
international decisions and fluctuations. At the State level, growth has slowed,<br />
while the price <strong>of</strong> gas and commodities has inflated. Home purchases and new<br />
home con<strong>st</strong>ruction in Wisconsin have also decreased in recent years, though<br />
foreclosure rates have been below national averages.<br />
� St. Croix County has <strong>st</strong>rong economic ties to the Twin Cities metropolitan area<br />
with 43.8% <strong>of</strong> the County’s resident labor force working outside the State.<br />
� Since 2000, St. Croix County has been the fa<strong>st</strong>e<strong>st</strong> growing <strong>county</strong> in the State and<br />
a Top-100 fa<strong>st</strong>e<strong>st</strong> growing <strong>county</strong> in the nation. Growth has especially been<br />
<strong>st</strong>rong in the we<strong>st</strong>ern half <strong>of</strong> the County and those communities along Inter<strong>st</strong>ate<br />
94.<br />
� Though the County’s population is the sixth younge<strong>st</strong> in the State, providing<br />
services to its aging population is a labor force concern for the future.<br />
� There is increasing demand for skilled workers in the region. Po<strong>st</strong>-secondary<br />
educational attainment <strong>of</strong> County residents is significantly above the State<br />
average but lower than Twin Cities MSA levels, with 91.6% <strong>of</strong> residents<br />
completing high school or having some type <strong>of</strong> po<strong>st</strong>-secondary education.<br />
� Average per capita personal income remains above the overall State average and<br />
above the average median housing income <strong>of</strong> the Twin Cities MSA, though<br />
annual wages for jobs in St. Croix County are below the State average.<br />
� St. Croix County’s unemployment has mo<strong>st</strong> <strong>of</strong>ten been below the State average<br />
during the pa<strong>st</strong> twenty years, with more seasonal fluctuations, but has been about<br />
1% higher than unemployment rates in the Twin Cities MSA over the pa<strong>st</strong> five<br />
years.<br />
St. Croix County Conditions and Trends Report 229
� Only 18.7% <strong>of</strong> the County’s resident labor force works within the community in<br />
which they live. With 43.8% <strong>of</strong> the resident labor force working outside the<br />
State, average travel times to work have been increasing.<br />
� 33.6% <strong>of</strong> the potential labor force is employed in management, pr<strong>of</strong>essional, and<br />
related occupations; 24.4% are in sales and <strong>of</strong>fice occupations; and 18.4% are in<br />
production, transportation, and material moving occupations. Management and<br />
pr<strong>of</strong>essional occupations con<strong>st</strong>itute 39.8% <strong>of</strong> the Twin Cities MSA workforce.<br />
� In 2006, 21% <strong>of</strong> employment in the County was in the manufacturing indu<strong>st</strong>ry,<br />
followed closely by trade, transportation, and utilities also with 21% (<strong>of</strong> which<br />
retail trade con<strong>st</strong>itutes the large<strong>st</strong> portion). In the larger Twin Cities MSA, the<br />
education and health indu<strong>st</strong>ry employed the mo<strong>st</strong> workers (20.6%), while<br />
manufacturing only con<strong>st</strong>ituted 14.5% <strong>of</strong> the MSA’s total employment.<br />
� Health and education services provided 17% <strong>of</strong> the County employment in 2006,<br />
with 9 <strong>of</strong> the County’s top 25 employers in these indu<strong>st</strong>ries, not including County<br />
health services or the YMCA.<br />
� Between 1998 and 2006, the number <strong>of</strong> real e<strong>st</strong>ate and con<strong>st</strong>ruction firms grew by<br />
94.3% and 63.8%, respectively, reflecting the fa<strong>st</strong> growth <strong>of</strong> the County.<br />
� Farm acreage and farm size in the St. Croix County continue to decrease. In<br />
2002, the County was 26 th in the State in the total value <strong>of</strong> agricultural products<br />
sold.<br />
� The education and health services indu<strong>st</strong>ry is expected to have the large<strong>st</strong> increase<br />
in jobs (+22%) from 2004 to 2014 in our region.<br />
� The overall number <strong>of</strong> manufacturing jobs in the region is expected to remain<br />
fairly unchanged between 2004 to 2014.<br />
� The food services and the health care practitioners/technicians occupations are<br />
expected to have the greate<strong>st</strong> total number <strong>of</strong> job increases in the region from<br />
2004 to 2014.<br />
� Tourism in St. Croix County is <strong>st</strong>rongly connected to its many natural resources,<br />
proximity to the Twin Cities, and Inter<strong>st</strong>ate 94, ranking 34 th in the State for<br />
traveler spending.<br />
� The State BRRTS database includes 245 sites in St. Croix County which have had<br />
significant contamination, though many <strong>of</strong> these sites have been remediated and<br />
are now closed. Environmentally contaminated sites are sometimes left vacant<br />
and deteriorating following remediation and <strong>of</strong>fer opportunities for<br />
redevelopment. Communities may identify other redevelopment opportunities at<br />
locations which are not contaminated, but may be vacant or deteriorating.<br />
In response to economic <strong>conditions</strong> and goals, there are a variety <strong>of</strong> economic<br />
development tools that are available to municipalities, including tax incentives, creative<br />
financing and loan guarantees, and business incubator indu<strong>st</strong>rial parks. As shown in<br />
Addendum: Inventory <strong>of</strong> Programs, Plans, and Land Use Policies in We<strong>st</strong> Central<br />
Wisconsin, communities and economic development agencies have been very active in<br />
230 Economic Development Information
utilizing many <strong>of</strong> these tools and programs. This li<strong>st</strong> is not all-inclusive and communities<br />
may have additional community-specific <strong>report</strong>s and services.<br />
In numerous cases, these programs will prove more accessible as municipalities band<br />
together with other organizations and jurisdictions to collaborate and mutually pursue<br />
economic development efforts. Such collaboration will maximize a municipality’s ability<br />
to catalyze additional inve<strong>st</strong>ment and meet shared economic development goals.<br />
St. Croix County Conditions and Trends Report 231
Table 6.10 – Contaminated Sites in St. Croix County (open & closed)<br />
Municipality or<br />
Neare<strong>st</strong> Po<strong>st</strong> Office<br />
Location Activity Status<br />
BALDWIN FIRST NATIONAL-MAIN STREET AUTO Voluntary OPEN<br />
VAN SOMERAN TRUCKING LUST CLOSED<br />
ZILLMANN CHEVROLET OLDSMOBILE LUST CLOSED<br />
UNITED PARCEL SERVICE LUST CLOSED<br />
PRO PAINTING INC LUST CLOSED<br />
DAIRYLAND POWER SITE LUST CLOSED<br />
SHALOM VALLEY TIRE SERVICE LUST CLOSED<br />
BALDWIN CENEX LUST CLOSED<br />
BOLDTS PLUMBING & HEATING LUST CLOSED<br />
FIRST NATIONAL-MAIN STREET AUTO LUST CLOSED<br />
ANDERSON DISTRIBUTING LUST CLOSED<br />
RAYS SUPER STOP LUST CLOSED<br />
VANS SERVICE STATION LUST CLOSED<br />
STONE OIL CO LUST CLOSED<br />
FREEDOM VALU CENTER LUST CLOSED<br />
BALDWIN CHRISTIAN SCHOOL LUST CLOSED<br />
EGGENS IGA LUST CLOSED<br />
KWIK TRIP #747 LUST CLOSED<br />
FIRE HALL/OLD VILLAGE SHOP LUST CLOSED<br />
HOP PROPERTY LUST CLOSED<br />
BALDWIN CENEX LUST CLOSED<br />
1ST NATIONAL/SHAFFNER OIL LUST CLOSED<br />
FIRST NATIONAL-MAIN STREET AUTO LUST CLOSED<br />
RAYS SUPER STOP LUST CLOSED<br />
VALUE IMPLEMENT LUST CLOSED<br />
WI DOT RADIO TOWER-BALDWIN LUST CLOSED<br />
ST CROIX CNTY ELECTRICAL COOP LUST CLOSED<br />
ZILLMANN CHEVROLET OLDSMOBILE LUST CLOSED<br />
RASMUSSEN PROPERTY LUST OPEN<br />
PHOENIX METALS TECHNOLOGY ERP CLOSED<br />
BALDWIN CENEX ERP CLOSED<br />
FARMERS COOP PRODUCE ASSOCIATION-BALDWIN 9 ERP CLOSED<br />
CTS CORP CONNECTOR DIV ERP OPEN<br />
BALDWIN RESTAURANT SITE ERP OPEN<br />
CYLON ROTH RENTAL BATTERY WASTE SITE ERP CLOSED<br />
DEER PARK CELLOTTI PROPERTY LUST CLOSED<br />
ST CROIX CNTY HWY SHOP DEER PARK LUST CLOSED<br />
SHEPHERDS CROSSING LUST OPEN<br />
EAU GALLE TN KEN LEE PROPERTY (ROSEN METALS INC) ERP OPEN<br />
EMERALD CENEX - FOREST LUST CLOSED<br />
EMERALD SERVICE STATION FORMER LUST OPEN<br />
FORREST FORREST CROSSROADS INC LUST OPEN<br />
GLENWOOD CITY GLENWOOD CITY ELEMENTARY SCHOOL LUST CLOSED<br />
EVERTS FUNERAL HOME LUST CLOSED<br />
MARKS SERVICE STATION (FORMER) LUST CLOSED<br />
GLENWOOD CITY SCHOOL LUST CLOSED<br />
ST JOHNS SCHOOL & CATHOLIC CHURCH LUST CLOSED<br />
GORDONS SCRAP & SALVAGE LUST CLOSED<br />
PETERSON STANDARD SERVICE FORMER LUST CLOSED<br />
FARMERS COOP PROD ASSOC LUST CLOSED<br />
ST CROIX CNTY HWY GLENWOOD LUST CLOSED<br />
GTE LUST CLOSED<br />
SOO LINE RIGHT OF WAY LUST OPEN<br />
RASSBACH OIL LUST OPEN<br />
DRAXLER/GLENWOOD CITY ERP CLOSED<br />
GORDONS SCRAP & SALVAGE ERP CLOSED<br />
GOLDSTAR COOP ERP CLOSED<br />
HAMMOND ST CROIX CENTRAL SCHOOL DIST BUS LUST CLOSED<br />
DAVES AUTO SERVICE LUST CLOSED<br />
SPA BAR FORMER LUST CLOSED<br />
AUTO STOP HAMMOND LUST CLOSED<br />
ST CROIX CNTY HWY DEPT LUST CLOSED<br />
FUEL SERVICES INC BULK PLT LUST CLOSED<br />
DJ MART LUST CLOSED<br />
232 Economic Development Information
Table 6.10 – Contaminated Sites in St. Croix County (open & closed) continued<br />
Municipality or<br />
Neare<strong>st</strong> Po<strong>st</strong> Office<br />
Location Activity Status<br />
HAMMOND ST CROIX CNTY HWY DEPT LUST CLOSED<br />
ST CROIX CNTY HWY DEPT LUST CLOSED<br />
DONALD FERN LF ERP CLOSED<br />
U S E P A HAWKINS SITE - BATTERY WASTE ERP CLOSED<br />
FUEL SERVICES INC BULK PLT ERP CLOSED<br />
FARM SUPPLY COOP ERP CLOSED<br />
HUDSON FAIRWAY APARTMENTS LUST CLOSED<br />
EVERGREEN LAWN CARE LUST CLOSED<br />
HUDSON MOTORS LLC DBA RANDY ITEN CHEVROLET LUST CLOSED<br />
HANSENS TEXACO LUST CLOSED<br />
HUDSON COUNTRY CLUB LUST CLOSED<br />
SPLINTER RESIDENCE LUST CLOSED<br />
RICKS 36 AUTOMOTIVE SERVICE INC LUST CLOSED<br />
WI DNR WILLOW RIVER STATE PARK LUST CLOSED<br />
AUTO STOP LUST CLOSED<br />
AUTO STOP LUST CLOSED<br />
RIZZO RESIDENCE LUST CLOSED<br />
AUTO CARE SPECIALISTS LUST CLOSED<br />
JULIE M LESHER DDS PA LUST CLOSED<br />
WAGNER, ROBERT RESIDENCE LUST CLOSED<br />
WISEWAY MOTOR FREIGHT LUST CLOSED<br />
TRAVEL CENTERS OF AMERICA - HUDSON WI LUST CLOSED<br />
ERICKSON OIL LUST CLOSED<br />
MIKES STANDARD SERVICE LUST CLOSED<br />
JORGENSEN RESIDENCE LUST CLOSED<br />
HAUGEN RESIDENCE LUST CLOSED<br />
KORTUM PROPERTY LUST CLOSED<br />
LUND RESIDENCE LUST CLOSED<br />
JONES CHEMICAL LUST CLOSED<br />
AUTO STOP/SSG LUST CLOSED<br />
HUDSON CTY GARAGE LUST CLOSED<br />
ST CROIX CNTY HWY DEPT HUDSON LUST CLOSED<br />
ROSE LYNN LUST CLOSED<br />
2ND ST & COMMERCIAL ST SITE LUST CLOSED<br />
MADSEN-JOHNSON CORP LUST CLOSED<br />
ERICKSONS DIVERSIFIED CORP LUST CLOSED<br />
FREEDOM STATION - OLD LUST CLOSED<br />
TRUE TIRE LUST CLOSED<br />
WI DNR WILLOW RIVER STATE PARK LUST CLOSED<br />
ALWINS NORTHSIDE SERVICE LUST CLOSED<br />
LAIDLAW LUST CLOSED<br />
GAGNON CONST INC LUST CLOSED<br />
PIATZ PROPERTY LUST OPEN<br />
LUEPKE OIL BULK PLT ERP CLOSED<br />
LUEPKE OIL ERP CLOSED<br />
UNITED GEAR & ASSEMBLY INC ERP CLOSED<br />
ECKERT RENTAL PROPERTY ERP CLOSED<br />
WI DOT OEA 7200-04-00 SOLBERG ERP CLOSED<br />
LIEBSWAGER RESIDENCE ERP CLOSED<br />
DENNY HECKERS PONTIAC ERP CLOSED<br />
YOCUM OIL CO - HUDSON BULK PLT ERP CLOSED<br />
WISCONSIN BELL INC PK3206 ERP CLOSED<br />
JONES CHEMICALS INC ERP CONDITIONALLY CLOSED<br />
NOR-LAKE INC ERP OPEN<br />
HUDSON MIDDLE SCHOOL ERP OPEN<br />
CONSOLIDATED ENERGY COOP ERP OPEN<br />
2ND ST & COMMERCIAL ST SITE ERP OPEN<br />
HUDSON CTY LF ERP OPEN<br />
HUDSON TN JUNKERS SAN LF INC ERP OPEN<br />
St. Croix County Conditions and Trends Report 233
Table 6.10 – Contaminated Sites in St. Croix County (open & closed) continued<br />
Municipality or<br />
Neare<strong>st</strong> Po<strong>st</strong> Office<br />
Location Activity Status<br />
NEW RICHMOND ARNST RESIDENCE LUST CLOSED<br />
D & H INVESTMENTS LUST CLOSED<br />
UNION 76 LUST CLOSED<br />
NEW RICHMOND HIGH SCHOOL BUS GARAGE LUST CLOSED<br />
DOMAIN INC LUST CLOSED<br />
LAIDLAW TRANSIT INC LUST CLOSED<br />
DOBOY PACKAGING MACHINERY LUST CLOSED<br />
FORREST BROS PROPERTIES LUST CLOSED<br />
HOLTZ RESIDENCE LUST CLOSED<br />
CROSSROADS CAFE LUST CLOSED<br />
DOYLES FARM & HOME LUST CLOSED<br />
WOOD LAW OFFICE LUST CLOSED<br />
LAIDLAW TRANSIT INC LUST CLOSED<br />
HOLIDAY MOTEL LUST CLOSED<br />
UNION 76 LUST CLOSED<br />
CEMSTONE READY MIX INC LUST CLOSED<br />
ST CROIX HEALTH CENTER LUST CLOSED<br />
HAASCH, JOHN RESIDENCE LUST CLOSED<br />
WESTFIELDS HOSPITAL LUST CLOSED<br />
MARSONS SERVICE STATION LUST CLOSED<br />
KERR MCGEE REFINING CORP LUST CLOSED<br />
US POSTAL SERVICE NEW RICHMOND POST OFFICE LUST CLOSED<br />
J & R TIRE LUST CLOSED<br />
FARMERS UNION COOP LUST CLOSED<br />
CENEX #10 LUST CLOSED<br />
SUBWAY LUST CLOSED<br />
HOME OIL LUST CLOSED<br />
THOMAS TRUCKING LUST CLOSED<br />
PEABODY EQUIPMENT LUST CLOSED<br />
TRAILER MARKETING INC LUST CLOSED<br />
RICHMOND TN HALL LUST OPEN<br />
NEW RICHMOND FARMERS UNION COOP ERP CLOSED<br />
YOCUM OIL ERP CLOSED<br />
DOMAIN INC ERP CLOSED<br />
NORTHERN NATURAL GAS CO ERP CLOSED<br />
BLUE RIBBON FEED ERP OPEN<br />
SKOGLUND OIL CO ERP OPEN<br />
NEW RICHMOND FARMERS UNION ERP OPEN<br />
OSCEOLA ARNDT FARM LUST CLOSED<br />
RIVER FALLS DEISS SANITATION LUST CLOSED<br />
ARROW BLDG CENTER LUST CLOSED<br />
MJS CIRCLE C CONVENIENCE STORE LUST CLOSED<br />
MOODYS SERVICE STATION FORMER LUST CLOSED<br />
AUTO STOP 34 LUST CLOSED<br />
MELGARD MONUMENT CO LUST CLOSED<br />
TROY TN GARAGE LUST CLOSED<br />
WI DOT LEE RESIDENCE LUST CLOSED<br />
SUPERAMERICA LUST CLOSED<br />
CREEKS EDGE FARM LUST CLOSED<br />
TOM THUMB LUST CLOSED<br />
WI DOT SPIELHOUSE FLEA MART LUST CLOSED<br />
WI DOT DETTMAN TRUCKING LUST CLOSED<br />
WI DOT LYONS PROPERTY LUST CLOSED<br />
TOM THUMB LUST OPEN<br />
RUGO RENTAL WELL LUST OPEN<br />
KOLPAK REFRIGERATION INC ERP CLOSED<br />
UFE INC ERP OPEN<br />
NELSON FARM SUPPLY INC - RIVER FALLS ERP OPEN<br />
ROBERTS AUTO STOP LUST CLOSED<br />
STENEMAN CONCRETE PRODUCTS INC LUST CLOSED<br />
STENEMAN CONCRETE PRODUCTS INC LUST CLOSED<br />
234 Economic Development Information
Table 6.10 – Contaminated Sites in St. Croix County (open & closed) continued<br />
Municipality or<br />
Neare<strong>st</strong> Po<strong>st</strong> Office<br />
Location Activity Status<br />
ROBERTS STENEMAN CONCRETE PRODUCTS INC LUST CLOSED<br />
POLENS 76 LUST CLOSED<br />
RAPID SERVICE OIL LUST CLOSED<br />
CENEX LUST CLOSED<br />
ROBERTS ELEMENTARY SCHOOL LUST CLOSED<br />
GULICH TRUCKING INC LUST CLOSED<br />
BERMS & BLACKTOPS LUST OPEN<br />
NIKE MISSILE SITE ERP OPEN<br />
RAPID SERVICE OIL ERP OPEN<br />
WARREN TN ERP OPEN<br />
SOMERSET SOMERSET TN HALL LUST CLOSED<br />
ST ANNES CHURCH LUST CLOSED<br />
MILLER BROTHERS AUTO REPAIR INC LUST CLOSED<br />
RIVERS EDGE LUST CLOSED<br />
MEYER, DAVID RESIDENCE LUST CLOSED<br />
RENDEZVOUS BAR LUST CLOSED<br />
SOMERSET MIDDLE-HIGH SCHOOL LUST CLOSED<br />
ICKLER RESIDENCE LUST CLOSED<br />
SOMERSET INDUSTRIAL PARK LUST CLOSED<br />
SKOGLUNDS CONOCO LUST CLOSED<br />
TOM THUMB STORE #199 LUST CLOSED<br />
MARTELL, STEVE WELL DRILLING INC LUST CLOSED<br />
BROTT PROPERTY LUST CLOSED<br />
U S NATIONAL PARK SERVICE LUST CLOSED<br />
ST ANNES CHURCH LUST CLOSED<br />
B & J SERVICE LUST CLOSED<br />
BENS BAR LUST CLOSED<br />
US POSTAL SERVICE SOMERSET POST OFFICE LUST CLOSED<br />
APOLLO CORP LUST CLOSED<br />
MONTPETIT RESIDENCE LUST OPEN<br />
ARCHIES FORMERLY LUST OPEN<br />
SOMERSET AUTO SALVAGE ERP CLOSED<br />
SOMERSET TN HALL ERP CLOSED<br />
ST. JOSEPH TN B & J CO INC PROPERTY LUST CLOSED<br />
MILLER RESIDENCE LUST CLOSED<br />
ST CROIX CNTY HWY DEPT HOULTON LUST CLOSED<br />
HANKS, STEVE RESIDENCE LUST CLOSED<br />
OASIS MARKET LUST CLOSED<br />
SPRING VALLEY SEVERSON HAZARDOUS WASTE SITE ERP CLOSED<br />
STAR PRAIRIE JOHNSON, FERN PROPERTY LUST CLOSED<br />
RUSSELL SPORT & BIKE LUST CLOSED<br />
DAVES SERVICE CENTER LUST CLOSED<br />
JOHNSON, SYLVIA RESIDENCE ERP CLOSED<br />
NEW RICHMOND CTY LF ERP OPEN<br />
STAR PRAIRIE TN NEW RICHMOND CTY LF ERP OPEN<br />
WILSON FOREMOST FARMS USA COOP LUST CLOSED<br />
KOCH PROPERTY LUST CLOSED<br />
KWIK TRIP #603 LUST CLOSED<br />
CAPP, MARTIN RESIDENCE LUST CLOSED<br />
CADY WILSON ELEMENTARY SCHOOL LUST CLOSED<br />
FOREMOST FARMS USA COOP LUST CLOSED<br />
SOBOTA FARM LUST OPEN<br />
WILSON ELEVATOR ERP OPEN<br />
WOODVILLE DIRECT OIL WOODVILLE LUST CLOSED<br />
AABY MECHANICAL LUST CLOSED<br />
HEIM PROPERTY LUST CLOSED<br />
PRO MACHINE LUST CLOSED<br />
ELLIOTTS SERVICE STATION LUST CLOSED<br />
NORDIC MALL ASSN LUST OPEN<br />
COUNTRY ELEVATORS FERTILIZER PLT ERP CLOSED<br />
UNIDENTIFIED GALLMEIR SITE ERP CLOSED<br />
source: Wisconsin BRRTS database, April 21, 2008.<br />
St. Croix County Conditions and Trends Report 235
236 Economic Development Information
7. LAND USE INFORMATION<br />
Element Context<br />
Land use is a critical factor in managing the future growth <strong>of</strong> any community. Land use<br />
<strong>trends</strong> indicate what changes are occurring regarding type, location and intensity <strong>of</strong> uses<br />
over time. It is these land use changes that have to be managed in a manner that is<br />
beneficial to the residents and environment <strong>of</strong> each community.<br />
In this section is the basic land use data necessary to further explore the land use issues<br />
facing those communities participating in this planning effort and to begin the process <strong>of</strong><br />
developing individual community land use plans to meet the requirements <strong>of</strong> Wisconsin<br />
Comprehensive Planning Law (s. 66.1001 (2)(h), Stats.).<br />
Once developed, the resulting land use plans will act as a sound basis for the orderly<br />
development <strong>of</strong> their communities, and will assi<strong>st</strong> the communities in achieving their<br />
individual goals. Their plan, along with their selected implementation tools, will provide<br />
local governments with the ability to effectively and efficiently make public inve<strong>st</strong>ment<br />
decisions and to work with developers to ensure private inve<strong>st</strong>ments are compatible with<br />
the public intere<strong>st</strong>.<br />
Exi<strong>st</strong>ing Land Use and Land Use Trends<br />
The land use/land coverage acreage <strong>st</strong>ati<strong>st</strong>ics were taken from the mo<strong>st</strong> recent assessment<br />
data collected by the Wisconsin Department <strong>of</strong> Revenue. This is the only consi<strong>st</strong>ent data<br />
on land use/land cover acreage for all communities in St. Croix County, and allows for<br />
trend analysis. These classifications are: residential, commercial, indu<strong>st</strong>rial<br />
(manufacturing), agricultural, fore<strong>st</strong>, undeveloped lands (vacant) and other.<br />
The predominant land use in the rural areas <strong>of</strong> St. Croix County is agriculture as shown<br />
below in Table 7.1 (Source: Wisconsin Department <strong>of</strong> Revenue - based on assessment<br />
record). The 1987, 1997 and 2007 land uses based on <strong>report</strong>ed assessments for all<br />
communities in St. Croix County are presented in Tables 7.11, 7.12 and 7.13,<br />
respectively. The percent <strong>of</strong> acres in agriculture range from highs <strong>of</strong> 80.7 percent, 80.1<br />
percent, 79.0 percent, 76.5 percent and 76.1 percent in the Towns <strong>of</strong> Erin Prairie, Pleasant<br />
Valley, Stanton, Hammond and Rush River, respectively, to lows <strong>of</strong> 20.4 percent, 40.4<br />
percent, 41.3 percent, and 41.6 percent in the Towns <strong>of</strong> Hudson, Star Prairie, Somerset,<br />
and St. Joseph, respectively. Seventeen <strong>of</strong> St. Croix County’s twenty-one towns (81% <strong>of</strong><br />
all towns) have more than 50 percent <strong>of</strong> their assessed land assessed as agriculture.<br />
Eleven towns (52% <strong>of</strong> all towns) have at lea<strong>st</strong> two-thirds <strong>of</strong> their assessed land assessed<br />
as agriculture. It is clear that agriculture is a significant activity in St. Croix County.<br />
St. Croix County Conditions and Trends Report 237
Table 7.1 St. Croix County Land Use – 1997 and 2007<br />
Assessment Class 1997Acres Assessed 2007Acres Assessed ’97-’07% change<br />
Agricultural 320,494 257,677 -19.6%<br />
Fore<strong>st</strong> 48,319 50,915 5.4%<br />
Undeveloped 4,702 37,854 705.1%<br />
Residential 35,300 52,646 49.1%<br />
Commercial 3,529 5,059 43.3%<br />
Manufacturing 1,072 1,369 27.7%<br />
Other 3,569 3,227 -9.6%<br />
Total 416,995 408,747 --<br />
source: WiDOR<br />
Those towns that have lower agricultural acreage generally have at lea<strong>st</strong> one <strong>of</strong> the<br />
following factors present; higher non-farm acres, higher fore<strong>st</strong>ed acres, significant<br />
surface water acres, or other significant natural resource lands. As expected, large<br />
amounts <strong>of</strong> commercial and indu<strong>st</strong>rial land occurs in the village and cities. Incorporated<br />
communities also generally have a greater percentage and concentration <strong>of</strong> residential<br />
uses.<br />
The exi<strong>st</strong>ing land uses in St. Croix County are summarized and discussed in the<br />
remainder <strong>of</strong> this section.<br />
Agricultural Land Use<br />
The assessed agricultural acreage declined by almo<strong>st</strong> 100,000 acres (97,977) from 1987<br />
to 2007 in St. Croix County. See Table 7.9. The large<strong>st</strong> acreage decrease <strong>of</strong> 7,742 and<br />
7,626 acres occurred in the Towns <strong>of</strong> Star Prairie and Somerset, respectively. The large<strong>st</strong><br />
percentage decrease <strong>of</strong> 73.6% occurred in the Town <strong>of</strong> Hudson. Other sub<strong>st</strong>antial<br />
acreages losses occurred:<br />
Table 7.2—Leading Acreage Loss <strong>of</strong> Agricultural Land by Municipality, 1987-2007<br />
Town Town City/Village<br />
Hudson -7,038 Glenwood -5,384 Wilson -713<br />
Richmond -6,328 Warren -5,170 Glenwood City -578<br />
Eau Galle -6,206 Fore<strong>st</strong> -4,920 Star Prairie -249<br />
Springfield -5,704 Hammond -4,497 Somerset -244<br />
Troy -5,457 St. Joseph -4,224 Woodville -194<br />
source: WiDOR<br />
238 Land Use Information
There was a 27.6 percent reduction in agricultural land in St. Croix County from 1987 to<br />
2007. That is a loss <strong>of</strong> about 1.4 percent per year. The large<strong>st</strong> percent <strong>of</strong> agricultural land<br />
reductions between 1987 and 2007 were seen by the following communities:<br />
Table 7.3—Leading Percentage Loss <strong>of</strong> Agricultural Land by Municipality, 1987-2007<br />
Town City/Village<br />
Hudson -73.6% Somerset -89.4%<br />
Star Prairie -52.3% Wilson -76.3%<br />
Somerset -42.3% Glenwood City -64.7%<br />
St. Joseph -36.6% Woodville -59.0%<br />
Eau Galle -34.7% River Falls -46.2%<br />
Richmond -34.4% Deer Park -40.8%<br />
Troy -31.0% Star Prairie -33.4%<br />
source: WiDOR<br />
Despite these losses, agriculture remains the predominant use <strong>of</strong> the land in the towns <strong>of</strong><br />
St. Croix County. The Towns with the lea<strong>st</strong> percentage loss <strong>of</strong> assessed agricultural land<br />
from 1987 and 2007 are: Cady (-12.0%), Pleasant Valley (-15.4%), Erin Prairie (-15.8%),<br />
Emerald (-17.9%), Rush River (-19.4%) and Cylon (-19.7%); all losing an average <strong>of</strong> less<br />
than one percent per year.<br />
The 2007 assessed agricultural acreage in the County was 257,677 or about 56% <strong>of</strong> total<br />
land acreage. The greate<strong>st</strong> number <strong>of</strong> agricultural acres is broken down as follows:<br />
Table 7.4—Mo<strong>st</strong> Agricultural Acres by Municipality, 2007<br />
Town<br />
Erin Prairie 16,831<br />
Emerald 15,837<br />
Hammond 15,652<br />
Fore<strong>st</strong> 15,238<br />
Cady 14,408<br />
Baldwin 14,325<br />
Kinnickinnic 14,196<br />
Stanton 14,087<br />
source: WiDOR<br />
The Towns <strong>of</strong> Hudson, Star Prairie, St. Joseph, Rush River and Pleasant Valley all<br />
currently have less than 10,000 acres in agricultural use. Seventeen <strong>of</strong> St. Croix County’s<br />
twenty-one towns (81% <strong>of</strong> all towns) have more than 50 percent <strong>of</strong> their assessed land<br />
assessed as agriculture. Eleven towns (52% <strong>of</strong> all towns) have at lea<strong>st</strong> two-thirds <strong>of</strong> their<br />
assessed land assessed as agriculture.<br />
St. Croix County Conditions and Trends Report 239
Fore<strong>st</strong> Land Use<br />
In 2007, the combined assessed acres in fore<strong>st</strong>land amounted to 50,915 acres or eleven<br />
percent <strong>of</strong> the total County acreage. These lands included private and public fore<strong>st</strong>lands.<br />
See Table 7.10.<br />
Assessed fore<strong>st</strong> acreage in St. Croix County increased by 11,166 acres between 1987 and<br />
1997. However, the growth in fore<strong>st</strong>ed acreage slowed between 1997 and 2007 as<br />
assessed fore<strong>st</strong> acreage increased by only 1,871 acres. Much <strong>of</strong> the growth in fore<strong>st</strong>ed<br />
acreage can probably be attributed to agricultural land being enrolled in the federal<br />
Conservation Reserve Program as certain aspects <strong>of</strong> the program encourage tree planting.<br />
Between 1987 and 2007 the greate<strong>st</strong> percentage increases occurred in the Towns <strong>of</strong> Eau<br />
Galle (465 percent), Hammond (140 percent), Glenwood (135 percent), Warren (108<br />
percent), Baldwin (108 percent), and Fore<strong>st</strong> (105 percent). Between 1987 and 2007 the<br />
Towns <strong>of</strong> Hudson (-51 percent), Somerset (-32 percent), Troy (-25 percent), Cady (-16<br />
percent) and Cylon (-10 percent) saw the greate<strong>st</strong> percentage declines in fore<strong>st</strong>ed acreage.<br />
The Towns <strong>of</strong> Eau Galle (3,329), Fore<strong>st</strong> (2,565), Glenwood (1,861), Star Prairie (1,539),<br />
Emerald (1,528), Springfield (1,362) and Warren (1,073) had the greate<strong>st</strong> increase, and<br />
the Towns <strong>of</strong> Somerset (-1,687), Troy (-621), Cady (-603), and Cylon (-403), had the<br />
greate<strong>st</strong> decrease in fore<strong>st</strong>ed land acres from 1987 to 2007. In 2007, the Town <strong>of</strong> Fore<strong>st</strong><br />
had the greate<strong>st</strong> amount <strong>of</strong> fore<strong>st</strong>ed acreage (4,999 acres) followed by Eau Galle (4,045),<br />
Somerset (3,664), Cylon (3,542), Emerald (3,499), Springfield (3,258), Glenwood<br />
(3,420) and Star Prairie (3,200).<br />
Residential Land Use<br />
In 2007, the assessed residential acreage in the unincorporated areas <strong>of</strong> the County was<br />
50,100, or 95 percent <strong>of</strong> the total assessed residential acreage in the <strong>county</strong>. This is down<br />
from 98 percent in 1987. The assessed residential acreage increase in unincorporated<br />
areas from 1987 to 2007 was 28,411 acres or a 131 percent increase. That is a 6.6 percent<br />
annual increase. The Towns <strong>of</strong> Hudson, Somerset, St. Joseph and Troy had significant<br />
residential acreage (7,936, 7,328, 6,318 and 5,395, respectively) in 2007. Indeed, these<br />
towns that border Minnesota account for 51 percent <strong>of</strong> the assessed residential acreage in<br />
the <strong>county</strong>. The Towns <strong>of</strong> Star Prairie (4,183 acres), Richmond (3,233 acres),<br />
Kinnickinnic (2,722), Warren (2,437) and Hammond (2,034) also had significant<br />
residential acreage in 2007. From 1987 to 2007 the Town <strong>of</strong> Hudson (4,327) had the<br />
greate<strong>st</strong> absolute increase in assessed residential acres, followed by the Towns <strong>of</strong><br />
Somerset (4,180), St. Joseph (2,818), Richmond (2,526), Troy (2,517), and Star Prairie<br />
(2,475). See Table 7.6.<br />
Regarding assessed residential acreage percentage increases between 1987 and 2007, the<br />
Town <strong>of</strong> Emerald (410 percent) had the greate<strong>st</strong> increase, followed by the Towns <strong>of</strong><br />
Hammond (372 percent), Richmond (357 percent), and Pleasant Valley (316 percent).<br />
These communities have grown in residential acreage at an average rate <strong>of</strong> at lea<strong>st</strong> 15<br />
percent per year since 1987. Other towns that have at lea<strong>st</strong> tripled their residential<br />
240 Land Use Information
acreage between 1987 and 2007 are Glenwood (259 percent) and Springfield (204<br />
percent), and the Town <strong>of</strong> Kinnickinnic (199.8 percent) nearly has. Other towns that<br />
have at lea<strong>st</strong> doubled their residential acreage during the same period are Warren (167<br />
percent), Erin Prairie (163 percent), Star Prairie (145 percent), Fore<strong>st</strong> (138 percent), Rush<br />
River (137 percent), Somerset (133 percent), Hudson (120 percent) and Cylon (118<br />
percent), and the Town <strong>of</strong> Baldwin (94 percent) nearly has.<br />
The cities and villages in St. Croix County also saw dramatic growth in residential land.<br />
While the City <strong>of</strong> Glenwood City saw a twelvefold increase in assessed residential<br />
acreage between 1987 and 2007, the Village <strong>of</strong> Woodville (336 percent) more than<br />
quadrupled, and the Villages <strong>of</strong> Somerset (267 percent), Baldwin (264 percent), North<br />
Hudson (244 percent) and Wilson (200 percent) at lea<strong>st</strong> tripled theirs. The other cities and<br />
villages experienced mode<strong>st</strong> increases in residential land or had <strong>report</strong>ing discrepancies<br />
during the period. There were no<strong>table</strong> gains for many incorporated communities between<br />
1997 and 2007 that were <strong>report</strong>ed. See Table 7.6.<br />
Commercial Land Use<br />
Two-thirds <strong>of</strong> commercial lands are located in the County’s unincorporated communities.<br />
However, commercial land is <strong>of</strong>ten much more intensively developed and contain larger<br />
buildings in incorporated communities than the commercial land in the unincorporated<br />
areas. Current assessed commercial lands account about 1.2 percent <strong>of</strong> the total County<br />
assessed acreage. See Table 7.7.<br />
In 2007, the towns with the large<strong>st</strong> commercial acreage were Somerset (500), Troy (460),<br />
Hudson (442), Star Prairie (379), Richmond (350), St. Joseph (282), Hammond (253) and<br />
Warren (242). Collectively, they comprised about 76% <strong>of</strong> the commercial lands in the<br />
unincorporated areas <strong>of</strong> the County. Mo<strong>st</strong> <strong>of</strong> these towns see much <strong>of</strong> their commercial<br />
development within the fringe <strong>of</strong> their borders with incorporated communities. Between<br />
1987 and 2007, the Towns <strong>of</strong> Troy (363), Richmond (274), Star Prairie (255) and Warren<br />
(228), the Village <strong>of</strong> Somerset (149), and the City <strong>of</strong> Hudson, experienced significant<br />
increases in commercial acreage.<br />
There were very large percentage increases in assessed commercial acreage between<br />
1987 and 2007 in the Towns <strong>of</strong> Warren (14 acres in 1987 to 242 acres in 2007 for 1,629<br />
percent), Troy (374 percent), Richmond (361 percent), Star Prairie (206 percent) and<br />
Baldwin (203 percent), the Villages <strong>of</strong> Baldwin (20 acres in 1987 to 141 acres in 2007 for<br />
605 percent), Woodville (475 percent) and Somerset (287 percent), and the City <strong>of</strong><br />
Glenwood City (350 percent). Other communities that at lea<strong>st</strong> doubled the amount <strong>of</strong><br />
assessed commercial land were the Towns <strong>of</strong> Springfield (179 percent) and Cady (142<br />
percent), the Villages <strong>of</strong> North Hudson (188 percent), Hammond (178 percent from 1997<br />
and 2007), Star Prairie (175 percent), Roberts (151 percent), and the City <strong>of</strong> New<br />
Richmond (181 percent from 1997 and 2007), while the Town <strong>of</strong> Cylon (96 percent) and<br />
nearly did so. As seen above, many communities had significant growth in commercial<br />
land, while the Towns <strong>of</strong> Eau Galle, Pleasant Valley, Kinnickinnic, Rush River, Stanton,<br />
Hudson and Glenwood, and the Village <strong>of</strong> Deer Park had a decrease in commercial land.<br />
St. Croix County Conditions and Trends Report 241
The City <strong>of</strong> Hudson (847 acres) had the large<strong>st</strong> amount <strong>of</strong> assessed commercial land in<br />
2007.<br />
Indu<strong>st</strong>rial Land Use<br />
Assessed manufacturing acreage in the County’s unincorporated areas is significant only<br />
in few areas, <strong>of</strong>ten near incorporated communities or associated with food production.<br />
The majority (52 percent) <strong>of</strong> manufacturing land (assembly, fabrication, processing,<br />
production, etc.) is in the County’s incorporated areas. See Table 7.8.<br />
Manufacturing acreage increased by 106 acres overall between 1987 and 2007 in the<br />
County’s unincorporated areas; however, the Towns <strong>of</strong> Star Prairie, Hudson and Cylon<br />
gained 102, 49 and 26 acres <strong>of</strong> assessed manufacturing land, respectively, and the Towns<br />
<strong>of</strong> Emerald and Stanton acquired 45 and 40 acres by 2007, respectively, where they had<br />
none in 1987. The unincorporated communities with a significant decrease in indu<strong>st</strong>rial<br />
land were the Towns <strong>of</strong> Troy, Warren, Cady and Baldwin. Of the incorporated<br />
communities with complete <strong>report</strong>ing mo<strong>st</strong> gained assessed manufacturing land between<br />
1987 and 2007; except North Hudson which lo<strong>st</strong> 4 acres and others with no<br />
manufacturing land. Baldwin gained 92 acres, Hudson gained 62 acres, New Richmond<br />
and River Falls gained 55 acres, Woodville gained 42 acres, Somerset gained 33 acres,<br />
and Hammond gained 20 acres.<br />
Public Natural Resource Lands<br />
There are significant natural resource and park lands in St. Croix County owned by the<br />
U.S. Fish and Wildlife Service, the National Park Service, the Wisconsin Department <strong>of</strong><br />
Natural Resources, or St. Croix County. Table 7.5 shows the acres <strong>of</strong> these lands by<br />
town.<br />
Table 7.5—Public Natural Resource Lands, 2005<br />
Town Acres Town Acres<br />
Cylon 3,159 Springfield 666<br />
Somerset 2,348 Star Prairie 633<br />
Stanton 2,230 Kinnickinnic 420<br />
St. Joseph 1,667 Rush River 125<br />
Hudson 1,530 Pleasant Valley 120<br />
Warren 1,427 Baldwin 40<br />
Richmond 1,065 Glenwood 38<br />
Erin Prairie 828 Hammond 26<br />
source: WCWRPC<br />
242 Land Use Information
Land Demand and Prices<br />
Two indicators <strong>of</strong> a dynamic economy and potentially changing land use patterns are land<br />
sales and prices. These two indicators could mean a demand to convert land to more<br />
intensive uses such as residential, commercial or indu<strong>st</strong>rial. In turn, additional community<br />
services may be needed to support this change.<br />
An indicator <strong>of</strong> the demand for various land types is the number <strong>of</strong> land sales during the<br />
year for a given community or the <strong>county</strong>. Tables 7.14 and 7.15 show the sales <strong>of</strong><br />
agricultural lands and fore<strong>st</strong>ed lands respectively. These lands, converted to other uses,<br />
would include those for residential development. It can be seen that there is a <strong>st</strong>eady<br />
demand for these lands for their conversion to other uses. The price paid is also li<strong>st</strong>ed.<br />
Comparing the numbers in Table 7-15 reveals in 1998 there was a small premium (about<br />
16 percent) paid for fore<strong>st</strong>ed lands intended for other uses. However, in 2001 and 2005<br />
there was a significant difference in the price paid for fore<strong>st</strong>ed lands being converted to<br />
other uses than that paid for lands remaining in the original use. In 2001 and 2005, there<br />
were out<strong>st</strong>anding premiums paid <strong>of</strong> 232 and 272 percent, respectively. This recently<br />
changed somewhat as the price for fore<strong>st</strong> land is converted to other uses brought about a<br />
70 percent premium over that which remained in fore<strong>st</strong> use in 2007.<br />
The price paid for agricultural land that is converted to other uses is significantly higher<br />
than that for lands remaining in agriculture. The price paid for farmland to be converted<br />
to other uses peaked in 2005 ($12,712/acre), but has declined by 49 percent since<br />
($6,496/acre in 2007). Over the la<strong>st</strong> ten years, even with land use value assessment and<br />
an improving farm economy, agricultural land that was converted to other uses brought<br />
an average 145 percent premium over agricultural land that was sold and remained in<br />
agriculture. In 2007 that could be a difference <strong>of</strong> perhaps $684,000 for 200 acres <strong>of</strong><br />
farmland sold for conversion rather than remaining in agriculture. While the selling price<br />
for agricultural land without buildings <strong>st</strong>aying in agricultural use increased by 62 percent<br />
between 2000 and 2007; during the same period the selling price for agricultural land<br />
without buildings that was converted to other uses increased by 15 percent. These<br />
<strong>conditions</strong> reveal that while there is continuing market pressure for farmland conversion,<br />
it has eased considerably.<br />
Assessment information can help indicate land prices; however, this information has<br />
certain limitations due to assessment methods, timing and whether a particular assessor<br />
has completely e<strong>st</strong>ablished current fair-market value comparables for a given community.<br />
The State <strong>of</strong> Wisconsin attempts to equalize values so communities whose assessments<br />
are in different years will have assessments that are fair. Eventually all assessments are<br />
supposed to reflect fully equalized, fair-market value <strong>of</strong> property. Tables 7.16 and 7.17<br />
presents the price per acre <strong>of</strong> various land types based on assessment.<br />
Residential land value is generally highe<strong>st</strong> in those communities within the close<strong>st</strong><br />
commuting di<strong>st</strong>ance from the Minneapolis/St. Paul employment centers. The assessments<br />
for agricultural land are dramatically altered through <strong>st</strong>ate law that provides for land use<br />
value assessment. As can be seen comparing Table 7.14 with Table 7.16, the use value<br />
St. Croix County Conditions and Trends Report 243
assessment for agricultural land does not correspond to sale prices for agricultural land.<br />
Fore<strong>st</strong>ed land in areas more sui<strong>table</strong> for conversion to residential use will generally have<br />
higher value than lands better suited for fore<strong>st</strong> production.<br />
In general, land prices in St. Croix County have been increasing much fa<strong>st</strong>er than the rate<br />
<strong>of</strong> inflation. This is particularly true in the la<strong>st</strong> few years with annual inflation being quite<br />
low. Demand for land available for residential development in areas <strong>of</strong> recent residential<br />
development has been diminished, mo<strong>st</strong>ly likely due to high energy co<strong>st</strong>s. Waterfront<br />
property has increased dramatically in price in the 1990s and early 2000s. Demand for<br />
waterfront land continues to be high, as supply becomes lower, which drives the prices<br />
for these properties even higher. Fore<strong>st</strong>ed land is also increasing in price at a significant<br />
rate. Tracts <strong>of</strong> fore<strong>st</strong> land are <strong>of</strong>ten seen as life<strong>st</strong>yle natural resource amenities, many are<br />
near public natural resource holdings, and these tracts are being converted to residential<br />
use. This is contributing to fore<strong>st</strong> parcel fragmentation.<br />
Summary<br />
Land development, the demand for housing, the transportation sy<strong>st</strong>em, the natural<br />
environment, the extent <strong>of</strong> public services and facilities, land ownership patterns,<br />
economic activity and governmental boundaries and actions, all guide and shape the built<br />
environment and determine its impact on the natural environment. Combining these<br />
factors determines the pattern <strong>of</strong> development that occurs throughout the County. Hence,<br />
the Housing; Transportation; Agricultural, Natural and Cultural Resources, Utilities and<br />
Community Facilities; Economic Development; and, Intergovernmental Cooperation<br />
Elements also contain <strong>conditions</strong> and <strong>trends</strong> that affect land use.<br />
Land use planning is concerned with properly combining development factors to attain<br />
the optimal or desired use <strong>of</strong> land. In total, the land use element <strong>of</strong> each community will<br />
set the proposed pattern <strong>of</strong> the physical environment for the activities <strong>of</strong> people and<br />
organizations within that community. Land use planning depends on population and<br />
economic projections and an under<strong>st</strong>anding <strong>of</strong> the interrelationship <strong>of</strong> land use activities<br />
and types for living, livelihood<br />
and leisure. It is the interrelated<br />
nature <strong>of</strong> the components that<br />
comprise a community that make<br />
a comprehensive plan worthwhile.<br />
St. Croix County has experienced<br />
dramatic residential growth in<br />
we<strong>st</strong>ern areas <strong>of</strong> the County; those<br />
bordering Minnesota and in<br />
proximity to major highway<br />
corridors. This growth can have a<br />
dramatic impact on these<br />
communities. Often development<br />
244 Land Use Information
<strong>of</strong> good productive farm or fore<strong>st</strong> land impacts water resources, places greater demand on<br />
roads and schools, and causes conflicts between farm and non-farm uses and fore<strong>st</strong><br />
fragmentation. In the ten years from 1997 to 2007, assessed residential acreage increased<br />
by about 46 percent in unincorporated areas while these communities’ populations<br />
increased by 43 percent. Indeed, four unincorporated communities have at lea<strong>st</strong> doubled<br />
the amount <strong>of</strong> residential land in ju<strong>st</strong> 10 years, with another ten increasing by at lea<strong>st</strong> a<br />
third. On the other hand, from 1997 to 2007, assessed residential acreage in incorporated<br />
areas increased by about 83 percent while these communities’ populations increased by<br />
40 percent. This would indicate that even the incorporated communities in the <strong>county</strong><br />
have issues with low density residential development. However, 95 percent <strong>of</strong> the<br />
assessed residential acreage and 51 percent <strong>of</strong> the population in the <strong>county</strong> are located in<br />
unincorporated communities. If this trend is to continue, it has serious implications for<br />
impacts on natural resources and productive lands, demands for services and conflicts<br />
between farm and non-farm uses in St. Croix County.<br />
While unincorporated communities in St. Croix County have about twice as much as<br />
much commercial land as incorporated communities, there is more than twice as much<br />
commercial evaluation in the cities and villages than in the towns. This indicates<br />
commercial activity in cities and villages is more intensive and includes commercial uses<br />
much larger in scale than in the towns. However, scattered local-serving, resource-based<br />
and agriculturally related commercial enterprises in the rural area serve a useful purpose<br />
in those communities. Yet, cities and villages will continue to provide more regional<br />
shopping goods.<br />
Indu<strong>st</strong>rial activity will continue to largely occur in the cities and villages where urban<br />
services are available; however, there are significant indu<strong>st</strong>rial activities in<br />
unincorporated areas, such as light fabricating and non-metallic resources extraction.<br />
The mo<strong>st</strong> prevalent land use in St. Croix County is agriculture. In fact, almo<strong>st</strong> two-thirds<br />
<strong>of</strong> the assessed land in the County is considered agricultural; however, the County<br />
experienced a 28 percent reduction in agricultural land from 1987 to 2007, with one town<br />
losing over a half, two others losing over a third, two others losing over a quarter, and<br />
fifteen others losing between ten and twenty-five percent <strong>of</strong> their agricultural land during<br />
that period. It is evident that this has serious implications for many <strong>of</strong> the towns in St.<br />
Croix County. Su<strong>st</strong>aining agricultural economic activity in the face <strong>of</strong> increasing<br />
agricultural land conversion to non-farm uses will be a challenge for these communities.<br />
Not all the land converted from agriculture is going to non-farm uses. It is likely that<br />
some <strong>of</strong> it was being converted to fore<strong>st</strong>ed land due to programs like the Conservation<br />
Reserve Program. However, while assessed fore<strong>st</strong>ed land increased by 30 percent in the<br />
County between 1987 and 1997, it increased by less than 4 percent between 1997 and<br />
2007, with eleven towns experiencing losses. But the loss <strong>of</strong> farmland was more than<br />
three times the amount <strong>of</strong> fore<strong>st</strong>ed land gained between 1987 and 1997, and was 33 times<br />
the amount gained between 1997 and 2007. Productive fore<strong>st</strong>ed land will continue to be<br />
an important part <strong>of</strong> St. Croix County’s landscape and economy, not only for fore<strong>st</strong><br />
products but also for recreational opportunities.<br />
St. Croix County Conditions and Trends Report 245
Land use projections are an important part <strong>of</strong> a comprehensive plan. They are a “be<strong>st</strong><br />
guess” <strong>of</strong> the amount <strong>of</strong> land that will be needed for future development and are based on<br />
population and household projections, community development <strong>st</strong>andards (accepted<br />
density or intensity <strong>of</strong> various land uses) and community desires. Each community will<br />
prepare its 25-year land use projections in five-year increments for its comprehensive<br />
plan land use element. These projections will be reflected in the individual community’s<br />
future land use maps that will show the general locations <strong>of</strong> different land uses for the<br />
next 25 years. It is from these projections and the future land use map that each<br />
community will communicate how land use change is likely to occur, influenced by how<br />
they would like it to occur.<br />
Land Use by Municipality Discussion<br />
Following is a general description <strong>of</strong> the land use/cover in the communities <strong>of</strong> St. Croix<br />
County based on <strong>report</strong>ed assessed land. This discussion is intended to augment Tables<br />
7.6 through 7.13.<br />
Town Land Use Summaries<br />
Baldwin<br />
The Town <strong>of</strong> Baldwin is predominantly agricultural, with 71 percent <strong>of</strong> its<br />
assessed land assessed as agriculture. The Town lo<strong>st</strong> 23 percent <strong>of</strong> its assessed<br />
agricultural acreage between 1987 and 2007. The town contains the headwaters<br />
<strong>of</strong> the Rush River, an important trout <strong>st</strong>ream in we<strong>st</strong>ern Wisconsin, and the Eau<br />
Galle River as well. From 1987 to 2007, assessed residential acreage increased<br />
by 94 percent and the number <strong>of</strong> improved residential parcels increased by 90<br />
percent. The number <strong>of</strong> improved commercial parcels increased by 79 percent<br />
during the same period. The Villages <strong>of</strong> Baldwin and Woodville border the Town<br />
in the southwe<strong>st</strong> and southea<strong>st</strong> corners, respectively.<br />
Cady<br />
The Town <strong>of</strong> Cady is 71 percent agricultural and 15 percent fore<strong>st</strong>ed. The Town<br />
only lo<strong>st</strong> 12 percent <strong>of</strong> its assessed agricultural acreage between 1987 and 2007.<br />
The Town experienced a 64 percent increase in assessed residential acreage and a<br />
194 percent increase in improved residential parcels from 1987-2007. The Town<br />
gained 27 acres <strong>of</strong> assessed commercial land in 3 parcels between 1987 and 2007.<br />
Inter<strong>st</strong>ate Highway 94 runs through the northern part <strong>of</strong> the Town and the Village<br />
<strong>of</strong> Spring Valley borders the Town in its southwe<strong>st</strong> corner.<br />
Cylon<br />
The Town <strong>of</strong> Cylon is largely agricultural, with 64 percent <strong>of</strong> its assessed land<br />
assessed as such. Nineteen percent <strong>of</strong> assessed land in the Town is assessed as<br />
fore<strong>st</strong>ed. Since 1987 the Town lo<strong>st</strong> has about 20 percent <strong>of</strong> its assessed<br />
agricultural acreage and ten percent <strong>of</strong> fore<strong>st</strong>ed land. Between 1987 and 2007, the<br />
Town experienced a 46 percent increase in improved residential parcels and a 118<br />
246 Land Use Information
percent increase in residential acreage. The Town is home to a large DNR holding<br />
(2000+ acres) along the North Fork <strong>of</strong> the Willow River. The Town also borders<br />
the Village <strong>of</strong> Deer Park in the Town’s northwe<strong>st</strong> corner.<br />
Eau Galle<br />
The Town <strong>of</strong> Eau Galle has 61 percent <strong>of</strong> its land assessed as agricultural and 21<br />
percent assessed as fore<strong>st</strong>ed. The Town lo<strong>st</strong> 35 percent <strong>of</strong> its assessed agricultural<br />
acreage between 1987 and 2007. The Town experienced a 197 percent increase in<br />
improved residential parcels and a 97 percent increase in assessed residential<br />
acreage since 1987. The Town lo<strong>st</strong> 46 acres <strong>of</strong> assessed commercial land in four<br />
parcels between 1987 and 2007. The Town borders the Villages <strong>of</strong> Baldwin and<br />
Woodville in the northwe<strong>st</strong>ern and northea<strong>st</strong>ern parts <strong>of</strong> the town respectively.<br />
Emerald<br />
The Town <strong>of</strong> Emerald has 73 percent <strong>of</strong> its assessed land assessed as agricultural.<br />
The Town has lo<strong>st</strong> 18 percent <strong>of</strong> its assessed agricultural land since 1987. The<br />
Town had 16 percent <strong>of</strong> assessed land assessed as fore<strong>st</strong>ed in 2007, up from 9<br />
percent in 1987. The Town experienced a 183 percent increase in improved<br />
residential parcels and over a five-fold increase in assessed residential acreage<br />
since 1987. The unincorporated settlement <strong>of</strong> Emerald is in the ea<strong>st</strong>ern part <strong>of</strong> the<br />
Town.<br />
Erin Prairie<br />
The Town <strong>of</strong> Erin Prairie is the <strong>county</strong>’s mo<strong>st</strong> agricultural town with 81 percent<br />
<strong>of</strong> its assessed land assessed as agricultural in 2007. The Town only lo<strong>st</strong> 16<br />
percent <strong>of</strong> its assessed agricultural acreage between 1987 and 2007. The Town <strong>of</strong><br />
Erin Prairie experienced a 104 percent increase in improved residential parcels<br />
and a 163 percent increase in assessed residential acreage since 1987. The<br />
unincorporated settlements <strong>of</strong> Jewett and Erin Corners are found in the Town.<br />
Fore<strong>st</strong><br />
The Town <strong>of</strong> Fore<strong>st</strong> has about 68 percent <strong>of</strong> its assessed land assessed as<br />
agriculture and another 22 percent assessed as fore<strong>st</strong>. Between 1987 and 1997, the<br />
Town lo<strong>st</strong> 24 percent <strong>of</strong> its assessed agricultural land, but saw a doubling <strong>of</strong><br />
assessed fore<strong>st</strong> land. The Town experienced an 85 percent increase in improved<br />
residential parcels and a 138 percent increase in assessed residential acres<br />
between 1987 and 2007. The average parcel size for assessed fore<strong>st</strong> parcels<br />
decreased from 19 acres in 1987 to 17 acres in 2007. The unincorporated<br />
settlement <strong>of</strong> Fore<strong>st</strong> is in the Town.<br />
Glenwood<br />
The Town <strong>of</strong> Glenwood has 68 percent <strong>of</strong> its assessed land assessed as<br />
agricultural, and 16 percent assessed as fore<strong>st</strong>. 28 percent <strong>of</strong> its assessed<br />
agricultural land was lo<strong>st</strong> between 1987 and 2007. While the Town’s assessed<br />
fore<strong>st</strong> land increased 137 percent between 1987 and 2007, it lo<strong>st</strong> over 17 percent<br />
from 1997 to 2007. The Town experienced more than a three-fold increase in<br />
St. Croix County Conditions and Trends Report 247
improved residential parcels and a 259 percent increase in assessed residential<br />
acreage since 1987. The Town surrounds the City <strong>of</strong> Glenwood City.<br />
Hammond<br />
The Town <strong>of</strong> Hammond has 76 percent <strong>of</strong> its assessed land assessed as<br />
agricultural. The Town lo<strong>st</strong> over a fifth <strong>of</strong> its assessed agricultural land between<br />
1987 and 2007. The Town experienced a five-fold increase in improved<br />
residential parcels and nearly the same increase in assessed residential acres since<br />
1987. The Town also saw a doubling <strong>of</strong> improved commercial parcels, and an 85<br />
percent increase in assessed commercial acreage during the same period. The<br />
Town also borders the Villages <strong>of</strong> Hammond and Baldwin.<br />
Hudson<br />
The Town <strong>of</strong> Hudson is perhaps the <strong>county</strong>’s mo<strong>st</strong> urbanized town. It only has 21<br />
percent <strong>of</strong> its assessed land as agricultural and 3 percent assessed as fore<strong>st</strong>ed.<br />
However, assessed residential acreage accounts for 64 percent <strong>of</strong> all assessed<br />
lands in the Town. The Town has lo<strong>st</strong> almo<strong>st</strong> a fourth <strong>of</strong> its assessed agricultural<br />
land between 1987 and 2007. The Town saw a three-fold increase in improved<br />
residential parcels and a 120 percent increase in assessed residential acreage since<br />
1987. The Town also saw a 22 percent decrease in the amount <strong>of</strong> assessed<br />
commercial acreage between 1987 and 2007, likely due to annexation. The City<br />
<strong>of</strong> Hudson and Village <strong>of</strong> North Hudson dominate the Town’s we<strong>st</strong>ern border.<br />
The Town borders the St. Croix River at it very northwe<strong>st</strong> corner.<br />
Kinnickinnic<br />
The Town <strong>of</strong> Kinnickinnic has 68 percent <strong>of</strong> its assessed land assessed as<br />
agricultural land and 14 percent assessed as fore<strong>st</strong>ed lands. The Town lo<strong>st</strong> almo<strong>st</strong><br />
22 percent <strong>of</strong> its assessed agricultural acres between 1987 and 2007 while<br />
assessed fore<strong>st</strong> land increased by 27 percent. The Town experienced a 129<br />
percent increase in improved residential parcels and a 200 percent increase in<br />
assessed residential acres since 1987. The Kinnickinnic River, classified as an<br />
out<strong>st</strong>anding water resource by the State <strong>of</strong> Wisconsin, runs through the Town.<br />
The City <strong>of</strong> River Falls borders the Town at its southwe<strong>st</strong> corner.<br />
Pleasant Valley<br />
The Town <strong>of</strong> Pleasant Valley has 80 percent <strong>of</strong> its assessed land assessed as<br />
agricultural and only 5.5 percent assessed as fore<strong>st</strong>ed. The Town lo<strong>st</strong> 15 percent<br />
(less than one percent per year) <strong>of</strong> its assessed agricultural land between 1987 and<br />
2007. During the same period, the Town experienced a 104 percent increase in<br />
improved residential parcels while assessed residential acreage quadrupled.<br />
Richmond<br />
The Town <strong>of</strong> Richmond has 64 percent <strong>of</strong> its assessed land assessed as<br />
agricultural, 5 percent assessed as fore<strong>st</strong>ed, and 17 percent assessed residential.<br />
In the la<strong>st</strong> 20 years the Town has lo<strong>st</strong> 34 percent <strong>of</strong> its land assessed as<br />
agricultural and fore<strong>st</strong>ed land increased by almo<strong>st</strong> 70 percent. However, while<br />
248 Land Use Information
assessed fore<strong>st</strong> land almo<strong>st</strong> doubled from 1987 to 1997, it declined by 13 percent<br />
in the next decade. The Town <strong>of</strong> Richmond experienced a 244 percent increase in<br />
improved residential parcels and a 357 percent increase in assessed residential<br />
land since 1987. The Town also saw an increase in assessed commercial acreage<br />
<strong>of</strong> 361 percent. The Town abuts the southern border <strong>of</strong> the City <strong>of</strong> New<br />
Richmond and contains the unincorporated settlement <strong>of</strong> Boardman where County<br />
Highway A intersects 100 th Street and 140 th Avenue.<br />
Rush River<br />
Currently, the Town <strong>of</strong> Rush River is predominantly agricultural with 76 percent<br />
<strong>of</strong> its land assessed as agricultural. Seven percent <strong>of</strong> the Town’s assessed land is<br />
assessed as fore<strong>st</strong>. From 1987 to 2007, the Town experienced a 19 percent<br />
decrease in assessed agricultural acres while seeing a 69 percent increase in<br />
assessed fore<strong>st</strong>ed acres. Between 1987 and 2007 improved residential parcels<br />
increased by 78 percent while assessed residential acreage increased by 137<br />
percent. The Rush River, a Class II trout <strong>st</strong>ream, traverses the Town north to<br />
south. There is also the unincorporated settlement <strong>of</strong> New Centerville in the<br />
southern part <strong>of</strong> the Town.<br />
St. Joseph<br />
The Town <strong>of</strong> St. Joseph has 42 percent <strong>of</strong> its assessed land assessed as<br />
agricultural and 13 percent assessed as fore<strong>st</strong>ed lands. However, assessed<br />
residential acreage accounts for 36 percent <strong>of</strong> all assessed lands in the Town and<br />
ranked third in the County in assessed residential acreage. The Town lo<strong>st</strong> over a<br />
third (-37%) <strong>of</strong> its assessed agricultural land between 1987 and 2007. The Town<br />
saw a 76 percent increase in improved residential parcels and an 81 percent<br />
increase in assessed residential acreage since 1987. During the same period<br />
improved commercial parcels increased five times with a 37 percent increase in<br />
assessed commercial acreage. The St. Croix River borders the Town to the we<strong>st</strong>,<br />
and the Willow River flows through the southea<strong>st</strong>ern part <strong>of</strong> the Town. Willow<br />
River State Park follows much <strong>of</strong> the Willow River in the southern part <strong>of</strong> the<br />
Town, and the County’s Home<strong>st</strong>ead Parklands surrounds much <strong>of</strong> Perch Lake.<br />
The 416 acre Bass Lake is found in the northea<strong>st</strong>ern part <strong>of</strong> the Town. The<br />
unincorporated settlements <strong>of</strong> Houlton and Burkhardt are located in the we<strong>st</strong>ern<br />
and southea<strong>st</strong>ern parts <strong>of</strong> the Town, respectively.<br />
Somerset<br />
The Town <strong>of</strong> Somerset has about 41 percent <strong>of</strong> its assessed land assessed as<br />
agricultural and 15 percent as fore<strong>st</strong>. The Town has lo<strong>st</strong> about 42 percent <strong>of</strong><br />
assessed agricultural land and 32 percent <strong>of</strong> assessed fore<strong>st</strong> land between 1987<br />
and 2007. During the same period the Town experienced a 169 percent increase<br />
in improved residential parcels and a 133 percent increase in assessed residential<br />
acreage. There was also a 48 percent increase in improved commercial parcels<br />
during that time. The Town ranks second in the <strong>county</strong> in assessed residential<br />
acres (7,328 acres). The St. Croix River fronts the entire we<strong>st</strong>ern edge <strong>of</strong> the<br />
Town. The Town surrounds mo<strong>st</strong> <strong>of</strong> the Village <strong>of</strong> Somerset.<br />
St. Croix County Conditions and Trends Report 249
Springfield<br />
The Town <strong>of</strong> Springfield has 64 percent <strong>of</strong> it assessed land assessed as<br />
agricultural and another 19 percent assessed as fore<strong>st</strong>. The Town saw a 72<br />
increase percent in assessed fore<strong>st</strong> land between 1987 and 2007, but lo<strong>st</strong> 31<br />
percent <strong>of</strong> its assessed agricultural land. During the same period the Town<br />
experienced a 93 percent increase in improved residential parcels and more than<br />
tripled assessed residential acreage. There was also a 179 percent increase in<br />
assessed commercial acreage during that time. The unincorporated settlement <strong>of</strong><br />
Hersey and Village <strong>of</strong> Wilson are located in the Town. In addition, Glen Hills<br />
County Park, a popular recreational area, is in the Town.<br />
Stanton<br />
The Town <strong>of</strong> Stanton has 79 percent <strong>of</strong> its land assessed as agricultural and<br />
another 9 percent as fore<strong>st</strong>. The Town lo<strong>st</strong> assessed agricultural acreage at an<br />
average rate <strong>of</strong> one percent per year between 1987 and 2007. The Town saw a 41<br />
percent increase in assessed fore<strong>st</strong> acres between 1987 and 1997 only to see them<br />
decline by 17 percent in the next ten years. The Town has experienced a 38<br />
percent increase in improved residential parcels and an 80 percent increase in<br />
assessed residential acreage. The Town has considerable (2,230 acres) public<br />
resource lands, mo<strong>st</strong>ly U.S. Fish and Wildlife Service Waterfowl Production<br />
Areas. The Village <strong>of</strong> Star Prairie and the City <strong>of</strong> New Richmond border the<br />
Town in its northwe<strong>st</strong> and southwe<strong>st</strong> corners, respectively.<br />
Star Prairie<br />
The Town <strong>of</strong> Star Prairie has 40 percent <strong>of</strong> its assessed land assessed as<br />
agricultural, 24 percent as residential and 18 percent assessed as fore<strong>st</strong>. The Town<br />
has lo<strong>st</strong> over half <strong>of</strong> its assessed agricultural land, but almo<strong>st</strong> doubled (93%<br />
increase) assessed fore<strong>st</strong> land between 1987 and 2007. The Town has numerous<br />
lakes and <strong>st</strong>reams consi<strong>st</strong>ing <strong>of</strong> about 768 total acres or 3.8 percent <strong>of</strong> the total<br />
area <strong>of</strong> the Town. Many <strong>of</strong> these water bodies have significant shoreland<br />
development, particularly around Cedar and Squaw lakes, and the Apple River.<br />
The Town experienced an increase <strong>of</strong> four and a half times in improved<br />
residential parcels and a 145 percent increase in assessed residential acreage<br />
between 1987 and 2007. During the same period assessed commercial acreage<br />
tripled. The Village <strong>of</strong> Star Prairie and the City <strong>of</strong> New Richmond border the<br />
Town in its northea<strong>st</strong> and southea<strong>st</strong> corners, respectively.<br />
Troy<br />
The Town <strong>of</strong> Troy has 57 percent <strong>of</strong> its assessed land assessed as agricultural, 26<br />
percent assessed as residential and 9 percent assessed as fore<strong>st</strong>. The Town ranks<br />
fourth in the <strong>county</strong> in assessed residential acres (5,395 acres). The Town lo<strong>st</strong> 31<br />
percent <strong>of</strong> its assessed agricultural land and 25 percent <strong>of</strong> its assessed fore<strong>st</strong> land<br />
between 1987 and 2007. The Town experienced a 128 percent increase in<br />
improved residential parcels and an 87 percent increase in assessed residential<br />
250 Land Use Information
acreage during the same period. The Cities <strong>of</strong> Hudson and River Falls border the<br />
northwe<strong>st</strong>ern and southea<strong>st</strong>ern parts <strong>of</strong> the Town, respectively.<br />
Warren<br />
The Town <strong>of</strong> Warren has 70 percent <strong>of</strong> its assessed land assessed as agricultural.<br />
It also has 11 percent assessed as fore<strong>st</strong>. Between 1987 and 2007, the Town lo<strong>st</strong><br />
more than a fourth (27 percent) <strong>of</strong> its assessed agricultural land while the amount<br />
<strong>of</strong> assessed fore<strong>st</strong> land more than doubled (108 percent increase). During the<br />
same period, the Town experienced a 159 percent increase in improved residential<br />
parcels and a 167 percent increase in assessed residential acreage. The Town also<br />
saw a 233 percent increase in improved commercial parcels and assessed<br />
commercial acreage increased by seventeen times. The Kinnickinnic River runs<br />
through the southea<strong>st</strong> part <strong>of</strong> the Town. The Town surrounds the Village <strong>of</strong><br />
Roberts.<br />
Village Land Use Summaries<br />
Baldwin<br />
The Village <strong>of</strong> Baldwin has 13 percent <strong>of</strong> its assessed land assessed as residential,<br />
20 percent as commercial and 18 percent as manufacturing. Approximately 38<br />
percent <strong>of</strong> the assessed land in the Village is in agriculture and 8 percent is<br />
undeveloped. The Village had a 127 percent increase improved residential<br />
parcels and 264 percent increase in assessed residential acreage between 1987 and<br />
2007. During the same period there was a 44 percent increase in improved<br />
commercial parcels and seven-fold increase in assessed commercial acreage.<br />
Manufacturing also saw sub<strong>st</strong>antial increases with a doubling improved<br />
manufacturing parcels and a 288 percent increase in assessed manufacturing<br />
acreage.<br />
Deer Park<br />
The Village <strong>of</strong> Deer Park has 9 percent <strong>of</strong> its assessed land assessed as residential,<br />
one percent as commercial and less than one percent as manufacturing. About 56<br />
percent <strong>of</strong> the Village is in agriculture, while 15 percent is undeveloped and 19<br />
percent is fore<strong>st</strong>. Between 1987 and 2007, improved residential parcels have<br />
increased 27 while the amount <strong>of</strong> assessed residential land declined by 9 percent.<br />
The amount <strong>of</strong> assessed commercial land in the Village decreased by 74 percent<br />
during the same period.<br />
Hammond<br />
The Village <strong>of</strong> Hammond currently has about 19 percent <strong>of</strong> its assessed land<br />
assessed as residential, 6 percent as commercial and about 2 percent as<br />
manufacturing. Approximately 8 percent <strong>of</strong> the Village is undeveloped, and 64<br />
percent is in agriculture. Assessed agricultural land in the Village increased by a<br />
third between 1987 and 2007. The Village had a 142 percent increase in<br />
improved residential parcels and a 42 percent increase in improved commercial<br />
parcels during the same period. In addition, the Village had a doubled its<br />
St. Croix County Conditions and Trends Report 251
improved indu<strong>st</strong>rial parcels with a fivefold percent increase in assessed<br />
manufacturing acreage.<br />
North Hudson<br />
The Village <strong>of</strong> North Hudson has 35 percent <strong>of</strong> its assessed land assessed as<br />
residential, 26 percent as commercial and one percent as manufacturing.<br />
Approximately 38 percent <strong>of</strong> the assessed land is undeveloped. The Village had a<br />
52 percent increase in improved residential parcels and a 57 percent increase in<br />
improved commercial parcels between 1987 and 2007. The Village saw a small<br />
loss <strong>of</strong> manufacturing activity during the same period. The Village fronts Lake<br />
St. Croix to the we<strong>st</strong> and Lake Mallalieu, an impoundment <strong>of</strong> the Willow River,<br />
to the south.<br />
Roberts<br />
The Village <strong>of</strong> Roberts currently has about 8 percent <strong>of</strong> its assessed land assessed<br />
as residential, 14 percent as commercial and about 9 percent as manufacturing.<br />
Approximately 8 percent <strong>of</strong> the Village is undeveloped, and 55 percent is in<br />
agriculture. Assessed agricultural land in the Village increased from nothing 1987<br />
to 378 acres by 2007. The Village had a 167 percent increase in improved<br />
residential parcels and a 31 percent increase in improved commercial parcels<br />
during the same period. In addition, the Village had 59 acres assessed as<br />
manufacturing in 2007.<br />
Somerset<br />
The Village <strong>of</strong> Somerset has 22 percent <strong>of</strong> its assessed land assessed as<br />
residential, 23 percent as commercial and 8 percent as manufacturing.<br />
Approximately 3 percent <strong>of</strong> the assessed land in the Village is in agriculture while<br />
43 percent is classified as undeveloped. Between 1987 and 2007, improved<br />
residential parcels more than tripled and assessed residential acreage increased by<br />
267 percent. During the same period there was a 146 percent increase in<br />
improved commercial parcels and assessed commercial acreage almo<strong>st</strong><br />
quadrupled. Manufacturing also saw significant increases with a doubling<br />
improved manufacturing parcels and a 288 percent increase in assessed<br />
manufacturing acreage. The Apple River runs through the Village.<br />
Star Prairie<br />
The Village <strong>of</strong> Star Prairie has 26 percent <strong>of</strong> its assessed land assessed as<br />
residential, one percent as commercial and less than one percent as<br />
manufacturing. About 48 percent <strong>of</strong> the Village is in agriculture, while 4 percent<br />
is undeveloped and 20 percent is fore<strong>st</strong>. Between 1987 and 2007, improved<br />
residential parcels had increased 76 while the amount <strong>of</strong> assessed residential land<br />
increased by 38 percent. The amount <strong>of</strong> assessed commercial land in the Village<br />
increased from 4 to 11 acres during the same period.<br />
252 Land Use Information
Spring Valley<br />
There is a 254 acre portion <strong>of</strong> Spring Valley which is in St. Croix County. The<br />
majority <strong>of</strong> the Village is in Pierce County. Of the assessed land in the Village in<br />
St. Croix County, 17 percent is assessed residential, 25 as agricultural, 33 percent<br />
as undeveloped and 25 percent as fore<strong>st</strong>. Mo<strong>st</strong> <strong>of</strong> the land is part <strong>of</strong> the Eau Galle<br />
Recreational Area managed by the Army Corp <strong>of</strong> Engineers.<br />
Wilson<br />
The Village <strong>of</strong> Wilson currently has about 8 percent <strong>of</strong> its assessed land assessed<br />
as residential, 59 percent <strong>of</strong> the Village as undeveloped, and 23 percent is in<br />
agriculture. The Village lo<strong>st</strong> three-quarters <strong>of</strong> it assessed agricultural acreage<br />
between 1987 and 2007. It appears that much <strong>of</strong> it could have been reclassified as<br />
undeveloped. The Village had a 50 percent increase in improved residential<br />
parcels and assessed residential acreage tripled during the same period. Improved<br />
commercial parcels increased from 7 to 12 during the same period.<br />
Woodville<br />
The Village <strong>of</strong> Woodville has 34 percent <strong>of</strong> its assessed land assessed as<br />
residential, 10 percent as commercial and 8 percent as manufacturing.<br />
Approximately 19 percent <strong>of</strong> the assessed land in the Village is in agriculture,<br />
while 15 percent is classified as undeveloped and 14 percent as fore<strong>st</strong>. Between<br />
1987 and 2007, improved residential parcels increased by 87 percent and assessed<br />
residential acreage more than quadrupled. During the same period there was a 34<br />
percent increase in improved commercial parcels and there was more than a fivefold<br />
increase in commercial acreage. Manufacturing also saw significant<br />
increases with a doubling improved manufacturing parcels and a tripling <strong>of</strong><br />
assessed manufacturing acreage.<br />
City Land Use Summaries<br />
Glenwood City<br />
The City <strong>of</strong> Glenwood City has 39 percent <strong>of</strong> its assessed land assessed as<br />
residential, 5 percent as commercial and one percent as manufacturing.<br />
Approximately 33 percent <strong>of</strong> the assessed land in the City is assessed as<br />
agriculture and 16 percent as fore<strong>st</strong>. Between 1987 and 2007 the amount <strong>of</strong><br />
assessed agricultural land declined by 63 percent in the City. During the same<br />
period, the City had a 37 percent increase in improved residential parcels and a<br />
ten-fold increase in assessed residential acreage. The City has seen a 12 percent<br />
increase in improved commercial parcels and assessed commercial acreage more<br />
than tripled. Improved manufacturing parcels increased from two to four between<br />
1987 and 2007.<br />
Hudson<br />
The City <strong>of</strong> Hudson has about 37 percent <strong>of</strong> its assessed land assessed as<br />
residential, 55 percent as commercial and 8 percent as manufacturing. The City<br />
has 17 percent <strong>of</strong> all the assessed commercial land in the <strong>county</strong>. Between 1987<br />
St. Croix County Conditions and Trends Report 253
and 2007, the City had a 122 percent increase in improved residential parcels, a<br />
172 percent increase in improved commercial parcels, and saw assessed<br />
manufacturing acreage more than double. The City encompasses the Inter<strong>st</strong>ate<br />
Highway 94 bridge over the St. Croix River which is found on the City’s we<strong>st</strong>ern<br />
border.<br />
New Richmond<br />
The City <strong>of</strong> New Richmond has 17 percent <strong>of</strong> its assessed land assessed as<br />
residential, 4 percent as commercial and 10 percent as manufacturing.<br />
Approximately 69 percent <strong>of</strong> the assessed land in the City is assessed as<br />
agriculture or undeveloped. Since 1987, the City had a 76 percent increase in<br />
improved residential parcels. Assessed residential acreage increased almo<strong>st</strong> sixfold<br />
between 1997 and 2007. Between 1987 and 2007, the City saw a 47 percent<br />
increase in improved commercial parcels, while assessed commercial acreage<br />
increased by 50 percent. During the same period, the number <strong>of</strong> improved<br />
manufacturing parcels increased by 64 percent while assessed manufacturing<br />
acreage increased by 47 percent.<br />
River Falls<br />
About 37 percent <strong>of</strong> the total land area <strong>of</strong> the City <strong>of</strong> River Falls is in St. Croix<br />
County. The major land uses in this section <strong>of</strong> the City are the commercial and<br />
agriculture. Indeed, 27 percent <strong>of</strong> assessed land in this section <strong>of</strong> the City is<br />
assessed as agricultural, 26 percent as commercial, 23 percent as residential and<br />
19 percent as manufacturing. Between 1987 and 2007, this part <strong>of</strong> the City had a<br />
125 percent increase in improved residential parcels and a 71 percent increase in<br />
improved commercial parcels. During the same period, the portion <strong>of</strong> the City in<br />
St. Croix County saw a 275 percent increase in assessed manufacturing land and a<br />
46 percent decrease in assessed agricultural land. The lower Kinnickinnic River<br />
flows through the City.<br />
254 Land Use Information
Land Use Tables<br />
Table 7.6<br />
Assessed Residential Acres by Municipality • 1987, 1997 and 2007<br />
St. Croix County<br />
Total Acres 87-07 Percent 97-07 Percent<br />
Town 1987 1997 2007 Change Change<br />
Baldwin 450 682 873 94.00% 28.01%<br />
Cady 379 689 623 64.38% -9.58%<br />
Cylon 354 719 770 117.51% 7.09%<br />
Eau Galle 917 582 1,148 25.19% 97.25%<br />
Emerald 139 529 709 410.07% 34.03%<br />
Erin Prairie 295 478 777 163.39% 62.55%<br />
Fore<strong>st</strong> 170 266 404 137.65% 51.88%<br />
Glenwood 170 378 610 258.82% 61.38%<br />
Hammond 431 818 2,034 371.93% 148.66%<br />
Hudson 3,609 5,783 7,936 119.89% 37.23%<br />
Kinnickinnic 908 2,260 2,722 199.78% 20.44%<br />
Pleasant Valley 157 240 653 315.92% 172.08%<br />
Richmond 707 1,182 3,233 357.28% 173.52%<br />
Rush River 210 342 498 137.14% 45.61%<br />
St. Joseph 3,500 4,737 6,318 80.51% 33.38%<br />
Somerset 3,148 4,718 7,328 132.78% 55.32%<br />
Springfield 233 394 709 204.29% 79.95%<br />
Stanton 412 618 740 79.61% 19.74%<br />
Star Prairie 1,708 3,164 4,183 144.91% 32.21%<br />
Troy 2,878 3,700 5,395 87.46% 45.81%<br />
Warren 914 2,139 2,437 166.63% 13.93%<br />
TOTAL 21,689 34,418 50,100 130.99% 45.56%<br />
Villages<br />
Baldwin 25 22 91 264.00% 313.64%<br />
Deer Park 34 39 31 -8.82% -20.51%<br />
Hammond NA 121 202 -- 66.94%<br />
North Hudson 9 13 31 244.44% 138.46%<br />
Roberts NA NA 53 -- --<br />
Somerset 51 55 187 266.67% 240.00%<br />
Star Prairie 193 251 267 38.34% 6.37%<br />
Spring Valley + NA 0 42 -- 42,000%<br />
Wilson 25 28 75 200.00% 167.86%<br />
Woodville 55 165 240 336.36% 45.45%<br />
TOTAL 393 694 1,219 210.18% 75.65%<br />
Cities<br />
Glenwood City 30 123 372 1140.00% 202.44%<br />
Hudson NA NA 561 -- --<br />
New Richmond NA 52 302 -- 480.77%<br />
River Falls + NA 23 92 -- 300.00%<br />
TOTAL 30 198 1,327 4323.33% 570.20%<br />
COUNTY TOTAL 22,112 35,300 52,646 138.09% 49.14%<br />
Source: WI DOR + Portion in St. Croix County.<br />
St. Croix County Conditions and Trends Report 255
Table 7.7<br />
Assessed Commercial Acres by Municipality • 1987, 1997 and 2007<br />
St. Croix County<br />
Total Acres 87-07 Percent 97-07 Percent<br />
Town 1987 1997 2007 Change Change<br />
Baldwin 38 45 115 202.63% 155.56%<br />
Cady 19 37 46 142.11% 24.32%<br />
Cylon 24 47 47 95.83% 0.00%<br />
Eau Galle 70 59 24 -65.71% -59.32%<br />
Emerald 16 32 18 12.50% -43.75%<br />
Erin Prairie 6 6 7 16.67% 16.67%<br />
Fore<strong>st</strong> 22 23 29 31.82% 26.09%<br />
Glenwood 24 4 19 -20.83% 375.00%<br />
Hammond 137 162 253 84.67% 56.17%<br />
Hudson 565 730 442 -21.77% -39.45%<br />
Kinnickinnic 89 76 49 -44.94% -35.53%<br />
Pleasant Valley 26 24 11 -57.69% -54.17%<br />
Richmond 76 64 350 360.53% 446.88%<br />
Rush River 11 7 7 -36.36% 0.00%<br />
St. Joseph 206 200 282 36.89% 41.00%<br />
Somerset 419 654 500 19.33% -23.55%<br />
Springfield 19 51 53 178.95% 3.92%<br />
Stanton 57 55 44 -22.81% -20.00%<br />
Star Prairie 124 329 379 205.65% 15.20%<br />
Troy 97 257 460 374.23% 78.99%<br />
Warren 14 183 242 1628.57% 32.24%<br />
TOTAL 2,059 3,045 3,377 64.01% 10.90%<br />
Villages<br />
Baldwin 20 100 141 605.00% 41.00%<br />
Deer Park 19 3 5 -73.68% 66.67%<br />
Hammond NA 23 64 -- 178.26%<br />
North Hudson 8 22 23 187.50% 4.55%<br />
Roberts 39 52 98 151.28% 88.46%<br />
Somerset 52 132 201 286.54% 52.27%<br />
Star Prairie 4 7 11 175.00% 57.14%<br />
Spring Valley + NA 0 0 -- 0%<br />
Wilson NA 1 NA -- --<br />
Woodville 12 19 69 475.00% 263.16%<br />
TOTAL 154 359 612 297.40% 70.47%<br />
Cities<br />
Glenwood City 10 40 45 350.00% 12.50%<br />
Hudson NA NA 847 -- --<br />
New Richmond 50 27 76 52.00% 181.48%<br />
River Falls + NA 58 102 -- 75.86%<br />
TOTAL 60 125 1,070 1683.33% 756.00%<br />
COUNTY TOTAL 2,273 3,529 5,059 122.57% 43.36%<br />
Source: WI DOR + Portion in St. Croix County.<br />
256 Land Use Information
Table 7.8<br />
Assessed Indu<strong>st</strong>rial Acres by Municipality • 1987, 1997 and 2007<br />
St. Croix County<br />
Total Acres 87-07 Percent 97-07 Percent<br />
Town 1987 1997 2007 Change Change<br />
Baldwin 14 14 0 -100.00% -100.00%<br />
Cady 116 118 86 -25.86% -27.12%<br />
Cylon 32 31 58 81.25% 87.10%<br />
Eau Galle 0 0 0 0% 0%<br />
Emerald 0 0 45 0% 0%<br />
Erin Prairie 0 0 0 0% 0%<br />
Fore<strong>st</strong> 0 0 0 0% 0%<br />
Glenwood 0 0 0 0% 0%<br />
Hammond 5 2 2 -60.00% 0.00%<br />
Hudson 134 183 183 36.57% 0.00%<br />
Kinnickinnic 0 0 0 0% 0%<br />
Pleasant Valley 0 0 0 0% 0%<br />
Richmond 83 83 90 8.43% 8.43%<br />
Rush River 0 0 0 0% 0%<br />
St. Joseph 4 11 4 0.00% -63.64%<br />
Somerset 0 0 0 0% 0%<br />
Springfield 0 0 0 0% 0%<br />
Stanton 0 0 40 0% 40,000%<br />
Star Prairie 46 51 148 221.74% 190.20%<br />
Troy 63 26 4 -93.65% -84.62%<br />
Warren 58 12 1 -98.28% -91.67%<br />
TOTAL 555 531 661 19.10% 24.48%<br />
Villages<br />
Baldwin 32 112 124 287.50% 10.71%<br />
Deer Park NA NA NA -- --<br />
Hammond 4 11 24 500.00% 118.18%<br />
North Hudson 5 7 1 -80.00% -85.71%<br />
Roberts NA NA 59 -- --<br />
Somerset 32 46 65 103.13% 41.30%<br />
Star Prairie NA NA 0 -- --<br />
Spring Valley + NA 0 0 -- 0%<br />
Wilson 0 0 0 0% 0%<br />
Woodville 17 31 59 247.06% 90.32%<br />
TOTAL 90 207 332 268.89% 60.39%<br />
Cities<br />
Glenwood City NA 4 10 -- 150.00%<br />
Hudson 57 117 119 108.77% 1.71%<br />
New Richmond 117 162 172 47.01% 6.17%<br />
River Falls + 20 51 75 275.00% 47.06%<br />
TOTAL 194 334 376 93.81% 12.57%<br />
COUNTY TOTAL 839 1,072 1,369 63.17% 27.71%<br />
Source: WI DOR + Portion in St. Croix County.<br />
St. Croix County Conditions and Trends Report 257
Table 7.9<br />
Assessed Agricultural Parcels and Acreage by Municipality • 1987, 1997 and 2007<br />
St. Croix County<br />
Total Parcels Total Acres 1987-2007 1997-2007<br />
Acres Acres<br />
Town 1987 1997 2007 1987 1997 2007 % Change % Change<br />
Baldwin 646 622 451 18,606 18,423 14,325 -23.01% -22.24%<br />
Cady 559 559 508 16,382 15,390 14,408 -12.05% -6.38%<br />
Cylon 504 482 527 15,160 14,285 12,179 -19.66% -14.74%<br />
Eau Galle 669 649 194 17,910 14,470 11,704 -34.65% -19.12%<br />
Emerald 612 610 775 19,289 18,769 15,837 -17.90% -15.62%<br />
Erin Prairie 598 587 375 19,990 19,092 16,831 -15.80% -11.84%<br />
Fore<strong>st</strong> 565 551 670 20,158 17,937 15,238 -24.41% -15.05%<br />
Glenwood 605 603 588 19,356 16,233 13,972 -27.82% -13.93%<br />
Hammond 638 631 679 20,149 19,251 15,652 -22.32% -18.70%<br />
Hudson 380 259 677 9,562 6,200 2,524 -73.60% -59.29%<br />
Kinnickinnic 658 641 798 18,094 16,530 14,196 -21.54% -14.12%<br />
Pleasant Valley 327 335 291 10,571 10,170 8,942 -15.41% -12.07%<br />
Richmond 585 584 418 18,391 16,994 12,063 -34.41% -29.02%<br />
Rush River 347 347 110 10,157 9,880 8,188 -19.39% -17.13%<br />
St. Joseph 425 406 559 11,552 9,772 7,328 -36.57% -25.01%<br />
Somerset 730 652 412 18,034 16,188 10,408 -42.29% -35.71%<br />
Springfield 594 570 129 18,603 15,982 12,899 -30.66% -19.29%<br />
Stanton 560 550 375 17,676 16,540 14,087 -20.30% -14.83%<br />
Star Prairie 539 449 358 14,796 11,941 7,054 -52.32% -40.93%<br />
Troy 645 598 487 17,581 15,607 12,124 -31.04% -22.32%<br />
Warren 620 535 629 18,848 16,491 13,678 -27.43% -17.06%<br />
TOTAL<br />
Villages<br />
11,806 11,220 10,010 350,865 316,145 253,637 -27.71% -19.77%<br />
Baldwin 29 39 16 350 530 264 -24.57% -50.19%<br />
Deer Park 10 12 11 331 314 196 -40.79% -37.58%<br />
Hammond 18 20 30 518 452 690 33.20% 52.65%<br />
North Hudson 0 0 0 0 0 0 0% 0%<br />
Roberts 0 1 16 0 65 378 65,000% 481.54%<br />
Somerset 17 13 2 273 167 29 -89.38% -82.63%<br />
Star Prairie 31 36 29 745 777 496 -33.42% -36.16%<br />
Spring Valley + 0 0 4 NA 0 64 -- 64,000%<br />
Wilson 36 35 19 935 914 222 -76.26% -75.71%<br />
Woodville 16 18 12 329 268 135 -58.97% -49.63%<br />
TOTAL<br />
Cities<br />
157 174 139 3,481 3,487 2,474 -28.93% -29.05%<br />
Glenwood City 42 52 15 893 817 315 -64.73% -61.44%<br />
Hudson 0 0 0 0 0 0 0% 0%<br />
New Richmond 8 0 36 216 0 1,144 429.63% 1,144,000%<br />
River Falls + 15 0 8 199 45 107 -46.23% 137.78%<br />
TOTAL 65 52 59 1,308 862 1,566 19.72% 81.67%<br />
COUNTY TOTAL 12,028 11,446 10,208 355,654 320,494 257,677 -27.55% -19.60%<br />
Source: WI DOR + Portion in St. Croix County.<br />
258 Land Use Information
Table 7.10<br />
Assessed Fore<strong>st</strong> Parcels and Acreage by Town • 1987, 1997 and 2007<br />
St. Croix County<br />
Total Parcels Total Acres<br />
Town 1987 1997 2007 1987-2007 1997-2007 1987 1997 2007 1987-1997 1997-2007 1987-2007<br />
% Change % Change<br />
% Change % Change % Change<br />
Baldwin 106 57 175 65.09% 207.02% 841 790 1,747 -6.06% 121.14% 107.73%<br />
Cady 214 223 200 -6.54% -10.31% 3,663 3,834 3,060 4.67% -20.19% -16.46%<br />
Cylon 261 246 253 -3.07% 2.85% 3,945 3,693 3,542 -6.39% -4.09% -10.22%<br />
Eau Galle 55 406 388 605.45% -4.43% 716 4,161 4,045 481.15% -2.79% 464.94%<br />
Emerald 126 138 268 112.70% 94.20% 1,971 2,081 3,499 5.58% 68.14% 77.52%<br />
Erin Prairie 76 77 119 56.58% 54.55% 1,022 982 1,651 -3.91% 68.13% 61.55%<br />
Fore<strong>st</strong> 127 216 296 133.07% 37.04% 2,434 4,213 4,999 73.09% 18.66% 105.38%<br />
Glenwood 120 314 333 177.50% 6.05% 1,379 3,932 3,240 185.13% -17.60% 134.95%<br />
Hammond 34 134 152 347.06% 13.43% 328 767 787 133.84% 2.61% 139.94%<br />
Hudson 62 48 38 -38.71% -20.83% 758 567 372 -25.20% -34.39% -50.92%<br />
Kinnickinnic 237 227 271 14.35% 19.38% 2,286 2,363 2,901 3.37% 22.77% 26.90%<br />
Pleasant<br />
Valley<br />
110 89 88 -20.00% -1.12% 576 612 620 6.25% 1.31% 7.64%<br />
Richmond 45 109 99 120.00% -9.17% 598 1,163 1,013 94.48% -12.90% 69.40%<br />
Rush River 60 45 79 31.67% 75.56% 463 456 772 -1.51% 69.30% 66.74%<br />
St. Joseph 192 219 190 -1.04% -13.24% 2,327 2,755 2,233 18.39% -18.95% -4.04%<br />
Somerset 382 321 255 -33.25% -20.56% 5,351 4,807 3,664 -10.17% -23.78% -31.53%<br />
Springfield 96 236 221 130.21% -6.36% 1,896 3,676 3,258 93.88% -11.37% 71.84%<br />
Stanton 177 199 152 -14.12% -23.62% 1,350 1,897 1,567 40.52% -17.40% 16.07%<br />
Star Prairie 114 124 244 114.04% 96.77% 1,661 1,938 3,200 16.68% 65.12% 92.66%<br />
Troy 206 186 174 -15.53% -6.45% 2,526 2,094 1,905 -17.10% -9.03% -24.58%<br />
Warren 98 110 139 41.84% 26.36% 995 1,471 2,068 47.84% 40.58% 107.84%<br />
TOTALS 2,898 3,724 4,134 42.65% 11.01% 37,086 48,252 50,143 30.11% 3.92% 35.21%<br />
Source: WI DOR<br />
St. Croix County Conditions and Trends Report 259
Table 7.11<br />
Land Use Acreage by Municipality • 1987*<br />
St. Croix County<br />
Town<br />
Residential<br />
Commercial<br />
Manufacturing<br />
Baldwin 450 38 14 18,606 11 841 0 19,960<br />
Cady 379 19 116 16,382 0 3,663 0 20,559<br />
Cylon 354 24 32 15,160 454 3,945 0 19,969<br />
Eau Galle 917 70 0 17,910 134 716 0 19,747<br />
Emerald 139 16 0 19,289 169 1,971 0 21,584<br />
Erin Prairie 295 6 0 19,990 145 1,022 0 21,458<br />
Fore<strong>st</strong> 170 22 0 20,158 93 2,434 0 22,877<br />
Glenwood 170 24 0 19,356 310 1,379 0 21,239<br />
Hammond 431 137 5 20,149 575 328 0 21,625<br />
Hudson 3,609 565 134 9,562 109 758 0 14,737<br />
Kinnickinnic 908 89 0 18,094 33 2,286 0 21,410<br />
Pleasant Valley 157 26 0 10,571 0 576 0 11,330<br />
Richmond 707 76 83 18,391 459 598 0 20,314<br />
Rush River 210 11 0 10,157 54 463 0 10,895<br />
St. Joseph 3,500 206 4 11,552 176 2,327 0 17,765<br />
Somerset 3,148 419 0 18,034 169 5,351 0 27,121<br />
Springfield 233 19 0 18,603 12 1,896 0 20,763<br />
Stanton 412 57 0 17,676 691 1,350 0 20,186<br />
Star Prairie 1,708 124 46 14,796 753 1,661 0 19,088<br />
Troy 2,878 97 63 17,581 37 2,526 0 23,182<br />
Warren 914 14 58 18,848 213 995 0 21,042<br />
TOTAL 21,689 2,059 555 350,865 4,597 37,086 0 416,851<br />
Villages<br />
Baldwin 25 20 32 350 0 0 0 427<br />
Deer Park 34 19 NA 331 0 0 0 384<br />
Hammond NA NA 4 518 0 0 0 522<br />
North Hudson 9 8 5 0 0 0 0 22<br />
Roberts 1 39 NA 0 0 0 0 40<br />
Somerset 51 52 32 273 0 0 0 408<br />
Star Prairie 193 4 NA 745 0 0 0 942<br />
Spring Valley + NA NA NA NA NA NA NA 0<br />
Wilson 25 NA 0 935 0 0 0 960<br />
Woodville 55 12 17 329 0 0 0 413<br />
TOTAL 393 154 90 3,481 0 0 0 4,118<br />
Cities<br />
Glenwood City 30 10 NA 893 0 0 0 933<br />
Hudson NA NA 57 0 0 0 0 57<br />
New Richmond NA 50 117 216 0 0 0 383<br />
River Falls + NA NA 20 199 0 0 0 219<br />
TOTAL 30 60 194 1,308 0 0 0 1,592<br />
COUNTY TOTAL 22,112 2,273 839 355,654 4,597 37,086 0 422,561<br />
Source: WI DOR * Based on assessment records. + Portion in St. Croix County.<br />
260 Land Use Information<br />
Agricultural<br />
Undeveloped<br />
Fore<strong>st</strong><br />
Other<br />
Total
Table 7.12<br />
Land Use Acreage by Municipality • 1997*<br />
St. Croix County<br />
Town<br />
Residential<br />
Commercial<br />
Manufacturing<br />
Baldwin 682 45 14 18,423 53 790 122 20,129<br />
Cady 689 37 118 15,390 346 3,834 203 20,617<br />
Cylon 719 47 31 14,285 653 3,693 70 19,498<br />
Eau Galle 582 59 0 14,470 53 4,161 250 19,575<br />
Emerald 529 32 0 18,769 198 2,081 168 21,777<br />
Erin Prairie 478 6 0 19,092 148 982 278 20,984<br />
Fore<strong>st</strong> 266 23 0 17,937 93 4,213 257 22,789<br />
Glenwood 378 4 0 16,233 156 3,932 170 20,873<br />
Hammond 818 162 2 19,251 55 767 247 21,302<br />
Hudson 5,783 730 183 6,200 198 567 91 13,752<br />
Kinnickinnic 2,260 76 0 16,530 43 2,363 159 21,431<br />
Pleasant Valley 240 24 0 10,170 44 612 129 11,219<br />
Richmond 1,182 64 83 16,994 427 1,163 200 20,113<br />
Rush River 342 7 0 9,880 31 456 132 10,848<br />
St. Joseph 4,737 200 11 9,772 215 2,755 165 17,855<br />
Somerset 4,718 654 0 16,188 173 4,807 53 26,593<br />
Springfield 394 51 0 15,982 234 3,676 224 20,561<br />
Stanton 618 55 0 16,540 630 1,897 142 19,882<br />
Star Prairie 3,164 329 51 11,941 705 1,938 188 18,316<br />
Troy 3,700 257 26 15,607 24 2,094 95 21,803<br />
Warren 2,139 183 12 16,491 206 1,471 190 20,692<br />
TOTAL 34,418 3,045 531 316,145 4,685 48,252 3,533 410,609<br />
Villages<br />
Baldwin 22 100 112 530 0 18 5 787<br />
Deer Park 39 3 NA 314 0 0 1 357<br />
Hammond 121 23 11 452 0 0 6 613<br />
North Hudson 13 22 7 0 0 0 0 42<br />
Roberts NA 52 NA 65 0 0 0 117<br />
Somerset 55 132 46 167 0 0 4 404<br />
Star Prairie 251 7 NA 777 0 0 11 1,046<br />
Spring Valley + 0 0 0 0 0 0 0 0<br />
Wilson 28 1 0 914 0 0 4 947<br />
Woodville 165 19 31 268 12 19 5 519<br />
TOTAL 694 359 207 3,487 12 37 36 4,832<br />
Cities<br />
Glenwood City 123 40 4 817 0 13 0 997<br />
Hudson NA NA 117 0 0 0 0 117<br />
New Richmond 52 27 162 0 0 0 0 241<br />
River Falls + 23 58 51 45 5 17 0 199<br />
TOTAL 198 125 334 862 5 30 0 1,554<br />
COUNTY TOTAL 35,300 3,529 1,072 320,494 4,702 48,319 3,569 416,995<br />
Source: WI DOR * Based on assessment records. + Portion in St. Croix County.<br />
St. Croix County Conditions and Trends Report 261<br />
Agricultural<br />
Undeveloped<br />
Fore<strong>st</strong><br />
Other<br />
Total
Table 7.13<br />
Land Use Acreage by Municipality • 2007*<br />
St. Croix County<br />
Town<br />
Residential<br />
Commercial<br />
Manufacturing<br />
Baldwin 873 115 0 14,325 2,830 1,747 237 20,127<br />
Cady 623 46 86 14,408 2,015 3,060 179 20,417<br />
Cylon 770 47 58 12,179 2,193 3,542 138 18,927<br />
Eau Galle 1,148 24 0 11,704 2,090 4,045 164 19,175<br />
Emerald 709 18 45 15,837 1,334 3,499 261 21,703<br />
Erin Prairie 777 7 0 16,831 1,454 1,651 144 20,864<br />
Fore<strong>st</strong> 404 29 0 15,238 1,397 4,999 197 22,264<br />
Glenwood 610 19 0 13,972 2,517 3,240 160 20,518<br />
Hammond 2,034 253 2 15,652 1,576 787 168 20,472<br />
Hudson 7,936 442 183 2,524 862 372 67 12,386<br />
Kinnickinnic 2,722 49 0 14,196 881 2,901 162 20,911<br />
Pleasant Valley 653 11 0 8,942 820 620 119 11,165<br />
Richmond 3,233 350 90 12,063 1,846 1,013 156 18,751<br />
Rush River 498 7 0 8,188 1,167 772 134 10,766<br />
St. Joseph 6,318 282 4 7,328 1,305 2,233 142 17,612<br />
Somerset 7,328 500 0 10,408 3,235 3,664 45 25,180<br />
Springfield 709 53 0 12,899 3,121 3,258 221 20,261<br />
Stanton 740 44 40 14,087 1,195 1,567 161 17,834<br />
Star Prairie 4,183 379 148 7,054 2,367 3,200 134 17,465<br />
Troy 5,395 460 4 12,124 1,141 1,905 75 21,104<br />
Warren 2,437 242 1 13,678 888 2,068 147 19,461<br />
TOTAL 50,100 3,377 661 253,637 36,234 50,143 3,211 397,363<br />
Villages<br />
Baldwin 91 141 124 264 55 15 0 690<br />
Deer Park 31 5 NA 196 53 66 2 353<br />
Hammond 202 64 24 690 84 7 2 1,073<br />
North Hudson 31 23 1 0 34 0 0 89<br />
Roberts 53 98 59 378 56 42 0 686<br />
Somerset 187 201 65 29 369 5 0 856<br />
Star Prairie 267 11 0 496 43 202 7 1,026<br />
Spring Valley # 42 0 0 64 84 64 0 254<br />
Wilson 75 NA 0 222 560 89 1 947<br />
Woodville 240 69 59 135 109 100 2 714<br />
TOTAL 1,219 612 332 2,474 1,447 590 14 6,688<br />
Cities<br />
Glenwood City 372 45 10 315 68 156 0 966<br />
Hudson 561 847 119 0 0 0 0 1,527<br />
New Richmond 302 76 172 1,144 99 11 2 1,806<br />
River Falls # 92 102 75 107 6 15 0 397<br />
TOTAL 1,327 1,070 376 1,566 173 182 2 4,696<br />
COUNTY TOTAL 52,646 5,059 1,369 257,677 37,854 50,915 3,227 408,747<br />
Source: WI DOR * Based on assessment records. + Includes Fore<strong>st</strong> and Ag Fore<strong>st</strong>. # Portion in St. Croix County.<br />
262 Land Use Information<br />
Agricultural<br />
Undeveloped<br />
Fore<strong>st</strong> +<br />
Other<br />
Total
Table 7.14<br />
Agricultural Land Sales • 1998 - 2007<br />
St. Croix County<br />
Agricultural land continuing in Agricultural land being diverted Total <strong>of</strong> all agricultural land<br />
Year<br />
agricultural use<br />
to other uses<br />
2007 Number <strong>of</strong> Acres Sold Dollars per Number <strong>of</strong> Acres Sold Dollars per Number <strong>of</strong> Acres Sold Dollars per<br />
transactions<br />
acre transactions<br />
acre transactions<br />
acre<br />
All<br />
Without<br />
24 1,576 3,752 10 582 6,811 34 2,158 4,577<br />
Buildings 15 846 3,074 8 487 6,496 23 1,333 4,324<br />
2006 Number <strong>of</strong> Acres Sold Dollars per Number <strong>of</strong> Acres Sold Dollars per Number <strong>of</strong> Acres Sold Dollars per<br />
transactions<br />
acre transactions<br />
acre transactions<br />
acre<br />
All<br />
Without<br />
23 1,397 7,092 14 1,133 11,157 37 2,530 8,912<br />
Buildings 11 641 6,285 8 542 9,160 19 1,183 7,602<br />
2005 Number <strong>of</strong> Acres Sold Dollars per Number <strong>of</strong> Acres Sold Dollars per Number <strong>of</strong> Acres Sold Dollars per<br />
transactions<br />
acre transactions<br />
acre transactions<br />
acre<br />
All<br />
Without<br />
33 1,924 5,523 34 3,053 12,446 67 4,977 9,770<br />
Buildings 20 1,190 3,287 28 2,332 12,712 48 3,522 9,527<br />
2004 Number <strong>of</strong> Acres Sold Dollars per Number <strong>of</strong> Acres Sold Dollars per Number <strong>of</strong> Acres Sold Dollars per<br />
transactions<br />
acre transactions<br />
acre transactions<br />
acre<br />
All<br />
Without<br />
31 2,082 4,802 41 2,092 8,193 72 4,174 6,501<br />
Buildings 19 1,161 4,196 35 1,797 8,657 54 2,958 6,906<br />
2003 Number <strong>of</strong> Acres Sold Dollars per Number <strong>of</strong> Acres Sold Dollars per Number <strong>of</strong> Acres Sold Dollars per<br />
transactions<br />
acre transactions<br />
acre transactions<br />
acre<br />
All<br />
Without<br />
36 2,922 4,034 47 2,864 6,637 83 5,786 5,322<br />
Buildings 17 1,030 2,640 34 2,137 6,319 51 3,167 5,123<br />
2002 Number <strong>of</strong> Acres Sold Dollars per Number <strong>of</strong> Acres Sold Dollars per Number <strong>of</strong> Acres Sold Dollars per<br />
transactions<br />
acre transactions<br />
acre transactions<br />
acre<br />
All<br />
Without<br />
24 1,355 2,956 44 2,732 7,929 68 4,087 6,281<br />
Buildings 17 850 2,290 24 1,426 4,615 41 2,276 3,747<br />
2001 Number <strong>of</strong> Acres Sold Dollars per Number <strong>of</strong> Acres Sold Dollars per Number <strong>of</strong> Acres Sold Dollars per<br />
transactions<br />
acre transactions<br />
acre transactions<br />
acre<br />
All<br />
Without<br />
47 2,562 2,830 46 2,437 7,033 93 4,999 4,879<br />
Buildings 24 1,396 2,096 32 1,811 7,261 56 3,207 5,012<br />
2000 Number <strong>of</strong> Acres Sold Dollars per Number <strong>of</strong> Acres Sold Dollars per Number <strong>of</strong> Acres Sold Dollars per<br />
transactions<br />
acre transactions<br />
acre transactions<br />
acre<br />
All<br />
Without<br />
49 3,924 1,903 53 2,944 5,300 102 6,868 3,359<br />
Buildings 26 2,237 1,902 41 2,219 5,654 67 4,456 3,770<br />
1999 Number <strong>of</strong> Acres Sold Dollars per Number <strong>of</strong> Acres Sold Dollars per Number <strong>of</strong> Acres Sold Dollars per<br />
transactions<br />
acre transactions<br />
acre transactions<br />
acre<br />
All<br />
Without<br />
53 4,020 1,512 64 3,353 3,467 117 7,373 2,401<br />
Buildings 35 2,634 1,281 48 2,411 3,885 83 5,045 2,525<br />
1998 Number <strong>of</strong> Acres Sold Dollars per Number <strong>of</strong> Acres Sold Dollars per Number <strong>of</strong> Acres Sold Dollars per<br />
transactions<br />
acre transactions<br />
acre transactions<br />
acre<br />
All<br />
Without<br />
62 6,070 1,353 47 2,647 1,847 109 8,717 1,503<br />
Buildings 36 2,763 1,249 31 1,558 1,691 67 4,321 1,409<br />
Source: USDA<br />
St. Croix County Conditions and Trends Report 263
TABLE 7.15<br />
Fore<strong>st</strong>ed Land Sales • 1998, 2001, 2005, and 2007<br />
St. Croix County<br />
Fore<strong>st</strong>ed land continuing in fore<strong>st</strong><br />
Fore<strong>st</strong>ed land being diverted to Total <strong>of</strong> all fore<strong>st</strong>ed land<br />
land<br />
other uses<br />
Number <strong>of</strong> Acres Sold Dollars per Number <strong>of</strong> Acres Sold Dollars per Number <strong>of</strong> Acres Sold Dollars per<br />
Year transactions<br />
acre transactions<br />
acre transactions<br />
acre<br />
2007 9 252 2,925 9 140 4,971 18 392 3,656<br />
2005 11 158 3,881 18 404 14,430 29 562 11,464<br />
2001 31 745 2,339 30 643 7,755 61 1,388 4,848<br />
1998 40 567 1,430 34 1,099 1,657 74 1,666 1,580<br />
Source: USDA<br />
Table 7.16<br />
Land Assessed Value per Acre by Town (dollars) • 2007*<br />
St. Croix County<br />
Town Residential<br />
Commercial<br />
Manufacturing<br />
Baldwin 9,286 4,514 0 169 1,032 1,611 3,076<br />
Cady 11,162 12,309 893 136 561 1,502 2,995<br />
Cylon 10,201 13,298 1,353 152 726 1,529 3,163<br />
Eau Galle 8,676 17,154 0 100 416 545 1,237<br />
Emerald 6,383 4,800 3,198 150 805 1,075 2,328<br />
Erin Prairie 11,671 12,800 0 185 817 1,423 2,961<br />
Fore<strong>st</strong> 6,462 4,776 0 137 678 959 1,833<br />
Glenwood 10,492 7,216 0 140 1,238 1,464 2,941<br />
Hammond 12,256 3,962 6,050 121 800 1,130 4,551<br />
Hudson 29,541 34,721 7,248 119 2,306 3,250 7,602<br />
Kinnickinnic 18,148 10,102 0 128 2,474 3,097 6,007<br />
Pleasant Valley 15,411 10,809 0 181 1,201 2,194 5,145<br />
Richmond 15,068 8,181 2,123 139 1,574 1,265 2,840<br />
Rush River 10,396 22,629 0 165 1,347 1,732 3,436<br />
St. Joseph 28,559 20,623 8,850 144 1,593 1,579 6,554<br />
Somerset 13,258 8,933 0 96 1,747 2,001 4,021<br />
Springfield 13,111 10,473 0 154 1,186 1,738 4,752<br />
Stanton 8,913 6,045 2,920 179 764 1,069 2,112<br />
Star Prairie 17,555 11,011 289 158 1,839 2,449 4,664<br />
Troy 37,865 9,765 7,850 160 1,830 2,601 6,249<br />
Warren 10,358 6,101 10,300 143 877 1,426 2,750<br />
Average for all Towns 14,513 11,439 4,643 146 1,229 1,697 3,867<br />
Source: WI DOR * Based on assessment records.<br />
264 Land Use Information<br />
Agricultural<br />
Undeveloped<br />
Ag Fore<strong>st</strong><br />
Fore<strong>st</strong>
Table 7.17<br />
Land Assessed Value per Acre by Village or City (dollars) • 2007*<br />
St. Croix County<br />
Village or<br />
City Residential<br />
Commercial<br />
Villages<br />
Baldwin + 24,535 67,303 15,001 290 2,196 0 2,000<br />
Deer Park 30,263 28,900 3,500 124 801 0 1,103<br />
Hammond + 31,871 41,097 10,964 181 1,115 2,733 4,850<br />
North Hudson + 70,375 271,896 65,100 0 6,774 0 0<br />
Roberts + 51,726 58,826 17,086 198 239 5,000 5,311<br />
Somerset + 30,104 52,459 19,374 172 18,783 0 7,400<br />
Star Prairie 30,105 38,582 8,900 180 2,902 4,620 3,818<br />
Spring Valley # 5,569 0 0 159 771 907 2,025<br />
Wilson 11,568 + 5,400 0 113 1,328 1,383 2,965<br />
Woodville 60,378 21,530 18,473 161 1,816 1,100 2,259<br />
Average for all Villages 27,577 71,899 19,800 175 3,373 2,624 3,526<br />
Cities<br />
Glenwood City 22,267 41,053 11,750 142 1,119 1,458 2,596<br />
Hudson + 58,830 178,206 44,597 0 0 0 0<br />
New Richmond + 24,478 +108,238 24,294 207 735 0 1,000<br />
River Falls # + 40,950 157,524 52,967 202 450 0 1,213<br />
Average for all Cities 36,631 121,255 33402 184 768 1,458 1,603<br />
Source: WI DOR * Based on assessment records. # Portion in St. Croix County + Assessed value per parcel,<br />
exact acreage unknown.<br />
Manufacturing<br />
St. Croix County Conditions and Trends Report 265<br />
Agricultural<br />
Undeveloped<br />
Ag Fore<strong>st</strong><br />
Fore<strong>st</strong>
Municipality Land Use Maps<br />
The final component <strong>of</strong> the land use element includes a series <strong>of</strong> maps that show current<br />
land uses, productive agricultural soils, natural limitations for building site development,<br />
floodplains, and wetlands. Resource and development limitations maps are described in<br />
the Agricultural, Natural and Cultural Resources section and previously within this<br />
section. The city, village, and town maps themselves are found in Adobe Acrobat .pdf<br />
format in the St. Croix County Resource and Land Use Atlas DVD-ROM.<br />
Limitations to Development Maps<br />
The exi<strong>st</strong>ence <strong>of</strong> some natural features in the physical environment, such as water,<br />
topography, and soil <strong>conditions</strong>, can act as con<strong>st</strong>raints on development. Under<strong>st</strong>anding<br />
the physical characteri<strong>st</strong>ics <strong>of</strong> the County can help identify areas that are more conducive<br />
to development activities and areas that may be better suited for non-development<br />
activities such as agriculture and natural resource management. The St. Croix County<br />
Resource and Land Use Atlas DVD-ROM contains maps <strong>of</strong> the resources, development<br />
limitations, and other environmentally sensitive lands within each community. County<br />
level maps are in Appendix A and in the Atlas DVD-ROM.<br />
In a number <strong>of</strong> in<strong>st</strong>ances, some <strong>of</strong> these development limitations may be overcome by<br />
more extensive and co<strong>st</strong>ly development methods; however, development should be<br />
encouraged in areas in which it can be mo<strong>st</strong> accommodated and have the lea<strong>st</strong> impact on<br />
environmentally sensitive and valued resource areas<br />
Exi<strong>st</strong>ing Land Use Maps<br />
The exi<strong>st</strong>ing land use maps are derived from a windshield survey done in 1997. The<br />
subsequent land use maps at the end <strong>of</strong> this section depict the general land uses in each<br />
community by approximate location. The St. Croix County Resource and Land Use Atlas<br />
DVD-ROM contains the exi<strong>st</strong>ing land use maps in Adobe Acrobat .pdf format for each<br />
local jurisdiction in St. Croix County.<br />
266 Land Use Information