BARRON COUNTY - West Central Wisconsin Regional Planning ...
BARRON COUNTY - West Central Wisconsin Regional Planning ...
BARRON COUNTY - West Central Wisconsin Regional Planning ...

You also want an ePaper? Increase the reach of your titles
YUMPU automatically turns print PDFs into web optimized ePapers that Google loves.
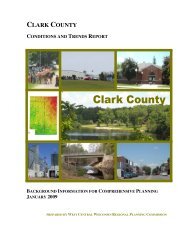
<strong>BARRON</strong> <strong>COUNTY</strong><br />
CONDITIONS AND TRENDS REPORT<br />
BACKGROUND INFORMATION FOR COMPREHENSIVE PLANNING<br />
NOVEMBER 2008<br />
PREPARED BY WEST CENTRAL WISCONSIN REGIONAL PLANNING COMMISSION
Barron County<br />
Conditions and Trends Report<br />
Presented to:<br />
Barron County and its Communities<br />
By:<br />
<strong>West</strong> <strong>Central</strong> <strong>Wisconsin</strong> <strong>Regional</strong> <strong>Planning</strong> Commission<br />
Mail Box 9<br />
800 <strong>Wisconsin</strong> Street, Bldg D2-401<br />
Eau Claire, WI 54703-3606<br />
715.836.2918<br />
With financial assistance from:<br />
<strong>Wisconsin</strong> Department of Administration<br />
Division of Intergovernmental Relations<br />
Final Version<br />
November 19, 2008
Forward<br />
The Barron County Conditions and Trends Report provides the majority of background<br />
information and existing resource maps as required for comprehensive planning efforts<br />
under the <strong>Wisconsin</strong> Comprehensive <strong>Planning</strong> Law (Wis. Act 9). It is a compilation of<br />
the “best available” data available which would be needed for a typical planning effort.<br />
There are two companion documents to this report:<br />
Barron County Resource and Land Use Atlas DVD-ROM: This is a compilation<br />
of existing resource and land use maps for the County and its municipalities in<br />
digital form. Land use data in these maps may need to be updated at the local<br />
level. <strong>West</strong> <strong>Central</strong> <strong>Wisconsin</strong> <strong>Regional</strong> <strong>Planning</strong> Commission will provide the<br />
geographic information system files for these maps upon request.<br />
Inventory of Existing Plans, Programs, and Land Use Policies in <strong>West</strong> <strong>Central</strong><br />
<strong>Wisconsin</strong>: As it’s title relates, this special addendum provides a summary of the<br />
primary programs, plans, and land use policies being implemented within the<br />
seven counties of west central <strong>Wisconsin</strong>.<br />
This report should be considered a starting point for local planning efforts. Certain data<br />
and maps will need to be provided at a local level (e.g., maps and details on municipal<br />
utilities, special or regulatory districts, park systems, mining interests). Communities<br />
may also identify special issues or unique circumstances for which additional data may<br />
be collected locally. And, for the most part, this report merely presents the data; the<br />
County and each community will need to analyze the data to determine local needs,<br />
issues, and important trends.<br />
<strong>West</strong> <strong>Central</strong> <strong>Wisconsin</strong> <strong>Regional</strong> <strong>Planning</strong> Commission (WCWRPC) compiled this<br />
report as part of its regional comprehensive planning effort. A similar report is being<br />
compiled for each of the other six counties in our region. Once complete, a regional level<br />
analysis will be developed based on the data in the individual county reports.<br />
WCWRPC would like to thank everyone who provided input and data for this document,<br />
including: Barron County, the regional comprehensive planning effort’s Technical<br />
Advisory Group, and various State agencies (e.g., Dept. of Administration, Dept. of<br />
Natural Resources, Dept. of Commerce, Office of Economic Advisors, Dept. of<br />
Workforce Development, Dept. of Transportation, Dept. of Health and Family Services).<br />
This Barron County report expands upon the Barron Area Multi-Jurisdictional<br />
Comprehensive Plan Existing Conditions Report jointly prepared by WCWRPC and<br />
Short Elliott Hendrickson, Inc. in May 2005. WCWRPC thanks SEH, Inc. for their<br />
indirect contribution to this larger report.
<strong>BARRON</strong> <strong>COUNTY</strong><br />
CONDITIONS & TRENDS REPORT<br />
TABLE OF CONTENTS<br />
1. Issues and Opportunities Information........................................................................ 1<br />
Introduction......................................................................................................................... 1<br />
The County Setting .................................................................................................... 1<br />
Element Context ........................................................................................................ 2<br />
Socio-Economic Profile...................................................................................................... 3<br />
Population.................................................................................................................. 3<br />
Components of the Population .................................................................................. 5<br />
Educational Attainment ............................................................................................. 7<br />
Employment .............................................................................................................. 7<br />
Income ....................................................................................................................... 9<br />
Population Projections............................................................................................. 10<br />
Household Projections............................................................................................. 12<br />
Employment Projections ......................................................................................... 12<br />
Summary........................................................................................................................... 13<br />
Data Tables ....................................................................................................................... 15<br />
2. Housing Information .................................................................................................. 81<br />
Element Context................................................................................................................ 81<br />
Housing Supply................................................................................................................. 82<br />
Seasonal Units................................................................................................................... 82<br />
Occupancy and Structural Characteristics ........................................................................ 83<br />
Age Characteristics ........................................................................................................... 84<br />
Housing Value Characteristics.......................................................................................... 84<br />
Housing Affordability....................................................................................................... 85<br />
Housing Unit and Household Projections......................................................................... 85<br />
Summary........................................................................................................................... 86<br />
Tables and Map................................................................................................................. 88<br />
3. Transportation Information .................................................................................... 109<br />
Element Context.............................................................................................................. 109<br />
Background Data/Existing Conditions ........................................................................... 111<br />
Highways ........................................................................................................................ 111<br />
Highway Projects in the County............................................................................ 116<br />
Bridges .................................................................................................................. 117<br />
Rustic Roads System ............................................................................................. 118<br />
Access Management.............................................................................................. 119<br />
Designated Truck Routes....................................................................................... 120<br />
Barron County Conditions and Trends Report<br />
i
Transit.................................................................................................................... 120<br />
Bicycles ................................................................................................................. 121<br />
Pedestrian Facilities ............................................................................................... 121<br />
Safety ..................................................................................................................... 125<br />
Commuting Patterns............................................................................................... 127<br />
Railroads ................................................................................................................ 127<br />
Air Transportation.................................................................................................. 130<br />
Water Transportation ............................................................................................. 131<br />
Relevant Transportation Plans ........................................................................................ 131<br />
Statewide Transportation Plans.............................................................................. 131<br />
Barron County Transportation Plans ..................................................................... 132<br />
Overarching Transportation Goals of Individual Plans .................................................. 132<br />
Summary......................................................................................................................... 133<br />
4. Utilities and Community Facilities Information .................................................... 135<br />
Element Context.............................................................................................................. 135<br />
Inventory of Utilities....................................................................................................... 136<br />
Sanitary Sewer and Wastewater Treatment........................................................... 136<br />
On-Site Septic Systems ......................................................................................... 137<br />
Water Supply......................................................................................................... 138<br />
Stormwater Management....................................................................................... 139<br />
Telecommunications Facilities.............................................................................. 141<br />
Power Plants, Substations, and Transmission Lines.............................................. 144<br />
Electric Utilities..................................................................................................... 144<br />
Natural Gas Utilities .............................................................................................. 144<br />
Inventory of Educational Facilities................................................................................. 145<br />
Non-Public Schools ............................................................................................... 145<br />
Public Schools ....................................................................................................... 145<br />
Cooperative Educational Service Agencies (CESA)............................................. 147<br />
Vocational, Technical, and Adult Education......................................................... 147<br />
University of <strong>Wisconsin</strong> System ........................................................................... 148<br />
Other Colleges and Universities............................................................................ 148<br />
Inventory of Other Community Facilities and Services ................................................. 149<br />
Libraries................................................................................................................. 149<br />
Solid Waste Disposal and Recycling Facilities ..................................................... 150<br />
Law Enforcement .................................................................................................. 151<br />
Fire Departments ................................................................................................... 151<br />
Ambulance............................................................................................................. 152<br />
First Responders..................................................................................................... 152<br />
Hazardous Materials Response.............................................................................. 153<br />
Medical Facilities................................................................................................... 154<br />
Child Care Services................................................................................................ 154<br />
Assisted Living Facilities, Nursing Homes, and Senior Programs........................ 156<br />
Parks and Recreation Facilities.............................................................................. 158<br />
Cemeteries.............................................................................................................. 163<br />
ii<br />
Table of Contents
Dams ...................................................................................................................... 165<br />
Other Government Facilities.................................................................................. 166<br />
Summary......................................................................................................................... 167<br />
Utilities and Community Facilities Maps ....................................................................... 168<br />
5. Agricultural, Natural, and Cultural Resources Information................................ 175<br />
Element Context.............................................................................................................. 175<br />
Agricultural Resources.................................................................................................... 177<br />
Local Agricultural Industry Trends ....................................................................... 177<br />
Prime Agricultural Lands ...................................................................................... 181<br />
Natural Resources – Physical Features........................................................................... 183<br />
Topography............................................................................................................ 183<br />
Bedrock Geology................................................................................................... 184<br />
Surface Geology .................................................................................................... 185<br />
Soils ....................................................................................................................... 186<br />
Mineral Resources ................................................................................................. 188<br />
Watersheds & Surface Waters............................................................................... 189<br />
Water Quality by Watershed ................................................................................. 189<br />
Impaired Waters .................................................................................................... 191<br />
Outstanding and Exceptional Resource Waters..................................................... 191<br />
Point Source Discharges........................................................................................ 192<br />
Groundwater .......................................................................................................... 193<br />
Natural Resources – Sensitive Lands.............................................................................. 194<br />
Shorelands ............................................................................................................. 194<br />
Floodplains ............................................................................................................ 195<br />
Wetlands ................................................................................................................ 195<br />
Steep Slopes........................................................................................................... 195<br />
Forests and Woodlands.......................................................................................... 196<br />
Grasslands and Prairie ........................................................................................... 198<br />
Wildlife, Wildlife Habitat and Open Space........................................................... 199<br />
Rare and Endanged Species and Natural Communities ........................................ 199<br />
State Natural Areas................................................................................................ 200<br />
<strong>Wisconsin</strong>’s Land Legacy Report.......................................................................... 200<br />
Parks and Recreational Resources......................................................................... 201<br />
Cultural Resources.......................................................................................................... 202<br />
Summary......................................................................................................................... 205<br />
Natural Resource Map Series.......................................................................................... 208<br />
6. Economic Development Information ...................................................................... 209<br />
Element Context.............................................................................................................. 209<br />
The <strong>Wisconsin</strong> Economy ................................................................................................ 209<br />
Recent Economic Trends ....................................................................................... 210<br />
The Current Economic Slowdown......................................................................... 211<br />
<strong>Wisconsin</strong>’s Economic Outlook ............................................................................ 213<br />
Barron County Economic Profile.................................................................................... 214<br />
Barron County Conditions and Trends Report<br />
iii
Economic Data ...................................................................................................... 214<br />
Demographic Overview ............................................................................... 215<br />
Population and Labor Force ......................................................................... 215<br />
Housing Market............................................................................................ 216<br />
Education...................................................................................................... 216<br />
Income and Wages ....................................................................................... 217<br />
Employment Trends ..................................................................................... 219<br />
Commuting Patterns..................................................................................... 221<br />
Economic Base ...................................................................................................... 222<br />
Industry Composition................................................................................... 222<br />
Employment by Industry.............................................................................. 223<br />
Employment by Occupation......................................................................... 227<br />
Employment Projections .............................................................................. 228<br />
Tourism.................................................................................................................. 232<br />
Environmentally Contaminated Sites ............................................................................. 234<br />
Summary......................................................................................................................... 235<br />
7. Land Use Information .............................................................................................. 241<br />
Element Context.............................................................................................................. 241<br />
Existing Land Use and Land Use Trends ....................................................................... 241<br />
Agricultural Land Use ........................................................................................... 242<br />
Forest Land Use..................................................................................................... 243<br />
Residential Land Use............................................................................................. 244<br />
Commercial Land Use........................................................................................... 245<br />
Industrial Land Use ............................................................................................... 245<br />
Land Demand and Prices ....................................................................................... 246<br />
Development Limitations................................................................................................ 247<br />
Shallow Depth to Bedrock..................................................................................... 247<br />
Shallow Depth to Groundwater ............................................................................. 247<br />
Limitations for Septic Systems.............................................................................. 247<br />
Limitations for Residential Basements.................................................................. 248<br />
Limitations for Small Commerical Buildings ....................................................... 248<br />
Summary......................................................................................................................... 249<br />
Land Use By Municipality Discussion ........................................................................... 251<br />
Town Land Use Summaries................................................................................... 251<br />
Village Land Use Summaries ................................................................................ 255<br />
City Land Use Summaries ..................................................................................... 256<br />
Land Use Tables ............................................................................................................. 257<br />
Municipality Land Use Maps.......................................................................................... 266<br />
Limitations to Development Maps......................................................................... 266<br />
Existing Land Use Maps........................................................................................ 266<br />
iv<br />
Table of Contents
List of Figures<br />
Figure 1.1 – Barron County Historical Population .............................................................3<br />
Figure 1.2 – County Population Distribution by Incorporated & Rural Residents.............5<br />
Figure 1.3 – County Components of Population Change ....................................................6<br />
Figure 1.4 – County Racial Population Characteristics.......................................................7<br />
Figure 3.1 – Crashes by Highway Type (1998-2007) .....................................................125<br />
Figure 4.1 – Typical Septic System .................................................................................137<br />
Figure 5.1 – Number and Average Size of Farms ...........................................................177<br />
Figure 6.1 – Composite Index of Leading Indicators for <strong>Wisconsin</strong> (1990-2008)..........210<br />
Figure 6.2 – Gasoline & Medical Costs Compared to Consumer Price Index ................212<br />
Figure 6.3 – Barron County Age/Labor Force Projection (2005-2030) ..........................216<br />
Figure 6.4 – Barron County vs. State Per Capita Personal Income (1997-2006) ............218<br />
Figure 6.5 – Barron County & <strong>Wisconsin</strong> Monthly Unemployment Rate (1990-2008) .219<br />
Figure 6.6 – Barron County Monthly Total Potential Labor Force (1990-2008) ............220<br />
Figure 6.7 – Barron County Travel Time to Work (1990, 2000) ....................................221<br />
Figure 6.8 – Barron County Employment by Industry (2006) ........................................224<br />
Figure 6.9 – <strong>West</strong> <strong>Central</strong> <strong>Wisconsin</strong> Workforce Development Area.............................228<br />
Figure 6.10 – Traveler Expenditures in Barron County (1998-2007) .............................233<br />
Figure 6.11 – Seasonality of Traveler Expenditures in Barron County (2007)...............233<br />
List of Tables<br />
Table 1.1 – County Historical Population..........................................................................15<br />
Table 1.2 – County and Surrounding Counties Historical Population Change .................15<br />
Table 1.3 – County Historical Population Change by Municpality...................................16<br />
Table 1.4 – County Components of Population Change ...................................................17<br />
Table 1.5 – County Historical Population by Age and Sex ...............................................17<br />
Table 1.6 – County Change in Age-Sex Structure.............................................................17<br />
Table 1.7 – Population by Age and Sex by Municipality (2000) ......................................18<br />
Table 1.8 – Population by Age and Sex by Municipality (1990) ......................................21<br />
Table 1.9A – Percent Change in Age/Sex Structure by Municipality (Males only)..........24<br />
Table 1.9B – Percent Change in Age/Sex Structure by Municipality (Females only) ......27<br />
Table 1.10 – Population Projections, County and Municpality.........................................30<br />
Table 1.11 – Household Projections, County and Municpality.........................................31<br />
Table 1.12A –<strong>West</strong> <strong>Central</strong> <strong>Wisconsin</strong> Region Occupation Projections (2014)...............32<br />
Table 1.12B – <strong>West</strong> <strong>Central</strong> <strong>Wisconsin</strong> Region Industry Projections (2004-2014)..........32<br />
Table 1.12C – Race Characteristics, County and Municipality.........................................33<br />
Table 1.13 – Educational Attainment Levels, County and Municipality ..........................34<br />
Table 1.14 – Labor Force, County and Municipality.........................................................42<br />
Table 1.15 – County Non-Farm Wage and Salary Employment .......................................45<br />
Table 1.16 – Employment by Industry, County and Municipality ....................................46<br />
Table 1.17 – Employment by Occupation, County and Municipality ...............................65<br />
Table 1.18 – Travel Time to Work by Municipality..........................................................78<br />
Table 1.19 – Place of Work, County and Municipality .....................................................78<br />
Table 1.20 – Households by Household Income by Municipality.....................................79<br />
Table 1.21 – Median Household Income (comparison of counties)..................................79<br />
Barron County Conditions and Trends Report<br />
v
Table 1.22 – Median Household Income (municipalities).................................................80<br />
Table 2.1 – Housing Units, County and Municipality.......................................................88<br />
Table 2.2 – Seasonal Units, County and Municipality ......................................................89<br />
Table 2.3 – Housing Characteristics by County ................................................................90<br />
Table 2.4 – Units in Structure, County and Municipality..................................................91<br />
Table 2.5 – Year Structure Built, County and Municipality..............................................92<br />
Table 2.6 – Housing Value of Specified Owner-Occupied Units, County and MCD.......93<br />
Table 2.7 – Contract Rent (Renter-Occupied Units), County and Municipality ...............94<br />
Table 2.8 – Owner-Occupied Housing Costs as Percentage of Household Income<br />
County and Municipality.................................................................................95<br />
Table 2.9 – Renter-Occupied Housing Costs as a Percentage of Household Income<br />
County and Municipality.................................................................................96<br />
Table 2.10 – Housing Unit Projections, County and Municipality....................................97<br />
Table 2.11 – Household Projections, County and Municipality........................................98<br />
Table 2.12 – Housing Characteristics by Municipality .....................................................99<br />
Table 3.1 – Road Mileage by Jurisdiction - 2008............................................................111<br />
Table 3.2 – Traffic Volume History (1992-2003) ..........................................................111<br />
Table 3.3 – Functionally Classificed Road Mileage by Municipality .............................115<br />
Table 3.4 – WisDOT 6-year Plan project for Barron County..........................................116<br />
Table 3.5 – Ownership of Bridges in Barron County......................................................117<br />
Table 3.6 – Functionally Obsolete/Structurally Deficient Bridges, Barron County........118<br />
Table 3.7 – Barron County Crash History (1998-2007) ..................................................125<br />
Table 3.8 – Highway Crashes by Municipality (2003-2007) ..........................................126<br />
Table 3.9 – Commuting Patterns of Barron County Residents by Municipality.............128<br />
Table 3.10 – Major Airport Improvement Projects .........................................................130<br />
Table 4.1 – Municipal Wastewater Systems in Barron County.......................................136<br />
Table 4.2 – Municipal and Community Water Systems in Barron County.....................139<br />
Table 4.3 – Telephone Providers in Barron County ........................................................143<br />
Table 4.4 – Private Schools in Barron County ................................................................145<br />
Table 4.5 – Public Schools in Barron County..................................................................146<br />
Table 4.6 – Enrollment of UW Campuses in <strong>West</strong> <strong>Central</strong> <strong>Wisconsin</strong>...........................148<br />
Table 4.7 – Clinics and Hospitals in Barron County .......................................................154<br />
Table 4.8 – Licensed Child Care Facilities in Barron County.........................................155<br />
Table 4.9 – Assisted Living Facilities in Barron County.................................................158<br />
Table 4.10 – Primary Parks in Barron County.................................................................161<br />
Table 5.1 – Acres in Farmland.........................................................................................178<br />
Table 5.2 – Number of Farms by Ownership ..................................................................178<br />
Table 5.3 – Assessed Agricultural Parcels and Acreage, County and Municipality .......179<br />
Table 5.4 – Soil Capability Classification for Agricultural Lands ..................................182<br />
Table 5.5 – Outstanding and Exceptional Waters............................................................191<br />
Table 5.6 – Permitted Municipal and Industrial Discharges............................................192<br />
Table 5.7 – Assessed Forest Parcels and Acreage, County and Town ............................197<br />
Table 5.8 – State Natural Areas .......................................................................................200<br />
Table 5.9 – Parks and Recreational Lands.......................................................................201<br />
Table 5.10 – State Public Wildlife Recreational Lands...................................................202<br />
vi<br />
Table of Contents
Table 5.11 – Site and Structures on the National Register of Historic Places.................203<br />
Table 5.12 – Architectural and History Inventory Listings .............................................204<br />
Table 6.1 – Barron County Educational Attainment (1990,2000)...................................217<br />
Table 6.2 – Barron County Average Annual Wages by Industry (2001-2006)...............218<br />
Table 6.3 – Barron County Number of Establishments by Industry (1998-2006)...........222<br />
Table 6.4 – Barron County Employment by Industry (2001-2006).................................223<br />
Table 6.5 – Barron County Top Employers as of March 2007........................................225<br />
Table 6.6 – <strong>West</strong> <strong>Central</strong> Wi. Estimated Employment and Salary by Occup. (2004).....227<br />
Table 6.7 – <strong>West</strong> <strong>Central</strong> Wi. Industry Projections (2004-2014) ....................................229<br />
Table 6.8 – <strong>West</strong> <strong>Central</strong> Wi. Occupation Projections and Est. Wages (2004-2014) .....230<br />
Table 6.9 – <strong>West</strong> <strong>Central</strong> Wi. Occupation Projections (2014) ........................................231<br />
Table 6.10 – Contaminated Sites in Barron County ........................................................237<br />
Table 7.1 – County Land Use, 2007 ................................................................................242<br />
Table 7.2 – Acreage Loss of Land Assessed Agricultural by Municipality ....................242<br />
Table 7.3 – Percentage Loss of Land Assessed Agricultural by Municipality................243<br />
Table 7.4 – Most Agricultural Acres by Municipality.....................................................243<br />
Table 7.5 – Assessed Residential Acres, County and Municipality ................................257<br />
Table 7.6 – Assessed Commercial Acres, County and Municipality ..............................258<br />
Table 7.7 – Assessed Industrial Acres, County and Municipality...................................259<br />
Table 7.8 – Assessed Agricultural Parcels and Acreage, County and Municipality .......260<br />
Table 7.9 – Assessed Forest Parcels and Acreage by Town............................................261<br />
Table 7.10 – Land Use Acreage, County and Municipality ............................................262<br />
Table 7.11 – Agricultural Land Sales ..............................................................................263<br />
Table 7.12 – Forested Land Sales....................................................................................264<br />
Table 7.13 – Land Value Per Acre by Town ...................................................................264<br />
Table 7.14 – Land Value Per Acre by City or Village.....................................................265<br />
Barron County Conditions and Trends Report<br />
vii
List of Maps<br />
1.1 – Barron County Locational Map ..................................................................................1<br />
1.2 – Barron County Population Change 1970-2000...........................................................4<br />
1.3 – Barron County Population Projections 2000-2025...................................................11<br />
2.1 – Barron County Housing Unit Change 1970-2000 ..................................................108<br />
3.1 – County Roads, Airports, and Railroads ..................................................................110<br />
3.2 – County Rural Functional Classification..................................................................113<br />
3.3 – Urban Functional Classification – City of Rice Lake.............................................114<br />
3.4 – Rustic Roads in the County ....................................................................................118<br />
3.5 - Bicycling Conditions Assessment ..........................................................................122<br />
3.6 – Barron County Bicycling Routes............................................................................123<br />
3.7 – Railroad Ownership in <strong>West</strong> <strong>Central</strong> <strong>Wisconsin</strong> ....................................................128<br />
4.1 – Vocational Districts in the Region .........................................................................147<br />
4.2 – Electric Service in <strong>West</strong> <strong>Central</strong> <strong>Wisconsin</strong> ...........................................................168<br />
4.3 – Natural Gas Service in <strong>West</strong> <strong>Central</strong> <strong>Wisconsin</strong> ....................................................169<br />
4.4 – Barron County School Districts..............................................................................170<br />
4.5 – Barron County Fire Districts...................................................................................171<br />
4.6 – Barron County Ambulance Service Areas..............................................................172<br />
4.7 – Barron County First Responder Service Areas.......................................................173<br />
Appendix A: Barron County Resource and Development Limitations Maps<br />
5.1 – Agricultural Lands<br />
5.2 – Prime Farmland<br />
5.3 – Soil Capability for Common Agricultural Crops<br />
5.4 – Elevation<br />
5.5 – General Soil Associations<br />
5.6 – Potential Sand and Gravel Deposits<br />
5.7 – Water Resources<br />
5.8 – Watersheds<br />
5.9 – Groundwater Contamination Susceptibility Model (GCSM)<br />
5.10 – Floodplain (100-year) and Frequently Flooded Soils<br />
5.11 – Wetlands<br />
5.12 – Steep Slopes<br />
5.13 – Forested Areas<br />
5.14 – Grasslands<br />
5.15 – Endangered Species and Natural Communities<br />
7.1 – Shallow Depth to Bedrock<br />
7.2 – Shallow Depth to Groundwater<br />
7.3 – Limitations for Septic Systems<br />
7.4 – Limitations for Residential Basements<br />
7.5 – Limitations for Small Commercial Buildings<br />
viii<br />
Table of Contents
Barron County Resource and Land Use Atlas DvD-ROM<br />
Description of Maps........................................................................for all maps in the Atlas<br />
Base Maps........................................................... for cities, villages, and towns in the Atlas<br />
Agricultural Lands (cultivated fields)............................. for County and towns in the Atlas<br />
Prime Farmland............................................................... for County and towns in the Atlas<br />
Elevation .............................................................................for all communities in the Atlas<br />
General Soil Associations............................................... for County and towns in the Atlas<br />
Potential Sand & Gravel Deposits ............................. for all County and towns in the Atlas<br />
Surface Water Resources ....................................................for all communities in the Atlas<br />
Watersheds........................................................................................for County in the Atlas<br />
Groundwater Contamination Susceptibility Model ..........................for County in the Atlas<br />
Floodplains (100-year) & Frequently Flooded Soils ..........for all communities in the Atlas<br />
Wetlands .............................................................................for all communities in the Atlas<br />
Steep Slopes........................................................................for all communities in the Atlas<br />
Forested Areas ................................................................ for County and towns in the Atlas<br />
Shallow Depth to Bedrock..................................................for all communities in the Atlas<br />
Shallow Depth to Groundwater ..........................................for all communities in the Atlas<br />
Limitations for Septic Systems ...........................................for all communities in the Atlas<br />
Limitations for Residential Basements ...............................for all communities in the Atlas<br />
Limitations for Small Commercial Buildings.....................for all communities in the Atlas<br />
Endangered Species and Natural Communities................................for County in the Atlas<br />
Town Land Use & Land Cover (2000) ..............................................for towns in the Atlas<br />
Village & City Land Use (2000)......................................for villages and cities in the Atlas<br />
Barron County Conditions and Trends Report<br />
ix
x<br />
Table of Contents
Barron County Conditions and Trends Report<br />
xi
1. ISSUES AND OPPORTUNITIES INFORMATION<br />
Introduction<br />
The County Setting<br />
Barron County is located in the Indianhead region of west central <strong>Wisconsin</strong>. The county<br />
is bordered on the north by Burnett and Washburn Counties, the west by Polk County, the<br />
east by Rusk County and the south by Dunn and Chippewa Counties. Barron County has<br />
a combined land and water area of approximately 863 square miles. The county is square,<br />
and approximately 30 miles east to west and north to south.<br />
Map 1.1 Barron County Locational Map<br />
Barron County is part of the <strong>Central</strong> Plain, <strong>West</strong>ern Upland and Northern Highland<br />
physiographic provinces of <strong>Wisconsin</strong>. The region’s surface topography varies from<br />
rolling plains to rugged hills and escarpments. The glaciers pushed through this area<br />
leaving only a portion of southwest <strong>Wisconsin</strong>, southeast Minnesota, northern Illinois and<br />
northwest Iowa untouched on their southward march.<br />
Pitted glacial outwash that formed numerous lakes, wetlands and areas of uneven<br />
topography characterize the northern part of the County. A series of glacial end moraines<br />
rim the western, northern and eastern edges of the county. The area between the moraines<br />
is quite level and comprises much of the County’s best agricultural land.<br />
Barron County Existing Conditions Report 1
Blue Hills, the County’s highest elevation point, is 500 meters above sea level and is<br />
located in the east-northeast part of the County.<br />
Barron County is almost entirely in the Lower Chippewa River Basin. A small part of<br />
western and northwestern Barron County lies within the St. Croix River Basin. Numerous<br />
tributaries running into the Hay, Red Cedar and Yellow Rivers drain the County. There<br />
are also numerous lakes in the northern half of the County and around the City of Chetek.<br />
Within Barron County there are 25 unincorporated towns, seven villages and four cities.<br />
<strong>Central</strong>ly located in the County, the City of Barron is also the county seat. The story of<br />
the County’s people is subsequently told in the socio-economic section.<br />
Major transportation corridors include U.S. Highway 53, which runs through the east half<br />
of the County north from the southeastern corner and south from the north central border;<br />
U.S. Highway 8, which bisects the County running east and west; U.S. Highway 63,<br />
which is found in the northwestern corner of the County; State Trunk Highway 48, which<br />
runs generally west and east across the County’s northern half; and State Trunk Highway<br />
25, which runs north up the center of the County from the City of Menomonie in Dunn<br />
County, through Barron, and ends at State Trunk Highway 48 between the Cities of<br />
Cumberland and Rice Lake. Numerous county trunk highways distribute traffic to a<br />
relatively fine network of town roads.<br />
Nearby major urban areas include the Minneapolis-St. Paul metropolitan area to the<br />
southwest and the Eau Claire-Chippewa Falls area to the southeast. Although Barron<br />
County is not adjacent to either urban area, County development has been directly<br />
influenced by these areas, especially in shoreland areas.<br />
Element Context<br />
The Issues and Opportunities Element follows an approach similar to that described<br />
above. A socio-economic profile for all of Barron County is provided, which provides a<br />
demographic context for developing the individual community plans.<br />
Overall comprehensive planning goals and objectives for the County are not provided in<br />
this section; instead, each community comprehensive plan will contain its own individual<br />
vision, goals and objectives. Existing governmental programs and policies are also not<br />
provided here, but are reviewed in the Addendum: Inventory of Existing Plans, Programs,<br />
& Land Use Policies in <strong>West</strong> <strong>Central</strong> <strong>Wisconsin</strong>.<br />
2 Issues and Opportunities Information
Socio-Economic Profile<br />
Population<br />
Analyzing population size, growth, density, characteristics and distribution trends reveals<br />
important facts about the most important component of growth and development in<br />
Barron County ⎯ its residents. Reviewing population characteristics will reveal<br />
important indicators of change that must be recognized to effectively prepare for change.<br />
From 1920 to 1970, Barron County’s population remained nearly unchanged. From 1970<br />
to 2000, the County’s population increased by 11,008 people, or 32.4 percent, though<br />
such substantial growth was not uncommon for the region (see Figure 1.1 below, and<br />
Table 1.1 and 1.2 at the end of this section).<br />
Figure 1.1<br />
Barron County Historical Population 1900 to 2007<br />
50,000<br />
45,000<br />
40,000<br />
35,000<br />
Population<br />
30,000<br />
25,000<br />
20,000<br />
15,000<br />
10,000<br />
5,000<br />
0<br />
1900 1910 1920 1930 1940 1950 1960 1970 1980 1990 2000 2007<br />
Year<br />
source: U.S. Census Bureau; <strong>Wisconsin</strong> Department of Administration 2007 estimate<br />
From 1990 to 2000, the Town of Maple Plain had the highest rate of population growth<br />
as a percentage of its population in Barron County at 43.6 percent (see Table 1.3 at end of<br />
section). The following communities also had high rates of population growth:<br />
Towns of Cedar Lake 27.4%<br />
Rice Lake 22.4%<br />
Vance Creek 22.3%<br />
Lakeland 22.1%<br />
Prairie Lake 21.3%<br />
Dovre 21.2%<br />
Village of Turtle Lake 23.2%<br />
Village of Cameron 21.5%<br />
Barron County Conditions and Trends Report 3
Map 1.2<br />
Barron County Population Change 1970 to 2000<br />
4 Issues and Opportunities Information
The rate of growth for Turtle Lake increases to 30.5 percent when including the portion<br />
of the community within Polk County. In terms of actual population increases, the Town<br />
of Rice Lake had the largest number of new residents (553) between 1990 and 2000.<br />
Three villages ⎯ New Auburn, Dallas and Haugen ⎯ saw substantial population<br />
decreases between 1990 and 2000 of -42.4 percent, -21.2 percent and -5.9 percent,<br />
respectively. It should be noted that only a small portion of the Village of New Auburn<br />
lies within Barron County, and the large percentage decrease represents an actual loss of<br />
only 11 residents.<br />
During the 1990s, the unincorporated areas of Barron County accounted for 67 percent of<br />
its total population growth, adding 2,847 new residents, a substantial increase from the<br />
trends of the 1980s.<br />
Map 1.2 shows the population change for Barron County communities between 1970 and<br />
2000. The highest growth during this period occurred in the Towns of Cedar Lake,<br />
Stanley, Rice Lake and Chetek, and the Village of New Auburn. The Towns of<br />
Lakeland, Maple Plain and Prairie Lake, and the Villages of Almena, Cameron and Turtle<br />
Lake also saw significant growth. The Towns of Stanfold and Turtle Lake, and the<br />
Village of Dallas lost population overall during the period.<br />
Components of the Population<br />
According to the 2000 Census, for the first time in recent history, rural non-farm<br />
residents surpassed the number of residents living in cities and villages (see Figure 1.2).<br />
Figure 1.2<br />
County Population Distribution by Incorporated & Rural Residents, 1960 to 2000<br />
60<br />
Percent of Total Population<br />
50<br />
40<br />
30<br />
20<br />
10<br />
0<br />
1960 1970 1980 1990 2000<br />
Year<br />
City or Village Rural Farm Rural Non-Farm<br />
source: U.S. Census Bureau<br />
Barron County Conditions and Trends Report 5
The number of rural farm residents continued to decrease, constituting only 6.9 percent of<br />
the County’s population in 2000, a decrease of approximately 75 percent (or 9,086 farm<br />
residents) since 1960.<br />
The 1970s and 1990s are the only two recent decades in which the population increase in<br />
Barron County has been primarily from in-migration of new residents (see Table 1.4 and<br />
Figure 1.3). The natural increase rate for the 1990s was at a 50-year low for the county.<br />
Figure 1.3<br />
Barron County Components of Population Change 1950 to 2000<br />
6,000<br />
4,000<br />
2,000<br />
People<br />
0<br />
-2,000<br />
1950-60 1960-70 1970-80 1980-90 1990-00<br />
-4,000<br />
-6,000<br />
Year<br />
Natural Increase<br />
Net Migration<br />
source: U.S. Census Bureau<br />
The average age of Barron County residents increased 4.3 years from 1990 to 2000 to<br />
38.8 years (see Table 1.5). Population in the 0-9 and 25-34 age groups decreased over the<br />
past decade (see Table 1.5 and Table 1.6). The 15-19 and middle-age groups (35-60)<br />
increased substantially during 1990s, with a very large population increase of 62 percent<br />
in the 45-54 age group.<br />
The 1990 and 2000 age-by-sex breakdowns for each municipality in Barron County are<br />
included at the end of this section in Table 1.7 and 1.8. Table 1.9, also at the end of this<br />
section, shows the percentage change from 1990 to 2000 for each municipality by agesex<br />
group.<br />
Overall, Barron County’s population is relatively homogenous, with only 97.4 percent of<br />
the population in the white, non-Hispanic ethnic group. Figure 1.4 shows the distribution<br />
of the population by race for the other 2.6 percent of the population (representing 1,161<br />
persons). During the past decade, the population in all racial groups increased, with the<br />
Hispanic or Latino group increasing most to become the largest minority population in<br />
Barron County.<br />
6 Issues and Opportunities Information
Figure 1.4<br />
Barron County Racial Population Characteristics 1990 to 2000<br />
People<br />
500<br />
450<br />
400<br />
350<br />
300<br />
250<br />
200<br />
150<br />
100<br />
50<br />
0<br />
Black<br />
American<br />
Indian<br />
Asian<br />
Year<br />
White<br />
Hispanic<br />
Other<br />
1990 2000<br />
source: U.S. Census Bureau<br />
Educational Attainment<br />
The Decennial Census provides information on educational attainment levels, which are<br />
listed in Table 1.13. All Barron County communities saw a greater percentage of<br />
residents 25 years or older with high school or higher education levels in 2000 than in<br />
1990. These indicators certainly demonstrate a well-educated population.<br />
It should be no surprise with the large investments in education and the increasing<br />
requirement for technical or post-secondary degrees for job placement that larger<br />
numbers of people are pursuing higher education. Barron County communities have had<br />
a significant percentage of people who have attained high school or higher educational<br />
levels (82 percent in 2000). Since 1990, more Barron County residents have pursued<br />
post-secondary education. In 2000, 43 percent of Barron County residents 25 years or<br />
older had attended a post-secondary institution, with 24 percent achieving a degree.<br />
Employment<br />
The area’s current economic growth is a major contributor to the employment<br />
opportunities available to Barron County residents. The principal economic factors that<br />
influence an individual's quality of life and provide a choice of residential options are<br />
employment opportunities and income. A comparison of labor force and employment<br />
statistics for 1990 to 2000 provides some insight into the economic well-being of Barron<br />
County community residents.<br />
Barron County Conditions and Trends Report 7
Personal income is derived primarily from employment wages. An individual's<br />
occupation determines the range of that wage scale and influences the personal standard<br />
of living. A comparison of the occupations of those employed in the labor force helps to<br />
determine the economic affect of the employment opportunities available to area<br />
residents, and the ability to increase their standard of living.<br />
While the segment of the population eligible for the labor force in Barron County grew<br />
by nearly 15 percent between 1990 and 2000 (Table 1.14), the actual number in the labor<br />
force increased by 20 percent. The employed residents in the labor force increased by 22<br />
percent over the same period, while the percentage of unemployed residents decreased by<br />
almost 3 percentage points. Based on these statistics, it appears that a growing number of<br />
County residents had been finding employment opportunities in the 1990s. The economic<br />
downturn early in the decade starting in 2000 makes it uncertain how the labor force and<br />
employment has been affected in Barron County; however, in Table 1.15 we can see<br />
indicators in employment for Barron County that may reveal the recent economic<br />
slowdown, but not the present apparent economic recovery.<br />
The Census Bureau collects place-of-residence employment data. This means these data<br />
can tell us in what industries or occupations the residents of Barron County communities<br />
work, but not where they work. Table 1.16 at the end of this section compares the<br />
industries in which Barron County residents worked between 1990 and 2000. Between<br />
1990 and 2000, Barron County residents were increasingly employed in Construction,<br />
and Educational, Health and Social Services industries. Manufacturing employment,<br />
while increasing in number, remained fairly steady as a percentage of total employment.<br />
Perhaps surprising is the steady decrease in County residents’ employment in the Retail<br />
Trade industry found in the Census. As seen in Table 1.15, Retail Trade employment<br />
within Barron County increased steadily throughout the 1990s. It is likely that there is<br />
either a discrepancy between the data sources, or workers outside of the County are<br />
increasingly filling much of the retail employment in Barron County. Table 1.17 shows in<br />
what occupations Barron County residents were employed as opposed to the industries<br />
depicted in Table 1.16. Barron County communities experienced very little change in<br />
residents’ occupations, except for Farming, Forestry and Fishing, which decreased by 72<br />
percent between 1990 and 2000, and Sales, Administrative Support and Service<br />
occupations, which increased by 38 percent.<br />
Table 1.15 shows Barron County non-farm employment. As previously mentioned, these<br />
data could indicate whether the economic downturn in the early part of the decade<br />
starting in the year 2000 is having an impact on Barron County communities. Although<br />
one cannot see what is happening in each municipality, one could infer that the trend<br />
defined for Barron County is likely to show changes in employment opportunities for the<br />
residents of most Barron County communities. After steady employment growth in the<br />
1990s, a decrease in employment is evident since 2000, most likely reflecting the national<br />
economic downturn. The available data is not current enough to indicate the impact of the<br />
current economic recovery in Barron County.<br />
8 Issues and Opportunities Information
Although the Decennial Census’s standard available information limits employment<br />
information to place of residence, it also provides information that can indicate Barron<br />
County’s commuting characteristics. Table 1.18 shows how long it took Barron County<br />
residents to get to work in 1990 and 2000. During this period, the percentage of residents<br />
who worked at home or commuted less than 20 minutes decreased, while the percentage<br />
of residents who commuted 20 minutes or more increased. The percentage of residents<br />
who commuted less than 20 minutes to work decreased by 11 percent between 1990 and<br />
2000, while the percentage of residents who commuted 20 minutes or more to work<br />
increased by 37 percent Between 1990 and 2000, the actual number of residents<br />
commuting less than 20 minutes to work increased by 8 percent, while those taking 20<br />
minutes or more to get to work increased by almost 70 percent.<br />
In general, Barron County residents are experiencing even longer commutes to work.<br />
This is important, in part because it is one indicator of the use of the existing<br />
transportation infrastructure. For example, growing commute times, coupled with a<br />
growing population, results in an increased demand for road maintenance and expansion.<br />
It is uncertain if this trend will continue with recent increases in energy prices.<br />
Studying the special distribution of workers and employment centers is helpful with<br />
economic development efforts and transportation infrastructure management. The Census<br />
information that reveals actual commuting patterns is called Place of Residence / Place of<br />
Work shown in Table 1.19. The 1990 data is slightly different than the 2000 data. In<br />
1990, these data were released for 20 places of work for Barron County residents. The<br />
1990 20 places limit discovery of all the places of work whereas those data for 2000<br />
actually lists all places of work. However, the 2000 data were compiled for comparison<br />
with the 1990 20 places.<br />
Of the Barron County residents reporting their place of work, the percentage working<br />
within Barron County decreased by 6 percent between 1990 and 2000. In 1990, about 39<br />
percent of the workers living in the County worked in the City of Rice Lake, 17 percent<br />
in the City of Barron and about 46 percent in the remainder of Barron County. In 2000,<br />
about the same percentages worked in those communities. There were significant<br />
increases between 1990 and 2000 in the number of Barron County residents who worked<br />
in Eau Claire (228 percent) and Chippewa Falls (168 percent). In 1990, 91 percent of<br />
Barron County residents worked within Barron County, but by 2000, 86 percent of<br />
Barron County workers still worked within Barron County.<br />
Income<br />
The combined effect of advanced education and increased employment opportunities, and<br />
evidence of well-paying occupations, is also reflected in the earning capability and<br />
increasing incomes of Barron County residents. Table 1.20 shows household income<br />
distribution for Barron County households in 1989 and 1999. Table 1.21 shows the<br />
changes in income of Barron County and surrounding County residents between 1990<br />
and 2000. Finally, Table 1.22 shows the median household income for all Barron County<br />
communities.<br />
Barron County Conditions and Trends Report 9
Household income is the sum of money income received in the calendar year before the<br />
Decennial Census is collected by all household members 15 years old and over, including<br />
household members not related to the householder, people living alone, and other nonfamily<br />
household members. Included in the total are amounts reported separately for<br />
wage or salary income; net self-employment income; interest, dividends, or net rental or<br />
royalty income or income from estates and trusts; Social Security or Railroad Retirement<br />
income; Supplemental Security Income (SSI); public assistance or welfare payments;<br />
retirement, survivor, or disability pensions; and all other income. The median is the<br />
mathematically derived middle value with 50 percent above and 50 percent below that<br />
number.<br />
It can be seen from Table 1.21 that Barron County is average when compared to the<br />
incomes of surrounding counties. Certainly counties with, or closer to, larger urban<br />
centers have a greater “economic engine” that provides employment opportunities and<br />
resultant higher income. Those counties with lower incomes all have smaller urban<br />
centers or are further away from significant employment centers such as the Twin Cities.<br />
The data indicates that incomes for Barron County community residents are increasing<br />
faster than inflation; however, the County median household income is below that of the<br />
State of <strong>Wisconsin</strong> as a whole. It can also be seen that the median household income in<br />
12 communities is below the County median household income, including almost all<br />
cities and villages, while nine communities have median household incomes higher than<br />
that of the state as a whole.<br />
Population Projections<br />
Population projections have long been used to assess development prospects and<br />
community facility needs created by population growth. Small area population forecasts<br />
can be used to evaluate potential residential development and economic conditions, and<br />
the level of demand for public facilities and services. Businesses, schools and<br />
government frequently use these forecasts to determine the future needs or design of<br />
public facilities or services. This estimate of future growth is also valuable information<br />
for establishing management techniques to guide orderly growth and development.<br />
Projecting population is not a science in which absolutes can be placed. Consequently,<br />
there are limitations that should be remembered when reviewing and evaluating these<br />
forecasts. These limitations include:<br />
<br />
<br />
<br />
Population projections are based on historical trends of population growth that are<br />
extended into the future, and the assumption that those trends, and the factors behind<br />
them, will continue to some point in time.<br />
Forecasts of large area populations (e.g., states or counties) are more reliable. The<br />
smaller the area for which a projection is produced, like an individual community, the<br />
greater the possibility for error.<br />
The closer the projection year is to the base year; the more likely the population for<br />
that projection will be close to the true population.<br />
10 Issues and Opportunities Information
Population projections are, at best, guides and their limitations must be considered.<br />
Intimate knowledge of local conditions can help build local variables into population<br />
projections to enhance their validity.<br />
Map 1.3<br />
Barron County Population Projections 2008 to 2030<br />
The <strong>Wisconsin</strong> Department of Administration (DOA) population projections are, by State<br />
statute, the official population projections for <strong>Wisconsin</strong>. Pre-release versions of updated<br />
Barron County Conditions and Trends Report 11
DOA projections were made available in October 2008 for research and analysis. From<br />
2000 to 2030, the DOA projections predict a 20.2 percent increase in the Barron County<br />
population (about 9,100 more residents). The percentage increases within the cities are<br />
anticipated to be substantially lower on average than the villages and towns (see Table<br />
1.10). Map 1.3 provides a picture of projected population change by municipality from<br />
2008 to 2030. The largest rates of increase are expected in the Towns of Cedar Lake,<br />
Dovre, Lakeland, Maple Plain, Prairie Lake, Rice Lake, Stanley and Sumner, and in the<br />
Villages of Almena, Cameron and New Auburn. Decreases in population are projected<br />
for the Towns of Barron, Oak Grove, Prairie Farm and Stanfold, and the Villages of<br />
Dallas and Haugen.<br />
Household Projections<br />
A household forecast is used to help develop housing and land use forecasts. The<br />
<strong>Wisconsin</strong> Department of Administration, Demographic Services has prepared household<br />
projections for year 2000 to 2030 in five-year increments found in Table 1.11.<br />
Employment Projections<br />
In May 2008, the <strong>Wisconsin</strong> Department of Workforce Development (WDWD) Office of<br />
Economic Advisors (OEA) released a series of publications entitled OEA 2006-2016<br />
Statewide Long-term Projections. In addition, a WDWD, OEA report entitled<br />
Occupation Projections for <strong>West</strong> <strong>Central</strong> <strong>Wisconsin</strong> Workforce Development Area, 2004-<br />
2014 was also released in August of 2006. These reports make economic projections<br />
regarding the State’s labor force, industries and occupations.<br />
Municipal units within Barron County have employment patterns that are similar to the<br />
State. It is expected that during the next several years, <strong>Wisconsin</strong>’s population is<br />
projected to grow slower and older than the nation as a whole, therefore leading to lower<br />
participation rates in the workforce. <strong>Wisconsin</strong> is also having difficulty attracting<br />
domestic migrants and retaining its own citizens. However, international immigrants are<br />
increasing significantly. <strong>Wisconsin</strong> will continue to face the challenge of filling job<br />
openings. The industries that are projected to add the most jobs from 2006-2016 are<br />
ambulatory health care services, administrative and support services, eating and drinking<br />
establishments, hospitals, social assistance and professional, scientific and technical<br />
services. The top six occupations in <strong>Wisconsin</strong> with the greatest expected job growth for<br />
2006-2016 are retail salespersons (32,400); cashiers (31,400); waiters/waitresses<br />
(30,900); registered nurses (21,800); customer service representatives (21,000); and<br />
combined food preparation/serving workers (20,800). For further labor force and<br />
economic base indicators refer to Section 6, Economic Development Element.<br />
Table 1.12A presents employment and wage projections by the top 10 occupations for the<br />
<strong>Wisconsin</strong> Department of Workforce Development <strong>West</strong> <strong>Central</strong> <strong>Wisconsin</strong> Region. This<br />
represents the occupation opportunities available for Barron County residents. The<br />
greatest demand for workers is in the occupations on the ‘Most Openings’ list. This list<br />
includes many occupations considered as first-time, or temporary, jobs that workers often<br />
12 Issues and Opportunities Information
leave as other opportunities open up. Turnover is high and wages are low. There is one<br />
exception on the list: registered nurses which requires a greater degree of education or<br />
training and reflects a higher wage scale.<br />
The ‘Fastest Growth’ occupations are often referred to as hot jobs, with more training<br />
requirements and better wages. There are often fewer openings in these jobs since the list<br />
is based on the greatest percent change in employment; for example, an occupation that<br />
increases from 5 to 10 jobs increased 100 percent, whereas an occupation that increases<br />
from 2,000 to 2,200 jobs increased only 10 percent.<br />
Table 1.12B shows employment projections by industry for the <strong>West</strong> <strong>Central</strong> <strong>Wisconsin</strong><br />
Region. The greatest potential growth for employment appears to be in health and<br />
education related fields, while computer and electronic product manufacturing appears to<br />
be at risk of losing employment. Information and professional services, and the leisure<br />
and hospitality industry have the potential to add significant employment by 2014.<br />
Summary<br />
Certain trends become apparent after reviewing the countywide demographic and<br />
economic information. Studying these trends and their implications on local quality of<br />
life will be useful in guiding public decision making. Since 1970, Barron County has<br />
experienced steady yet moderate population growth; however, being one-County<br />
removed from adjacency to Minnesota, it is clear that the influence of the Minneapolis/St.<br />
Paul Metropolitan Area is not as great as in Polk and St. Croix counties. In addition,<br />
because Barron County does not have as much lake country as Burnett, Sawyer and<br />
Washburn counties, they perhaps have experienced more growth in retirees converting<br />
lake homes into permanent dwellings. At the same time it is likely that even as more<br />
seasonal (recreational) dwelling units are converted to permanent dwellings there will be<br />
continued recreational development.<br />
Since 1960, the distribution of the population between urban and rural dwellers in Barron<br />
County has remained quite constant; however, amongst the rural population there has<br />
been a transformation from a largely farm population to a rural non-farm population.<br />
Significant rural development can be expected to continue, with the possibility of a shift<br />
occurring in the urban/rural mix, with an increasing percentage of the County’s<br />
inhabitants living in the rural areas.<br />
Since 1970, there also has been a net in-migration into Barron County that exceeded the<br />
natural increase over that period and marks a change from at least two decades of net outmigration.<br />
It is clear that the national trend of an aging population is reflected in Barron County.<br />
Large numbers of people will be achieving retirement age over the next 20 years. While<br />
the Barron County population will be aging, it will also be changing its racial and ethnic<br />
characteristics. The County’s Hispanic and Asian population can be expected to continue<br />
to increase significantly.<br />
Barron County Conditions and Trends Report 13
Barron County residents have become more educated over the past several decades.<br />
Without adequate employment opportunities this can lead to the loss of increasingly wellqualified<br />
individuals moving to other areas offering those opportunities. Barron County<br />
has apparently somewhat stemmed the tide of potential “brain drain” as in-migration rates<br />
appear high, local employment is fairly strong and more jobs can be easily accessed by<br />
increasing mobility. Employment growth indicators and commuting patterns show that to<br />
be likely.<br />
Overall, the previously analyzed trends reveal that Barron County will continue to be<br />
relatively vigorous and its communities will face several challenges as a result. Over the<br />
next several sections of this Conditions and Trends Report, other factors that affect<br />
Barron County communities will be explored. With further analysis of these following<br />
sections it is hoped that a clear picture of where Barron County has been, and is now, will<br />
emerge. This will help communities frame the issues that face them, the changes that are<br />
likely to impact them and the ways they can address those changes to achieve the<br />
community character they desire.<br />
14 Issues and Opportunities Information
Data Tables<br />
Table 1.1<br />
Barron County Historical Population 1900 to 2000<br />
Year<br />
Population<br />
1900 23,677<br />
Numerical<br />
Change<br />
Percent<br />
Change<br />
1910 29,114 5,437 23.0<br />
1920 34,281 5,167 17.7<br />
1930 34,301 20 0.1<br />
1940 34,289 -12 -0.03<br />
1950 34,703 414 1.2<br />
1960 34,270 -433 -1.2<br />
1970 33,955 -315 -0.9<br />
1980 38,730 4,775 14.1<br />
1990 40,750 2,020 5.2<br />
2000 44,963 4,213 10.3<br />
source: U.S. Census Bureau<br />
Table 1.2<br />
Barron County and Surrounding Counties Historical Population Change 1960 to 2000<br />
1960 to 1970 1970 to 1980 1980 to 1990 1990 to 2000<br />
County No. Pct. No. Pct. No. Pct. No. Pct.<br />
Barron County -315 -0.9 4,775 14.1 2,020 5.2 4,213 10.3%<br />
Burnett County 62 0.7 3,064 33.0 744 6.0 2,590 19.8%<br />
Chippewa County 2,621 5.8 4,410 9.2 233 0.4 2,835 5.4%<br />
Dunn County 2,998 11.5 5,160 17.7 1,595 4.7 3,949 11.0%<br />
Polk County 1,698 6.8 5,685 21.3 2,422 7.5 6,546 18.8%<br />
Rusk County -556 -3.8 1,351 9.5 -510 -3.3 268 1.8%<br />
Sawyer County 195 2.1 3,173 32.8 1,338 10.4 2,015 14.2%<br />
St. Croix County 5,190 17.8 8,908 25.9 6,989 16.2 12,904 25.7%<br />
Washburn County 300 2.9 2,573 24.3 598 4.5 2,264 16.4%<br />
source: U.S. Census Bureau<br />
Barron County Conditions and Trends Report 15
Table 1.3<br />
Barron County Historical Population and Population Change, 1960 to 2008, by MCD<br />
Towns<br />
Year<br />
Percent Change<br />
1960 1970 1980 1990 2000 2008 ‘60-‘70 ‘70-‘80 ‘80-‘90 ‘90-‘00 ‘00-‘08<br />
Almena 673 731 776 773 910 991 8.6 6.2 -0.4 17.7 8.9<br />
Arland 716 605 692 609 670 710 -15.5 14.4 -12.0 10.0 6.0<br />
Barron 940 893 977 1,015 1,014 998 -5.0 9.4 3.9 -0.01 -1.6<br />
Bear Lake 452 426 521 530 587 646 -5.8 22.3 1.7 10.8 10.1<br />
Cedar Lake 379 423 617 741 944 1,120 11.6 45.9 20.1 27.4 18.6<br />
Chetek 886 918 1,210 1,446 1,686 1,786 3.6 31.8 19.5 16.6 5.9<br />
Clinton 808 757 851 849 920 1,015 -6.3 12.4 -0.2 8.4 10.3<br />
Crystal Lake 742 712 756 700 778 810 -4.0 6.2 -7.4 11.1 4.1<br />
Cumberland 902 910 909 884 942 959 0.9 -0.1 -2.8 6.6 1.8<br />
Dallas 610 465 567 548 604 608 -23.8 21.9 -3.4 10.2 0.7<br />
Dovre 526 539 526 561 680 798 2.5 -2.4 6.7 21.2 17.4<br />
Doyle 447 426 455 460 498 540 -4.7 6.8 1.1 8.3 8.4<br />
Lakeland 585 580 672 789 963 1,022 -0.9 15.9 17.4 22.1 6.1<br />
Maple Grove 972 859 948 926 968 1,004 -11.6 10.4 -2.3 4.5 3.7<br />
Maple Plain 453 493 577 610 876 946 8.8 17.0 5.7 43.6 8.0<br />
Oak Grove 890 836 892 906 911 949 -6.1 6.7 1.6 0.01 4.2<br />
Prairie Farm 684 594 634 567 603 616 -13.2 6.7 -10.6 6.3 2.2<br />
Prairie Lake 858 923 1,076 1,129 1,369 1,584 7.6 16.6 4.9 21.3 15.7<br />
Rice Lake 1,189 1,667 2,372 2,473 3,026 3,171 40.2 42.3 4.3 22.4 4.8<br />
Sioux Creek 682 563 643 635 689 756 -17.4 14.2 -1.2 8.5 9.7<br />
Stanfold 788 757 721 644 669 721 -3.9 -4.8 -10.7 3.9 7.8<br />
Stanley 834 1,064 1,813 2,087 2,237 2,464 27.6 70.4 15.1 7.2 10.1<br />
Sumner 572 465 556 550 598 692 -18.7 19.6 -1.1 8.7 15.7<br />
Turtle Lake 718 673 587 621 622 650 -6.3 -12.8 5.8 0.01 4.5<br />
Vance Creek 647 608 650 611 747 798 -6.0 6.9 -6.0 22.3 6.8<br />
Subtotal: 17,953 17,887 20,998 21,664 24,511 26,354 -0.4 17.4 3.2 13.1 7.5<br />
Villages<br />
Almena 398 423 526 625 720 751 6.3 24.3 18.8 15.2 4.3<br />
Cameron 982 893 1,115 1,273 1,546 1,749 -9.1 24.9 14.2 21.5 13.1<br />
Dallas 401 359 477 452 356 369 -10.5 32.9 -5.2 -21.2 3.7<br />
Haugen 265 246 251 305 287 296 -7.2 2.0 21.5 -5.9 3.1<br />
New Auburn (part) 0 0 14 26 15 23 0.0 1400.0 85.7 -42.3 53.3<br />
Prairie Farm 350 426 387 494 508 531 21.7 -9.2 27.6 2.8 4.5<br />
Turtle Lake (part) 691 637 762 811 1,000 1,011 -7.8 19.6 6.4 23.3 1.1<br />
Subtotal: 3,087 2,984 3,532 3,986 4,432 4,730 -3.3 18.4 12.9 11.2 6.7<br />
Cities<br />
Barron 2,338 2,337 2,595 2,986 3,248 3,321 0.0 11.0 15.1 8.8 2.2<br />
Chetek 1729 1,630 1,931 1,953 2,180 2,259 -5.7 18.5 1.1 11.6 3.6<br />
Cumberland 1,860 1,839 1,983 2,163 2,280 2,399 -1.1 7.8 9.1 5.4 5.2<br />
Rice Lake 7,303 7,278 7,691 7,998 8,312 8,664 -0.3 5.7 4.0 3.9 4.2<br />
Subtotal: 13,230 13,084 14,200 15,100 16,020 16,643 -1.1 8.5 6.3 6.1 3.9<br />
Barron County* 34,270 33,955 38,730 40,750 44,963 78,811 -0.9 14.1 5.2 10.3 6.6<br />
source:<br />
U.S. Census Bureau; 2007 <strong>Wisconsin</strong> Department of Administration Estimate<br />
16 Issues and Opportunities Information
Table 1.4<br />
Barron County Components of Population Change 1950 to 2000<br />
1950 to 1960 to 1970 to 1980 to 1990 to<br />
Births 8,230 5,909 5,442 6,344 5,664<br />
Deaths 3,401 3,774 4,110 4,286 5,000<br />
Total Natural Increase 4,829 2,135 1,332 2,058 664<br />
Natural Increase Rate 14.1% 6.3% 3.4% 5.3% 1.5%<br />
Net Migration -5,262 -2,450 3,443 -38 3,549<br />
Net Migration Rate -15.4% -7.2% 9.0% -0.1% 7.9%<br />
Total Population Change -433 -315 4,775 2,020 4,213<br />
Percent Population Change -1.3% -0.9% 14.1% 5.2% 9.4%<br />
source: <strong>Wisconsin</strong> Department of Health and Human Services<br />
Table 1.5<br />
Barron County Historical Population by Age and Sex 1980 to 2000<br />
Male Female Total<br />
Age 1980 1990 2000 1980 1990 2000 1980 1990 2000<br />
0-4 1,552 1,529 1,312 1,517 1,371 1,232 3,069 2,900 2,544<br />
5-9 1,496 1,886 1,541 1,418 1,640 1,468 2,914 3,526 3,009<br />
10-14 1,593 1,600 1,785 1,438 1,552 1,690 3,031 3,152 3,475<br />
15-19 1,899 1,488 1,938 1,792 1,342 1,716 3,691 2,830 3,654<br />
20-24 1,557 1,127 1,185 1,554 1,017 1,138 3,111 2,144 2,323<br />
25-29 1,483 1,398 1,144 1,417 1,468 1,123 2,900 2,866 2,267<br />
30-34 1,276 1,653 1,361 1,226 1,625 1,294 2,502 3,278 2,665<br />
35-44 1,910 2,895 3,597 1,948 2,827 3,529 3,858 5,722 7,126<br />
45-54 1,718 1,899 3,138 1,836 1,923 3,045 3,554 3,822 6,181<br />
55-59 909 838 1,176 1,053 945 1,195 1,962 1,783 2,371<br />
60-64 957 901 922 1,098 938 1,062 2,055 1,839 1,984<br />
65-74 1,642 1,640 1,747 1,840 1,989 1,904 3,482 3,629 3,651<br />
75+ 1,094 1,283 1,428 1,507 1,976 2,295 2,601 3,259 3,723<br />
Median Age 31.0 34.5 38.8<br />
source: U.S. Census Bureau<br />
Table 1.6<br />
Barron County Change in Age-Sex Structure 1970 to 2000<br />
Change – Male Change – Female Total Change Total Pct Change<br />
Age 1980-90 1990-00 1980-90 1990-00 1980-90 1990-00 1980-90 1990-00<br />
0-4 -23 -217 -146 -139 -169 -356 -5.5 -12.3<br />
5-9 390 -345 222 -172 612 -517 21.0 -14.7<br />
10-14 7 185 114 138 121 323 4.0 10.2<br />
15-19 -411 450 -450 374 -861 824 -23.3 29.1<br />
20-24 -430 58 -537 121 -967 179 -31.1 8.3<br />
25-29 -85 -254 51 -345 -34 -599 -1.2 -20.9<br />
30-34 377 -292 399 -331 776 -623 31.0 -19<br />
35-44 985 702 879 702 1864 1,404 48.3 24.5<br />
45-54 181 1,249 87 1,122 268 2,371 7.5 62.0<br />
55-59 -71 338 -108 250 -179 588 -9.1 33.0<br />
60-64 -56 21 -160 124 -216 145 -10.5 7.9<br />
65-74 -2 107 149 -85 147 22 4.2 0.1<br />
75+ 189 145 469 319 658 464 25.3 14.2<br />
source: U.S. Census Bureau<br />
Barron County Conditions and Trends Report 17
Table 1.7<br />
Population by Age and Sex by Municipality (2000)<br />
Almena (V)<br />
Almena (T)<br />
Arland (T)<br />
Barron (C)<br />
Barron (T)<br />
Bear Lake (T)<br />
Cameron (V)<br />
Cedar Lake (T)<br />
Chetek (C)<br />
Chetek (T)<br />
Clinton (T)<br />
Crystal Lake (T)<br />
Cumberland (C)<br />
Cumberland (T)<br />
Total 720 910 670 3,248 1,014 587 1,546 944 2,180 1,686 920 778 2,280 942<br />
Male 360 476 324 1,569 501 292 759 496 1,050 863 473 391 1,079 505<br />
Female 360 434 346 1,679 513 295 787 448 1,130 823 447 387 1,201 437<br />
Male/Female<br />
Under 5 27/24 20/14 24/42 92/90 28/24 12/13 58/49 22/12 64/64 29/32 34/24 17/21 57/45 25/22<br />
5 to 9 30/26 26/22 25/26 105/101 44/36 14/13 55/53 24/26 61/50 41/37 39/39 26/21 76/54 42/28<br />
10 to 14 37/31 28/42 22/22 125/99 42/42 20/35 64/46 29/23 88/73 50/61 49/40 24/26 89/77 41/33<br />
15 to 19 30/29 33/32 32/27 147/118 53/53 25/29 58/60 44/28 69/59 65/55 40/36 33/34 87/81 45/25<br />
20 to 24 23/20 23/12 18/16 95/110 21/19 9/9 49/56 16/16 50/62 40/21 29/32 17/18 60/54 19/12<br />
25 to 29 28/29 31/20 22/23 108/94 17/19 14/12 53/60 14/11 49/55 19/21 16/19 19/20 51/48 27/17<br />
30 to 34 2928 28/17 24/24 113/97 32/31 14/13 47/47 27/17 67/52 35/27 34/26 26/22 52/58 19/22<br />
35 to 39 35/32 32/36 28/25 125/107 41/35 28/32 67/61 28/34 68/86 54/58 40/36 25/28 66/75 44/37<br />
40 to 44 26/22 39/35 19/19 118/102 37/31 34/30 60/60 43/48 85/67 66/74 24/36 39/39 91/83 46/41<br />
45 to 49 19/12 38/32 23/28 92/97 39/50 25/22 45/53 53/44 65/54 96/89 39/31 21/23 68/98 44/32<br />
50 to 54 12/19 37/32 16/17 92/93 30/33 20/25 51/50 37/34 48/62 75/60 25/21 31/24 76/65 25/30<br />
55 to 59 14/14 32/42 21/20 85/83 28/32 21/12 34/38 26/26 67/66 57/64 25/25 28/29 50/66 28/24<br />
60 to 64 7/17 35/30 14/9 41/61 24/22 11/10 24/27 30/40 46/45 68/61 21/20 19/17 38/61 23/27<br />
65 to 69 15/16 21/25 9/14 51/77 14/16 13/20 25/28 42/33 49/64 52/45 17/17 12/16 50/50 25/28<br />
70 to 74 13/11 26/21 10/9 58/72 18/15 13/9 24/33 24/24 55/65 48/37 19/25 26/20 52/60 24/27<br />
75 to 79 6/10 9/10 5/11 52/93 18/14 9/6 21/30 27/19 49/66 28/39 17/11 14/11 50/86 19/19<br />
80 to 84 6/11 14/8 5/8 26/83 8/11 6/4 13/17 5/10 36/60 23/21 1/3 13/10 38/70 7/9<br />
85 + 3/9 4/4 7/6 44/102 7/30 4/1 11/19 5/3 34/80 16/21 4/6 1/8 28/70 2/4<br />
TABLE 1.7 CONTINUED ON NEXT PAGE<br />
18 Issues and Opportunities Information
Table 1.7 continued<br />
Population by Age and Sex by Municipality (2000)<br />
Dallas (V)<br />
Dallas (T)<br />
Dovre (T)<br />
Doyle (T)<br />
Haugen (V)<br />
Lakeland (T)<br />
Maple Grove (T)<br />
Maple Plain (T)<br />
New Auburn (V)<br />
Oak Grove (T)<br />
Prairie Farm (T)<br />
Prairie Farm (V)<br />
Prairie Lake (T)<br />
Total 356 604 680 498 287 963 968 876 15 911 603 508 1,369<br />
Male 171 314 357 256 151 502 493 438 9 469 316 244 688<br />
Female 185 290 323 242 136 461 475 438 6 442 287 264 681<br />
Male/Female<br />
Under 5 7/6 19/22 21/18 11/8 7/5 19/19 28/32 27/15 1/0 33/40 22/28 8/13 33/35<br />
5 to 9 12/14 26/20 25/22 20/29 9/10 37/32 5540 24/33 0/1 36/27 21/20 14/12 51/40<br />
10 to 14 12/13 24/28 31/31 28/29 16/8 48/32 38/50 49/43 1/0 41/41 35/19 24/13 48/52<br />
15 to 19 18/8 24/19 30/29 30/17 10/18 39/43 49/48 39/41 1/1 43/35 31/19 18/19 65/60<br />
20 to 24 6/7 15/5 30/19 13/4 3/3 14/14 19/11 16/10 1/1 26/21 13/1 11/16 17/28<br />
25 to 29 7/10 22/14 22/20 7/6 12/5 18/22 12/20 1/18 0/0 19/28 14/16 13/13 34/22<br />
30 to 34 9/7 28/22 19/13 14/19 15/11 22/27 26/28 30/26 0/0 30/30 14/17 19/17 32/28<br />
35 to 39 16/11 18/22 24/27 22/27 12/14 37/38 46/52 25/37 0/0 38/34 27/34 18/13 67/51<br />
40 to 44 12/9 22/26 28/28 29/24 14/13 55/42 51/44 36/47 2/1 48/41 35/20 11/19 56/70<br />
45 to 49 12/14 23/19 32/36 20/14 10/9 46/44 39/35 39/27 0/0 40/39 20/23 27/21 56/42<br />
50 to 54 11/7 28/27 25/22 13/13 10/6 51/43 36/22 31/33 1/1 28/25 20/22 19/12 54/47<br />
55 to 59 14/11 18/11 22/16 8/11 6/2 28/22 20/23 35/28 1/0 25/19 15/15 12/7 48/43<br />
60 to 64 6/11 5/13 12/14 10/12 4/1 24/35 30/22 28/31 0/1 16/12 18/19 10/11 32/42<br />
65 to 69 5/6 12/5 13/6 12/9 5/8 22/22 14/15 19/16 1/0 16/24 16/8 9/9 33/33<br />
70 to 74 3/11 10/11 5/6 7/5 8/8 14/4 11/10 11/9 0/0 15/9 3/7 11/19 23/30<br />
75 to 79 8/3 10/9 9/5 6/5 2/7 16/12 7/12 11/14 0/0 10/7 5/7 6/14 20/26<br />
80 to 84 7/13 8/4 2/9 3/5 5/5 9/8 5/8 2/4 0/0 3/8 6/1 2/12 13/13<br />
85 + 14/24 2/3 7/2 3/5 3/3 3/2 7/3 4/6 0/0 2/2 1/1 12/24 6/8<br />
TABLE 1.7 CONTINUED ON NEXT PAGE<br />
Barron County Conditions and Trends Report 19
Table 1.7 continued<br />
Population by Age and Sex by Municipality (2000)<br />
Rice Lake (C)<br />
Rice Lake (T)<br />
Sioux Creek (T)<br />
Stanfold (T)<br />
Stanley (T)<br />
Sumner (T)<br />
Turtle Lake (V)<br />
Turtle Lake (T)<br />
Vance Creek (T)<br />
New Auburn (V)<br />
all*<br />
Total 8,320 3,026 689 669 2,229 598 1,000 622 747 562 1,065<br />
Male 3,890 1,503 356 335 1,132 321 477 326 388 282 508<br />
Female 4,430 1,523 333 334 1,097 277 523 296 359 280 557<br />
Male/Female<br />
Under 5 263/229 98/101 29/19 16/23 69/60 18/18 32/25 17/14 25/26 30/20 35/30<br />
5 to 9 275/265 97/110 35/35 30/23 73/86 24/17 25/30 20/35 24/35 20/17 28/32<br />
10 to 14 278/281 99/130 31/31 23/27 109/84 34/21 40/43 33/30 35/34 25/35 41/47<br />
15 to 19 344/301 148/127 31/25 22/27 100/87 30/26 43/47 28/19 42/34 15/23 51/53<br />
20 to 24 277/286 71/71 28/22 12/11 52/51 14/16 38/32 21/14 19/18 12/8 40/33<br />
25 to 29 239/238 83/68 15/21 15/12 55/60 13/16 25/24 22/15 17/16 21/21 27/27<br />
30 to 34 251/255 97/99 22/24 30/33 73/75 23/17 23/24 13/21 24/20 19/16 25/24<br />
35 to 39 278/326 128/108 29/19 3/25 85/91 33/27 39/37 36/22 30/31 19/19 39/41<br />
40 to 44 315/291 133/151 27/30 31/25 117/117 30/23 41/42 23/23 35/28 23/20 43/42<br />
45 to 49 229/287 131/113 22/33 22/19 102/87 27/23 28/35 30/29 37/24 21/18 29/37<br />
50 to 54 245/235 123/95 23/16 17/24 79/91 20/22 31/38 22/20 17/19 20/16 33/39<br />
55 to 59 180/208 75/82 14/15 18/16 62/59 9/14 15/18 16/17 19/17 8/16 15/18<br />
60 to 64 132/187 56/65 15/14 13/13 44/48 12/12 21/27 15/10 18/15 14/17 21/27<br />
65 to 69 142/209 59/57 12/8 15/19 46/43 14/6 20/20 9/7 11/11 12/3 20/21<br />
70 to 74 163/197 42/57 10/10 19/18 35/22 8/8 14/20 10/10 14/15 10/10 15/22<br />
75 to 79 118/204 32/40 5/6 12/6 15/19 7/4 21/25 7/5 9/8 10/14 22/27<br />
80 to 84 93/214 21/26 4/3 5/5 11/14 2/6 13/18 4/4 8/5 1/4 16/18<br />
85 + 68/217 10/23 4/2 5/8 5/3 3/1 8/18 0/1 4/3 2/3 8/19<br />
Turtle Lake (V) all*<br />
*The final two columns encompass all of the Villages of New Auburn and Turtle Lake, including those portions outside Barron<br />
County.<br />
source: U.S. Census, 2000<br />
20 Issues and Opportunities Information
Table 1.8<br />
Population by Age and Sex by Municipality (1990)<br />
Almena (V)<br />
Almena (T)<br />
Arland (T)<br />
Barron (C)<br />
Barron (T)<br />
Bear Lake (T)<br />
Cameron (V)<br />
Cedar Lake (T)<br />
Chetek (C)<br />
Chetek (T)<br />
Clinton (T)<br />
Crystal Lake (T)<br />
Cumberland (C)<br />
Cumberland (T)<br />
Total 625 773 609 2,986 1,015 530 1,273 741 1,953 1,446 849 700 2,163 884<br />
Male 313 393 324 1,397 534 272 625 383 907 743 433 342 990 466<br />
Female 312 380 285 1,589 481 258 648 358 1,046 703 416 358 1,173 418<br />
Male/Female<br />
Under 5 48/32 22/36 18/20 108/100 33/23 20/23 61/34 32/26 64/59 41/40 44/41 13/27 74/65 33/26<br />
5 to 9 30/28 23/28 28/28 127/124 57/43 26/26 67/56 41/29 67/57 62/44 48/35 25/26 95/61 47/35<br />
10 to 14 16/23 35/20 40/21 106/112 59/34 16/26 65/54 25/23 65/60 60/56 37/46 24/36 62/87 30/31<br />
15 to 19 19/10 35/34 34/27 87/88 50/33 23/18 45/40 22/21 52/44 50/37 26/29 33/32 57/76 38/18<br />
20 to 24 25/31 26/18 23/18 93/79 24/19 13/9 32/31 15/22 31/47 28/18 25/21 24/16 44/44 21/18<br />
25 to 29 32/24 26/28 23/15 117/132 34/23 22/23 52/58 22/24 65/68 39/51 32/27 18/17 59/66 27/20<br />
30 to 34 19/26 32/35 13/17 120/99 36/28 27/23 47/41 28/33 70/58 51/52 36/39 35/28 65/70 43/34<br />
35 to 39 17/19 31/24 25/23 98/105 38/48 24/15 44/58 36/32 52/52 61/55 38/38 27/26 79/89 38/35<br />
40 to 44 20/13 20/22 21/20 87/78 41/39 20/23 48/44 30/22 49/50 55/42 23/15 20/15 73/73 22/28<br />
45 to 49 11/11 22/31 21/20 69/79 31/35 18/11 20/32 20/12 42/44 34/44 16/21 27/19 51/48 30/26<br />
50 to 54 10/8 24/16 14/12 49/49 28/27 14/11 20/20 13/17 38/49 37/40 21/18 10/12 28/48 26/25<br />
55 to 59 7/11 14/22 14/15 45/64 19/28 8/17 28/24 22/23 36/63 37/44 10/23 12/25 47/47 18/25<br />
60 to 64 11/11 27/22 12/9 65/72 21/18 16/7 15/18 19/19 48/49 47/45 22/24 19/23 50/54 31/31<br />
65 to 69 10/11 20/19 9/16 61/84 28/20 8/10 18/35 21/20 63/66 43/57 24/14 23/16 65/83 28/28<br />
70 to 74 14/13 20/13 13/13 44/82 8/16 9/8 19/28 18/18 47/69 38/28 11/11 19/14 56/80 13/19<br />
75 to 79 8/20 9/6 8/8 44/87 13/11 3/5 14/34 10/8 45/56 36/28 8/9 7/15 32/73 13/11<br />
80 to 84 9/8 4/4 5/3 35/65 9/14 2/2 21/23 8/7 37/72 18/19 8/4 5/8 26/51 6/5/<br />
85 and older 7/13 3/2 3/0 42/90 5/22 9/1 9/18 1/2 36/83 6/3 4/1 1/3 27/58 2/3<br />
TABLE 1.8 CONTINUED ON NEXT PAGE<br />
Barron County Conditions and Trends Report 21
Table 1.8 continued<br />
Population by Age and Sex by Municipality (1990)<br />
Dallas (V)<br />
Dallas (T)<br />
Dovre (T)<br />
Doyle (T)<br />
Haugen (V)<br />
Lakeland (T)<br />
Maple Grove (T)<br />
Maple Plain (T)<br />
New Auburn (V)<br />
Oak Grove (T)<br />
Prairie Farm (T)<br />
Prairie Farm (V)<br />
Prairie Lake (T)<br />
Total 548 548 561 460 305 789 926 610 26 906 567 494 1,129<br />
Male 268 268 280 236 154 407 479 313 11 472 299 224 591<br />
Female 238 280 281 224 151 382 447 297 15 434 268 270 538<br />
Male/Female<br />
Under 5 13 /17 13/28 21/18 21/19 18/7 34/29 43/43 25/15 0/1 38/30 22/10 17/8 33/30<br />
5 to 9 29/18 29/27 17/33 25/14 18/15 42/39 54/38 29/27 2/1 42/37 32/29 22/25 55/46<br />
10 to 14 21/12 21/34 37/25 19/15 14/15 24/32 37/37 30/21 2/3 52/49 30/29 16/26 54/35<br />
15 to 19 22/12 22/19 20/30 15/21 8/9 31/17 30/32 32/22 0/3 47/36 23/25 17/10 45/35<br />
20 to 24 9/11 9/13 13/6 15/19 8/10 21/14 23/23 13/12 1/0 24/21 12/7 8/8 26/21<br />
25 to 29 20/14 20/20 12/13 17/12 13/15 22/27 37/37 11/18 0/0 34/30 14/20 20/19 29/26<br />
30 to 34 20/15 20/19 17/23 22/28 15/11 35/34 45/36 24/33 1/2 41/41 27/24 11/15 32/42<br />
35 to 39 30/12 30/19 22/30 12/8 10/11 33/32 30/29 25/18 1/1 41/37 21/16 15/18 58/39<br />
40 to 44 23/5 23/24 28/29 10/11 9/8 35/30 38/24 19/24 1/1 28/26 20/24 21/11 39/35<br />
45 to 49 15/14 15/10 26/12 7/17 4/4 18/16 19/31 24/23 0/0 21/22 19/20 9/10 41/32<br />
50 to 54 8/9 8/14 14/12 15/10 3/2 20/21 30/22 19/20 1/1 21/20 23/19 7/8 26/28<br />
55 to 59 11/6 11/6 13/11 15/11 4/6 16/18 21/21 20/13 1/1 19/23 14/9 16/10 27/32<br />
60 to 64 11/12 11/12 8/11 8/6 6/9 16/13 21/20 15/12 0/0 21/15 7/7 6/12 29/34<br />
65 to 69 13/11 13/15 12/10 7/9 6/11 18/19 18/17 7/18 0/0 10/13 7/9 8/13 36/33<br />
70 to 74 13/16 13/9 10/10 11/9 9/8 22/24 10/16 11/10 0/0 13/16 12/10 8/16 25/33<br />
75 to 79 4/14 4/9 8/5 8/9 3/5 12/11 13/15 7/7 0/0 11/8 9/5 4/18 17/15<br />
80 to 84 5/13 5/0 2/2 5/5 4/2 5/3 9/5 2/2 1/1 5/7 6/3 6/16 14/11<br />
85 and older 1/27 1/2 0/1 4/1 2/3 3/3 1/1 0/2 0/0 4/3 1/2 13/27 5/11<br />
TABLE 1.8 CONTINUED ON NEXT PAGE<br />
22 Issues and Opportunities Information
Table 1.8 continued<br />
Population by Age and Sex by Municipality (1990)<br />
Rice Lake (C)<br />
Rice Lake (T)<br />
Sioux Creek (T)<br />
Stanfold (T)<br />
Stanley (T)<br />
Sumner (T)<br />
Turtle Lake (V)<br />
Turtle Lake (T)<br />
Vance Creek (T)<br />
New Auburn (V)<br />
all*<br />
Total 7,998 2,473 635 664 2,087 550 621 611 611 485 817<br />
Male 3,786 1,259 322 343 1,067 281 318 372 313 227 375<br />
Female 4,212 1,214 313 301 1,020 269 303 439 298 258 442<br />
Male/Female<br />
Under 5 288/257 80/99 31/22 22/14 88/80 30/15 25/28 33/27 21/22 16/18 33/27<br />
5 to 9 340/296 106/74 31/27 24/26 104/118 27/25 21/25 28/40 31/29 24/27 30/41<br />
10 to 14 289/250 109/86 31/39 31/26 105/90 19/25 36/33 22/23 20/29 22/28 22/24<br />
15 to 19 274/273 104/85 20/31 28/18 86/64 14/23 25/28 30/25 26/23 13/18 30/25<br />
20 to 24 272/271 93/76 18/10 21/20 54/47 18/13 19/14 23/22 19/17 15/16 23/22<br />
25 to 29 297/308 108/117 28/25 37/22 73/86 24/27 23/18 26/25 19/20 20/14 26/25<br />
30 to 34 309/324 107/89 20/27 25/25 96/102 26/28 22/24 32/41 21/23 24/21 33/41<br />
35 to 39 254/284 91/102 26/24 22/11 92/82 24/15 29/28 22/20 31/26 16/19 22/21<br />
40 to 44 254/232 101/98 17/21 15/25 86/83 19/16 25/17 22/27 16/12 14/16 22/27<br />
45 to 49 194/194 63/80 25/19 25/15 63/61 15/22 18/17 16/18 15/20 9/10 16/18<br />
50 to 54 141/174 69/65 22/16 11/17 37/45 13/10 11/17 19/21 14/9 12/16 19/21<br />
55 to 59 126/178 59/56 17/10 21/19 43/38 14/7 15/11 19/21 9/15 9/9 19/21<br />
60 to 64 169/181 54/66 9/10 20/19 36/30 11/8 15/14 15/17 22/20 5/4 15/17<br />
65 to 69 151/222 41/38 9/13 11/10 41/30 15/10 13/11 18/30 15/11 8/9 18/30<br />
70 to 74 145/214 38/39 8/9 12/8 24/33 6/16 9/7 20/23 12/8 6/7 20/23<br />
75 to 79 115/208 21/23 9/3 7/13 19/17 3/6 5/6 13/25 10/8 5/10 13/25<br />
80 to 84 92/180 9/10 1/2 8/7 12/8 2/2 3/3 9/26 10/3 6/10 9/26<br />
85 and older 76/166 6/11 0/5 3/6 8/6 1/1 4/2 5/8 2/3 3/6 5/8<br />
Turtle Lake (V) all*<br />
*The final two columns encompass all of the Villages of New Auburn and Turtle Lake, including those portions outside Barron<br />
County.<br />
source: U.S. Census, 2000<br />
Barron County Conditions and Trends Report 23
Table 1.9A<br />
Percent Change in Age/Sex Structure by Municipality (Males Only) – 1990 to 2000<br />
Barron County<br />
Almena (V)<br />
Almena (T)<br />
Arland (T)<br />
Barron (C)<br />
Barron (T)<br />
Bear Lake (T)<br />
Cameron (V)<br />
Cedar Lake (T)<br />
Chetek (C)<br />
Chetek (T)<br />
Clinton (T)<br />
Crystal Lake (T)<br />
Cumberland (C)<br />
Cumberland (T)<br />
Total 15.2 17.7 10.0 8.8 -0.1 10.8 21.4 27.4 11.6 16.6 8.4 11.1 5.4 6.6<br />
Male 15.0 21.1 0.0 12.3 -6.2 7.4 21.4 29.5 15.8 16.2 9.2 14.3 9.0 8.4<br />
Under 5 -43.8 -9.1 33.3 -14.8 -15.2 -40.0 -4.9 -31.3 0.0 -29.3 -22.7 30.8 -23.0 -24.2<br />
5 to 9 0.0 13.0 -10.7 -17.3 -22.8 -46.2 -17.9 -41.5 -9.0 -33.9 -18.8 4.0 -20.0 -10.6<br />
10 to 14 131.3 -200.0 -45.0 17.9 -28.8 25.0 1.5 16.0 35.4 -16.7 32.4 0.0 43.5 36.7<br />
15 to 19 57.9 -5.7 -5.9 69.0 6.0 8.7 28.9 100. 32.7 30.0 53.8 0.0 52.6 18.4<br />
20 to 24 -8.0 -11.5 -21.7 2.2 -12.5 -30.8 53.1 6.7 61.3 42.9 16.0 -29.2 36.4 -9.5<br />
25 to 29 -12.5 19.2 -4.3 -7.7 -50.0 -36.4 1.9 -36.4 -24.6 -51.3 -50.0 5.6 -13.6 0.0<br />
30 to 34 52.6 -12.5 84.6 -5.8 -11.1 -48.1 0.0 -3.6 -4.3 -31.4 -5.6 -25.7 -20.0 -55.8<br />
35 to 39 105.9 3.2 12.0 27.6 7.9 16.7 52.3 -22.2 30.8 -11.5 5.3 -7.4 -16.5 15.8<br />
40 to 44 30.0 95.0 -9.5 35.6 -9.8 70.0 25.0 43.3 73.5 20.0 4.3 95.0 24.7 109.1<br />
45 to 49 72.7 72.7 9.5 33.3 25.8 38.9 125.0 165.0 54.8 182.4 143.8 -22.2 333 46.7<br />
50 to 54 20.0 54.2 14.3 87.8 7.1 42.9 155.0 184.6 26.3 102.7 19.0 210.0 171.4 -3.8<br />
55 to 59 100.0 128.6 50.0 88.9 47.4 162.5 21.4 18.2 86.1 54.1 150.0 133.3 6.4 55.6<br />
60 to 64 -36.4 29.6 16.7 -36.9 14.3 -31.3 60.0 57.9 -4.2 44.7 -4.5 0.0 -24.0 -25.8<br />
65 to 69 50.0 5.0 0.0 -16.4 -50.0 62.5 38.9 100.0 -22.2 23.3 -29.2 -47.8 -23.1 -10.7<br />
70 to 74 -7.1 30.0 -23.1 31.8 125.0 44.4 26.3 33.3 17.0 26.3 72.7 36.8 -7.1 84.6<br />
75 to 79 -25.0 0.0 -37.5 18.2 38.5 200.0 50.0 170.0 8.9 -22.2 112.5 100.0 56.3 46.2<br />
80 to 84 -33.3 250.0 0.0 -25.7 -11.1 200.0 -38.1 -37.5 -2.7 27.8 -87.5 160.0 46.2 16.7<br />
85 and older -57.1 33.3 133.3 4.8 40.0 33.3 22.2 400.0 -5.6 166.7 0.0 0.0 3.7 0.0<br />
TABLE 1.9A CONTINUED ON NEXT PAGE<br />
24 Issues and Opportunities Information
Table 1.9A continued<br />
Percent Change in Age/Sex Structure by Municipality (Males Only) – 1990 to 2000<br />
Barron County<br />
Dallas (V)<br />
Dallas (T)<br />
Dovre (T)<br />
Doyle (T)<br />
Haugen (V)<br />
Lakeland (T)<br />
Maple Grove (T)<br />
Maple Plain (T)<br />
New Auburn (V)<br />
Oak Grove (T)<br />
Prairie Farm (T)<br />
Prairie Farm (V)<br />
Prairie Lake (T)<br />
Total -35.0 10.2 21.2 8.3 -5.9 22.1 4.5 43.6 42.3 0.6 6.3 2.8 21.3<br />
Male -36.2 17.2 27.5 8.5 -1.9 23.3 2.9 39.9 -18.2 -0.6 5.7 8.9 16.4<br />
Under 5 -46.2 46.2 0.0 -47.6 -61.1 -44.1 -34.9 8.0 100.0 -13.2 0.0 -52.9 0.0<br />
5 to 9 -58.6 -10.3 47.1 -20.0 -50.0 -11.9 1.9 -17.2 -100. -14.3 -34.4 -36.4 -7.3<br />
10 to 14 -42.9 14.3 -16.2 47.4 14.3 100.0 2.7 63.3 -50.0 -21.2 16.7 50.0 -11.1<br />
15 to 19 -54.5 9.1 50.0 100.0 25.0 25.8 63.3 21.9 100.0 -8.5 34.8 5.9 44.4<br />
20 to 24 -33.3 66.7 130.8 -13.3 -62.5 -33.3 -17.4 23.1 0.0 8.3 8.3 37.5 -34.6<br />
25 to 29 -65.0 10.0 83.3 -58.8 -7.7 -18.2 -67.6 9.1 0.0 -44.1 0.0 -35.0 17.2<br />
30 to 34 -55.0 40.0 11.8 -36.4 0.0 -37.1 -42.2 25.0 -100.0 -26.8 -48.1 72.7 0.0<br />
35 to 39 -46.7 -40.0 9.1 83.3 20.0 12.1 53.3 0.0 -100.0 -7.3 28.6 20.0 15.5<br />
40 to 44 -47.8 -4.3 0.0 190.0 55.6 57.1 34.2 89.5 100.0 71.4 750.0 -47.6 43.6<br />
45 to 49 -20.0 53.3 23.1 185.7 150.0 155.6 105.3 62.5 0.0 90.5 5.3 200.0 36.6<br />
50 to 54 37.5 250.0 78.6 -13.3 233.3 155.0 20.0 63.2 0.0 33.3 -13.0 171.4 107.7<br />
55 to 59 2.3 63.6 69.2 -46.7 50.0 75.0 -4.8 75.0 0.0 31.6 7.1 -25.0 77.8<br />
60 to 64 -45.5 -54.5 50.0 25.0 -33.3 50.0 42.9 86.7 0.0 -23.8 157.1 66.7 10.3<br />
65 to 69 -61.5 -7.7 8.3 71.4 -16.7 22.2 -22.2 171.4 0.0 60.0 128.6 12.5 -8.3<br />
70 to 74 -76.9 -23.1 -50.0 -36.4 -11.1 -36.4 10.0 0.0 0.0 15.4 -75.0 37.5 -8.0<br />
75 to 79 100.0 150.0 12.5 -25.0 -33.3 33.3 -46.2 57.1 0.0 -9.1 -44.4 50.0 17.6<br />
80 to 84 40.0 60.0 0.0 -40.0 25.0 80.0 -44.4 0.0 -100.0 -40.0 0.0 -66.7 -7.1<br />
85 and older 1300.0 100.0 700.0 -25.0 50.0 0.0 600.0 400.0 0.0 -50.0 0.0 -7.7 20.0<br />
TABLE 1.9A CONTINUED ON NEXT PAGE<br />
Barron County Conditions and Trends Report 25
Table 1.9A continued<br />
Percent Change in Age/Sex Structure by Municipality (Males Only) – 1990 to 2000<br />
Barron County<br />
Rice Lake (C)<br />
Rice Lake (T)<br />
Sioux Creek (T)<br />
Stanfold (T)<br />
Stanley (T)<br />
Sumner (T)<br />
Turtle Lake (V)<br />
Turtle Lake (T)<br />
Vance Creek (T)<br />
New Auburn (V)<br />
all*<br />
Total 4.0 22.4 8.5 0.8 6.8 8.7 61.0 -23.3 22.3 15.9 30.4<br />
Male 2.7 19.4 10.6 -2.3 6.1 14.2 50.0 -12.4 24.0 24.2 35.5<br />
Under 5 -8.7 22.5 -6.5 -27.3 -21.6 -40.0 28.0 -48.5 19.0 87.5 6.1<br />
5 to 9 -19.1 -8.5 12.9 25.0 -29.8 -11.1 19.0 -28.6 22.6 -16.7 -6.7<br />
10 to 14 -3.8 -9.2 0.0 -25.8 3.8 78.9 11.1 50.0 75.0 13.6 86.4<br />
15 to 19 25.5 42.3 55.0 -21.4 16.3 114.3 72.0 -6.7 61.5 15.4 70.0<br />
20 to 24 1.8 -23.7 55.6 -42.9 -3.7 -22.2 100.0 -8.7 0.0 -20.0 73.9<br />
25 to 29 -19.5 -23.1 -46.4 -59.5 -24.7 -45.8 8.7 -15.4 -10.5 5.0 3.8<br />
30 to 34 -18.8 -9.3 10.0 20.0 -24.0 -11.5 4.5 -59.4 14.3 -20.8 -24.2<br />
35 to 39 9.4 40.7 11.5 36.4 -7.6 37.5 34.5 63.6 -3.2 18.8 77.3<br />
40 to 44 24.0 31.7 58.8 106.7 36.0 57.9 64.0 4.5 118.8 64.3 95.5<br />
45 to 49 18.0 107.9 -12.0 -12.0 61.9 80.0 55.6 87.5 146.7 133.3 81.3<br />
50 to 54 73.8 78.3 4.5 54.5 113.5 53.8 181.8 15.8 21.4 66.7 73.7<br />
55 to 59 42.9 27.1 -17.6 -14.3 44.2 -35.7 0.0 -15.8 111.1 -11.1 -21.1<br />
60 to 64 -21.9 3.7 66.7 -35.0 22.2 9.1 40.0 0.0 -18.2 180.0 40.0<br />
65 to 69 -6.0 43.9 33.3 36.4 12.2 -6.7 53.8 -50.0 -26.7 50.0 11.1<br />
70 to 74 12.4 10.5 25.0 58.3 45.8 33.3 55.6 -50.0 16.7 66.7 -25.0<br />
75 to 79 2.6 52.4 -44.4 71.4 -21.1 133.3 320.0 -46.2 -10.0 100.0 69.2<br />
80 to 84 1.1 133.3 300.0 -37.5 -8.3 0.0 333.3 -55.6 -20.0 -83.3 77.8<br />
85 and older -10.5 66.7 400.0 66.7 -37.5 200.0 100.0 -100.0 100.0 -33.3 60.0<br />
Turtle Lake (V) all*<br />
*The final two columns encompass all of the Villages of New Auburn and Turtle Lake, including those portions outside Barron<br />
County.<br />
source: U.S. Census<br />
26 Issues and Opportunities Information
Table 1.9B<br />
Percent Change in Age/Sex Structure by Municipality (Females Only) – 1990 to 2000<br />
Barron County<br />
Almena (V)<br />
Almena (T)<br />
Arland (T)<br />
Barron (C)<br />
Barron (T)<br />
Bear Lake (T)<br />
Cameron (V)<br />
Cedar Lake (T)<br />
Chetek (C)<br />
Chetek (T)<br />
Clinton (T)<br />
Crystal Lake (T)<br />
Cumberland (C)<br />
Cumberland (T)<br />
Total 15.2 17.7 10.0 8.8 -0.1 10.8 21.4 27.4 11.6 16.6 8.4 11.1 5.4 6.6<br />
Female 15.4 14.2 21.4 5.7 6.7 14.3 21.5 25.1 8.0 17.1 7.5 8.1 2.4 4.5<br />
Under 5 -25.0 -61.1 110.0 -10.0 4.3 -43.5 44.1 -53.8 8.5 -20.0 -41.5 -22.2 -30.8 -15.4<br />
5 to 9 -7.1 -21.4 -7.1 -18.5 -16.3 -50.0 -5.4 -10.3 -12.3 -15.9 11.4 -19.2 -11.5 -20.0<br />
10 to 14 34.8 110.0 4.8 -11.6 23.5 34.6 -14.8 0.0 21.7 8.9 -13.0 -27.8 -11.5 6.5<br />
15 to 19 190.0 -5.9 0.0 34.1 60.6 61.1 50..0 33.3 34.1 48.6 24.1 6.3 6.6 38.9<br />
20 to 24 -35.5 -33.3 -11.1 39.2 0.0 0.0 80.6 -27.3 31.9 16.7 52.4 12.5 22.7 -33.3<br />
25 to 29 20.8 -28.6 53.3 -28.8 -17.4 -47.8 3.4 -54.2 -19.1 -58.8 -29.6 17.6 -27.3 -15.0<br />
30 to 34 7.7 -51.4 41.2 -2.0 10.7 -43.5 14.6 -48.5 -10.3 -48.1 -33.3 -21.4 -17.1 -35.3<br />
35 to 39 68.4 50.0 8.7 1.9 -27.1 113.3 5.2 6.3 65.4 5.5 -5.3 7.7 -15.7 5.7<br />
40 to 44 69.2 59.1 -5.0 30.8 -20.5 30.4 36.4 118.2 34.0 76.2 140.0 160.0 13.7 46.4<br />
45 to 49 9.1 3.2 40.0 22.8 42.9 100.0 65.6 266.7 22.7 102.3 47.6 21.1 104.2 23.1<br />
50 to 54 137.5 100.0 41.7 89.8 22.2 127.3 150.0 100.0 26.5 50.0 16.7 100.0 35.4 20.0<br />
55 to 59 27.3 90.0 33.3 29.7 14.3 -29.4 58.3 13.0 4.8 45.5 8.7 16.0 40.4 -4.0<br />
60 to 64 54.5 36.4 0.0 -15.3 22.2 42.9 50.0 110.5 -8.2 35.6 -16.7 -26.1 13.0 -12.9<br />
65 to 69 45.5 31.6 -12.5 -8.3 -20.0 100.0 -20.0 65.0 -3.0 -21.1 21.4 0.0 -39.8 0.0<br />
70 to 74 -15.4 61.5 -30.8 -12.2 -6.3 12.5 17.9 33.3 -5.8 32.1 127.3 42.9 -25.0 42.1<br />
75 to 79 -50.0 66.7 37.5 6.9 27.3 20.0 -11.8 137.5 17.9 39.3 22.2 -26.7 17.8 72.7<br />
80 to 84 37.5 100.0 166.7 27.7 -21.4 100.0 -26.1 42.9 -16.7 10.5 -25.0 25.0 37.3 80.0<br />
85 and older -30.8 100.0 600.0 13.3 36.4 0.0 5.6 50.0 -3.6 600.0 500.0 166.7 20.7 33.3<br />
TABLE 1.9B CONTINUED ON NEXT PAGE<br />
Barron County Conditions and Trends Report 27
Table 1.9B continued<br />
Percent Change in Age/Sex Structure by Municipality (Females Only) – 1990 to 2000<br />
Barron County<br />
Dallas (V)<br />
Dallas (T)<br />
Dovre (T)<br />
Doyle (T)<br />
Haugen (V)<br />
Lakeland (T)<br />
Maple Grove (T)<br />
Maple Plain (T)<br />
New Auburn (V)<br />
Oak Grove (T)<br />
Prairie Farm (T)<br />
Prairie Farm (V)<br />
Prairie Lake (T)<br />
Total -35.0 10.2 21.2 8.3 -5.9 22.1 4.5 43.6 42.3 0.6 6.3 2.8 21.3<br />
Female -22.3 3.6 14.9 8.0 -9.9 20.7 6.3 47.5 -60.0 1.8 7.1 -2.2 26.6<br />
Under 5 -64.7 -21.4 0.0 -57.9 -28.6 -34.5 -25.6 0.0 -100.0 33.3 180.0 62.5 16.7<br />
5 to 9 -22.2 -25.9 -33.3 107.1 -33.3 -17.9 5.3 22.2 0.0 -27.0 -31.0 -52.0 -13.0<br />
10 to 14 8.3 -17.6 24.0 93.3 -46.7 0.0 35.1 104.8 -100.0 -16.3 -34.5 -50.0 48.6<br />
15 to 19 -33.3 0.0 -3.3 -19.0 100.0 152.9 50.0 86.4 -66.7 -2.8 -24.0 90.0 71.4<br />
20 to 24 -36.4 15.4 216.7 -78.9 -70.0 0.0 -52.2 -16.7 100.0 0.0 57.1 100.0 33.3<br />
25 to 29 -28.6 -30.0 53.8 -50.0 -66.7 18.5 -45.9 0.0 0.0 -6.7 -20.0 -31.6 26.9<br />
30 to 34 -53.3 15.8 -43.5 -32.1 0.0 -20.6 -22.2 -21.2 -100.0 -26.8 -29.2 13.3 -33.3<br />
35 to 39 -8.3 15.8 -10.0 237.5 27.3 18.8 79.3 105.6 -100.0 -8.1 112.5 -27.8 30.8<br />
40 to 44 80.0 8.3 -3.4 118.2 62.5 40.0 83.3 95.8 0.0 57.7 -16.7 72.7 100.0<br />
45 to 49 0.0 90.0 200.0 -17.6 125.0 175.0 12.9 17.4 0.0 77.3 10.0 110.0 31.3<br />
50 to 54 -22.2 92.9 83.3 30.0 200.0 104.8 0.0 65.0 0.0 25.0 15.8 50.0 67.9<br />
55 to 59 83.3 83.3 45.5 0.0 -66.7 22.2 9.5 115.4 -100.0 -17.4 66.7 -30.0 34.4<br />
60 to 64 -8.3 8.3 27.3 100.0 -88.9 169.2 10.0 158.3 100. -20.0 171.4 -8.3 23.5<br />
65 to 69 -45.5 -66.7 -40.0 0.0 -27.3 15.8 -11.8 -11.1 0.0 84.6 -11.1 -30.8 0.0<br />
70 to 74 -31.3 22.2 -40.0 -44.4 0.0 -83.3 -37.5 -10.0 0.0 -43.8 -30.0 18.8 -9.1<br />
75 to 79 -78.6 0.0 0.0 -44.4 40.0 9.1 -20.0 100.0 0.0 -12.5 40.0 -22.2 73.3<br />
80 to 84 0.0 400.0 350.0 0.0 150.0 166.7 60.0 100.0 -100.0 14.3 -66.7 -25.0 18.2<br />
85 and older -11.1 50.0 100.0 400.0 0.0 -33.3 200.0 200.0 0.0 -33.3 -50.0 -11.1 -27.3<br />
TABLE 1.9B CONTINUED ON NEXT PAGE<br />
28 Issues and Opportunities Information
Table 1.9B continued<br />
Percent Change in Age/Sex Structure by Municipality (Females Only) – 1990 to 2000<br />
Barron County<br />
Rice Lake (C)<br />
Rice Lake (T)<br />
Sioux Creek (T)<br />
Stanfold (T)<br />
Stanley (T)<br />
Sumner (T)<br />
Turtle Lake (V)<br />
Turtle Lake (T)<br />
Vance Creek (T)<br />
New Auburn (V)<br />
all*<br />
Total 4.0 22.4 8.5 0.8 6.8 8.7 61.0 -23.3 22.3 15.9 30.4<br />
Female 5.2 25.5 6.4 11.0 7.5 3.0 72.6 -32.6 20.5 8.5 26.0<br />
Under 5 -10.9 2.0 -13.6 64.3 -25.0 20.0 -10.7 -48.1 18.2 11.1 11.1<br />
5 to 9 -10.5 48.6 29.6 -11.5 -27.1 -32.0 20.0 -12.5 20.7 -37.0 -22.0<br />
10 to 14 12.4 51.2 -20.5 3.8 -6.7 -16.0 30.3 30.4 17.2 25.0 95.8<br />
15 to 19 10.3 49.4 -19.4 50.0 35.9 13.0 67.9 -24.0 47.8 27.8 112.0<br />
20 to 24 5.5 -6.6 120.0 -45.0 8.5 23.1 128.6 -36.4 5.9 -50.0 50.0<br />
25 to 29 -22.7 -41.9 -16.0 -45.5 30.2 -40.7 33.3 -40.0 -20.0 50.0 8.0<br />
30 to 34 -21.3 11.2 -11.1 32.0 26.5 -39.3 0.0 -48.8 -13.0 -23.8 -41.5<br />
35 to 39 14.8 5.9 -20.8 127.3 11.0 80.0 32.1 10.0 1932 0.0 95.2<br />
40 to 44 25.4 54.1 42.9 0.0 41.0 43.8 147.1 -14.8 133.3 25.0 55.6<br />
45 to 49 47.9 41.3 73.7 26.7 42.6 4.5 105.9 61.1 20.0 80.0 105.6<br />
50 to 54 35.1 46.2 0.0 41.2 102.2 120.0 123.5 -4.8 111.1 0.0 85.7<br />
55 to 59 16.9 46.4 50.0 -15.8 55.3 100.0 63.6 -19.0 13.3 77.8 -14.3<br />
60 to 64 3.3 -1.5 40.0 -31.6 60.0 50.0 92.9 -41.2 -25.0 325.0 58.8<br />
65 to 69 -5.9 50.0 -38.5 90.0 43.3 -40.0 81.8 -76.7 0.0 -66.7 -30.0<br />
70 to 74 -7.9 46.2 11.1 125.0 -33.3 -50.0 185.7 -56.5 87.5 42.9 -4.3<br />
75 to 79 -1.9 73.9 100.0 -53.8 11.8 -33.3 316.7 -80.0 0.0 40.0 8.0<br />
80 to 84 18.9 160.0 50.0 -28.6 75.0 200.0 500.0 -84.6 66.7 -60.0 -30.8<br />
85 and older 30.7 109.1 -60.0 33.3 -50.0 0.0 800.0 -87.5 0.0 -50.0 137.5<br />
Turtle Lake (V) all*<br />
* The last two columns encompass all of New Auburn and Turtle Lake, including areas outside Barron County.<br />
source: U.S. Census Bureau & <strong>Wisconsin</strong> Department of Administration, Demographic Services Center, January 2004.<br />
Barron County Conditions and Trends Report 29
Table 1.10<br />
Population Projections – 2000 to 2030 - Barron County by Minor Civil Division<br />
Census Estimate Proj. Proj. Proj. Proj. Proj. % Change<br />
Municipality 2000 2005 2010 2015 2020 2025 2030 2000-2030<br />
Towns<br />
Almena 910 954 995 1,037 1,080 1,115 1,140 25.3<br />
Arland 670 692 703 717 731 740 743 10.9<br />
Barron 1,014 992 999 982 964 941 911 -10.2<br />
Bear Lake 587 631 658 689 720 746 764 30.2<br />
Cedar Lake 944 1,029 1,108 1,192 1,273 1,347 1,408 49.2<br />
Chetek 1,686 1,753 1,831 1,916 2,001 2,073 2,125 26.0<br />
Clinton 920 987 1,025 1,068 1,110 1,146 1,171 27.3<br />
Crystal Lake 778 816 836 860 884 902 912 17.2<br />
Cumberland 942 942 962 968 972 971 962 2.1<br />
Dallas 604 606 611 618 626 629 628 4.0<br />
Dovre 680 756 812 871 928 980 1,022 50.3<br />
Doyle 498 527 544 565 584 600 611 22.7<br />
Lakeland 963 1,010 1,064 1,123 1,180 1,231 1,270 31.9<br />
Maple Grove 968 991 1,001 1,016 1,029 1,036 1,036 7.0<br />
Maple Plain 876 915 976 1,042 1,106 1,164 1,210 38.1<br />
Oak Grove 911 927 929 936 943 944 937 2.9<br />
Prairie Farm 603 610 611 614 618 617 612 1.5<br />
Prairie Lake 1,369 1,499 1,598 1,705 1,810 1,903 1,977 44.4<br />
Rice Lake 3,026 3,159 3,307 3,468 3,623 3,757 3,857 27.5<br />
Sioux Creek 689 728 751 777 803 824 837 21.5<br />
Stanfold 669 686 688 694 699 701 696 4.0<br />
Stanley 2,237 2,421 2,538 2,668 2,794 2,902 2,984 33.4<br />
Sumner 598 667 704 746 785 821 848 41.8<br />
Turtle Lake 622 643 651 662 673 679 680 9.3<br />
Vance Creek 747 778 808 844 877 906 925 23.8<br />
Subtotal: 24,511 25,719 26,710 27,778 28,813 29,675 30,266 23.5<br />
Villages<br />
Almena 720 760 796 838 878 912 939 30.4<br />
Cameron 1,546 1,695 1,815 1,943 2,070 2,182 2,274 47.1<br />
Dallas 356 355 345 338 330 320 308 -13.5<br />
Haugen 287 290 290 291 292 291 288 0.3<br />
New Auburn (part) 15 23 24 26 29 30 32 113.3<br />
Prairie Farm 508 532 549 570 589 605 615 21.1<br />
Turtle Lake (part) 1,000 1,007 1,037 1,075 1,110 1,140 1,158 15.8<br />
Subtotal: 4,432 4,662 4,856 5,081 5,298 5,480 5,614 26.7<br />
Cities<br />
Barron 3,248 3,311 3,364 3,463 3,558 3,632 3,676 13.2<br />
Chetek 2,180 2,247 2,304 2,372 2,438 2,489 2,519 15.6<br />
Cumberland 2,280 2,365 2,404 2,475 2,544 2,597 2,628 15.3<br />
Rice Lake 8,312 8,611 8,761 8,968 9,162 9,300 9,362 12.6<br />
Subtotal: 16,020 16,534 16,833 17,278 17,702 18,018 18,185 13.5<br />
Barron County 44,963 46,915 48,399 50,137 51,813 53,173 54,065 20.2<br />
source: U.S. Census Bureau & <strong>Wisconsin</strong> Department of Administration, Demographic Services Center,October 2008.<br />
Projections are Pre-Release Version for Research and Analysis Only.<br />
30 Issues and Opportunities Information
Table 1.11<br />
Household Projections - 2000 to 2030 - Barron County by Minor Civil Division<br />
Estimate Proj. Proj. Proj. Proj. Proj. % change<br />
Municipality 2000 2005 2010 2015 2020 2025 2030 2000-2030<br />
Towns<br />
Almena 355 382 412 439 465 485 501 41.1<br />
Arland 233 247 260 271 280 286 292 25.3<br />
Barron 319 320 333 335 333 330 323 1.3<br />
Bear Lake 219 242 261 279 296 310 322 47.0<br />
Cedar Lake 395 442 493 542 587 628 664 68.1<br />
Chetek 707 755 816 872 924 968 1,004 42.0<br />
Clinton 314 346 371 395 418 436 451 43.6<br />
Crystal Lake 312 336 356 374 391 403 413 32.4<br />
Cumberland 360 370 390 401 410 414 415 15.3<br />
Dallas 217 223 233 241 247 251 254 17.1<br />
Dovre 238 272 302 331 357 382 403 69.3<br />
Doyle 177 192 205 218 228 237 244 37.9<br />
Lakeland 378 407 443 479 511 538 562 48.7<br />
Maple Grove 323 340 355 368 379 385 390 20.7<br />
Maple Plain 323 346 382 417 450 478 503 55.7<br />
Oak Grove 313 327 339 349 356 362 363 16.0<br />
Prairie Farm 204 212 219 225 230 232 233 14.2<br />
Prairie Lake 528 593 655 714 769 817 859 62.7<br />
Rice Lake 1,139 1,222 1,322 1,417 1,502 1,575 1,636 43.6<br />
Sioux Creek 225 244 260 275 288 299 308 36.9<br />
Stanfold 249 262 272 280 286 290 292 17.3<br />
Stanley 822 914 991 1,065 1,132 1,188 1,236 50.4<br />
Sumner 210 240 262 284 303 321 336 60.0<br />
Turtle Lake 224 238 249 258 267 272 275 22.8<br />
Vance Creek 257 275 295 315 332 348 359 39.7<br />
Subtotal: 9,041 9,747 10,476 11,144 11,741 12,235 12,638 39.8<br />
Cities<br />
Almena 295 320 346 372 397 417 434 47.1<br />
Cameron 640 720 799 873 944 1,007 1,061 65.8<br />
Dallas 146 147 148 148 147 144 140 -4.1<br />
Haugen 120 124 129 132 134 135 135 12.5<br />
New Auburn (part) 6 9 10 11 13 13 14 133.3<br />
Prairie Farm 199 213 227 241 252 262 269 35.2<br />
Turtle Lake (part) 450 465 496 525 551 572 587 30.4<br />
Subtotal: 1,856 1,998 2,155 2,302 2,438 2,550 2,640 42.2<br />
Villages<br />
Barron 1,389 1,456 1,530 1,609 1,677 1,732 1,773 27.6<br />
Chetek 939 995 1,056 1,110 1,159 1,196 1,224 30.4<br />
Cumberland 1,013 1,081 1,137 1,196 1,248 1,288 1,318 30.1<br />
Rice Lake 3,613 3,850 4,054 4,238 4,391 4,505 4,586 26.9<br />
Subtotal: 6,954 7,382 7,777 8,153 8,475 8,721 8,901 28.0<br />
Barron County 17,851 19,127 20,408 21,599 22,654 23,506 24,179 35.4<br />
source: <strong>Wisconsin</strong> Department of Administration, Demographic Services Center, Octobher 2008.<br />
Projections are Pre-Release Version for Research and Analysis Only.<br />
Barron County Conditions and Trends Report 31
Table 1.12A<br />
<strong>West</strong> <strong>Central</strong> <strong>Wisconsin</strong> Region Occupation Projections – 2014<br />
Fastest Growth<br />
Most Openings<br />
Top 10 Occupations<br />
Typically Required<br />
Education/Training<br />
Average Wage<br />
Home Health Aides 1-month on-the-job training $9.29<br />
Medical Assistants 1-12 mo. on-the-job training $12.63<br />
Network and Data Analysts Bachelor’s degree $22.19<br />
Computer Software Engrs, Applications Bachelor’s degree $37.08<br />
Personal and Home Care Aides 1-month on-the-job training $8.82<br />
Dental Assistants 1-12 mo. on-the-job training $12.50<br />
Dental Hygienists Associate degree $23.34<br />
Employment, Recruitment & Placement Bachelor’s degree $19.67<br />
Medical Records & Health Information Associate degree $12.71<br />
Occupational Therapists Master’s degree $25.53<br />
Cashiers 1-month on-the-job training $7.64<br />
Retail Salespersons 1-month on-the-job training $11.06<br />
Comb Food Prep/Serv Wrk/Incl Fast 1-month on-the-job training $7.04<br />
Waiters/Waitresses 1-month on-the-job training $7.34<br />
Registered Nurses Associate’s or Bachelor’s degree $25.83<br />
Labrs/Frght/Stock/Matrl Movers/Handlers 1-month on-the-job training $10.09<br />
Janitors/Cleaners, except Maids/Housekpg 1-month on-the-job training $10.67<br />
Team Assemblers 1-12 mo. on-the-job training $12.94<br />
Stock Clerks/Order Fillers 1-month on-the-job training $9.47<br />
Bartenders 1-month on-the-job training $8.16<br />
<strong>West</strong> <strong>Central</strong> WDA includes Barron, Chippewa Clark, Dunn, Eau Claire, Pepin, Pierce, Polk and St. Croix Counties.<br />
source: <strong>Wisconsin</strong> Dept. of Workforce Development, Bureau of Workforce Information, 2006<br />
Table 1.12B<br />
<strong>West</strong> <strong>Central</strong> <strong>Wisconsin</strong> Region Industry Projections – 2004-2014<br />
Industry Title<br />
2004<br />
Estimated<br />
Employment<br />
2014<br />
Projected<br />
Employment<br />
2004-2014<br />
Employment<br />
Change<br />
2004-2014<br />
Percentage<br />
Change<br />
Total Non-Farm Employment 173,880 194,330 20,450 11.8%<br />
Construction/Mining/Natural Resources 8,380 9,880 1,500 17.9%<br />
Manufacturing 31,990 32,030 40 0.1%<br />
Paper Manufacturing 1,720 1,720 0 0.0%<br />
Plastics and Rubber Products 3,400 3,670 270 7.9%<br />
Computer and Electronic Product 3,220 3,020 -200 -6.2%<br />
Trade 28,800 30,900 2,100 7.3%<br />
Food and Beverage Stores 5,040 5,250 210 4.2%<br />
Transportation and Utilities (Including US<br />
8,270 9,520 1,250 15.1%<br />
Postal)<br />
Financial Activities 7,010 7,710 700 10.0%<br />
Education and Health Services (Including<br />
37,330 45,540 8,210 22.0%<br />
State and Local Gov Educ and Hosp)<br />
Ambulatory Health Care Services 5,540 7,570 2,030 36.6%<br />
Hospitals (Including State and Local<br />
7,050 8,640 1,590 22.6%<br />
Government)<br />
Leisure and Hospitality 17,300 19,930 2,630 15.2%<br />
Information/Prof Services/Other Services 21,470 24,920 3,450 16.1%<br />
Government (Excluding US Postal, State<br />
and Local Educ and Hosp)<br />
13,310 13,930 620 4.7%<br />
<strong>West</strong> <strong>Central</strong> WDA includes Barron, Chippewa Clark, Dunn, Eau Claire, Pepin, Pierce, Polk and St. Croix Counties.<br />
source: <strong>Wisconsin</strong> Dept. of Workforce Development, Bureau of Workforce Information, 2006<br />
32 Issues and Opportunities Information
Table 1.12C<br />
Barron County Race Characteristics - 2000<br />
White<br />
Black<br />
American Indian<br />
Asian<br />
Asian Indian<br />
Chinese<br />
Filipino<br />
Japanese<br />
Community<br />
Towns<br />
Almena 908 0 1 0 0 0 0 0 0 0 0 0 0 0 0 0 0 1<br />
Arland 664 0 2 2 0 0 2 0 0 0 0 0 0 0 0 0 0 2<br />
Barron 993 6 0 1 0 0 1 0 0 0 0 0 0 0 0 0 6 8<br />
Bear Lake 583 0 0 3 1 0 0 0 2 0 0 0 0 0 0 0 1 0<br />
Cedar Lake 942 0 1 0 0 0 0 0 0 0 0 0 0 0 0 0 0 1<br />
Chetek 1,663 3 3 3 0 1 1 0 1 0 0 0 0 0 0 0 1 13<br />
Clinton 907 1 5 4 1 0 1 0 2 0 0 0 0 0 0 0 2 1<br />
Crystal Lake 764 1 7 1 0 0 0 0 1 0 0 0 0 0 0 0 0 5<br />
Cumberland 937 1 1 0 0 0 0 0 0 0 0 0 0 0 0 0 1 2<br />
Dallas 603 0 0 1 0 0 0 0 1 0 0 0 0 0 0 0 0 0<br />
Dovre 668 2 3 1 0 0 0 0 0 0 1 0 0 0 0 0 0 6<br />
Doyle 495 0 0 1 0 0 1 0 0 0 0 0 0 0 0 0 0 2<br />
Lakeland 942 2 1 3 0 0 1 0 2 0 0 0 0 0 0 0 3 12<br />
Maple Grove 940 1 0 1 0 0 1 0 0 0 0 0 0 0 0 0 8 18<br />
Maple Plain 731 1 138 0 0 0 0 0 0 0 0 0 0 0 0 0 0 6<br />
Oak Grove 887 2 5 2 0 0 2 0 0 0 0 0 0 0 0 0 1 14<br />
Prairie Farm 597 0 0 3 0 0 0 0 0 0 3 0 0 0 0 0 0 3<br />
Prairie Lake 1,359 0 3 2 0 0 0 0 1 0 1 0 0 0 0 0 1 4<br />
Rice Lake 2,973 5 7 8 1 0 1 1 4 1 0 1 1 0 0 0 12 20<br />
Sioux Creek 684 0 2 0 0 0 0 0 0 0 0 0 0 0 0 0 0 3<br />
Stanfold 657 0 1 6 0 0 0 0 6 0 0 0 0 0 0 0 0 5<br />
Stanley 2,198 1 3 13 0 0 3 1 6 1 2 0 0 0 0 0 0 14<br />
Sumner 591 1 0 1 0 0 0 0 1 0 0 0 0 0 0 0 0 5<br />
Turtle Lake 611 0 7 2 0 0 2 0 0 0 0 1 0 0 0 1 0 1<br />
Vance Creek 735 0 2 5 1 0 0 0 4 0 0 0 0 0 0 0 0 5<br />
Villages<br />
Almena 699 1 9 0 0 0 0 0 0 0 0 0 0 0 0 0 6 5<br />
Cameron 1,511 0 13 3 1 0 1 0 1 0 0 0 0 0 0 0 5 14<br />
Dallas 348 0 4 0 0 0 0 0 0 0 0 0 0 0 0 0 0 4<br />
Haugen 287 0 0 0 0 0 0 0 0 0 0 0 0 0 0 0 0 0<br />
New Auburn 557 0 1 0 0 0 0 0 0 0 0 0 0 0 0 0 0 4<br />
Prairie Farm 505 0 2 0 0 0 0 0 0 0 0 0 0 0 0 0 0 1<br />
Turtle Lake 1,005 0 48 3 0 0 1 0 2 0 0 0 0 0 0 0 0 9<br />
Cities<br />
Barron 3,148 20 5 8 0 0 6 1 1 0 0 5 0 0 5 0 34 28<br />
Chetek 2,150 2 7 5 0 0 2 0 1 1 1 1 0 0 1 0 2 13<br />
Cumberland 2,224 2 25 9 0 0 0 0 1 0 8 0 0 0 0 0 3 17<br />
Rice Lake 8,063 11 60 54 11 18 8 4 12 0 1 10 0 0 9 1 56 66<br />
Barron County 43,924 63 363 145 16 19 34 7 49 3 17 18 1 0 15 2 142 308<br />
Source: U.S. Census<br />
Korean<br />
Vietnamese<br />
Other Asian<br />
Hawaiian/Pacific<br />
Islander<br />
Hawaiian<br />
Guam/Chamorro<br />
Samoan<br />
Other Pacific<br />
Islander<br />
Some Other Race<br />
Two or More Races<br />
Barron County Conditions and Trends Report 33
Table 1.13<br />
Educational Attainment Levels – 1990 and 2000 – Barron County Municipal Units<br />
Town of Cedar Lake Town of Bear Lake Town of Barron<br />
Town of Arland Town of Almena<br />
Educational Level 1990 2000<br />
Number Percent Number Percent<br />
Persons 25 Years and Over 504 100.0 654 100.0<br />
Less than high school diploma 158 31.3 127 19.4<br />
High school graduate 227 45.0 282 43.1<br />
Some college, no degree 48 9.5 130 19.9<br />
Associate degree 30 6.0 45 6.9<br />
Bachelor’s degree or higher 41 8.1 70 10.7<br />
High school graduate or higher 346 68.7 527 80.6<br />
Persons 25 Years and Over 343 100.0 431 100.0<br />
Less than high school diploma 138 40.2 122 28.3<br />
High school graduate 137 39.9 149 34.6<br />
Some college, no degree 33 9.6 89 20.6<br />
Associate degree 17 5.0 33 7.7<br />
Bachelor’s degree or higher 18 5.2 38 8.8<br />
High school graduate or higher 205 59.8 309 71.7<br />
Persons 25 Years and Over 625 100.0 661 100.0<br />
Less than high school diploma 198 31.7 131 19.8<br />
High school graduate 232 37.1 245 37.1<br />
Some college, no degree 79 12.6 135 20.4<br />
Associate degree 55 8.8 52 7.9<br />
Bachelor’s degree or higher 61 9.8 98 14.8<br />
High school graduate or higher 427 68.3 530 80.2<br />
Persons 25 Years and Over 325 100.0 402 100.0<br />
Less than high school diploma 83 25.5 70 17.4<br />
High school graduate 132 40.6 178 44.3<br />
Some college, no degree 52 16.0 61 15.2<br />
Associate degree 35 10.8 35 8.7<br />
Bachelor’s degree or higher 23 7.1 58 14.4<br />
High school graduate or higher 242 74.5 332 82.6<br />
Persons 25 Years and Over 498 100.0 710 100.0<br />
Less than high school diploma 118 23.7 122 17.2<br />
High school graduate 197 39.6 285 40.1<br />
Some college, no degree 61 12.2 115 16.2<br />
Associate degree 50 10.0 68 9.6<br />
Bachelor’s degree or higher 72 14.5 120 16.9<br />
High school graduate or higher 380 76.3 588 82.8<br />
34 Issues and Opportunities Information
Table 1.13 continued<br />
Educational Attainment Levels – 1990 and 2000 – Barron County Municipal Units<br />
Town of Dallas Town of Cumberland Town of Crystal Lake Town of Clinton Town of Chetek<br />
Educational Level 1990 2000<br />
Number Percent Number Percent<br />
Persons 25 Years and Over 994 100.0 1,247 100.0<br />
Less than high school diploma 215 21.6 205 16.4<br />
High school graduate 445 44.8 503 40.3<br />
Some college, no degree 159 16.0 302 24.2<br />
Associate degree 80 8.0 92 7.4<br />
Bachelor’s degree or higher 95 9.6 145 11.6<br />
High school graduate or higher 779 78.4 1,042 83.6<br />
Persons 25 Years and Over 489 100.0 576 100.0<br />
Less than high school diploma 162 33.1 194 33.7<br />
High school graduate 190 38.9 218 37.8<br />
Some college, no degree 63 12.9 81 14.1<br />
Associate degree 38 7.8 46 8.0<br />
Bachelor’s degree or higher 36 7.4 37 6.4<br />
High school graduate or higher 327 66.9 382 66.3<br />
Persons 25 Years and Over 460 100.0 556 100.0<br />
Less than high school diploma 115 25.0 116 20.8<br />
High school graduate 192 41.7 243 43.7<br />
Some college, no degree 88 19.1 105 18.9<br />
Associate degree 33 7.2 42 7.6<br />
Bachelor’s degree or higher 32 7.0 50 9.0<br />
High school graduate or higher 345 75.0 440 79.1<br />
Persons 25 Years and Over 587 100.0 642 100.0<br />
Less than high school diploma 116 19.8 98 15.3<br />
High school graduate 249 42.4 271 42.2<br />
Some college, no degree 101 17.2 130 20.2<br />
Associate degree 65 11.1 68 10.6<br />
Bachelor’s degree or higher 56 9.5 75 11.7<br />
High school graduate or higher 471 80.2 544 84.7<br />
Persons 25 Years and Over 315 100.0 351 100.0<br />
Less than high school diploma 62 19.7 47 13.4<br />
High school graduate 141 44.8 135 38.5<br />
Some college, no degree 42 13.3 82 23.4<br />
Associate degree 35 11.1 34 9.7<br />
Bachelor’s degree or higher 35 11.1 53 15.1<br />
High school graduate or higher 253 80.3 304 86.6<br />
Barron County Conditions and Trends Report 35
Table 1.13 continued<br />
Educational Attainment Levels – 1990 and 2000 – Barron County Municipal Units<br />
Town of Maple Plain Town of Maple Grove Town of Lakeland Town of Doyle<br />
Town of Dovre<br />
Educational Level 1990 2000<br />
Number Percent Number Percent<br />
Persons 25 Years and Over 343 100.0 441 100.0<br />
Less than high school diploma 90 26.2 76 17.2<br />
High school graduate 162 47.2 215 48.8<br />
Some college, no degree 48 14.0 76 17.2<br />
Associate degree 23 67.1 41 9.3<br />
Bachelor’s degree or higher 20 5.8 33 7.5<br />
High school graduate or higher 253 73.8 365 82.8<br />
Persons 25 Years and Over 262 100.0 299 100.0<br />
Less than high school diploma 69 26.3 59 19.7<br />
High school graduate 92 35.1 124 41.5<br />
Some college, no degree 41 15.6 57 19.1<br />
Associate degree 33 12.6 29 9.7<br />
Bachelor’s degree or higher 27 10.3 30 10.1<br />
High school graduate or higher 193 73.7 240 80.3<br />
Persons 25 Years and Over 495 100.0 652 100.0<br />
Less than high school diploma 122 24.6 97 14.9<br />
High school graduate 172 34.7 257 39.4<br />
Some college, no degree 84 17.0 129 19.8<br />
Associate degree 51 10.3 38 5.8<br />
Bachelor’s degree or higher 66 13.3 131 20.1<br />
High school graduate or higher 373 75.4 555 85.1<br />
Persons 25 Years and Over 562 100.0 621 100.0<br />
Less than high school diploma 162 28.8 143 23.0<br />
High school graduate 257 45.7 243 39.1<br />
Some college, no degree 45 8.0 94 15.1<br />
Associate degree 53 9.4 59 9.5<br />
Bachelor’s degree or higher 45 8.0 82 13.2<br />
High school graduate or higher 400 71.2 478 77.0<br />
Persons 25 Years and Over 368 100.0 566 100.0<br />
Less than high school diploma 77 20.9 67 11.8<br />
High school graduate 156 42.4 234 41.3<br />
Some college, no degree 42 11.4 102 18.0<br />
Associate degree 30 8.2 35 6.2<br />
Bachelor’s degree or higher 63 17.1 128 22.6<br />
High school graduate or higher 291 79.1 499 88.2<br />
36 Issues and Opportunities Information
Table 1.13 continued<br />
Educational Attainment Levels – 1990 and 2000 – Barron County Municipal Units<br />
Town of Sioux Creek Town of Rice Lake Town of Prairie Lake Town of Prairie Farm Town of Oak Grove<br />
Education Level 1990 2000<br />
Number Percent Number Percent<br />
Persons 25 Years and Over 561 100.0 568 100.0<br />
Less than high school diploma 164 29.2 132 23.2<br />
High school graduate 247 44.0 225 39.6<br />
Some college, no degree 83 14.8 93 16.4<br />
Associate degree 36 6.4 68 12.0<br />
Bachelor’s degree or higher 31 5.5 50 8.8<br />
High school graduate or higher 397 70.8 436 76.8<br />
Persons 25 Years and Over 352 100.0 380 100.0<br />
Less than high school diploma 96 27.3 51 13.4<br />
High school graduate 185 52.6 168 44.2<br />
Some college, no degree 44 12.5 87 22.9<br />
Associate degree 9 2.6 33 8.7<br />
Bachelor’s degree or higher 18 5.1 41 10.8<br />
High school graduate or higher 256 72.7 329 86.6<br />
Persons 25 Years and Over 765 100.0 907 100.0<br />
Less than high school diploma 210 27.5 168 18.5<br />
High school graduate 329 43.0 361 39.8<br />
Some college, no degree 104 13.6 180 19.8<br />
Associate degree 48 6.3 66 7.3<br />
Bachelor’s degree or higher 74 9.7 132 14.5<br />
High school graduate or higher 555 72.5 739 81.5<br />
Persons 25 Years and Over 1,561 100.0 2,019 100.0<br />
Less than high school diploma 283 18.1 239 11.8<br />
High school graduate 582 37.3 635 31.5<br />
Some college, no degree 231 14.8 380 18.8<br />
Associate degree 160 10.2 251 12.4<br />
Bachelor’s degree or higher 305 19.5 514 25.4<br />
High school graduate or higher 1,278 81.9 1,780 88.2<br />
Persons 25 Years and Over 380 100.0 413 100.0<br />
Less than high school diploma 107 28.2 59 14.3<br />
High school graduate 172 45.3 157 38.0<br />
Some college, no degree 52 13.7 93 22.5<br />
Associate degree 19 5.0 37 9.0<br />
Bachelor’s degree or higher 30 7.9 67 16.2<br />
High school graduate or higher 273 71.8 354 85.7<br />
Barron County Conditions and Trends Report 37
Table 1.13 continued<br />
Educational Attainment Levels – 1990 and 2000 – Barron County Municipal Units<br />
Town of Vance Creek Town of Turtle Lake Town of Sumner Town of Stanley Town of Stanford<br />
Educational Level 1990 2000<br />
Number Percent Number Percent<br />
Persons 25 Years and Over 429 100.0 455 100.0<br />
Less than high school diploma 134 31.2 77 16.9<br />
High school graduate 148 34.5 176 38.7<br />
Some college, no degree 63 14.7 88 19.3<br />
Associate degree 52 12.1 53 11.6<br />
Bachelor’s degree or higher 32 7.5 61 13.4<br />
High school graduate or higher 295 68.8 378 83.1<br />
Persons 25 Years and Over 1,251 100.0 1,480 100.0<br />
Less than high school diploma 268 21.4 199 13.5<br />
High school graduate 528 42.2 665 44.9<br />
Some college, no degree 213 17.0 251 17.0<br />
Associate degree 101 8.1 111 7.5<br />
Bachelor’s degree or higher 141 11.3 254 17.2<br />
High school graduate or higher 983 78.6 1,281 86.6<br />
Persons 25 Years and Over 356 100.0 410 100.0<br />
Less than high school diploma 96 27.0 55 13.4<br />
High school graduate 147 41.3 180 43.9<br />
Some college, no degree 51 14.3 92 22.4<br />
Associate degree 28 7.9 32 7.8<br />
Bachelor’s degree or higher 34 9.6 51 12.5<br />
High school graduate or higher 260 73.0 355 86.6<br />
Persons 25 Years and Over 376 100.0 400 100.0<br />
Less than high school diploma 106 28.2 72 18.0<br />
High school graduate 191 50.8 211 52.8<br />
Some college, no degree 45 12.0 70 17.5<br />
Associate degree 25 6.6 23 5.8<br />
Bachelor’s degree or higher 9 2.4 24 6.0<br />
High school graduate or higher 270 71.8 328 82.0<br />
Persons 25 Years and Over 392 100.0 452 100.0<br />
Less than high school diploma 104 26.5 70 15.5<br />
High school graduate 194 49.5 226 50.0<br />
Some college, no degree 59 15.1 90 19.9<br />
Associate degree 12 3.1 21 4.6<br />
Bachelor’s degree or higher 23 5.9 45 10.0<br />
High school graduate or higher 288 73.5 382 84.5<br />
38 Issues and Opportunities Information
Table 1.13 continued<br />
Educational Attainment Levels – 1990 and 2000 – Barron County Municipal Units<br />
Village of Haugen Village of Dallas Village of Cameron Village of Almena<br />
Educational Level 1990 2000<br />
Number Percent Number Percent<br />
Persons 25 Years and Over 370 100.0 430 100.0<br />
Less than high school diploma 121 32.7 95 22.1<br />
High school graduate 152 41.1 184 42.8<br />
Some college, no degree 57 15.4 79 18.4<br />
Associate degree 27 7.3 32 7.4<br />
Bachelor’s degree or higher 13 3.5 40 9.3<br />
High school graduate or higher 249 67.3 335 77.9<br />
Persons 25 Years and Over 788 100.0 980 100.0<br />
Less than high school diploma 204 25.9 161 16.4<br />
High school graduate 304 38.6 411 41.9<br />
Some college, no degree 148 18.8 205 20.9<br />
Associate degree 70 8.9 85 8.7<br />
Bachelor’s degree or higher 62 7.9 118 12.0<br />
High school graduate or higher 584 74.1 819 83.6<br />
Persons 25 Years and Over 338 100.0 266 100.0<br />
Less than high school diploma 149 44.1 96 36.0<br />
High school graduate 126 37.3 99 37.2<br />
Some college, no degree 25 7.4 33 12.4<br />
Associate degree 21 6.2 28 10.5<br />
Bachelor’s degree or higher 17 5.0 10 3.8<br />
High school graduate or higher 189 55.9 170 63.9<br />
Persons 25 Years and Over 175 100.0 196 100.0<br />
Less than high school diploma 43 24.6 39 19.9<br />
High school graduate 91 52.0 88 44.9<br />
Some college, no degree 21 12.0 44 22.4<br />
Associate degree 15 8.6 10 5.1<br />
Bachelor’s degree or higher 5 2.9 15 7.7<br />
High school graduate or higher 132 75.4 157 80.1<br />
Village of New Auburn*<br />
Persons 25 Years and Over 19 100.0 8 100.0<br />
Less than high school diploma 5 26.3 3 37.5<br />
High school graduate 10 52.6 2 25.0<br />
Some college, no degree 4 21.1 3 37.5<br />
Associate degree 0 0.0 0 0.0<br />
Bachelor’s degree or higher 0 0.0 0 0.0<br />
High school graduate or higher 14 73.7 5 62.5<br />
*Portion in Barron County only.<br />
Barron County Conditions and Trends Report 39
Table 1.13 continued<br />
Educational Attainment Levels – 1990 and 2000 – Barron County Municipal Units<br />
City of Chetek<br />
City of Barron Village of Turtle Lake* Village of Prairie Farm<br />
Educational Level 1990 2000<br />
Number Percent Number Percent<br />
Persons 25 Years and Over 329 100.0 361 100.0<br />
Less than high school diploma 172 52.3 104 28.8<br />
High school graduate 96 26.1 156 43.2<br />
Some college, no degree 29 8.8 57 15.8<br />
Associate degree 17 5.2 23 6.4<br />
Bachelor’s degree or higher 25 7.6 21 5.9<br />
High school graduate or higher 157 47.7 257 71.2<br />
Persons 25 Years and Over 531 100.0 648 100.0<br />
Less than high school diploma 159 29.9 140 21.6<br />
High school graduate 238 44.8 317 48.9<br />
Some college, no degree 54 10.2 91 14.0<br />
Associate degree 37 7.0 30 4.6<br />
Bachelor’s degree or higher 43 8.1 70 10.8<br />
High school graduate or higher 372 70.1 508 78.4<br />
Persons 25 Years and Over 1,962 100.0 2,145 100.0<br />
Less than high school diploma 534 27.2 431 20.1<br />
High school graduate 721 36.7 826 38.5<br />
Some college, no degree 253 12.9 377 17.6<br />
Associate degree 125 6.4 138 6.4<br />
Bachelor’s degree or higher 329 16.8 373 17.4<br />
High school graduate or higher 1,428 72.8 1,714 79.9<br />
Persons 25 Years and Over 1,407 100.0 1,545 100.0<br />
Less than high school diploma 487 34.6 360 23.3<br />
High school graduate 535 38.0 592 38.3<br />
Some college, no degree 174 12.4 259 16.8<br />
Associate degree 57 4.1 113 7.3<br />
Bachelor’s degree or higher 154 10.9 221 14.3<br />
High school graduate or higher 920 65.4 1,185 76.7<br />
City of Cumberland<br />
Persons 25 Years and Over 1,498 100.0 1,610 100.0<br />
Less than high school diploma 394 26.3 263 16.3<br />
High school graduate 555 37.0 657 40.8<br />
Some college, no degree 234 15.6 319 19.8<br />
Associate degree 85 5.7 91 5.7<br />
Bachelor’s degree or higher 230 15.4 280 17.4<br />
High school graduate or higher 1,104 73.7 1,347 83.7<br />
**Includes portion in Polk County.<br />
40 Issues and Opportunities Information
Table 1.13 continued<br />
Educational Attainment Levels – 1990 and 2000 – Barron County Municipal Units<br />
City of Rice Lake<br />
Educational Level 1990 2000<br />
Number Percent Number Percent<br />
Persons 25 Years and Over 5,188 100.0 5,478 100.0<br />
Less than high school diploma 1,359 26.2 795 14.5<br />
High school graduate 1,639 31.6 1,906 34.8<br />
Some college, no degree 938 18.1 1,239 22.6<br />
Associate degree 439 8.5 620 11.3<br />
Bachelor’s degree or higher 813 15.7 918 16.8<br />
High school graduate or higher 3,829 73.8 4,683 85.5<br />
Barron County<br />
Persons 25 Years and Over 26,198 100.0 29,942 100.0<br />
Less than high school diploma 7,080 27.0 5,281 17.6<br />
High school graduate 10,161 38.9 11,816 39.5<br />
Some college, no degree 3,868 14.8 5,810 19.4<br />
Associate degree 2,011 7.7 2,582 8.6<br />
Bachelor’s degree or higher 3,078 11.8 4,453 14.9<br />
High school graduate or higher 19,118 73.0 24,661 82.4<br />
source: U.S. Census<br />
Barron County Conditions and Trends Report 41
Table 1.14<br />
Labor Force – 1990 and 2000 – Barron County Municipal Units<br />
Town of Almena<br />
Persons<br />
16 and<br />
over<br />
# in Labor<br />
Force<br />
% in<br />
Labor<br />
Force Employed Unemployed<br />
%<br />
Unemployed<br />
1990 605 415 68.1 383 29 7.0<br />
2000 757 511 67.5 499 12 1.6<br />
Town of Arland<br />
1990 432 312 72.2 293 19 6.1<br />
2000 516 384 74.4 358 26 5.1<br />
Town of Barron<br />
1990 727 472 64.9 442 30 6.4<br />
2000 817 580 71.0 573 7 0.9<br />
Town of Bear Lake<br />
1990 376 276 73.4 254 22 8.0<br />
2000 467 336 71.9 309 27 5.8<br />
Town of Cedar Lake<br />
1990 574 375 65.3 355 18 4.8<br />
2000 788 529 67.0 490 36 4.6<br />
Town of Chetek<br />
1990 1,116 646 57.9 600 46 7.1<br />
2000 1,380 847 61.4 812 35 2.5<br />
Town of Clinton<br />
1990 575 393 68.3 384 9 2.3<br />
2000 716 495 69.1 475 20 2.8<br />
Town of Crystal Lake<br />
1990 550 374 68.0 346 28 7.5<br />
2000 627 406 64.8 381 25 4.0<br />
Town of Cumberland<br />
1990 671 460 68.6 434 26 1.5<br />
2000 710 477 67.2 466 11 5.7<br />
Town of Dallas<br />
1990 373 273 73.2 261 12 4.4<br />
2000 402 301 74.9 299 2 0.5<br />
Town of Dovre<br />
1990 395 262 66.3 230 32 12.2<br />
2000 545 390 71.6 350 37 6.8<br />
42 Issues and Opportunities Information
Table 1.14 continued<br />
Labor Force – 1990 and 2000 – Barron County Municipal Units<br />
Town of Doyle<br />
Persons<br />
16 and<br />
over<br />
# in Labor<br />
Force<br />
% in<br />
Labor<br />
Force Employed Unemployed<br />
%<br />
Unemployed<br />
1990 314 237 75.5 216 21 8.9<br />
2000 357 276 77.3 267 9 2.5<br />
Town of Lakeland<br />
1990 561 352 62.7 319 33 9.4<br />
2000 743 520 70.0 504 16 2.2<br />
Town of Maple Grove<br />
1990 661 480 72.6 456 24 5.0<br />
2000 722 567 78.5 527 40 5.5<br />
Town of Maple Plain<br />
1990 440 302 68.6 250 52 17.2<br />
2000 665 455 68.4 420 35 5.3<br />
Town of Oak Grove<br />
1990 660 505 76.5 465 40 7.9<br />
2000 690 478 69.3 469 9 1.3<br />
Town of Prairie Farm<br />
1990 399 287 71.9 270 17 5.9<br />
2000 418 324 77.5 315 9 2.2<br />
Town of Prairie Lake<br />
1990 857 526 61.4 507 19 3.6<br />
2000 1,053 669 63.5 645 24 2.3<br />
Town of Rice Lake<br />
1990 1,876 1,432 76.3 1,378 50 3.5<br />
2000 2,425 1,762 72.7 1,679 83 3.4<br />
Town of Sioux Creek<br />
1990 443 300 67.7 264 36 12.0<br />
2000 512 406 79.3 385 21 4.1<br />
Town of Stanfold<br />
1990 520 359 69.0 341 18 5.0<br />
2000 508 368 72.4 353 15 3.0<br />
Town of Stanley<br />
1990 1,466 1,072 73.1 1,012 59 5.5<br />
2000 1,717 1,295 75.4 1,223 72 4.2<br />
Barron County Conditions and Trends Report 43
Table 1.14 continued<br />
Labor Force – 1990 and 2000 – Barron County Municipal Units<br />
Town of Sumner<br />
Persons<br />
16 and<br />
over<br />
# in Labor<br />
Force<br />
% in<br />
Labor<br />
Force Employed Unemployed<br />
%<br />
Unemployed<br />
1990 428 290 67.8 262 28 9.7<br />
2000 489 358 73.2 324 34 7.0<br />
Town of Turtle Lake<br />
1990 454 355 78.2 331 24 6.8<br />
2000 478 332 69.5 325 7 1.5<br />
Town of Vance Creek<br />
1990 457 285 62.4 269 16 5.6<br />
2000 532 359 67.5 344 15 2.8<br />
Village of Almena<br />
1990 450 235 65.5 255 40 13.5<br />
2000 505 346 68.5 318 28 5.5<br />
Village of Cameron<br />
1990 911 615 67.5 552 63 10.2<br />
2000 1,180 815 69.1 778 34 2.9<br />
Village of Dallas<br />
1990 380 198 52.1 185 13 6.6<br />
2000 305 155 5.08 154 1 0.3<br />
Village of Haugen<br />
1990 200 142 71.0 129 13 9.2<br />
2000 223 141 63.2 133 8 3.6<br />
Village of New Auburn (Includes portion in Barron County only)<br />
1990 27 11 40.7 11 0 0.0<br />
2000 14 9 64.3 9 0 0.0<br />
Village of Prairie Farm<br />
1990 358 186 52.0 158 28 15.1<br />
2000 430 267 62.1 264 3 0.7<br />
Village of Turtle Lake (Includes portion in Polk County)<br />
1990 619 340 54.9 309 64 9.1<br />
2000 801 509 63.5 475 34 4.2<br />
City of Barron<br />
1990 2,280 1,392 61.1 1,340 52 3.7<br />
2000 2,549 1,650 64.7 1,562 88 3.5<br />
44 Issues and Opportunities Information
Table 1.14 continued<br />
Labor Force – 1990 and 2000 – Barron County Municipal Units<br />
City of Chetek<br />
Persons<br />
16 and<br />
over<br />
# in Labor<br />
Force<br />
% in<br />
Labor<br />
Force Employed Unemployed<br />
%<br />
Unemployed<br />
1990 1,565 792 50.6 726 66 8.3<br />
2000 1,745 1,003 57.5 932 68 3.9<br />
City of Cumberland<br />
1990 1,694 926 54.7 853 69 7.5<br />
2000 1,845 1,100 59.6 1,048 52 2.8<br />
City of Rice Lake<br />
1990 6,184 3,838 62.1 3,622 209 5.5<br />
2000 6,429 4,321 66.2 4,135 186 2.8<br />
Barron County<br />
1990 30,598 19,772 64.6 18,462 1,292 6.5<br />
2000 35,130 23,720 67.5 22,583 1,126 3.2<br />
source: U.S. Census<br />
Table 1.15<br />
Barron County Non-Farm Wage and Salary Employment – 1990 to 2008<br />
Industry Category 1990 1992 1994 1996 1998 2000 2002* 2008+<br />
Total Non-farm 16,050 17,353 18,659 19,901 21,073 21,554 21,543 21,418<br />
Goods Producing 6,185 6,577 6,711 7,142 7,510 7,654 7,351 5,205<br />
Construction & Mining 421 460 534 617 697 788 759 632<br />
Manufacturing 5,763 6,117 6,177 6,524 6,812 6,867 6,592 4,573<br />
Durable 2,693 3,069 3,008 2,951 3,300 3,486 3,416 NA<br />
Non-durable 3,071 3,048 3,169 3,573 3,513 3,380 3,176 NA<br />
Service Producing 9,866 10,776 11,949 12,760 13,563 13,900 14,192 16,213<br />
Transportation, Comm. & Utilities 682 709 712 621 611 638 686 456<br />
Total Trade 3,581 3,850 4,035 4,311 4,454 4,814 4,806 3,829<br />
Wholesale Trade 516 521 587 536 549 565 585 NA<br />
Retail Trade 3,065 3,329 3,448 3,776 3,906 4,249 4,221 NA<br />
Finance, Insurance & Real Estate 484 465 451 459 491 436 406 675<br />
Services & Misc. 2,514 3,059 3,842 3,308 3,717 3,621 3,834 2,311<br />
Total Government 2,605 2,693 2,909 4,061 4,290 4,392 4,460 4,578<br />
Federal 132 151 156 160 159 183 157 117<br />
State 312 169 194 190 208 227 218 183<br />
Local 2,161 2,373 2,560 3,711 3,923 3,982 4,084 4,278<br />
*average January to August 2002 + January 2008<br />
source: <strong>Wisconsin</strong> Department of Workforce Development<br />
Barron County Conditions and Trends Report 45
Table 1.16<br />
Employment By Industry – 1990 and 2000 – Barron County Municipal Units<br />
(yellow shading indicates combined categories)<br />
Town of Almena<br />
1990 2000<br />
Number Percent Number Percent<br />
Agriculture, forestry, fishing, hunting & mining 133 34.7 67 13.4<br />
Construction 20 5.2 47 9.4<br />
Manufacturing 63 16.5 104 20.8<br />
Wholesale trade 12 3.1 15 3.0<br />
Retail trade 51 13.3 50 10.0<br />
Transportation, warehousing and utilities 7 1.8 27 5.4<br />
Information 0 0.0 12 2.4<br />
Finance, insurance, real estate, rental & leasing 14 3.7 9 1.8<br />
Professional, scientific, management,<br />
administrative and waste management services<br />
17 4.4 28 5.6<br />
Educational, health and social services 44 11.5 75 15.0<br />
Arts, entertainment, recreation, accommodation<br />
and food services<br />
11 2.8 40 8.0<br />
Other services, except public administration 17 3.4<br />
Public administration 11 2.8 8 1.6<br />
Total Employment (16 years and over) 383 100.0 499 100.0<br />
Town of Arland<br />
Agriculture, forestry, fishing, hunting & mining 138 47.1 89 24.9<br />
Construction 8 2.7 16 4.5<br />
Manufacturing 68 23.2 94 26.3<br />
Wholesale trade 6 2.1 6 1.7<br />
Retail trade 15 5.1 31 8.7<br />
Transportation, warehousing and utilities 7 2.4 11 3.1<br />
Information 0 0.0 6 1.7<br />
Finance, insurance, real estate, rental & leasing 2 0.7 10 2.8<br />
Professional, scientific, management,<br />
administrative and waste management services<br />
9 3.1 7 2.0<br />
Educational, health and social services 24 8.2 4.3 12.0<br />
Arts, entertainment, recreation, accommodation<br />
and food services<br />
9 3.1 21 5.9<br />
Other services, except public administration 19 5.3<br />
Public administration 7 2.4 5 1.4<br />
Total Employment (16 years and over) 293 100.0 358 100.0<br />
46 Issues and Opportunities Information
Table 1.16 continued<br />
Employment By Industry – 1990 and 2000 – Barron County Municipal Units<br />
(yellow shading indicates combined categories)<br />
Town of Barron<br />
1990 2000<br />
Number Percent Number Percent<br />
Agriculture, forestry, fishing, hunting & mining 129 29.2 81 14.1<br />
Construction 15 3.4 27 4.7<br />
Manufacturing 69 15.6 141 24.6<br />
Wholesale trade 15 3.4 21 3.7<br />
Retail trade 55 12.4 52 9.1<br />
Transportation, warehousing and utilities 15 3.4 25 4.4<br />
Information 0 0.0 6 1.0<br />
Finance, insurance, real estate, rental & leasing 21 4.8 30 5.2<br />
Professional, scientific, management,<br />
administrative and waste management services<br />
19 4.3 30 5.2<br />
Educational, health and social services 50 11.3 101 17.6<br />
Arts, entertainment, recreation, accommodation<br />
and food services<br />
35 7.9 26 4.5<br />
Other services, except public administration 24 4.2<br />
Public administration 19 4.3 21 3.7<br />
Total Employment (16 years and over) 442 100.0 573 100.0<br />
Town of Bear Lake<br />
Agriculture, forestry, fishing, hunting & mining 55 21.7 51 16.5<br />
Construction 25 9.8 22 7.1<br />
Manufacturing 40 15.8 98 31.7<br />
Wholesale trade 6 2.4 8 2.6<br />
Retail trade 46 18.1 28 9.1<br />
Transportation, warehousing and utilities 7 2.8 4 1.3<br />
Information 0 0.0 3 1.0<br />
Finance, insurance, real estate, rental & leasing 7 2.8 4 1.3<br />
Professional, scientific, management,<br />
administrative and waste management services<br />
24 9.5 9 2.9<br />
Educational, health and social services 30 11.8 57 18.4<br />
Arts, entertainment, recreation, accommodation<br />
and food services<br />
10 3.9 14 4.5<br />
Other services, except public administration 9 2.9<br />
Public administration 4 1.6 2 0.6<br />
Total Employment (16 years and over) 254 100.0 309 100.0<br />
Barron County Conditions and Trends Report 47
Table 1.16 continued<br />
Employment By Industry – 1990 and 2000 – Barron County Municipal Units<br />
(yellow shading indicates combined categories)<br />
Town of Cedar Lake<br />
1990 2000<br />
Number Percent Number Percent<br />
Agriculture, forestry, fishing, hunting & mining 45 12.7 24 4.9<br />
Construction 33 9.3 32 6.5<br />
Manufacturing 81 22.8 110 22.4<br />
Wholesale trade 9 2.5 20 4.1<br />
Retail trade 44 12.4 83 16.9<br />
Transportation, warehousing and utilities 20 5.6 27 5.5<br />
Information 0 0.0 15 3.1<br />
Finance, insurance, real estate, rental & leasing 19 5.4 8 1.6<br />
Professional, scientific, management,<br />
administrative and waste management services<br />
28 7.9 24 4.9<br />
Educational, health and social services 53 14.9 93 19.0<br />
Arts, entertainment, recreation, accommodation<br />
and food services<br />
17 4.8 35 7.1<br />
Other services, except public administration 16 3.3<br />
Public administration 6 1.7 3 0.6<br />
Total Employment (16 years and over) 355 100.0 490 100.0<br />
Town of Chetek<br />
Agriculture, forestry, fishing, hunting & mining 58 9.7 53 6.5<br />
Construction 26 4.3 71 8.7<br />
Manufacturing 111 18.5 174 21.4<br />
Wholesale trade 11 1.8 24 3.0<br />
Retail trade 115 19.2 109 13.4<br />
Transportation, warehousing and utilities 54 9.0 47 5.8<br />
Information 0 0.0 13 1.6<br />
Finance, insurance, real estate, rental & leasing 32 5.3 29 3.6<br />
Professional, scientific, management,<br />
administrative and waste management services<br />
43 7.2 35 4.3<br />
Educational, health and social services 107 17.8 136 16.7<br />
Arts, entertainment, recreation, accommodation<br />
and food services<br />
26 4.3 65 8.0<br />
Other services, except public administration 36 4.4<br />
Public administration 17 2.8 20 2.5<br />
Total Employment (16 years and over) 600 100.0 812 100.0<br />
48 Issues and Opportunities Information
Table 1.16 continued<br />
Employment By Industry – 1990 and 2000 – Barron County Municipal Units<br />
(yellow shading indicates combined categories)<br />
Town of Clinton<br />
1990 2000<br />
Number Percent Number Percent<br />
Agriculture, forestry, fishing, hunting & mining 129 33.6 123 25.9<br />
Construction 20 5.2 25 5.3<br />
Manufacturing 96 25.0 100 21.1<br />
Wholesale trade 8 2.1 19 4.0<br />
Retail trade 29 7.6 19 4.0<br />
Transportation, warehousing and utilities 24 6.3 33 6.9<br />
Information 0 0.0 7 1.5<br />
Finance, insurance, real estate, rental & leasing 6 1.6 4 0.8<br />
Professional, scientific, management,<br />
administrative and waste management services<br />
23 6.0 7 1.6<br />
Educational, health and social services 33 8.6 68 14.3<br />
Arts, entertainment, recreation, accommodation<br />
and food services 9 2.3 39 8.2<br />
Other services, except public administration 13 2.7<br />
Public administration 7 1.8 18 3.8<br />
Total Employment (16 years and over) 384 100.0 475 100.0<br />
Town of Crystal Lake<br />
Agriculture, forestry, fishing, hunting & mining 50 14.5 29 7.6<br />
Construction 14 4.1 23 6.0<br />
Manufacturing 112 32.4 134 35.2<br />
Wholesale trade 8 2.3 0 0.0<br />
Retail trade 58 16.8 33 8.7<br />
Transportation, warehousing and utilities 21 6.1 13 3.4<br />
Information 0 0.0 10 2.6<br />
Finance, insurance, real estate, rental & leasing 6 1.7 5 1.3<br />
Professional, scientific, management,<br />
administrative and waste management services 11 3.2 14 3.7<br />
Educational, health and social services 43 12.4 73 19.2<br />
Arts, entertainment, recreation, accommodation<br />
and food services<br />
16 4.6 37 9.7<br />
Other services, except public administration 8 2.1<br />
Public administration 7 2.0 2 0.5<br />
Total Employment (16 years and over) 346 100.0 381 100.0<br />
Barron County Conditions and Trends Report 49
Table 1.16 continued<br />
Employment By Industry – 1990 and 2000 – Barron County Municipal Units<br />
(yellow shading indicates combined categories)<br />
Town of Cumberland<br />
1990 2000<br />
Number Percent Number Percent<br />
Agriculture, forestry, fishing, hunting & mining 93 21.4 57 12.2<br />
Construction 23 5.3 25 5.4<br />
Manufacturing 112 25.8 166 35.6<br />
Wholesale trade 10 2.3 4 0.9<br />
Retail trade 46 10.6 40 8.6<br />
Transportation, warehousing and utilities 21 4.8 20 4.3<br />
Information 0 0.0 13 2.8<br />
Finance, insurance, real estate, rental & leasing 10 2.3 13 2.8<br />
Professional, scientific, management,<br />
administrative and waste management services 7 1.6 14 3.0<br />
Educational, health and social services 67 15.4 72 15.5<br />
Arts, entertainment, recreation, accommodation<br />
and food services<br />
26 6.0 17 3.6<br />
Other services, except public administration 16 3.4<br />
Public administration 19 4.4 9 1.9<br />
Total Employment (16 years and over) 434 100.0 466 100.0<br />
Town of Dallas<br />
Agriculture, forestry, fishing, hunting & mining 123 47.1 51 17.1<br />
Construction 10 3.8 24 8.0<br />
Manufacturing 36 13.8 51 17.1<br />
Wholesale trade 15 5.8 8 2.7<br />
Retail trade 22 8.4 29 9.7<br />
Transportation, warehousing and utilities 13 5.0 25 8.4<br />
Information 0 0.0 11 3.7<br />
Finance, insurance, real estate, rental & leasing 13 5.0 4 1.3<br />
Professional, scientific, management,<br />
administrative and waste management services 0 0.0 14 4.7<br />
Educational, health and social services 16 6.1 51 17.1<br />
Arts, entertainment, recreation, accommodation<br />
and food services<br />
7 2.7 20 6.7<br />
Other services, except public administration 6 2.0<br />
Public administration 6 2.3 5 1.7<br />
Total Employment (16 years and over) 261 100.0 299 100.0<br />
50 Issues and Opportunities Information
Table 1.16 continued<br />
Employment By Industry – 1990 and 2000 – Barron County Municipal Units<br />
(yellow shading indicates combined categories)<br />
Town of Dovre<br />
1990 2000<br />
Number Percent Number Percent<br />
Agriculture, forestry, fishing, hunting & mining 51 22.2 41 11.7<br />
Construction 7 3.0 20 5.7<br />
Manufacturing 38 16.5 72 20.6<br />
Wholesale trade 6 2.6 8 2.3<br />
Retail trade 52 22.6 38 10.9<br />
Transportation, warehousing and utilities 18 7.8 29 8.3<br />
Information 0 0.0 3 0.9<br />
Finance, insurance, real estate, rental & leasing 7 3.0 15 4.3<br />
Professional, scientific, management,<br />
administrative and waste management services 10 4.4 20 5.7<br />
Educational, health and social services 33 14.4 48 13.7<br />
Arts, entertainment, recreation, accommodation<br />
and food services<br />
2 0.9 28 8.0<br />
Other services, except public administration 26 7.4<br />
Public administration 6 2.6 2 0.6<br />
Total Employment (16 years and over) 230 100.0 350 100.0<br />
Town of Doyle<br />
Agriculture, forestry, fishing, hunting & mining 40 18.5 48 18.0<br />
Construction 22 10.2 15 5.6<br />
Manufacturing 55 25.5 76 28.5<br />
Wholesale trade 12 5.6 4 1.5<br />
Retail trade 21 9.7 45 16.9<br />
Transportation, warehousing and utilities 10 4.6 8 3.0<br />
Information 0 0.0 2 0.7<br />
Finance, insurance, real estate, rental & leasing 6 2.8 7 2.6<br />
Professional, scientific, management,<br />
administrative and waste management services 4 1.9 6 2.2<br />
Educational, health and social services 28 13.0 27 10.1<br />
Arts, entertainment, recreation, accommodation<br />
and food services<br />
9 4.2 14 5.2<br />
Other services, except public administration 7 2.6<br />
Public administration 9 4.2 8 3.0<br />
Total Employment (16 years and over) 216 100.0 267 100.0<br />
Barron County Conditions and Trends Report 51
Table 1.16 continued<br />
Employment By Industry – 1990 and 2000 – Barron County Municipal Units<br />
(yellow shading indicates combined categories)<br />
Town of Lakeland<br />
1990 2000<br />
Number Percent Number Percent<br />
Agriculture, forestry, fishing, hunting & mining 33 10.3 40 7.9<br />
Construction 29 9.1 41 8.1<br />
Manufacturing 100 31.4 139 27.6<br />
Wholesale trade 9 2.8 8 1.6<br />
Retail trade 39 12.2 60 11.9<br />
Transportation, warehousing and utilities 12 3.8 32 6.3<br />
Information 0 0.0 6 1.2<br />
Finance, insurance, real estate, rental & leasing 2 0.6 12 2.4<br />
Professional, scientific, management,<br />
administrative and waste management services 15 4.7 31 6.2<br />
Educational, health and social services 63 19.8 70 13.9<br />
Arts, entertainment, recreation, accommodation<br />
and food services<br />
9 2.8 36 7.1<br />
Other services, except public administration 17 3.4<br />
Public administration 8 2.5 12 2.4<br />
Total Employment (16 years and over) 319 100.0 504 100.0<br />
Town of Maple Grove<br />
Agriculture, forestry, fishing, hunting & mining 114 25.0 97 18.4<br />
Construction 23 5.0 37 7.0<br />
Manufacturing 103 22.6 129 24.5<br />
Wholesale trade 24 5.3 11 2.1<br />
Retail trade 40 8.8 52 9.9<br />
Transportation, warehousing and utilities 31 6.8 25 4.7<br />
Information 0 0.0 2 0.4<br />
Finance, insurance, real estate, rental & leasing 12 2.6 12 2.3<br />
Professional, scientific, management,<br />
administrative and waste management services 27 5.9 20 3.8<br />
Educational, health and social services 49 10.8 81 15.4<br />
Arts, entertainment, recreation, accommodation<br />
and food services<br />
19 4.2 15 2.8<br />
Other services, except public administration 34 6.5<br />
Public administration 14 3.1 12 2.3<br />
Total Employment (16 years and over) 456 100.0 527 100.0<br />
52 Issues and Opportunities Information
Table 1.16 continued<br />
Employment By Industry – 1990 and 2000 – Barron County Municipal Units<br />
(yellow shading indicates combined categories)<br />
Town of Maple Plain<br />
1990 2000<br />
Number Percent Number Percent<br />
Agriculture, forestry, fishing, hunting & mining 5 2.0 27 6.4<br />
Construction 10 4.0 27 6.4<br />
Manufacturing 81 32.4 103 24.5<br />
Wholesale trade 5 2.0 3 0.7<br />
Retail trade 25 10.0 28 6.7<br />
Transportation, warehousing and utilities 8 3.2 18 4.3<br />
Information 0 0.0 4 1.0<br />
Finance, insurance, real estate, rental & leasing 12 4.8 19 4.5<br />
Professional, scientific, management,<br />
administrative and waste management services<br />
16 6.4 22 5.2<br />
Educational, health and social services 52 20.8 99 23.6<br />
Arts, entertainment, recreation, accommodation<br />
and food services<br />
24 9.6 45 10.7<br />
Other services, except public administration 13 3.1<br />
Public administration 12 4.8 12 2.9<br />
Total Employment (16 years and over) 250 100.0 420 100.0<br />
Town of Oak Grove<br />
Agriculture, forestry, fishing, hunting & mining 114 24.5 76 16.2<br />
Construction 37 8.0 31 6.6<br />
Manufacturing 94 20.2 103 22.0<br />
Wholesale trade 14 3.0 16 3.4<br />
Retail trade 89 19.1 64 13.6<br />
Transportation, warehousing and utilities 28 6.0 27 5.8<br />
Information 0 0.0 2 0.4<br />
Finance, insurance, real estate, rental & leasing 20 4.3 3 0.6<br />
Professional, scientific, management,<br />
administrative and waste management services 18 3.9 17 3.6<br />
Educational, health and social services 34 7.3 68 14.5<br />
Arts, entertainment, recreation, accommodation<br />
and food services<br />
12 2.6 36 7.7<br />
Other services, except public administration 23 4.9<br />
Public administration 5 1.1 3 0.6<br />
Total Employment (16 years and over) 465 100.0 469 100.0<br />
Barron County Conditions and Trends Report 53
Table 1.16 continued<br />
Employment By Industry – 1990 and 2000 – Barron County Municipal Units<br />
(yellow shading indicates combined categories)<br />
Town of Prairie Farm<br />
1990 2000<br />
Number Percent Number Percent<br />
Agriculture, forestry, fishing, hunting & mining 111 41.1 68 21.6<br />
Construction 11 4.1 9 2.9<br />
Manufacturing 63 23.3 79 25.1<br />
Wholesale trade 12 4.4 0 0.0<br />
Retail trade 10 3.7 13 14.1<br />
Transportation, warehousing and utilities 7 2.6 18 5.7<br />
Information 0 0.0 8 2.5<br />
Finance, insurance, real estate, rental & leasing 14 5.2 18 5.7<br />
Professional, scientific, management,<br />
administrative and waste management services 2 0.7 8 2.5<br />
Educational, health and social services 28 10.4 51 16.2<br />
Arts, entertainment, recreation, accommodation<br />
and food services<br />
4 1.5 17 5.4<br />
Other services, except public administration 13 4.1<br />
Public administration 8 3.0 13 4.1<br />
Total Employment (16 years and over) 270 100.0 315 100.0<br />
Town of Prairie Lake<br />
Agriculture, forestry, fishing, hunting & mining 100 19.7 39 6.0<br />
Construction 28 5.5 53 8.2<br />
Manufacturing 101 19.9 167 25.9<br />
Wholesale trade 13 2.6 13 2.0<br />
Retail trade 102 20.1 93 14.4<br />
Transportation, warehousing and utilities 32 6.3 32 5.0<br />
Information 0 0.0 6 0.9<br />
Finance, insurance, real estate, rental & leasing 9 1.8 37 5.7<br />
Professional, scientific, management,<br />
administrative and waste management services 26 5.1 28 4.3<br />
Educational, health and social services 67 13.2 89 13.8<br />
Arts, entertainment, recreation, accommodation<br />
and food services<br />
19 3.7 40 6.2<br />
Other services, except public administration 27 4.2<br />
Public administration 10 2.0 21 3.3<br />
Total Employment (16 years and over) 507 100.0 645 100.0<br />
54 Issues and Opportunities Information
Table 1.16 continued<br />
Employment By Industry – 1990 and 2000 – Barron County Municipal Units<br />
(yellow shading indicates combined categories)<br />
Town of Rice Lake<br />
1990 2000<br />
Number Percent Number Percent<br />
Agriculture, forestry, fishing, hunting & mining 78 5.7 75 4.5<br />
Construction 59 4.3 67 4.0<br />
Manufacturing 338 24.5 377 22.5<br />
Wholesale trade 46 3.3 19 1.1<br />
Retail trade 278 20.2 267 15.9<br />
Transportation, warehousing and utilities 84 6.1 54 3.2<br />
Information 0 0.0 23 1.4<br />
Finance, insurance, real estate, rental & leasing 53 3.9 113 6.7<br />
Professional, scientific, management,<br />
administrative and waste management services 102 7.4 99 5.9<br />
Educational, health and social services 235 17.1 351 20.9<br />
Arts, entertainment, recreation, accommodation<br />
and food services<br />
65 4.7 114 6.8<br />
Other services, except public administration 56 3.3<br />
Public administration 40 2.9 64 3.8<br />
Total Employment (16 years and over) 1,378 100.0 1,679 100.0<br />
Town of Sioux Creek<br />
Agriculture, forestry, fishing, hunting & mining 84 31.8 72 18.7<br />
Construction 13 4.9 20 5.2<br />
Manufacturing 50 18.9 93 24.2<br />
Wholesale trade 1 0.4 4 1.0<br />
Retail trade 41 15.5 49 12.7<br />
Transportation, warehousing and utilities 23 8.7 17 4.4<br />
Information 0 0.0 6 1.6<br />
Finance, insurance, real estate, rental & leasing 0 0.0 0 0.0<br />
Professional, scientific, management,<br />
administrative and waste management services 3 1.1 2 0.5<br />
Educational, health and social services 32 12.1 74 19.2<br />
Arts, entertainment, recreation, accommodation<br />
and food services<br />
15 5.7 23 6.0<br />
Other services, except public administration 19 4.9<br />
Public administration 2 0.8 6 1.6<br />
Total Employment (16 years and over) 264 100.0 385 100.0<br />
Barron County Conditions and Trends Report 55
Table 1.16 continued<br />
Employment By Industry – 1990 and 2000 – Barron County Municipal Units<br />
(yellow shading indicates combined categories)<br />
Town of Stanfold<br />
1990 2000<br />
Number Percent Number Percent<br />
Agriculture, forestry, fishing, hunting & mining 133 39.0 85 24.1<br />
Construction 8 2.4 9 2.5<br />
Manufacturing 90 26.4 74 21.0<br />
Wholesale trade 2 0.6 8 2.3<br />
Retail trade 25 7.3 41 11.6<br />
Transportation, warehousing and utilities 10 2.9 14 4.0<br />
Information 0 0.0 2 0.6<br />
Finance, insurance, real estate, rental & leasing 0 0.0 5 1.4<br />
Professional, scientific, management,<br />
administrative and waste management services 10 2.9 14 4.0<br />
Educational, health and social services 34 10.0 48 13.6<br />
Arts, entertainment, recreation, accommodation<br />
and food services<br />
23 6.7 29 8.2<br />
Other services, except public administration 15 4.2<br />
Public administration 6 1.8 8 2.5<br />
Total Employment (16 years and over) 341 100.0 353 100.0<br />
Town of Stanley<br />
Agriculture, forestry, fishing, hunting & mining 122 12.1 32 2.6<br />
Construction 43 4.3 61 5.0<br />
Manufacturing 308 30.4 315 25.8<br />
Wholesale trade 33 3.3 51 4.2<br />
Retail trade 171 16.9 191 15.6<br />
Transportation, warehousing and utilities 57 5.6 50 4.1<br />
Information 0 0.0 19 1.6<br />
Finance, insurance, real estate, rental & leasing 27 2.7 35 2.9<br />
Professional, scientific, management,<br />
administrative and waste management services 39 3.9 56 4.6<br />
Educational, health and social services 119 11.8 223 18.2<br />
Arts, entertainment, recreation, accommodation<br />
and food services<br />
51 5.0 93 7.6<br />
Other services, except public administration 51 4.2<br />
Public administration 42 4.2 46 3.8<br />
Total Employment (16 years and over) 1,012 100.0 1,223 100.0<br />
56 Issues and Opportunities Information
Table 1.16 continued<br />
Employment By Industry – 1990 and 2000 – Barron County Municipal Units<br />
(yellow shading indicates combined categories)<br />
Town of Sumner<br />
1990 2000<br />
Number Percent Number Percent<br />
Agriculture, forestry, fishing, hunting & mining 35 13.4 18 5.6<br />
Construction 21 8.0 18 5.6<br />
Manufacturing 91 34.7 82 25.3<br />
Wholesale trade 14 5.3 12 3.7<br />
Retail trade 28 10.7 63 19.4<br />
Transportation, warehousing and utilities 6 2.3 17 5.2<br />
Information 0 0.0 2 0.6<br />
Finance, insurance, real estate, rental & leasing 2 0.8 4 1.2<br />
Professional, scientific, management,<br />
administrative and waste management services 11 4.2 7 2.2<br />
Educational, health and social services 25 9.5 43 13.3<br />
Arts, entertainment, recreation, accommodation<br />
and food services<br />
19 7.3 28 8.6<br />
Other services, except public administration 19 5.9<br />
Public administration 10 3.8 11 3.4<br />
Total Employment (16 years and over) 262 100.0 324 100.0<br />
Town of Turtle Lake<br />
Agriculture, forestry, fishing, hunting & mining 120 36.3 58 17.8<br />
Construction 11 3.3 34 10.5<br />
Manufacturing 86 26.0 97 29.8<br />
Wholesale trade 18 5.4 10 3.1<br />
Retail trade 36 10.9 14 4.3<br />
Transportation, warehousing and utilities 15 4.5 6 1.8<br />
Information 0 0.0 5 1.5<br />
Finance, insurance, real estate, rental & leasing 8 2.4 9 2.8<br />
Professional, scientific, management,<br />
administrative and waste management services 9 2.7 7 2.2<br />
Educational, health and social services 11 3.3 35 10.8<br />
Arts, entertainment, recreation, accommodation<br />
and food services<br />
12 3.6 35 10.8<br />
Other services, except public administration 11 3.4<br />
Public administration 5 1.5 4 1.2<br />
Total Employment (16 years and over) 331 100.0 325 100.0<br />
Barron County Conditions and Trends Report 57
Table 1.16 continued<br />
Employment By Industry – 1990 and 2000 – Barron County Municipal Units<br />
(yellow shading indicates combined categories)<br />
Town of Vance Creek<br />
1990 2000<br />
Number Percent Number Percent<br />
Agriculture, forestry, fishing, hunting & mining 90 33.5 70 20.3<br />
Construction 17 6.3 37 10.8<br />
Manufacturing 53 19.7 100 29.1<br />
Wholesale trade 12 4.5 3 0.9<br />
Retail trade 15 5.6 25 7.3<br />
Transportation, warehousing and utilities 13 4.8 8 2.3<br />
Information 0 0.0 5 1.5<br />
Finance, insurance, real estate, rental & leasing 2 0.7 2 0.6<br />
Professional, scientific, management,<br />
administrative and waste management services 11 4.1 7 2.0<br />
Educational, health and social services 38 14.1 48 14.0<br />
Arts, entertainment, recreation, accommodation<br />
and food services<br />
16 6.0 20 5.8<br />
Other services, except public administration 9 2.6<br />
Public administration 2 0.7 10 2.9<br />
Total Employment (16 years and over) 269 100.0 344 100.0<br />
Village of Almena<br />
Agriculture, forestry, fishing, hunting & mining 12 4.7 12 3.8<br />
Construction 19 7.5 26 8.2<br />
Manufacturing 108 42.4 134 42.1<br />
Wholesale trade 13 5.1 8 2.5<br />
Retail trade 26 10.2 17 5.3<br />
Transportation, warehousing and utilities 16 6.3 6 1.9<br />
Information 0 0.0 3 0.9<br />
Finance, insurance, real estate, rental & leasing 7 2.8 6 1.9<br />
Professional, scientific, management,<br />
administrative and waste management services 8 3.1 12 3.8<br />
Educational, health and social services 30 11.8 29 9.1<br />
Arts, entertainment, recreation, accommodation<br />
and food services<br />
13 5.1 44 13.8<br />
Other services, except public administration 5 1.6<br />
Public administration 3 1.2 16 5.0<br />
Total Employment (16 years and over) 255 100.0 318 100.0<br />
58 Issues and Opportunities Information
Table 1.16 continued<br />
Employment By Industry – 1990 and 2000 – Barron County Municipal Units<br />
(yellow shading indicates combined categories)<br />
Village of Cameron<br />
1990 2000<br />
Number Percent Number Percent<br />
Agriculture, forestry, fishing, hunting & mining 5 0.9 17 2.2<br />
Construction 27 4.9 39 5.0<br />
Manufacturing 178 32.3 262 33.7<br />
Wholesale trade 12 2.2 8 1.0<br />
Retail trade 118 21.4 90 11.6<br />
Transportation, warehousing and utilities 35 6.3 28 3.6<br />
Information 0 0.0 13 1.7<br />
Finance, insurance, real estate, rental & leasing 15 2.7 20 2.6<br />
Professional, scientific, management,<br />
administrative and waste management services 41 7.4 13 1.7<br />
Educational, health and social services 71 12.9 166 21.3<br />
Arts, entertainment, recreation, accommodation<br />
and food services<br />
34 6.2 74 9.5<br />
Other services, except public administration 24 3.1<br />
Public administration 16 2.9 24 3.1<br />
Total Employment (16 years and over) 552 100.0 778 100.0<br />
Village of Dallas<br />
Agriculture, forestry, fishing, hunting & mining 8 4.3 13 8.4<br />
Construction 4 2.2 7 4.5<br />
Manufacturing 57 30.8 40 26.0<br />
Wholesale trade 0 0.0 9 5.8<br />
Retail trade 32 17.3 19 12.3<br />
Transportation, warehousing and utilities 31 16.8 13 8.4<br />
Information 0 0.0 14 9.1<br />
Finance, insurance, real estate, rental & leasing 3 1.6 2 1.3<br />
Professional, scientific, management,<br />
administrative and waste management services 11 6.0 0 0.0<br />
Educational, health and social services 23 12.4 20 13.0<br />
Arts, entertainment, recreation, accommodation<br />
and food services<br />
11 6.0 8 5.2<br />
Other services, except public administration 6 3.9<br />
Public administration 5 2.7 3 1.9<br />
Total Employment (16 years and over) 185 100.0 154 100.0<br />
Barron County Conditions and Trends Report 59
Table 1.16 continued<br />
Employment By Industry – 1990 and 2000 – Barron County Municipal Units<br />
(yellow shading indicates combined categories)<br />
Village of Haugen<br />
1990 2000<br />
Number Percent Number Percent<br />
Agriculture, forestry, fishing, hunting & mining 6 4.7 0 0.0<br />
Construction 9 7.0 6 4.5<br />
Manufacturing 40 31.0 27 20.3<br />
Wholesale trade 3 2.3 2 1.5<br />
Retail trade 19 14.7 13 9.8<br />
Transportation, warehousing and utilities 18 14.0 6 4.5<br />
Information 0 0.0 8 6.0<br />
Finance, insurance, real estate, rental & leasing 1 0.8 13 9.8<br />
Professional, scientific, management,<br />
administrative and waste management services 10 7.8 13 9.8<br />
Educational, health and social services 11 8.5 26 19.5<br />
Arts, entertainment, recreation, accommodation<br />
and food services<br />
10 7.8 12 9.0<br />
Other services, except public administration 4 3.0<br />
Public administration 2 1.6 3 2.3<br />
Total Employment (16 years and over) 129 100.0 133 100.0<br />
Village of New Auburn<br />
Agriculture, forestry, fishing, hunting & mining 0 0.0 0 0.0<br />
Construction 0 0.0 0 0.0<br />
Manufacturing 1 18.2 3 33.3<br />
Wholesale trade 0 0.0 3 33.4<br />
Retail trade 0 0.0 0 0.0<br />
Transportation, warehousing and utilities 0 0.0 0 0.0<br />
Information 0 0.0 0 0.0<br />
Finance, insurance, real estate, rental & leasing 0 0.0 0 0.0<br />
Professional, scientific, management,<br />
administrative and waste management services 5 45.5 0 0.0<br />
Educational, health and social services 0 0.0 3 33.3<br />
Arts, entertainment, recreation, accommodation<br />
and food services<br />
2 18.2 0 0.0<br />
Other services, except public administration 0 0.0<br />
Public administration 2 18.2 0 0.0<br />
Total Employment (16 years and over) 11 100.0 9 100.0<br />
60 Issues and Opportunities Information
Table 1.16 continued<br />
Employment By Industry – 1990 and 2000 – Barron County Municipal Units<br />
(yellow shading indicates combined categories)<br />
Village of Prairie Farm<br />
1990 2000<br />
Number Percent Number Percent<br />
Agriculture, forestry, fishing, hunting & mining 4 2.5 12 4.5<br />
Construction 7 4.4 27 10.2<br />
Manufacturing 30 19.0 83 31.4<br />
Wholesale trade 4 2.5 2 0.8<br />
Retail trade 42 26.6 27 10.2<br />
Transportation, warehousing and utilities 14 8.9 9 3.4<br />
Information 0 0.0 6 2.3<br />
Finance, insurance, real estate, rental & leasing 2 1.3 6 2.3<br />
Professional, scientific, management,<br />
administrative and waste management services 8 5.1 2 0.8<br />
Educational, health and social services 33 20.9 75 28.4<br />
Arts, entertainment, recreation, accommodation<br />
and food services<br />
10 6.3 6 2.3<br />
Other services, except public administration 5 1.9<br />
Public administration 4 2.5 4 1.5<br />
Total Employment (16 years and over) 158 100.0 264 100.0<br />
Village of Turtle Lake<br />
Agriculture, forestry, fishing, hunting & mining 14 4.5 8 1.7<br />
Construction 15 4.9 15 3.2<br />
Manufacturing 99 32.0 138 29.1<br />
Wholesale trade 0 0.0 6 1.3<br />
Retail trade 62 20.1 51 10.7<br />
Transportation, warehousing and utilities 33 10.7 9 1.9<br />
Information 0 0.0 5 1.1<br />
Finance, insurance, real estate, rental & leasing 13 4.2 9 1.9<br />
Professional, scientific, management,<br />
administrative and waste management services 12 3.9 8 1.7<br />
Educational, health and social services 35 11.3 72 15.2<br />
Arts, entertainment, recreation, accommodation<br />
and food services<br />
20 6.5 120 25.3<br />
Other services, except public administration 18 3.8<br />
Public administration 6 1.9 16 3.4<br />
Total Employment (16 years and over) 309 100.0 475 100.0<br />
Barron County Conditions and Trends Report 61
Table 1.16 continued<br />
Employment By Industry – 1990 and 2000 – Barron County Municipal Units<br />
(yellow shading indicates combined categories)<br />
City of Barron<br />
1990 2000<br />
Number Percent Number Percent<br />
Agriculture, forestry, fishing, hunting & mining 50 3.7 44 2.8<br />
Construction 55 4.1 82 5.2<br />
Manufacturing 422 31.5 469 30.0<br />
Wholesale trade 36 2.7 34 2.2<br />
Retail trade 187 14.0 207 13.3<br />
Transportation, warehousing and utilities 51 3.8 48 3.1<br />
Information 0 0.0 28 1.8<br />
Finance, insurance, real estate, rental & leasing 41 3.1 28 1.8<br />
Professional, scientific, management,<br />
administrative and waste management services 65 4.9 49 3.8<br />
Educational, health and social services 250 18.7 352 22.5<br />
Arts, entertainment, recreation, accommodation<br />
and food services<br />
117 8.7 130 8.3<br />
Other services, except public administration 47 3.0<br />
Public administration 66 4.9 34 2.2<br />
Total Employment (16 years and over) 1,340 100.0 1,562 100.0<br />
City of Chetek<br />
Agriculture, forestry, fishing, hunting & mining 24 3.3 15 1.6<br />
Construction 41 5.7 52 5.6<br />
Manufacturing 134 18.5 235 25.2<br />
Wholesale trade 18 2.5 24 2.6<br />
Retail trade 168 23.1 102 10.9<br />
Transportation, warehousing and utilities 46 6.3 47 5.0<br />
Information 0 0.0 23 2.5<br />
Finance, insurance, real estate, rental & leasing 30 4.1 37 4.0<br />
Professional, scientific, management,<br />
administrative and waste management services 60 8.3 26 2.8<br />
Educational, health and social services 128 17.6 193 20.7<br />
Arts, entertainment, recreation, accommodation<br />
and food services<br />
56 7.7 115 12.3<br />
Other services, except public administration 47 5.0<br />
Public administration 21 2.9 16 1.7<br />
Total Employment (16 years and over) 726 100.0 932 100.0<br />
62 Issues and Opportunities Information
Table 1.16 continued<br />
Employment By Industry – 1990 and 2000 – Barron County Municipal Units<br />
(yellow shading indicates combined categories)<br />
City of Cumberland<br />
1990 2000<br />
Number Percent Number Percent<br />
Agriculture, forestry, fishing, hunting & mining 17 2.0 29 2.8<br />
Construction 39 4.6 68 6.5<br />
Manufacturing 260 30.5 239 22.8<br />
Wholesale trade 3 0.4 15 1.4<br />
Retail trade 170 19.9 124 11.8<br />
Transportation, warehousing and utilities 35 4.1 58 5.5<br />
Information 0 0.0 34 3.2<br />
Finance, insurance, real estate, rental & leasing 48 5.6 47 4.5<br />
Professional, scientific, management,<br />
administrative and waste management services 37 4.3 17 1.6<br />
Educational, health and social services 175 20.5 213 20.3<br />
Arts, entertainment, recreation, accommodation<br />
and food services<br />
49 5.7 117 11.2<br />
Other services, except public administration 68 6.5<br />
Public administration 20 2.3 19 1.8<br />
Total Employment (16 years and over) 853 100.0 1,048 100.0<br />
City of Rice Lake<br />
Agriculture, forestry, fishing, hunting & mining 58 1.6 70 1.7<br />
Construction 147 4.1 321 7.8<br />
Manufacturing 869 24.0 965 23.3<br />
Wholesale trade 236 6.5 139 3.4<br />
Retail trade 727 20.1 609 14.7<br />
Transportation, warehousing and utilities 197 5.4 109 2.6<br />
Information 0 0.0 141 3.4<br />
Finance, insurance, real estate, rental & leasing 137 3.8 134 3.2<br />
Professional, scientific, management,<br />
administrative and waste management services 290 8.0 134 3.2<br />
Educational, health and social services 603 16.7 797 19.3<br />
Arts, entertainment, recreation, accommodation<br />
and food services<br />
250 6.9 381 9.2<br />
Other services, except public administration 241 5.8<br />
Public administration 108 3.0 94 2.3<br />
Total Employment (16 years and over) 3,622 100.0 4,135 100.0<br />
Barron County Conditions and Trends Report 63
Table 1.16 continued<br />
Employment By Industry – 1990 and 2000 – Barron County Municipal Units<br />
(yellow shading indicates combined categories)<br />
Barron County<br />
1990 2000<br />
Number Percent Number Percent<br />
Agriculture, forestry, fishing, hunting & mining 2,381 12.9 1,691 7.5<br />
Construction 896 4.9 1,432 6.3<br />
Manufacturing 4,638 25.1 5,769 25.5<br />
Wholesale trade 646 3.5 545 2.4<br />
Retail trade 3,004 16.3 2,774 12.3<br />
Transportation, warehousing and utilities 1,019 5.5 920 4.1<br />
Information 0 0.0 466 2.1<br />
Finance, insurance, real estate, rental & leasing 601 3.3 695 3.1<br />
Professional, scientific, management,<br />
administrative and waste management services 1,031 5.6 808 3.6<br />
Educational, health and social services 2,674 14.5 4,070 18.0<br />
Arts, entertainment, recreation, accommodation<br />
and food services<br />
1,037 5.6 1,892 8.4<br />
Other services, except public administration 969 4.3<br />
Public administration 535 2.9 552 2.4<br />
Total Employment (16 years and over) 18,462 100.0 22,538 100.0<br />
source: U.S. Census<br />
64 Issues and Opportunities Information
Table 1.17<br />
Employment By Occupation – 1990 and 2000 – Barron County Municipal Units<br />
(yellow and green shading indicates combined categories)<br />
1990 2000<br />
Number Percent Number Percent<br />
Town of Almena<br />
Executive, administrative and managerial 15 3.9<br />
Professional 20 5.2 142 28.6<br />
Technician 7 1.8<br />
Sales 24 6.3 97 19.4<br />
Administrative support, including clerical 28 7.3<br />
Service 50 13.0 70 14.0<br />
Farming, forestry, fishing 128 33.3 18 3.6<br />
Construction, extraction and maintenance -- -- 64 12.8<br />
Precision production, craft and repair 49 12.7<br />
Machine operators, assemblers and inspectors 32 8.4 108 21.6<br />
Transportation and material moving 12 3.1<br />
Handlers, equipment cleaners, helpers & laborers 18 5.0<br />
Total Employment (16 years and over) 383 100.0 499 100.0<br />
Town of Arland<br />
Executive, administrative and managerial 9 3.1<br />
Professional 8 2.7 109 30.4<br />
Technician 2 0.7<br />
Sales 8 2.7 55 15.4<br />
Administrative support, including clerical 16 5.5<br />
Service 28 9.6 46 12.9<br />
Farming, forestry, fishing 136 46.3 29 8.1<br />
Construction, extraction and maintenance -- -- 27 7.5<br />
Precision production, craft and repair 18 6.2<br />
Machine operators, assemblers and inspectors 20 6.8 92 25.7<br />
Transportation and material moving 26 8.9<br />
Handlers, equipment cleaners, helpers & laborers 22 7.5<br />
Total Employment (16 years and over) 293 100.0 358 100.0<br />
Town of Barron<br />
Executive, administrative and managerial 32 7.2<br />
Professional 27 6.1 157 18.7<br />
Technician 10 2.3<br />
Sales 43 9.7 107 18.7<br />
Administrative support, including clerical 59 13.3<br />
Service 48 10.9 85 14.8<br />
Farming, forestry, fishing 132 29.8 43 7.5<br />
Construction, extraction and maintenance -- -- 47 8.2<br />
Precision production, craft and repair 23 5.2<br />
Machine operators, assemblers and inspectors 26 5.9 134 23.4<br />
Transportation and material moving 25 5.7<br />
Handlers, equipment cleaners, helpers & laborers 17 3.9<br />
Total Employment (16 years and over) 442 100.0 573 100.0<br />
Barron County Conditions and Trends Report 65
Table 1.17 continued<br />
Employment By Occupation – 1990 and 2000 – Barron County Municipal Units<br />
(yellow and green shading indicates combined categories)<br />
1990 2000<br />
Number Percent Number Percent<br />
Town of Bear Lake<br />
Executive, administrative and managerial 7 2.8<br />
Professional 23 9.1 112 36.3<br />
Technician 0 0.0<br />
Sales 29 11.4 43 13.9<br />
Administrative support, including clerical 25 9.8<br />
Service 45 17.7 23 7.4<br />
Farming, forestry, fishing 57 22.5 12 3.9<br />
Construction, extraction and maintenance -- -- 30 9.7<br />
Precision production, craft and repair 37 14.6<br />
Machine operators, assemblers and inspectors 14 5.5 89 28.8<br />
Transportation and material moving 8 3.1<br />
Handlers, equipment cleaners, helpers & laborers 9 3.5<br />
Total Employment (16 years and over) 254 100.0 309 100.0<br />
Town of Cedar Lake<br />
Executive, administrative and managerial 29 8.2<br />
Professional 40 11.3 108 22.0<br />
Technician 8 2.3<br />
Sales 28 7.9 134 27.4<br />
Administrative support, including clerical 43 12.1<br />
Service 45 12.7 63 12.9<br />
Farming, forestry, fishing 49 13.7 16 3.3<br />
Construction, extraction and maintenance -- -- 60 12.2<br />
Precision production, craft and repair 47 13.2<br />
Machine operators, assemblers and inspectors 33 9.3 109 22.2<br />
Transportation and material moving 13 3.7<br />
Handlers, equipment cleaners, helpers & laborers 20 5.6<br />
Total Employment (16 years and over) 355 100.0 490 100.0<br />
Town of Chetek<br />
Executive, administrative and managerial 58 9.7<br />
Professional 52 8.7 227 28.0<br />
Technician 8 1.3<br />
Sales 57 9.5 210 25.8<br />
Administrative support, including clerical 67 11.2<br />
Service 100 16.6 127 15.6<br />
Farming, forestry, fishing 64 10.7 112 1.5<br />
Construction, extraction and maintenance -- -- 81 10.0<br />
Precision production, craft and repair 77 12.8<br />
Machine operators, assemblers and inspectors 44 7.3 155 19.1<br />
Transportation and material moving 48 8.0<br />
Handlers, equipment cleaners, helpers & laborers 25 4.2<br />
Total Employment (16 years and over) 600 100.0 812 100.0<br />
66 Issues and Opportunities Information
Table 1.17 continued<br />
Employment By Occupation – 1990 and 2000 – Barron County Municipal Units<br />
(yellow and green shading indicates combined categories)<br />
1990 2000<br />
Number Percent Number Percent<br />
Town of Clinton<br />
Executive, administrative and managerial 16 4.2<br />
Professional 16 4.2 142 29.8<br />
Technician 4 1.0<br />
Sales 14 3.7 74 15.6<br />
Administrative support, including clerical 26 6.5<br />
Service 38 9.9 73 15.4<br />
Farming, forestry, fishing 127 33.0 36 7.6<br />
Construction, extraction and maintenance -- -- 48 10.1<br />
Precision production, craft and repair 48 12.5<br />
Machine operators, assemblers and inspectors 27 7.0 102 21.5<br />
Transportation and material moving 27 7.0<br />
Handlers, equipment cleaners, helpers & laborers 24 6.3<br />
Total Employment (16 years and over) 384 100.0 475 100.0<br />
Town of Crystal Lake<br />
Executive, administrative and managerial 16 4.6<br />
Professional 20 5.8 99 26.0<br />
Technician 16 4.6<br />
Sales 21 6.1 65 17.1<br />
Administrative support, including clerical 41 11.8<br />
Service 56 16.1 63 16.5<br />
Farming, forestry, fishing 50 14.5 4 1.1<br />
Construction, extraction and maintenance -- -- 37 9.7<br />
Precision production, craft and repair 45 13.0<br />
Machine operators, assemblers and inspectors 38 11.0 113 29.6<br />
Transportation and material moving 14 4.1<br />
Handlers, equipment cleaners, helpers & laborers 29 8.4<br />
Total Employment (16 years and over) 346 100.0 381 100.0<br />
Town of Cumberland<br />
Executive, administrative and managerial 20 4.6<br />
Professional 31 7.1 158 33.9<br />
Technician 15 3.5<br />
Sales 36 8.3 84 18.0<br />
Administrative support, including clerical 46 10.6<br />
Service 51 11.8 41 8.8<br />
Farming, forestry, fishing 77 17.7 20 4.3<br />
Construction, extraction and maintenance -- -- 53 11.4<br />
Precision production, craft and repair 55 12.7<br />
Machine operators, assemblers and inspectors 55 12.7 110 23.6<br />
Transportation and material moving 17 3.9<br />
Handlers, equipment cleaners, helpers & laborers 31 7.1<br />
Total Employment (16 years and over) 434 100.0 466 100.0<br />
Barron County Conditions and Trends Report 67
Table 1.17 continued<br />
Employment By Occupation – 1990 and 2000 – Barron County Municipal Units<br />
(yellow and green shading indicates combined categories)<br />
1990 2000<br />
Number Percent Number Percent<br />
Town of Dallas<br />
Executive, administrative and managerial 10 3.8<br />
Professional 9 3.5 92 30.7<br />
Technician 0 0.0<br />
Sales 26 10.0 71 23.8<br />
Administrative support, including clerical 32 12.3<br />
Service 13 5.0 41 13.7<br />
Farming, forestry, fishing 117 44.7 18 6.0<br />
Construction, extraction and maintenance -- -- 29 9.7<br />
Precision production, craft and repair 22 8.4<br />
Machine operators, assemblers and inspectors 14 5.4 48 16.1<br />
Transportation and material moving 7 2.7<br />
Handlers, equipment cleaners, helpers & laborers 11 4.2<br />
Total Employment (16 years and over) 261 100.0 299 100.0<br />
Town of Dovre<br />
Executive, administrative and managerial 5 2.2<br />
Professional 21 9.1 90 25.8<br />
Technician 5 2.2<br />
Sales 16 7.0 67 19.1<br />
Administrative support, including clerical 21 13.9<br />
Service 38 16.5 56 16.0<br />
Farming, forestry, fishing 48 20.8 13 3.7<br />
Construction, extraction and maintenance -- -- 42 12.0<br />
Precision production, craft and repair 26 11.3<br />
Machine operators, assemblers and inspectors 8 3.5 82 23.4<br />
Transportation and material moving 16 7.0<br />
Handlers, equipment cleaners, helpers & laborers 15 6.5<br />
Total Employment (16 years and over) 230 100.0 350 100.0<br />
Town of Doyle<br />
Executive, administrative and managerial 15 6.9<br />
Professional 12 5.6 71 26.6<br />
Technician 2 0.9<br />
Sales 19 8.8 61 22.9<br />
Administrative support, including clerical 29 13.4<br />
Service 18 8.3 26 9.7<br />
Farming, forestry, fishing 36 16.7 23 8.6<br />
Construction, extraction and maintenance -- -- 27 10.0<br />
Precision production, craft and repair 39 18.1<br />
Machine operators, assemblers and inspectors 21 9.7 59 22.1<br />
Transportation and material moving 6 2.8<br />
Handlers, equipment cleaners, helpers & laborers 19 8.8<br />
Total Employment (16 years and over) 216 100.0 267 100.0<br />
68 Issues and Opportunities Information
Table 1.17 continued<br />
Employment By Occupation – 1990 and 2000 – Barron County Municipal Units<br />
(yellow and green shading indicates combined categories)<br />
1990 2000<br />
Number Percent Number Percent<br />
Town of Lakeland<br />
Executive, administrative and managerial 13 4.1<br />
Professional 50 15.6 123 24.4<br />
Technician 11 3.5<br />
Sales 14 4.4 109 21.6<br />
Administrative support, including clerical 25 7.8<br />
Service 40 12.5 61 12.1<br />
Farming, forestry, fishing 31 9.7 9 1.8<br />
Construction, extraction and maintenance -- -- 42 8.3<br />
Precision production, craft and repair 48 15.1<br />
Machine operators, assemblers and inspectors 52 16.3 160 31.8<br />
Transportation and material moving 14 4.4<br />
Handlers, equipment cleaners, helpers & laborers 21 6.6<br />
Total Employment (16 years and over) 319 100.0 504 100.0<br />
Town of Maple Grove<br />
Executive, administrative and managerial 21 4.6<br />
Professional 20 4.4 156 29.6<br />
Technician 19 4.2<br />
Sales 15 3.3 101 19.2<br />
Administrative support, including clerical 46 10.0<br />
Service 67 14.7 63 12.0<br />
Farming, forestry, fishing 106 23.3 36 6.8<br />
Construction, extraction and maintenance -- -- 48 9.1<br />
Precision production, craft and repair 69 15.1<br />
Machine operators, assemblers and inspectors 47 10.3 123 23.3<br />
Transportation and material moving 30 6.6<br />
Handlers, equipment cleaners, helpers & laborers 16 3.5<br />
Total Employment (16 years and over) 456 100.0 527 100.0<br />
Town of Maple Plain<br />
Executive, administrative and managerial 37 14.8<br />
Professional 36 14.4 157 37.4<br />
Technician 5 2.0<br />
Sales 34 13.6 70 16.7<br />
Administrative support, including clerical 30 12.0<br />
Service 29 11.6 71 16.9<br />
Farming, forestry, fishing 7 2.8 0 0.00<br />
Construction, extraction and maintenance -- -- 35 8.3<br />
Precision production, craft and repair 23 9.2<br />
Machine operators, assemblers and inspectors 26 10.4 87 20.7<br />
Transportation and material moving 9 3.6<br />
Handlers, equipment cleaners, helpers & laborers 14 5.6<br />
Total Employment (16 years and over) 250 100.0 420 100.0<br />
Barron County Conditions and Trends Report 69
Table 1.17 continued<br />
Employment By Occupation – 1990 and 2000 – Barron County Municipal Units<br />
(yellow and green shading indicates combined categories)<br />
1990 2000<br />
Number Percent Number Percent<br />
Town of Oak Grove<br />
Executive, administrative and managerial 19 4.1<br />
Professional 21 4.5 131 27.9<br />
Technician 5 1.1<br />
Sales 47 10.1 100 21.3<br />
Administrative support, including clerical 59 12.7<br />
Service 61 13.1 65 13.9<br />
Farming, forestry, fishing 110 23.7 23 4.9<br />
Construction, extraction and maintenance -- -- 45 9.6<br />
Precision production, craft and repair 44 9.5<br />
Machine operators, assemblers and inspectors 45 9.7 105 22.4<br />
Transportation and material moving 29 6.2<br />
Handlers, equipment cleaners, helpers & laborers 25 5.4<br />
Total Employment (16 years and over) 465 100.0 469 100.0<br />
Town of Prairie Farm<br />
Executive, administrative and managerial 15 5.6<br />
Professional 12 4.4 89 28.3<br />
Technician 5 1.9<br />
Sales 11 4.1 58 18.4<br />
Administrative support, including clerical 34 12.6<br />
Service 20 7.4 57 18.1<br />
Farming, forestry, fishing 111 41.0 22 7.0<br />
Construction, extraction and maintenance -- -- 29 9.2<br />
Precision production, craft and repair 18 6.7<br />
Machine operators, assemblers and inspectors 21 7.8 60 19.0<br />
Transportation and material moving 14 5.2<br />
Handlers, equipment cleaners, helpers & laborers 9 3.3<br />
Total Employment (16 years and over) 270 100.0 310 100.0<br />
Town of Prairie Lake<br />
Executive, administrative and managerial 33 6.5<br />
Professional 33 6.5 126 19.5<br />
Technician 21 4.1<br />
Sales 55 10.8 185 28.7<br />
Administrative support, including clerical 43 8.5<br />
Service 68 13.4 67 10.4<br />
Farming, forestry, fishing 97 19.1 14 2.2<br />
Construction, extraction and maintenance -- -- 69 10.7<br />
Precision production, craft and repair 56 11.1<br />
Machine operators, assemblers and inspectors 49 9.7 184 28.5<br />
Transportation and material moving 17 3.4<br />
Handlers, equipment cleaners, helpers & laborers 35 6.9<br />
Total Employment (16 years and over) 507 100.0 645 100.0<br />
70 Issues and Opportunities Information
Table 1.17 continued<br />
Employment By Occupation – 1990 and 2000 – Barron County Municipal Units<br />
(yellow and green shading indicates combined categories)<br />
1990 2000<br />
Number Percent Number Percent<br />
Town of Rice Lake<br />
Executive, administrative and managerial 102 7.4<br />
Professional 185 13.4 528 31.5<br />
Technician 27 2.0<br />
Sales 209 15.2 489 29.0<br />
Administrative support, including clerical 223 16.2<br />
Service 119 8.6 222 13.2<br />
Farming, forestry, fishing 60 4.4 11 0.7<br />
Construction, extraction and maintenance -- -- 119 7.1<br />
Precision production, craft and repair 145 10.5<br />
Machine operators, assemblers and inspectors 150 10.9 310 18.5<br />
Transportation and material moving 90 6.5<br />
Handlers, equipment cleaners, helpers & laborers 68 4.9<br />
Total Employment (16 years and over) 1,378 100.0 1,679 100.0<br />
Town of Sioux Creek<br />
Executive, administrative and managerial 10 3.8<br />
Professional 22 8.3 127 33.1<br />
Technician 4 1.5<br />
Sales 16 6.0 64 16.6<br />
Administrative support, including clerical 19 7.2<br />
Service 33 12.5 64 16.6<br />
Farming, forestry, fishing 85 32.3 19 4.9<br />
Construction, extraction and maintenance -- -- 29 7.5<br />
Precision production, craft and repair 22 8.3<br />
Machine operators, assemblers and inspectors 22 8.3 82 21.3<br />
Transportation and material moving 21 7.9<br />
Handlers, equipment cleaners, helpers & laborers 10 3.8<br />
Total Employment (16 years and over) 264 100.0 385 100.0<br />
Barron County Conditions and Trends Report 71
Table 1.17 continued<br />
Employment By Occupation – 1990 and 2000 – Barron County Municipal Units<br />
(yellow and green shading indicates combined categories)<br />
1990 2000<br />
Number Percent Number Percent<br />
Town of Stanfold<br />
Executive, administrative and managerial 13 3.8<br />
Professional 12 3.5 121 34.3<br />
Technician 4 1.2<br />
Sales 14 4.1 88 24.9<br />
Administrative support, including clerical 30 8.8<br />
Service 35 10.3 49 13.9<br />
Farming, forestry, fishing 131 38.3 12 3.4<br />
Construction, extraction and maintenance -- -- 11 3.1<br />
Precision production, craft and repair 35 10.3<br />
Machine operators, assemblers and inspectors 29 8.5 72 20.4<br />
Transportation and material moving 6 1.8<br />
Handlers, equipment cleaners, helpers & laborers 32 9.4<br />
Total Employment (16 years and over) 341 100.0 353 100.0<br />
Town of Stanley<br />
Executive, administrative and managerial 82 8.1<br />
Professional 82 8.1 280 22.9<br />
Technician 29 2.9<br />
Sales 99 9.8 297 24.3<br />
Administrative support, including clerical 119 11.8<br />
Service 107 10.6 189 15.5<br />
Farming, forestry, fishing 102 10.1 25 2.0<br />
Construction, extraction and maintenance -- -- 138 11.3<br />
Precision production, craft and repair 129 12.7<br />
Machine operators, assemblers and inspectors 114 11.2 294 24.0<br />
Transportation and material moving 74 7.3<br />
Handlers, equipment cleaners, helpers & laborers 75 7.4<br />
Total Employment (16 years and over) 1,012 100.0 1,223 100.0<br />
Town of Sumner<br />
Executive, administrative and managerial 16 6.1<br />
Professional 20 7.6 65 20.1<br />
Technician 2 0.8<br />
Sales 11 4.2 84 25.9<br />
Administrative support, including clerical 24 9.2<br />
Service 44 16.7 52 16.1<br />
Farming, forestry, fishing 35 13.4 8 2.5<br />
Construction, extraction and maintenance -- -- 28 8.6<br />
Precision production, craft and repair 35 13.4<br />
Machine operators, assemblers and inspectors 43 16.3 87 26.8<br />
Transportation and material moving 13 5.0<br />
Handlers, equipment cleaners, helpers & laborers 19 7.3<br />
Total Employment (16 years and over) 262 100.0 324 100.0<br />
72 Issues and Opportunities Information
Table 1.17 continued<br />
Employment By Occupation – 1990 and 2000 – Barron County Municipal Units<br />
(yellow and green shading indicates combined categories)<br />
1990 2000<br />
Number Percent Number Percent<br />
Town of Turtle Lake<br />
Executive, administrative and managerial 17 5.1<br />
Professional 7 2.1 95 29.2<br />
Technician 8 2.4<br />
Sales 18 5.4 35 10.8<br />
Administrative support, including clerical 24 7.3<br />
Service 31 9.4 53 16.3<br />
Farming, forestry, fishing 110 33.3 16 4.9<br />
Construction, extraction and maintenance -- -- 42 12.9<br />
Precision production, craft and repair 30 9.1<br />
Machine operators, assemblers and inspectors 46 13.9 84 25.9<br />
Transportation and material moving 21 6.3<br />
Handlers, equipment cleaners, helpers & laborers 19 5.7<br />
Total Employment (16 years and over) 331 100.0 325 100.0<br />
Town of Vance Creek<br />
Executive, administrative and managerial 12 4.5<br />
Professional 10 3.7 102 29.7<br />
Technician 4 1.5<br />
Sales 15 5.6 30 8.7<br />
Administrative support, including clerical 29 10.8<br />
Service 25 9.3 39 11.3<br />
Farming, forestry, fishing 83 30.8 19 5.5<br />
Construction, extraction and maintenance -- -- 65 18.9<br />
Precision production, craft and repair 27 10.0<br />
Machine operators, assemblers and inspectors 33 12.2 89 25.9<br />
Transportation and material moving 16 6.0<br />
Handlers, equipment cleaners, helpers & laborers 15 5.6<br />
Total Employment (16 years and over) 269 100.0 344 100.0<br />
Village of Almena<br />
Executive, administrative and managerial 22 8.6<br />
Professional 10 3.9 55 17.3<br />
Technician 5 2.0<br />
Sales 10 3.9 62 19.5<br />
Administrative support, including clerical 34 13.3<br />
Service 31 12.2 58 18.2<br />
Farming, forestry, fishing 12 4.7 9 2.8<br />
Construction, extraction and maintenance -- -- 39 12.3<br />
Precision production, craft and repair 47 18.4<br />
Machine operators, assemblers and inspectors 41 16.1 95 29.9<br />
Transportation and material moving 17 6.7<br />
Handlers, equipment cleaners, helpers & laborers 26 10.2<br />
Total Employment (16 years and over) 255 100.0 318 100.0<br />
Barron County Conditions and Trends Report 73
Table 1.17 continued<br />
Employment By Occupation – 1990 and 2000 – Barron County Municipal Units<br />
(yellow and green shading indicates combined categories)<br />
1990 2000<br />
Number Percent Number Percent<br />
Village of Cameron<br />
Executive, administrative and managerial 50 9.1<br />
Professional 42 7.6 166 21.3<br />
Technician 7 1.3<br />
Sales 37 6.7 165 21.2<br />
Administrative support, including clerical 79 14.3<br />
Service 101 18.2 138 17.7<br />
Farming, forestry, fishing 8 1.5 10 1.3<br />
Construction, extraction and maintenance -- -- 87 11.2<br />
Precision production, craft and repair 66 12.0<br />
Machine operators, assemblers and inspectors 78 14.1 212 27.3<br />
Transportation and material moving 25 4.5<br />
Handlers, equipment cleaners, helpers & laborers 59 10.7<br />
Total Employment (16 years and over) 552 100.0 778 100.0<br />
Village of Dallas<br />
Executive, administrative and managerial 7 3.8<br />
Professional 18 9.7 24 15.6<br />
Technician 2 1.1<br />
Sales 15 8.1 41 26.6<br />
Administrative support, including clerical 18 9.7<br />
Service 29 15.7 19 12.3<br />
Farming, forestry, fishing 17 9.2 6 3.9<br />
Construction, extraction and maintenance -- -- 17 11.0<br />
Precision production, craft and repair 22 1.9<br />
Machine operators, assemblers and inspectors 24 13.0 47 30.6<br />
Transportation and material moving 20 10.8<br />
Handlers, equipment cleaners, helpers & laborers 13 7.0<br />
Total Employment (16 years and over) 185 100.0 154 100.0<br />
Village of Haugen<br />
Executive, administrative and managerial 6 4.7<br />
Professional 4 3.1 25 18.8<br />
Technician 0 0.0<br />
Sales 16 12.4 35 26.3<br />
Administrative support, including clerical 24 18.6<br />
Service 17 13.2 22 16.5<br />
Farming, forestry, fishing 3 2.3 0 0.0<br />
Construction, extraction and maintenance -- -- 18 13.5<br />
Precision production, craft and repair 15 11.6<br />
Machine operators, assemblers and inspectors 21 16.3 33 249<br />
Transportation and material moving 14 10.8<br />
Handlers, equipment cleaners, helpers & laborers 9 7.0<br />
Total Employment (16 years and over) 129 100.0 133 100.0<br />
74 Issues and Opportunities Information
Table 1.17 continued<br />
Employment By Occupation – 1990 and 2000 – Barron County Municipal Units<br />
(yellow and green shading indicates combined categories)<br />
1990 2000<br />
Number Percent Number Percent<br />
Village of New Auburn (Barron County Portion Only)<br />
Executive, administrative and managerial 4 36.4<br />
Professional 0 0.0 3 33.3<br />
Technician 0 0.0<br />
Sales 0 0.0 0 0.0<br />
Administrative support, including clerical 0 0.0<br />
Service 0 0.0 0 0.0<br />
Farming, forestry, fishing 0 0.0 0 0.0<br />
Construction, extraction and maintenance -- -- 0 0.0<br />
Precision production, craft and repair 7 63.6<br />
Machine operators, assemblers and inspectors 0 0.0 6 66.7<br />
Transportation and material moving 0 0.0<br />
Handlers, equipment cleaners, helpers & laborers 0 0.0<br />
Total Employment (16 years and over) 11 100.0 9 100.0<br />
Village of Prairie Farm<br />
Executive, administrative and managerial 9 5.7<br />
Professional 12 7.6 40 15.2<br />
Technician 4 2.5<br />
Sales 15 9.5 48 18.2<br />
Administrative support, including clerical 20 12.7<br />
Service 31 19.6 50 18.9<br />
Farming, forestry, fishing 4 2.5 12 4.6<br />
Construction, extraction and maintenance -- -- 31 11.7<br />
Precision production, craft and repair 12 7.6<br />
Machine operators, assemblers and inspectors 16 10.1 83 31.4<br />
Transportation and material moving 24 15.2<br />
Handlers, equipment cleaners, helpers & laborers 11 7.0<br />
Total Employment (16 years and over) 158 100.0 264 100.0<br />
Village of Turtle Lake (Includes portion in Polk County)<br />
Executive, administrative and managerial 25 8.1<br />
Professional 19 6.2 97 20.4<br />
Technician 13 4.2<br />
Sales 23 7.4 89 18.7<br />
Administrative support, including clerical 37 12.0<br />
Service 54 17.5 124 26.1<br />
Farming, forestry, fishing 12 3.9 6 1.3<br />
Construction, extraction and maintenance -- -- 31 6.5<br />
Precision production, craft and repair 27 8.7<br />
Machine operators, assemblers and inspectors 48 15.5 128 26.9<br />
Transportation and material moving 25 8.1<br />
Handlers, equipment cleaners, helpers & laborers 26 8.4<br />
Total Employment (16 years and over) 309 100.0 475 100.0<br />
Barron County Conditions and Trends Report 75
Table 1.17 continued<br />
Employment By Occupation – 1990 and 2000 – Barron County Municipal Units<br />
(yellow and green shading indicates combined categories)<br />
1990 2000<br />
Number Percent Number Percent<br />
City of Barron<br />
Executive, administrative and managerial 134 10.0<br />
Professional 172 12.8 444 28.4<br />
Technician 29 2.2<br />
Sales 88 6.6 311 19.9<br />
Administrative support, including clerical 144 10.8<br />
Service 248 18.4 272 17.4<br />
Farming, forestry, fishing 42 3.1 36 2.3<br />
Construction, extraction and maintenance -- -- 83 5.3<br />
Precision production, craft and repair 182 13.6<br />
Machine operators, assemblers and inspectors 95 7.1 416 26.6<br />
Transportation and material moving 84 6.3<br />
Handlers, equipment cleaners, helpers & laborers 122 9.1<br />
Total Employment (16 years and over) 1,340 100.0 1,562 100.0<br />
City of Chetek<br />
Executive, administrative and managerial 65 9.0<br />
Professional 78 10.8 185 19.8<br />
Technician 14 1.9<br />
Sales 57 7.9 215 23.1<br />
Administrative support, including clerical 78 10.7<br />
Service 181 24.9 189 20.3<br />
Farming, forestry, fishing 22 3.0 16 1.7<br />
Construction, extraction and maintenance -- -- 91 9.8<br />
Precision production, craft and repair 92 12.7<br />
Machine operators, assemblers and inspectors 61 8.4 236 25.3<br />
Transportation and material moving 46 6.3<br />
Handlers, equipment cleaners, helpers & laborers 32 4.4<br />
Total Employment (16 years and over) 726 100.0 932 100.0<br />
City of Cumberland<br />
Executive, administrative and managerial 72 8.4<br />
Professional 132 15.5 274 26.1<br />
Technician 22 2.6<br />
Sales 77 9.0 271 25.9<br />
Administrative support, including clerical 109 12.8<br />
Service 119 14.0 142 13.5<br />
Farming, forestry, fishing 20 2.3 18 1.7<br />
Construction, extraction and maintenance -- -- 97 9.3<br />
Precision production, craft and repair 107 12.5<br />
Machine operators, assemblers and inspectors 91 10.7 246 23.5<br />
Transportation and material moving 37 4.3<br />
Handlers, equipment cleaners, helpers & laborers 67 7.9<br />
Total Employment (16 years and over) 853 100.0 1,048 100.0<br />
76 Issues and Opportunities Information
Table 1.17 continued<br />
Employment By Occupation – 1990 and 2000 – Barron County Municipal Units<br />
(yellow and green shading indicates combined categories)<br />
1990 2000<br />
Number Percent Number Percent<br />
City of Rice Lake<br />
Executive, administrative and managerial 287 7.9<br />
Professional 519 14.3 1,035 25.0<br />
Technician 91 2.5<br />
Sales 602 16.6 1,057 25.6<br />
Administrative support, including clerical 466 12.8<br />
Service 409 11.3 790 19.1<br />
Farming, forestry, fishing 49 1.4 24 0.6<br />
Construction, extraction and maintenance -- -- 460 11.1<br />
Precision production, craft and repair 401 11.1<br />
Machine operators, assemblers and inspectors 382 10.6 769 18.6<br />
Transportation and material moving 144 4.0<br />
Handlers, equipment cleaners, helpers & laborers 272 7.5<br />
Total Employment (16 years and over) 3,622 100.0 4,135 100.0<br />
Barron County<br />
Executive, administrative and managerial 1,303 7.1<br />
Professional 1,795 9.7 5,953 26.4<br />
Technician 408 2.2<br />
Sales 1,819 9.9 5,068 22.4<br />
Administrative support, including clerical 2,157 11.7<br />
Service 2,579 14.1 3,565 15.8<br />
Farming, forestry, fishing 2,278 12.3 595 2.6<br />
Construction, extraction and maintenance -- -- 2,197 9.7<br />
Precision production, craft and repair 2,145 11.6<br />
Machine operators, assemblers and inspectors 1,884 10.2 5,205 23.0<br />
Transportation and material moving 1,009 5.5<br />
Handlers, equipment cleaners, helpers & laborers 1,235 6.7<br />
Total Employment (16 years and over) 18,462 100.0 22,583 100.0<br />
source US Census<br />
Barron County Conditions and Trends Report 77
Table 1.18<br />
Travel Time to Work – 1990 and 2000 – Barron County<br />
1990 2000<br />
Number Percent Number Percent<br />
Worked at home 2,118 11.6 1,519 6.8<br />
Less than 5 minutes 1,932 10.6 2,048 9.2<br />
5 to 9 minutes 4,253 23.4 4,786 21.5<br />
10 to 19 minutes 5,784 31.8 6,906 31.1<br />
20 to 29 minutes 2,325 12.8 3,183 14.3<br />
30 to 44 minutes 1,040 5.7 1,852 8.3<br />
45 to 59 minutes 267 1.7 682 3.1<br />
60 minutes or longer 492 2.7 1,238 5.6<br />
TOTAL 18,211 100.0 22,214 100.0<br />
source: U.S. Census<br />
Table 1.19<br />
Place of Work – 1990 and 2000 – Barron County<br />
1990 2000<br />
Number Percent Number Percent<br />
Remainder of Barron County 7,629 41.9 8,503 38.3<br />
City of Rice Lake 6,121 33.6 7,494 33.7<br />
City of Barron 2,843 15.6 3,094 13.9<br />
Polk County 343 1.9 665 3.0<br />
Worked elsewhere 268 1.5 387 1.7<br />
Washburn County 225 1.2 370 1.7<br />
Dunn County 137 0.8 312 1.4<br />
City of Eau Claire 92 0.5 302 1.4<br />
St. Croix County 86 0.5 145 0.7<br />
Washington County, MN 82 0.5 93 0.4<br />
Remainder of Chippewa County 77 0.4 207 0.9<br />
Rusk County 57 0.3 112 0.5<br />
City of Chippewa Falls 54 0.3 145 0.7<br />
Remainder of Eau Claire County 52 0.3 76 0.3<br />
Minneapolis, MN 41 0.2 66 0.3<br />
Remainder of Hennepin County, MN 33 0.2 59 0.3<br />
St. Paul, MN 26 0.1 73 0.3<br />
Remainder of Ramsey County, MN 20 0.1 46 0.2<br />
Burnett County 14 0.1 38 0.2<br />
Sawyer County 11 0.1 27 0.1<br />
TOTAL 18,211 100.0 22,214 100.0<br />
source: U.S. Census<br />
78 Issues and Opportunities Information
Table 1.20<br />
Households by Household Income – 1989 and 1999 – Barron County<br />
Household<br />
Income<br />
Number of<br />
Households<br />
1989 1999<br />
% of Total<br />
Households<br />
Number of<br />
Households<br />
% of Total<br />
Households<br />
Number<br />
Change<br />
Percent<br />
Change<br />
Less than $10,000 2,971 19.2 1,691 9.5 -1,280 -43.1<br />
$10,000 to $14,999 1,983 12.8 1,304 7.3 -679 -34.2<br />
$15,000 to $24,999 3,562 23.1 2,681 15.0 -881 -24.7<br />
$25,000 to $34,999 2,836 18.4 2,596 14.6 -240 -8.5<br />
$35,000 to $49,999 2,439 15.8 3,721 20.9 1,282 52.6<br />
$50,000 to $74,999 1,161 7.5 3,523 19.8 2,362 203.4<br />
$75,000 or greater 486 3.1 2,300 12.9 1,814 373.3<br />
TOTAL 15,438 100.0 17,816 100.0 2,378 15.4<br />
source: U.S. Census<br />
Table 1.21<br />
Median Household Income – 1989 and 1999 – Barron and Surrounding Counties<br />
Change<br />
County 1989 1999 Number Percent<br />
Barron County $22,570 $37,275 14,705 65.2<br />
Burnett County 20,153 34,218 14,065 69.8<br />
Chippewa County 25,858 39,596 13,738 53.1<br />
Dunn County 24,452 38,753 14,301 58.5<br />
Polk County 24,267 41,183 16,916 69.7<br />
Rusk County 19,617 31,344 11,727 59.8<br />
St. Croix County 36,716 54,930 18,214 49.6<br />
Sawyer County 18,084 32,287 14,203 78.5<br />
Washburn County 19,962 33,716 13,754 68.9<br />
source: U.S. Census<br />
Barron County Conditions and Trends Report 79
Table 1.22<br />
Median Household Income – 1989 and 1999 – Barron County<br />
Dollars<br />
Change<br />
1989 1999 Dollars Percent<br />
Towns<br />
Almena $25,595 $42,833 17,238 67.3<br />
Arland 20,789 31,985 11,196 53.9<br />
Barron 27,132 46,500 19,368 71.4<br />
Bear Lake 30,625 44,271 13,646 44.6<br />
Cedar Lake 27,969 40,536 12,567 44.9<br />
Chetek 22,466 38,125 15,659 69.7<br />
Clinton 26,797 39,417 12,620 47.1<br />
Crystal Lake 24,722 37,109 12,387 50.1<br />
Cumberland 27,000 40,521 13,521 50.1<br />
Dallas 21,500 40,521 19,021 88.5<br />
Dovre 19,539 36,786 17,247 88.3<br />
Doyle 24,375 40,481 16,106 66.1<br />
Lakeland 24,408 42,266 17,858 73.2<br />
Maple Grove 27,692 44,625 16,933 61.1<br />
Maple Plain 31,667 47,333 15,666 49.5<br />
Oak Grove 27,404 43,088 15,684 57.2<br />
Prairie Farm 27,500 45,417 17,917 65.2<br />
Prairie Lake 22,838 40,048 17,210 75.4<br />
Rice Lake 29,965 45,649 15,684 52.3<br />
Sioux Creek 23,750 47,083 23,333 98.2<br />
Stanfold 28,482 39,000 10,518 36.9<br />
Stanley 28,984 41,944 12,960 44.7<br />
Sumner 24,091 38,333 14,242 59.1<br />
Turtle Lake 25,114 44,375 19,261 76.7<br />
Vance Creek 18,562 39,821 21,259 114.5<br />
Villages<br />
Almena 18,125 27,917 9,792 54.0<br />
Cameron 19,312 34,167 14,855 76.9<br />
Dallas 17,500 30,833 13,333 76.2<br />
Haugen 23,500 30,714 7,214 30.7<br />
New Auburn* 21,250 58,750 37,500 176.5<br />
Prairie Farm 20,083 38,000 17,917 89.2<br />
Turtle Lake** 17,315 29,485 12,170 70.3<br />
Cities<br />
Barron 20,574 33,281 12,707 61.8<br />
Chetek 17,132 31,270 14,138 82.5<br />
Cumberland 20,827 32,661 11,834 56.8<br />
Rice Lake 19,596 32,808 13,212 67.4<br />
Barron County 22,570 37,275 14,705 65.2<br />
State of <strong>Wisconsin</strong> 29,442 43,791 14,349 47.1<br />
*Portion in Barron County only. **Includes portion in Polk County.<br />
source: U.S. Census<br />
80 Issues and Opportunities Information
2. HOUSING INFORMATION<br />
Element Context<br />
This section contains an inventory and analysis of housing characteristics in Barron<br />
County. Quality housing is an essential component to healthy and vibrant communities,<br />
and striving to provide safe and cost-effective housing is an important community<br />
development goal. An analysis of housing conditions will help Barron County municipal<br />
units gain a better understanding of the changes that have occurred over the past 20 to 25<br />
years. It will also provide insight into future changes that can be anticipated. This<br />
information will create a foundation from which decisions regarding future housing<br />
development can be based.<br />
In its 2000 Consolidated Plan, the State of <strong>Wisconsin</strong> lists the following as housing<br />
priorities that serve as guiding principles for the housing component of local<br />
comprehensive plans:<br />
<br />
<br />
<br />
<br />
<br />
<br />
<br />
Provide affordable housing to all consumers, especially those with severe cost<br />
burdens.<br />
Maintain an adequate production of new units, including the provision of large family<br />
and elderly housing.<br />
Preserve and increase the availability of safe, sanitary housing for low and moderateincome<br />
owners and renters.<br />
Make lead based paint hazard reduction training and resources available.<br />
Provide housing assistance for special needs groups, including the homeless.<br />
Continue to ensure fairness and accessibility for all housing consumers.<br />
Continue to assist with housing disaster relief.<br />
These are items that local units of government should take into consideration as they<br />
develop housing goals and policies for their individual comprehensive plans.<br />
This housing element differentiates between the dwelling unit used for a home and the<br />
people that occupy the home. A household refers to the people living in any particular<br />
housing unit such as a single-family home. The U.S. Census indicates that a household<br />
includes all the persons who occupy a housing unit. A housing unit is a house, an<br />
apartment, a mobile home, a group of rooms, or a single room that is occupied (or if<br />
vacant, is intended for occupancy) as separate living quarters. Separate living quarters are<br />
those in which the occupants live and eat separately from any other persons in the<br />
building and that have direct access from the outside of the building or through a<br />
common hall. The occupants may be a single family, one person living alone, two or<br />
more families living together, or any other group of related or unrelated persons who<br />
share living arrangements. (People not living in households are classified as living in<br />
group quarters.)<br />
Barron County Conditions and Trends Report 81
Housing Supply<br />
Table 2.1 provides the historic and current count of housing units in Barron County from<br />
1980 to 2000. The communities shaded in gray are participating in the multijurisdictional<br />
comprehensive planning process. Between 1980 and 1990, 2,212 housing<br />
units were added countywide. During this period there were 21 municipal units with a<br />
housing growth of 10 percent or greater. Seven municipalities had a growth rate of more<br />
than 20 percent. Only the Town of Barron experienced a loss of housing units for the<br />
period, going from 329 to 323 units.<br />
From 1990 to 2000, the growth in the housing stock was not as great with only 1,604<br />
housing units added. Thirteen municipalities experienced an expansion in the number of<br />
housing units of over 10 percent. Five municipal units experienced growth in excess of<br />
20 percent. Six municipal units lost housing. A reduction in the municipality’s housing<br />
stock is most commonly caused by annexing land from a town to an incorporated<br />
municipality, or through abandonment, condemnation or destruction from natural<br />
disasters.<br />
Table 2.1 and Map 2.1 show housing unit change between 1980 and 2000. For the 20-<br />
year period, areas adding the most housing included the City of Rice Lake, City of<br />
Barron, City of Cumberland, Town of Rice Lake and Town of Cedar Lake. Areas losing<br />
housing included the Town of Barron, Town of Chetek and the Village of Dallas. The<br />
greatest percentage increases in housing units were in the Towns of Cedar Lake,<br />
Lakeland, Maple Plain and Rice Lake, and the Villages of Cameron and Turtle Lake.<br />
The Towns of Barron and Chetek, and the Village of Dallas saw decreases in housing.<br />
Between 1980 and 1990, County housing growth outpaced household growth with the<br />
addition 2,212 housing units and 1,665 households. Between 1990 and 2000, these rates<br />
switched, with household growth outpacing housing growth 2,212 to 1,604.<br />
Seasonal Units<br />
Seasonal units are used or intended for use only in certain seasons (e.g., beach cottages<br />
and hunting cabins) or for weekend or occasional use throughout the year. Seasonal units<br />
may also include quarters used for seasonal workers such as loggers. They typically<br />
demand less of public services than housing units that are occupied throughout the year.<br />
Barron County contained 2,299 seasonal units in 2000 as shown in Table 2.2.<br />
The majority of the seasonal housing in Barron County (92 percent) is located in the<br />
County’s towns. Seasonal units comprise a significant amount of the housing stock in<br />
some areas of the County. Areas with a large percentage of seasonal units include the<br />
Towns of:<br />
Almena 44 percent Lakeland 32 percent<br />
Cedar Lake 40 percent Maple Plain 46 percent<br />
Chetek 32 percent Prairie Lake 27 percent<br />
Crystal Lake 25 percent<br />
82 Housing Information
Historically, the number of seasonal<br />
units in the County increased<br />
between 1980 and 1990, and then<br />
decreased significantly between<br />
1990 and 2000 (see Table 2.3). This<br />
is a trend that is being seen<br />
throughout northern <strong>Wisconsin</strong><br />
wherein seasonal homes are being<br />
converted to year-round residences<br />
in high-amenity areas. Realtors, local<br />
officials and residents have indicated<br />
that several things are happening to<br />
explain the decreasing number of<br />
seasonal units:<br />
<br />
<br />
<br />
Higher-income households seeking to live on lake property are purchasing seasonal<br />
units. The units are then being converted into permanent single-family homes.<br />
Lakeside seasonal units are also being purchased, torn down and replaced by<br />
permanent single-family homes.<br />
Higher-income households are purchasing seasonal units as future retirement homes.<br />
As these households retire, more seasonal housing is becoming permanent singlefamily<br />
homes.<br />
Fewer traditional “cabins” used only for weekend recreation are present. More units<br />
that were previously seasonal are now being used year-round.<br />
An increasing permanent population base showing up in those areas that have<br />
traditionally had a large number of seasonal homes verifies this explanation. These areas<br />
also have higher median housing values.<br />
Occupancy and Structural Characteristics<br />
Housing occupancy helps determine whether the housing supply is adequate to meet<br />
demand. A stable housing market is one where the availability of new and existing<br />
housing units roughly matches the needs of the population. According to the U.S.<br />
Department of Housing and Urban Development (HUD), an overall housing vacancy rate<br />
of 3 percent is considered optimal. Vacancy rates under the 3 percent standard may imply<br />
a tight housing market where demand exceeds supply, causing housing prices to rise.<br />
Conversely, a vacancy rate greater than 3 percent may imply an over-supply of housing<br />
units, causing housing prices to stagnate.<br />
In 2000, the County’s vacancy rate was slightly higher than the 3 percent standard at 3.9<br />
percent. The 2000 vacancy rate is lower than the rates seen in 1980 or 1990 (7.3 percent<br />
and 5.3 percent, respectively). These decreasing vacancy rates may signify that it is<br />
becoming more difficult for households to locate appropriate housing in the County. In<br />
Barron County Conditions and Trends Report 83
other words, people seeking housing in aggregate have fewer choices, and the housing<br />
market is slowly swinging towards more of a sellers’ market.<br />
The majority of housing units in Barron County are owner occupied. In 2000, 13,525 (76<br />
percent) occupied housing units were identified as owner occupied, representing a 19<br />
percent increase from 1990. In 2000, 4,326 (24 percent) occupied housing units were<br />
identified as rental units. This represents a 6 percent increase from 1990. Of all rental<br />
units in the County, 59 percent are located in the cities and villages. In 2000, 78 percent<br />
of the housing stock was comprised of single-family units, 13 percent were multi-family<br />
units, and 8 percent were mobile homes.<br />
Table 2.4 displays the number of units per structure for Barron County for 2000. The<br />
majority of the housing units (84 percent) are one-unit detached structures, commonly<br />
referred to as single-family homes. Detached housing units are one-unit structures<br />
detached from any other house, with open space on four sides. Structures are considered<br />
detached even if they have an attached garage or contain a business unit. Attached<br />
housing units are one-unit structures that have one or more walls extending from ground<br />
to roof departing them from adjoining structures. Detailed housing occupancy and tenure<br />
data for individual municipalities is found at the end of this element in Table 2.12.<br />
Age Characteristics<br />
The age of the housing stock is an important element to be analyzed when preparing for<br />
the future. If there is a significant amount of older housing units within the housing<br />
supply, they will most likely need to be replaced, rehabilitated or abandoned for new<br />
development within the planning period. Allowing for a new housing supply also requires<br />
planning regarding infrastructure, land availability, community utilities, transportation<br />
routes, and a variety of other public services to address community needs that are<br />
affected by new development.<br />
Table 2.5 depicts the year that structures were built in Barron County. According to the<br />
table, the majority of the housing stock (26 percent) was built before 1939. While this is<br />
true for the County as a whole, in the Towns of Arland, Cedar Lake, Chetek, Lakeland,<br />
Prairie Farm, Rice Lake, Stanley, and the Village of Cameron, the majority of the<br />
housing has been constructed since 1990.<br />
Housing Value Characteristics<br />
Providing affordable housing that meets the needs of current and future Barron County<br />
residents is an important element in planning for the future. A lack of quality affordable<br />
housing has overriding impacts on population migration patterns, economic development<br />
and the county’s tax base.<br />
Table 2.6 provides housing values of specified owner-occupied units for 2000. A housing<br />
unit is owner-occupied if the owner or co-owner lives in the unit even if it is mortgaged<br />
84 Housing Information
or not fully paid for. The U.S. Bureau of the Census determines value by respondents’<br />
estimates of how much the property (house and lot, mobile home and lot, or<br />
condominium unit) would sell for if it placed on the market. Please note that the figures<br />
presented may differ from assessed housing value as calculated by a public agency<br />
assessor.<br />
As noted, the majority of housing units (53 percent) in Barron County were valued<br />
between $50,000 and $99,999 in 2000. The median housing value in Barron County of<br />
$78,000 is significantly lower than the State median value of $112,200. Areas with<br />
median housing values that exceed the State median include the Towns of Almena<br />
($126,000), Maple Plain ($156,000) and Rice Lake ($113,400). It should be noted that<br />
many of the areas that have higher median housing values are areas with a high<br />
percentage of seasonal or lakeside homes.<br />
As shown in Table 2.7, the majority of rental households (53 percent) pay between $300<br />
and $499 for rental costs. Approximately 24 percent pay slightly more, between $500 and<br />
$749.<br />
Housing Affordability<br />
The U.S. Department of Housing and Urban Development (HUD) defines affordable<br />
housing as housing that does not cost a household more than 30 percent of its household<br />
income. This affordability benchmark is not an underwriting standard; it does not address<br />
the ability to pay for housing. Households may choose to pay more to get the housing<br />
they need or want.; however, according to HUD standards, people should have the choice<br />
of having decent and safe housing for no more than 30 percent of their household income.<br />
As shown in Table 2.8, a majority (84 percent) of owner-occupied households in Barron<br />
County pay less than 30 percent of their household income towards housing costs. A<br />
much higher percentage of rental housing is experiencing housing cost burdens. As<br />
shown in Table 2.9, 35 percent of rental households are paying 30 percent or more of<br />
their monthly income for housing costs.<br />
Housing Unit and Household Projections<br />
Housing projections are helpful to estimate the amount of land that may be consumed by<br />
future housing development. As the number of households and housing units in a county<br />
continues to grow, there is a resulting need for local units of government to provide<br />
additional public facilities and services such as roads, sewer and water extensions, fire<br />
and police protection, schools, etc. It may also create a need for to develop and enforce<br />
additional regulations and ordinances. These are important planning issues for<br />
consideration.<br />
Barron County Conditions and Trends Report 85
The housing unit projections used for this plan are intended to provide an estimate of<br />
housing units that will be developed through the year 2030 based on observed changes in<br />
population and housing preferences. Household projections characterize changes in<br />
housing preferences and habitation patterns. The projections are based on several<br />
assumptions that create limitations that should be remembered when reviewing and<br />
evaluating the projections. The assumptions include the following:<br />
<br />
<br />
<br />
<br />
The population projections developed as part of this plan are reasonable and will<br />
continue to be reasonable during the planning period (see Table 1.10).<br />
The persons per housing unit will remain constant during the planning period.<br />
The vacancy rate will remain constant during the planning period.<br />
Past trends regarding seasonal housing, as previously described, will continue in the<br />
future.<br />
Based on the developed housing projections as shown in Table 2.10, it is estimated that<br />
Barron County will have 26,398 housing units by the year 2030. This is an increase of<br />
5,398 housing units, or 26 percent, from the 2000 census. It is projected that housing<br />
units will average an annual increase of approximately 180 housing units per year during<br />
the 30-year period. Some of the new housing will be clustered in those areas that have<br />
traditionally had a higher percentage of seasonal homes.<br />
Similarly, a household forecast is used to help develop housing and land use forecasts.<br />
The persons-per-household figure is obtained by dividing the number of persons in<br />
households by the number of households (or householders).<br />
Households with individuals under 18 years include not only families with related<br />
children but also all other households in which a person under 18 is present. The data is<br />
expressed here as a percent of all households. The <strong>Wisconsin</strong> Department of<br />
Administration Demographic Services office has prepared household projections for year<br />
2000 to 2025 in five-year increments that are found in Table 2.11.<br />
Summary<br />
• Between 1980 and 2000, Barron County experienced a 22 percent increase in housing<br />
growth, adding 3,816 units.<br />
• Areas adding the most housing for this period included the Cities of Rice Lake, Barron,<br />
and Cumberland, and the Towns of Rice Lake and Cedar Lake. Areas losing housing<br />
included the Towns of Barron and Chetek, and Village of Dallas.<br />
• Between 1980 and 1990, housing growth outpaced household growth in the county.<br />
Between 1990 and 2000, the opposite occurred.<br />
• Barron County contains a large number of seasonal homes, 92 percent of which are<br />
located in the towns. Areas with a large number of seasonal homes include the Towns<br />
86 Housing Information
of Almena, Cedar Lake, Chetek, Crystal Lake, Lakeland, Maple Plain and Prairie<br />
Lake.<br />
• Historically, the number of seasonal units in the County increased between 1980 and<br />
1990, and then decreased between 1990 and 2000. This is a trend that is being seen<br />
throughout northern <strong>Wisconsin</strong> as seasonal homes are being converted into permanent<br />
single-family residences, especially in areas with significant natural amenities such as<br />
lakes.<br />
• In 2000, the vacancy rate in Barron County was 3.9 percent. This is a decrease from the<br />
1980 rate of 7.3 percent, and the 1990 rate of 5.3 percent. These decreasing vacancy<br />
rates may indicate that it will be harder for households to locate adequate and<br />
affordable housing in the future.<br />
• Owner-occupied housing accounts for 76 percent of all housing in the county; rentals<br />
account for 24 percent. The majority (59 percent) of rentals are located in cities and<br />
villages. Eighty-four percent of the housing units are one-unit detached structures<br />
(single-family homes).<br />
• Twenty-six percent of the County’s housing stock was constructed before 1939,<br />
indicating that they may need to be replaced, rehabilitated or abandoned in the near<br />
future. In a few areas, the majority of housing was constructed after 1990. These areas<br />
include the Towns of Arland, Cedar Lake, Chetek, Lakeland, Prairie Farm, Rice Lake<br />
and Stanley, and the Village of Cameron.<br />
• The majority of housing in Barron County (53 percent) is valued between $50,000 and<br />
$99,999; however, some areas have median values that are noticeably higher than that<br />
of the County. These areas include the Towns of Almena, Maple Plain and Rice Lake.<br />
• More renters than homeowners are paying more than 30 percent of the household’s<br />
annual income on housing costs. Of the owner-occupied households in the County, 16<br />
percent pay more than 30 percent of their income for housing. Of rental households,<br />
35 percent are paying more than 30 percent of their income for housing costs.<br />
• It is estimated that by the year 2030 Barron County will contain 26,398 housing units.<br />
This represents an increase of 26 percent from 2000. This is an average of 180<br />
additional housing units per year for the period.<br />
• There are a wide variety of programs and organizations are available to help Barron<br />
County communities ensure they have an adequate supply of housing to meet a diverse<br />
array of current and future demands.<br />
Barron County Conditions and Trends Report 87
Data Tables and Map<br />
Table 2.1<br />
Housing Units – 1980 to 2000 – Barron County Municipal Units<br />
Percent Change<br />
Municipality 1980 1990 2000 1980-90 1990-00<br />
Towns<br />
Almena 522 609 662 16.7 8.7<br />
Arland 232 233 259 0.4 11.2<br />
Barron 329 323 323 -1.8 0<br />
Bear Lake 255 308 258 20.8 -16.2<br />
Cedar Lake 525 626 765 19.2 22.2<br />
Chetek 1,170 1,204 1,073 2.9 -10.9<br />
Clinton 312 332 374 6.4 12.7<br />
Crystal Lake 373 423 435 13.4 2.8<br />
Cumberland 365 398 425 9.0 6.8<br />
Dallas 201 202 235 0.5 16.3<br />
Dovre 197 207 259 5.1 25.1<br />
Doyle 163 180 194 10.4 7.8<br />
Lakeland 410 512 610 24.9 19.1<br />
Maple Grove 324 337 349 4.0 3.6<br />
Maple Plain 439 610 667 39.0 9.3<br />
Oak Grove 291 316 324 8.6 2.5<br />
Prairie Farm 203 204 222 0.5 8.8<br />
Prairie Lake 663 762 739 14.9 -3.0<br />
Rice Lake 847 985 1,216 16.3 23.5<br />
Sioux Creek 224 225 244 0.4 8.4<br />
Stanfold 237 249 258 5.1 3.6<br />
Stanley 663 805 896 21.4 11.3<br />
Sumner 202 215 222 6.4 3.3<br />
Turtle Lake 217 263 283 21.2 7.6<br />
Vance Creek 250 253 290 1.2 14.6<br />
Villages<br />
Almena 238 270 308 13.4 14.1<br />
Cameron 452 542 661 19.9 22.0<br />
Dallas 176 177 169 0.6 -4.5<br />
Haugen 110 133 131 20.9 -1.5<br />
New Auburn* 6 7 6 16.7 -14.3<br />
Prairie Farm 179 207 208 15.6 .5<br />
Turtle Lake** 325 394 477 21.5 21.1<br />
Cities<br />
Barron 1,083 1,283 1,442 18.5 12.4<br />
Chetek 962 991 1,052 3.0 6.2<br />
Cumberland 892 1,060 1,134 18.8 7.0<br />
Rice Lake 3,116 3,520 3,799 13.0 7.9<br />
Barron County 17,153 19,365 20,969 12.9 8.3<br />
source: U.S. Census.<br />
*Portion of New Auburn located in Barron County only. **A portion of the Village of Turtle Lake is located in Polk County. The<br />
table includes totals for the Barron County portion only. Housing unit totals for the entire Village are as follow: 1980 – 325, 1990 –<br />
394, 2000 – 508.<br />
88 Housing Information
Table 2.2<br />
Seasonal Units – 2000 – Barron County Municipal Units<br />
Seasonal Housing Units<br />
Municipality Total Housing Units Units % of Total<br />
Towns<br />
Almena 662 293 44.3<br />
Arland 259 8 3.1<br />
Barron 323 0 0.0<br />
Bear Lake 258 33 12.8<br />
Cedar Lake 765 303 39.6<br />
Chetek 1,073 342 31.9<br />
Clinton 374 51 13.6<br />
Crystal Lake 435 109 25.1<br />
Cumberland 425 54 12.7<br />
Dallas 235 11 4.7<br />
Dovre 259 16 6.2<br />
Doyle 194 7 3.6<br />
Lakeland 610 192 31.5<br />
Maple Grove 349 9 2.6<br />
Maple Plain 667 304 45.6<br />
Oak Grove 324 4 1.2<br />
Prairie Farm 222 13 5.9<br />
Prairie Lake 739 198 26.8<br />
Rice Lake 1,216 35 2.9<br />
Sioux Creek 244 12 4.9<br />
Stanfold 258 6 2.3<br />
Stanley 896 54 6.0<br />
Sumner 222 5 2.3<br />
Turtle Lake 283 49 17.3<br />
Vance Creek 290 14 4.8<br />
Villages<br />
Almena 308 3 1.0<br />
Cameron 661 0 0.0<br />
Dallas 169 13 7.7<br />
Haugen 131 6 4.6<br />
New Auburn* 6 0 0.0<br />
Prairie Farm 208 0 0.0<br />
Turtle Lake** 477 3 0.6<br />
Cities<br />
Barron 1,442 6 0.4<br />
Chetek 1,052 56 5.3<br />
Cumberland 1,134 65 5.7<br />
Rice Lake 3,799 25 0.7<br />
Barron County 20,969 2,299 11.0<br />
source: U.S. Census..<br />
*Portion of New Auburn located in Barron County only. **A portion of the Village of Turtle Lake is located in Polk County. The<br />
table includes totals for the Barron County portion only. Totals for the entire Village are as follow: Total housing units – 508, Vacant<br />
units – 28, Seasonal units – 5.<br />
Barron County Conditions and Trends Report 89
Table 2.3<br />
Housing Characteristics – 1980 to 2000 – Barron County<br />
1980 1990 2000<br />
Total Housing Units 17,153 19,363 20,969<br />
Total Seasonal 2,134 2,895 2,299<br />
Total Vacant 1,249 1,033 819<br />
Total Occupied Units 13,770 15,435 17,851<br />
Owner Occupied Units 10,525 11,345 13,525<br />
Renter Occupied Units 3,245 4,090 4,326<br />
Single Family Units* 12,007 14,719 16,395<br />
Multi-Family Units 1,994 2,280 2,814<br />
Mobile Homes 1,018 2,364 1,760<br />
source: U.S. Census<br />
*In 1980 seasonal units are not included in single family unit totals. In 1990 and 2000 they are included.<br />
90 Housing Information
Table 2.4<br />
Units in Structure – 2000 – Barron County Municipal Units<br />
Municipality<br />
1-Unit<br />
Detached<br />
1-Unit<br />
Attached 2 Units 3-4 Units<br />
5 or more<br />
Units<br />
Towns<br />
Almena 661 0 2 3 0<br />
Arland 203 2 0 0 0<br />
Barron 309 0 3 3 0<br />
Bear Lake 235 0 3 0 0<br />
Cedar Lake 674 5 7 0 0<br />
Chetek 902 7 22 0 0<br />
Clinton 320 2 10 0 0<br />
Crystal Lake 369 0 3 0 0<br />
Cumberland 368 0 2 0 0<br />
Dallas 222 0 0 0 0<br />
Dovre 221 9 0 0 0<br />
Doyle 156 2 0 0 0<br />
Lakeland 520 2 3 0 0<br />
Maple Grove 318 0 2 0 0<br />
Maple Plain 583 7 7 6 0<br />
Oak Grove 298 1 8 0 0<br />
Prairie Farm 192 0 0 0 0<br />
Prairie Lake 679 6 0 0 0<br />
Rice Lake 882 8 28 27 36<br />
Sioux Creek 226 0 0 0 0<br />
Stanfold 273 0 0 0 0<br />
Stanley 775 9 15 0 0<br />
Sumner 209 0 3 0 0<br />
Turtle Lake 248 2 4 0 0<br />
Vance Creek 232 0 0 0 0<br />
Villages<br />
Almena 194 5 31 32 0<br />
Cameron 442 11 98 29 35<br />
Dallas 130 0 5 8 0<br />
Haugen 118 0 3 9 0<br />
New Auburn* 6 0 0 0 0<br />
Prairie Farm 153 3 8 28 0<br />
Turtle Lake** 297 10 12 29 111<br />
Cities<br />
Barron 803 24 264 31 173<br />
Chetek 777 22 119 26 62<br />
Cumberland 753 14 116 83 105<br />
Rice Lake 2,401 69 503 225 470<br />
Barron County 16,149 220 1,281 539 992<br />
source: U.S. Census.<br />
*Portion of New Auburn located in Barron County only. **A portion of the Village of Turtle Lake is located in Polk County. The<br />
table includes totals for the Barron County portion only. Totals for the entire Village are as follow: 1-unit detached - 307 , 1- unit<br />
attached – 13, 2 units - 12 , 3-4 units - 47, 5 or more units –125.<br />
Barron County Conditions and Trends Report 91
Table 2.5<br />
Year Structure Built – 2000 – Barron County Municipal Units<br />
Municipality<br />
1990 to<br />
March ‘00<br />
1980 to<br />
1989<br />
1970 to<br />
1979<br />
1960 to<br />
1969<br />
1940 to<br />
1959<br />
1939 or<br />
earlier<br />
Towns<br />
Almena 100 91 124 138 110 125<br />
Arland 58 27 44 11 33 97<br />
Barron 29 27 70 22 43 140<br />
Bear Lake 44 45 59 13 28 61<br />
Cedar Lake 171 138 163 79 77 130<br />
Chetek 229 129 209 58 201 187<br />
Clinton 66 31 62 28 76 122<br />
Crystal Lake 68 41 85 57 28 144<br />
Cumberland 71 52 69 30 73 125<br />
Dallas 42 24 50 3 25 108<br />
Dovre 52 22 57 15 24 105<br />
Doyle 26 17 27 10 25 81<br />
Lakeland 149 105 148 57 72 83<br />
Maple Grove 55 35 66 19 51 121<br />
Maple Plain 143 112 150 83 102 72<br />
Oak Grove 57 26 62 25 43 124<br />
Prairie Farm 36 18 19 16 25 105<br />
Prairie Lake 138 80 130 41 153 205<br />
Rice Lake 342 162 315 71 149 131<br />
Sioux Creek 25 37 34 20 26 104<br />
Stanfold 30 22 45 20 32 139<br />
Stanley 217 149 210 76 142 117<br />
Sumner 42 29 47 11 26 76<br />
Turtle Lake 36 31 27 16 52 119<br />
Vance Creek 36 43 36 15 39 108<br />
Villages<br />
Almena 37 48 56 41 33 89<br />
Cameron 157 59 113 54 129 156<br />
Dallas 10 10 30 12 24 63<br />
Haugen 15 14 26 5 38 37<br />
New Auburn* 0 0 4 0 0 2<br />
Prairie Farm 8 21 37 17 38 85<br />
Turtle Lake** 79 81 61 32 84 136<br />
Cities<br />
Barron 206 216 233 80 268 413<br />
Chetek 163 87 179 74 291 261<br />
Cumberland 95 138 203 121 242 331<br />
Rice Lake 458 383 763 449 906 977<br />
Barron County 3,490 2,550 4,013 1,819 3,708 5,479<br />
source: U.S. Census<br />
*Portion of New Auburn located in Barron County only.<br />
**A portion of the Village of Turtle Lake is located in Polk County. The table includes totals for the Barron County portion only.<br />
Totals for the entire Village are as follow: 1990 to March 2000 – 104, 1980 to 1989 – 81, 1970 to 1979 – 61, 1960 to 1969 – 32, 1940<br />
to 1959 – 84, 1939 or earlier – 142.<br />
92 Housing Information
Table 2.6<br />
Housing Value of Specified Owner-Occupied Units – 2000 – Barron County Municipalities<br />
Less than<br />
$50,000<br />
$50,000 -<br />
$99,999<br />
$100,000 -<br />
$149,000<br />
$150,000 -<br />
$199,999<br />
$200,000 –<br />
$299,999<br />
$300,000 –<br />
$499,999<br />
$500,000<br />
or more<br />
Median<br />
Towns<br />
Almena 22 49 52 43 28 6 0 $126,000<br />
Arland 23 24 5 0 2 0 0 $54,000<br />
Barron 13 72 27 9 3 0 0 $82,400<br />
Bear Lake 10 59 23 13 7 2 4 $94,400<br />
Cedar Lake 37 89 51 38 31 3 2 $99,400<br />
Chetek 23 174 105 71 38 6 4 $106,000<br />
Clinton 20 53 16 7 2 0 0 $70,000<br />
Crystal Lake 15 58 10 3 2 0 0 $75,000<br />
Cumberland 21 82 29 12 2 0 0 $74,800<br />
Dallas 19 22 7 4 0 0 0 $65,000<br />
Dovre 15 16 7 6 2 0 0 $76,700<br />
Doyle 8 29 7 4 3 0 0 $73,600<br />
Lakeland 27 49 40 10 14 2 2 $96,400<br />
Maple Grove 34 51 24 0 2 0 0 $71,900<br />
Maple Plain 15 35 19 24 29 17 8 $156,600<br />
Oak Grove 20 49 28 2 3 2 2 $85,600<br />
Prairie Farm 16 26 9 2 0 0 0 $72,500<br />
Prairie Lake 30 133 62 35 12 6 0 $93,300<br />
Rice Lake 29 234 318 61 47 13 0 $113,400<br />
Sioux Creek 7 33 5 2 2 0 0 $78,300<br />
Stanfold 4 42 14 0 4 0 0 $82,500<br />
Stanley 43 230 156 42 9 11 0 $96,300<br />
Sumner 13 53 9 2 0 0 0 $75,300<br />
Turtle Lake 19 24 5 2 6 0 0 $62,700<br />
Vance Creek 10 29 7 4 3 0 0 $79,000<br />
Villages<br />
Almena 69 79 2 0 0 0 0 $52,900<br />
Cameron 72 215 62 7 2 0 0 $71,300<br />
Dallas 50 45 3 0 0 0 0 $48,800<br />
Haugen 30 52 11 0 0 0 0 $60,300<br />
New Auburn* 2 4 0 0 0 0 0 $75,000<br />
Prairie Farm 49 70 7 0 0 0 0 $58,800<br />
Turtle Lake** 65 133 18 2 0 0 0 $62,400<br />
Cities<br />
Barron 115 462 88 31 1 3 0 $70,600<br />
Chetek 107 327 76 20 9 0 0 $73,200<br />
Cumberland 95 307 95 22 21 16 0 $78,100<br />
Rice Lake 339 1,230 266 101 29 21 0 $71,500<br />
Barron County 1,486 4,639 1,663 579 313 108 22 $78,000<br />
source: U.S. Census.<br />
*Portion of New Auburn located in Barron County only. **A portion of the Village of Turtle Lake is located in Polk County. The<br />
table includes totals for the Barron County portion only. Totals for the entire Village are as follow: Less than $50,000 – 65, $50,000<br />
to $99,999 - 135,$100,000 to $149,000 – 21, $150,000 to $199,999 – 4, $200,000 or more – 0.<br />
Value<br />
Barron County Conditions and Trends Report 93
Table 2.7<br />
Contract Rent (Renter-Occupied Units) – 2000 – Barron County Municipal Units<br />
Municipality<br />
Less than<br />
$200<br />
$200 to<br />
$299<br />
$300 to<br />
$499<br />
Rents<br />
$500 to<br />
$749<br />
$750 to<br />
$999<br />
$1,000 or<br />
more<br />
Towns<br />
Almena 2 0 3 9 3 0<br />
Arland 0 8 5 2 0 0<br />
Barron 0 0 8 11 0 0<br />
Bear Lake 0 0 7 4 0 0<br />
Cedar Lake 0 2 7 2 0 0<br />
Chetek 2 6 28 23 3 0<br />
Clinton 3 3 13 7 0 0<br />
Crystal Lake 0 4 11 2 0 0<br />
Cumberland 0 2 11 4 0 0<br />
Dallas 0 0 9 11 0 0<br />
Dovre 3 0 10 0 3 0<br />
Doyle 0 0 3 3 0 0<br />
Lakeland 0 3 15 12 0 0<br />
Maple Grove 0 0 7 2 2 0<br />
Maple Plain 2 14 9 10 2 0<br />
Oak Grove 0 2 14 4 0 0<br />
Prairie Farm 0 0 2 4 0 0<br />
Prairie Lake 0 2 15 12 4 0<br />
Rice Lake 0 8 94 53 0 0<br />
Sioux Creek 0 0 3 3 0 0<br />
Stanfold 2 0 1 2 2 4<br />
Stanley 4 0 35 26 5 0<br />
Sumner 0 0 6 2 0 0<br />
Turtle Lake 0 2 0 14 2 0<br />
Vance Creek 6 2 2 11 0 0<br />
Villages<br />
Almena 17 2 32 19 2 0<br />
Cameron 10 22 134 58 15 0<br />
Dallas 5 7 10 5 0 0<br />
Haugen 6 2 10 2 0 0<br />
New Auburn* 0 0 0 0 0 0<br />
Prairie Farm 13 6 18 2 0 0<br />
Turtle Lake** 32 24 98 29 0 0<br />
Cities<br />
Barron 43 58 301 86 19 11<br />
Chetek 49 32 135 66 14 3<br />
Cumberland 41 43 164 61 15 0<br />
Rice Lake 120 88 785 333 51 0<br />
Barron County 360 342 2,005 894 142 18<br />
source: U.S. Census.<br />
*Portion of New Auburn located in Barron County only. **A portion of the Village of Turtle Lake is located in Polk County. The<br />
table includes totals for the Barron County portion only. Totals for the entire Village are as follow: Less than $200 – 34, $200 to $299<br />
– 24, $300 to $499 – 111, $500 to $749 – 29, $750 or more – 0.<br />
94 Housing Information
Table 2.8<br />
Owner-Occupied Housing Costs as a Percentage of Household Income – 1999<br />
Barron County Municipal Units<br />
Monthly Housing Costs as a Percentage of Household Income<br />
Towns<br />
Municipality<br />
Less<br />
than 15%<br />
15.0% to<br />
19.9%<br />
20.0% to<br />
24.9%<br />
25.0% to<br />
29.9%<br />
30.0% to<br />
34.9%<br />
35.0%<br />
or more<br />
Total Units<br />
Almena 87 28 15 21 15 32 198<br />
Arland 26 5 2 12 2 7 54<br />
Barron 57 29 18 5 4 11 124<br />
Bear Lake 39 31 15 12 2 19 118<br />
Cedar Lake 111 37 40 18 8 37 251<br />
Chetek 170 67 57 45 23 55 417<br />
Clinton 43 19 16 5 8 7 98<br />
Crystal Lake 34 15 21 8 2 8 88<br />
Cumberland 87 16 18 10 7 8 146<br />
Dallas 20 7 7 5 7 6 52<br />
Dovre 15 13 10 4 0 4 46<br />
Doyle 16 13 2 2 5 6 44<br />
Lakeland 62 27 22 12 7 14 144<br />
Maple Grove 70 15 6 6 0 14 111<br />
Maple Plain 52 22 24 21 14 14 147<br />
Oak Grove 50 15 17 11 3 10 106<br />
Prairie Farm 29 14 2 6 0 2 53<br />
Prairie Lake 115 60 28 21 6 46 276<br />
Rice Lake 275 158 79 64 33 84 693<br />
Sioux Creek 19 10 4 2 6 8 49<br />
Stanfold 22 14 10 2 2 14 64<br />
Stanley 200 76 70 57 44 44 491<br />
Sumner 31 15 12 11 6 4 79<br />
Turtle Lake 28 8 5 2 0 13 56<br />
Vance Creek 20 10 8 3 3 9 53<br />
Villages<br />
Almena 66 31 22 9 6 13 147<br />
Cameron 114 77 75 28 20 44 358<br />
Dallas 41 16 17 5 7 10 96<br />
Haugen 29 28 4 9 10 13 93<br />
New Auburn* 4 0 0 0 0 2 6<br />
Prairie Farm 68 34 9 6 3 4 124<br />
Turtle Lake** 90 36 39 14 4 33 216<br />
Cities<br />
Barron 319 160 70 28 70 51 698<br />
Chetek 203 134 61 51 25 68 542<br />
Cumberland 240 121 63 37 9 81 551<br />
Rice Lake 892 421 245 161 98 169 1,986<br />
Barron County 3,744 1,782 1,113 713 459 964 8,775<br />
source: U.S. Census..<br />
*Portion of New Auburn located in Barron County only. **A portion of the Village of Turtle Lake is located in Polk County. The<br />
table includes totals for the Barron County portion only. Totals for the entire Village are as follow: Less than 15% - 93, 15.0% to<br />
19.9% - 36, 20.0% to 24.9% - 39, 25.0% to 29.9% - 14, , 30.0% to 34.9% - 6, 35.0% or more – 35.<br />
Barron County Conditions and Trends Report 95
Table 2.9<br />
Renter-Occupied Housing Costs as a Percentage of Household Income – 1999<br />
Barron County Municipal Units<br />
Monthly Housing Costs as a Percentage of Household Income<br />
Towns<br />
Municipality<br />
Less<br />
than 15%<br />
15.0% to<br />
19.9%<br />
20.0% to<br />
24.9%<br />
25.0% to<br />
29.9%<br />
30.0% to<br />
34.9%<br />
35.0%<br />
or more<br />
Total Units<br />
Almena 5 7 2 3 0 0 17<br />
Arland 3 3 5 0 0 4 15<br />
Barron 3 4 5 2 3 2 19<br />
Bear Lake 6 0 3 2 0 0 11<br />
Cedar Lake 0 2 3 2 2 2 11<br />
Chetek 20 9 3 8 2 20 62<br />
Clinton 10 0 10 0 2 4 26<br />
Crystal Lake 5 3 5 2 0 2 17<br />
Cumberland 4 4 4 0 2 3 17<br />
Dallas 12 2 6 0 0 0 20<br />
Dovre 3 3 7 0 0 3 16<br />
Doyle 3 3 0 0 0 0 6<br />
Lakeland 10 5 7 0 0 6 28<br />
Maple Grove 4 2 3 0 0 2 11<br />
Maple Plain 18 7 2 2 0 6 35<br />
Oak Grove 10 2 4 0 0 4 20<br />
Prairie Farm 4 0 0 2 0 0 6<br />
Prairie Lake 14 4 3 5 2 5 33<br />
Rice Lake 51 59 7 9 9 20 155<br />
Sioux Creek 3 0 3 0 0 0 6<br />
Stanfold 4 1 0 0 4 0 9<br />
Stanley 22 10 6 12 0 20 70<br />
Sumner 3 2 2 0 1 0 8<br />
Turtle Lake 2 0 6 6 0 2 16<br />
Vance Creek 9 0 8 0 0 4 21<br />
Villages<br />
Almena 13 21 7 6 7 18 72<br />
Cameron 74 41 23 24 18 57 237<br />
Dallas 5 0 6 3 2 11 27<br />
Haugen 5 4 0 5 4 2 20<br />
New Auburn* 0 0 0 0 0 0 0<br />
Prairie Farm 24 3 2 0 5 5 39<br />
Turtle Lake** 47 25 22 22 18 47 181<br />
Cities<br />
Barron 80 78 43 82 55 172 510<br />
Chetek 71 33 45 34 21 87 291<br />
Cumberland 58 51 46 45 29 97 326<br />
Rice Lake 239 192 239 169 118 411 1,368<br />
Barron County 844 580 537 445 304 1,016 3,726<br />
source: U.S. Census.<br />
*Portion of New Auburn located in Barron County only. **A portion of the Village of Turtle Lake is located in Polk County. The<br />
table includes totals for the Barron County portion only. Totals for the entire Village are as follow: Less than 15% - 47 , 15.0% to<br />
19.9% - 25, 20.0% to 24.9% - 28, 25.0% to 29.9% - 24, 30.0% to 34.9% - 20, 35.0% or more – 52.<br />
96 Housing Information
Table 2.10<br />
Housing Unit Projections – 2000 to 2030 – Barron County Municipal Units<br />
2000<br />
Projection<br />
2005<br />
Projection<br />
2010<br />
Projection<br />
2015<br />
Projection<br />
2020<br />
Projection<br />
2025<br />
Projection<br />
2030<br />
Towns<br />
Almena 662 684 715 743 770 793 816<br />
Arland 259 274 280 287 295 298 301<br />
Barron 323 337 340 335 334 332 330<br />
Bear Lake 258 265 268 272 275 283 291<br />
Cedar Lake 765 771 830 894 953 1,10 1,067<br />
Chetek 1,073 1,170 1,282 1,397 1,516 1,627 1,738<br />
Clinton 374 402 418 438 457 471 485<br />
Crystal Lake 435 453 462 471 484 488 492<br />
Cumberland 425 430 440 447 455 458 461<br />
Dallas 235 239 242 246 251 252 253<br />
Dovre 259 289 314 339 361 383 405<br />
Doyle 194 205 213 222 228 232 236<br />
Lakeland 610 505 569 629 687 741 773<br />
Maple Grove 349 364 371 378 385 388 391<br />
Maple Plain 667 694 741 786 824 874 924<br />
Oak Grove 324 327 325 327 327 326 327<br />
Prairie Farm 222 221 218 225 222 220 222<br />
Prairie Lake 739 786 820 856 888 912 914<br />
Rice Lake 1,216 1,272 1,337 1,394 1,455 1,506 1,557<br />
Sioux Creek 244 260 270 283 294 303 312<br />
Stanfold 258 262 264 266 266 264 266<br />
Stanley 896 970 1,015 1,060 1,101 1,132 1,163<br />
Sumner 222 246 260 275 287 299 311<br />
Turtle Lake 283 290 313 326 341 353 365<br />
Vance Creek 290 308 329 348 369 381 393<br />
Villages<br />
Almena 308 326 341 359 376 390 404<br />
Cameron 661 726 777 827 876 918 960<br />
Dallas 169 182 180 179 177 177 177<br />
Haguen 131 133 135 139 136 137 148<br />
New Auburn* 6 9 9 9 10 10 10<br />
Prairie Farm 208 234 242 247 260 282 304<br />
Turtle Lake** 508 492 492 519 537 546 555<br />
Cities<br />
Barron 1,442 1,563 1,617 1,652 1,689 1,716 1,743<br />
Chetek 1,052 1,123 1,153 1,159 1,178 1,193 1,208<br />
Cumberland 1,134 1,220 1,252 1,295 1,333 1,366 1,399<br />
Rice Lake 3,799 4,030 4,146 4,295 4,447 4,556 4,668<br />
Barron County 21,000 22,021 22,899 23,838 24,826 25,612 26,398<br />
Source: U.S. Census.<br />
*Portion of New Auburn ocated in Barron County only. **Housing projections for the entire Village of Turtle Lake.<br />
Barron County Conditions and Trends Report 97
Table 2.11<br />
Household Projections – 2000 to 2030 – Barron County Municipal Units<br />
Estimate Proj. Proj. Proj. Proj. Proj. % change<br />
Municipality 2000 2005 2010 2015 2020 2025 2030 2000-2030<br />
Towns<br />
Almena 355 382 412 439 465 485 501 41.1<br />
Arland 233 247 260 271 280 286 292 25.3<br />
Barron 319 320 333 335 333 330 323 1.3<br />
Bear Lake 219 242 261 279 296 310 322 47.0<br />
Cedar Lake 395 442 493 542 587 628 664 68.1<br />
Chetek 707 755 816 872 924 968 1,004 42.0<br />
Clinton 314 346 371 395 418 436 451 43.6<br />
Crystal Lake 312 336 356 374 391 403 413 32.4<br />
Cumberland 360 370 390 401 410 414 415 15.3<br />
Dallas 217 223 233 241 247 251 254 17.1<br />
Dovre 238 272 302 331 357 382 403 69.3<br />
Doyle 177 192 205 218 228 237 244 37.9<br />
Lakeland 378 407 443 479 511 538 562 48.7<br />
Maple Grove 323 340 355 368 379 385 390 20.7<br />
Maple Plain 323 346 382 417 450 478 503 55.7<br />
Oak Grove 313 327 339 349 356 362 363 16.0<br />
Prairie Farm 204 212 219 225 230 232 233 14.2<br />
Prairie Lake 528 593 655 714 769 817 859 62.7<br />
Rice Lake 1,139 1,222 1,322 1,417 1,502 1,575 1,636 43.6<br />
Sioux Creek 225 244 260 275 288 299 308 36.9<br />
Stanfold 249 262 272 280 286 290 292 17.3<br />
Stanley 822 914 991 1,065 1,132 1,188 1,236 50.4<br />
Sumner 210 240 262 284 303 321 336 60.0<br />
Turtle Lake 224 238 249 258 267 272 275 22.8<br />
Vance Creek 257 275 295 315 332 348 359 39.7<br />
Subtotal: 9,041 9,747 10,476 11,144 11,741 12,235 12,638 39.8<br />
Cities<br />
Almena 295 320 346 372 397 417 434 47.1<br />
Cameron 640 720 799 873 944 1,007 1,061 65.8<br />
Dallas 146 147 148 148 147 144 140 -4.1<br />
Haugen 120 124 129 132 134 135 135 12.5<br />
New Auburn (part) 6 9 10 11 13 13 14 133.3<br />
Prairie Farm 199 213 227 241 252 262 269 35.2<br />
Turtle Lake (part) 450 465 496 525 551 572 587 30.4<br />
Subtotal: 1,856 1,998 2,155 2,302 2,438 2,550 2,640 42.2<br />
Villages<br />
Barron 1,389 1,456 1,530 1,609 1,677 1,732 1,773 27.6<br />
Chetek 939 995 1,056 1,110 1,159 1,196 1,224 30.4<br />
Cumberland 1,013 1,081 1,137 1,196 1,248 1,288 1,318 30.1<br />
Rice Lake 3,613 3,850 4,054 4,238 4,391 4,505 4,586 26.9<br />
Subtotal: 6,954 7,382 7,777 8,153 8,475 8,721 8,901 28.0<br />
Barron County 17,851 19,127 20,408 21,599 22,654 23,506 24,179 35.4<br />
source: <strong>Wisconsin</strong> Department of Administration, Demographic Services Center,October 2008.<br />
Projections are Pre-Release Version for Research and Analysis Only.<br />
98 Housing Information
Table 2.12<br />
Housing Characteristics – 1980 to 2000<br />
Barron County Municipal Units<br />
Municipal Unit 1980 1990 2000<br />
Town of Almena 1980 1999 2000<br />
Total Housing Units 522 609 662<br />
Total Seasonal 251 309 293<br />
Total Vacant 17 27 14<br />
Total Occupied Units 254 273 355<br />
Owner Occupied Units 219 237 322<br />
Renter Occupied Units 35 36 33<br />
Single Family Units 259 549 661<br />
Multi-Family Units 3 6 5<br />
Mobile Homes 9 54 22<br />
Town of Arland 1980 1990 2000<br />
Total Housing Units 232 233 259<br />
Total Seasonal 8 9 8<br />
Total Vacant 31 33 26<br />
Total Occupied Units 200 200 233<br />
Owner Occupied Units 172 163 209<br />
Renter Occupied Units 28 37 24<br />
Single Family Units 208 191 205<br />
Multi-Family Units 0 2 0<br />
Mobile Homes 15 40 65<br />
Town of Barron 1980 1990 2000<br />
Total Housing Units 329 323 323<br />
Total Seasonal 1 1 0<br />
Total Vacant 17 17 4<br />
Total Occupied Units 311 305 319<br />
Owner Occupied Units 256 249 277<br />
Renter Occupied Units 55 56 42<br />
Single Family Units 272 296 309<br />
Multi-Family Units 38 4 6<br />
Mobile Homes 18 23 16<br />
Town of Bear Lake 1980 1990 2000<br />
Total Housing Units 255 308 258<br />
Total Seasonal 64 114 33<br />
Total Vacant 32 19 6<br />
Total Occupied Units 159 175 219<br />
Owner Occupied Units 136 154 194<br />
Renter Occupied Units 23 21 25<br />
Single Family Units 157 230 235<br />
Multi-Family Units 11 2 3<br />
Mobile Homes 23 76 9<br />
Barron County Conditions and Trends Report 99
Table 2.12 continued<br />
Housing Characteristics – 1980 to 2000<br />
Barron County Municipal Units<br />
Municipal Unit 1980 1990 2000<br />
Town of Cedar Lake 1980 1990 2000<br />
Total Housing Units 525 626 765<br />
Total Seasonal 176 333 303<br />
Total Vacant 286 351 370<br />
Total Occupied Units 239 275 395<br />
Owner Occupied Units 191 234 362<br />
Renter Occupied Units 48 41 33<br />
Single Family Units 435 477 679<br />
Multi-Family Units 62 13 7<br />
Mobile Homes 28 136 72<br />
Town of Chetek 1980 1990 2000<br />
Total Housing Units 1,170 1,204 1,073<br />
Total Seasonal 641 591 342<br />
Total Vacant 69 54 24<br />
Total Occupied Units 460 559 707<br />
Owner Occupied Units 398 477 639<br />
Renter Occupied Units 62 82 68<br />
Single Family Units 447 993 909<br />
Multi-Family Units 39 23 22<br />
Mobile Homes 43 188 82<br />
Town of Clinton 1980 1990 2000<br />
Total Housing Units 312 332 374<br />
Total Seasonal 37 46 51<br />
Total Vacant 54 59 60<br />
Total Occupied Units 258 273 314<br />
Owner Occupied Units 217 219 274<br />
Renter Occupied Units 41 54 40<br />
Single Family Units 258 284 322<br />
Multi-Family Units 37 2 10<br />
Mobile Homes 17 46 53<br />
Town of Crystal Lake 1980 1990 2000<br />
Total Housing Units 373 423 435<br />
Total Seasonal 105 138 109<br />
Total Vacant 11 22 14<br />
Total Occupied Units 257 263 312<br />
Owner Occupied Units 219 219 280<br />
Renter Occupied Units 38 44 32<br />
Single Family Units 230 358 369<br />
Multi-Family Units 4 0 3<br />
Mobile Homes 34 63 51<br />
100 Housing Information
Table 2.12 continued<br />
Housing Characteristics – 1980 to 2000<br />
Barron County Municipal Units<br />
Municipal Unit 1980 1990 2000<br />
Town of Cumberland 1980 1990 2000<br />
Total Housing Units 365 398 425<br />
Total Seasonal 39 51 54<br />
Total Vacant 67 73 65<br />
Total Occupied Units 298 325 360<br />
Owner Occupied Units 268 276 323<br />
Renter Occupied Units 30 49 37<br />
Single Family Units 310 351 368<br />
Multi-Family Units 27 0 2<br />
Mobile Homes 28 47 45<br />
Town of Dallas 1980 1990 2000<br />
Total Housing Units 201 202 235<br />
Total Seasonal 6 2 11<br />
Total Vacant 25 20 18<br />
Total Occupied Units 176 182 217<br />
Owner Occupied Units 138 145 187<br />
Renter Occupied Units 38 37 30<br />
Single Family Units 156 183 212<br />
Multi-Family Units 14 0 0<br />
Mobile Homes 20 19 23<br />
Town of Dovre 1980 1990 2000<br />
Total Housing Units 197 207 259<br />
Total Seasonal 1 5 16<br />
Total Vacant 21 16 5<br />
Total Occupied Units 175 186 238<br />
Owner Occupied Units 151 147 207<br />
Renter Occupied Units 24 39 31<br />
Single Family Units 181 174 230<br />
Multi-Family Units 5 0 0<br />
Mobile Homes 10 33 45<br />
Town of Doyle 1980 1990 2000<br />
Total Housing Units 163 180 194<br />
Total Seasonal 5 6 7<br />
Total Vacant 14 12 10<br />
Total Occupied Units 144 162 177<br />
Owner Occupied Units 117 140 160<br />
Renter Occupied Units 27 22 17<br />
Single Family Units 129 148 158<br />
Multi-Family Units 19 2 0<br />
Mobile Homes 10 30 28<br />
Barron County Conditions and Trends Report 101
Table 2.12 continued<br />
Housing Characteristics – 1980 to 2000<br />
Barron County Municipal Units<br />
Municipal Unit 1980 1990 2000<br />
Town of Lakeland 1980 1990 2000<br />
Total Housing Units 410 512 610<br />
Total Seasonal 139 194 192<br />
Total Vacant 161 217 232<br />
Total Occupied Units 249 295 378<br />
Owner Occupied Units 199 255 342<br />
Renter Occupied Units 50 40 36<br />
Single Family Units 362 410 522<br />
Multi-Family Units 18 1 3<br />
Mobile Homes 30 101 77<br />
Town of Maple Grove 1980 1990 2000<br />
Total Housing Units 324 337 349<br />
Total Seasonal 3 1 9<br />
Total Vacant 23 34 26<br />
Total Occupied Units 301 303 323<br />
Owner Occupied Units 261 256 288<br />
Renter Occupied Units 40 34 35<br />
Single Family Units 298 305 318<br />
Multi-Family Units 2 0 2<br />
Mobile Homes 24 32 27<br />
Town of Maple Plain 1980 1990 2000<br />
Total Housing Units 439 610 667<br />
Total Seasonal 213 372 304<br />
Total Vacant 39 25 40<br />
Total Occupied Units 187 213 323<br />
Owner Occupied Units 160 180 273<br />
Renter Occupied Units 27 33 50<br />
Single Family Units 196 474 590<br />
Multi-Family Units 8 1 13<br />
Mobile Homes 22 135 55<br />
Town of Oak Grove 1980 1990 2000<br />
Total Housing Units 291 316 324<br />
Total Seasonal 13 12 4<br />
Total Vacant 19 27 11<br />
Total Occupied Units 272 289 313<br />
Owner Occupied Units 222 243 277<br />
Renter Occupied Units 50 46 36<br />
Single Family Units 264 277 299<br />
Multi-Family Units 15 5 8<br />
Mobile Homes 12 34 30<br />
102 Housing Information
Table 2.12 continued<br />
Housing Characteristics – 1980 to 2000<br />
Barron County Municipal Units<br />
Municipal Unit 1980 1990 2000<br />
Town of Prairie Farm 1980 1990 2000<br />
Total Housing Units 203 204 222<br />
Total Seasonal 5 9 13<br />
Total Vacant 21 22 18<br />
Total Occupied Units 182 182 204<br />
Owner Occupied Units 155 151 178<br />
Renter Occupied Units 27 31 26<br />
Single Family Units 185 187 192<br />
Multi-Family Units 0 0 0<br />
Mobile Homes 18 17 27<br />
Town of Prairie Lake 1980 1990 2000<br />
Total Housing Units 663 762 739<br />
Total Seasonal 227 312 198<br />
Total Vacant 58 41 13<br />
Total Occupied Units 378 409 528<br />
Owner Occupied Units 321 349 479<br />
Renter Occupied Units 57 60 49<br />
Single Family Units 398 646 685<br />
Multi-Family Units 12 0 0<br />
Mobile Homes 26 113 62<br />
Town of Rice Lake 1980 1990 2000<br />
Total Housing Units 847 985 1,216<br />
Total Seasonal 21 35 35<br />
Total Vacant 78 71 77<br />
Total Occupied Units 769 914 1,139<br />
Owner Occupied Units 623 769 986<br />
Renter Occupied Units 146 145 153<br />
Single Family Units 648 730 890<br />
Multi-Family Units 60 48 91<br />
Mobile Homes 139 207 189<br />
Town of Sioux Creek 1980 1990 2000<br />
Total Housing Units 224 225 244<br />
Total Seasonal 2 23 12<br />
Total Vacant 23 20 7<br />
Total Occupied Units 199 202 225<br />
Owner Occupied Units 161 159 193<br />
Renter Occupied Units 38 43 32<br />
Single Family Units 170 196 226<br />
Multi-Family Units 37 1 0<br />
Mobile Homes 15 28 20<br />
Barron County Conditions and Trends Report 103
Table 2.12 continued<br />
Housing Characteristics – 1980 to 2000<br />
Barron County Municipal Units<br />
Municipal Unit 1980 1990 2000<br />
Town of Stanfold 1980 1990 2000<br />
Total Housing Units 237 249 258<br />
Total Seasonal 7 18 6<br />
Total Vacant 8 18 3<br />
Total Occupied Units 222 231 249<br />
Owner Occupied Units 185 195 204<br />
Renter Occupied Units 37 36 45<br />
Single Family Units 213 235 273<br />
Multi-Family Units 2 0 0<br />
Mobile Homes 15 14 15<br />
Town of Stanley 1980 1990 2000<br />
Total Housing Units 663 805 896<br />
Total Seasonal 56 81 54<br />
Total Vacant 36 39 22<br />
Total Occupied Units 571 685 820<br />
Owner Occupied Units 496 579 727<br />
Renter Occupied Units 75 106 93<br />
Single Family Units 485 661 784<br />
Multi-Family Units 14 10 15<br />
Mobile Homes 108 134 110<br />
Town of Sumner 1980 1990 2000<br />
Total Housing Units 202 215 222<br />
Total Seasonal 2 11 5<br />
Total Vacant 18 17 7<br />
Total Occupied Units 182 187 210<br />
Owner Occupied Units 158 165 192<br />
Renter Occupied Units 23 22 18<br />
Single Family Units 168 188 209<br />
Multi-Family Units 14 3 3<br />
Mobile Homes 18 23 19<br />
Town of Turtle Lake 1980 1990 2000<br />
Total Housing Units 217 263 283<br />
Total Seasonal 20 44 49<br />
Total Vacant 29 62 59<br />
Total Occupied Units 188 201 224<br />
Owner Occupied Units 163 170 202<br />
Renter Occupied Units 25 31 22<br />
Single Family Units 204 223 250<br />
Multi-Family Units 3 4 4<br />
Mobile Homes 10 36 27<br />
104 Housing Information
Table 2.12 continued<br />
Housing Characteristics – 1980 to 2000<br />
Barron County Municipal Units<br />
Municipal Unit 1980 1990 2000<br />
Town of Vance Creek 1980 1990 2000<br />
Total Housing Units 250 253 290<br />
Total Seasonal 7 9 14<br />
Total Vacant 35 32 33<br />
Total Occupied Units 215 221 257<br />
Owner Occupied Units 184 171 213<br />
Renter Occupied Units 31 50 44<br />
Single Family Units 203 219 232<br />
Multi-Family Units 16 4 0<br />
Mobile Homes 31 30 45<br />
Village of Almena 1980 1990 2000<br />
Total Housing Units 238 270 308<br />
Total Seasonal 1 1 3<br />
Total Vacant 22 19 10<br />
Total Occupied Units 215 250 295<br />
Owner Occupied Units 170 177 207<br />
Renter Occupied Units 45 73 88<br />
Single Family Units 179 182 199<br />
Multi-Family Units 38 41 63<br />
Mobile Homes 20 44 42<br />
Village of Cameron 1980 1990 2000<br />
Total Housing Units 452 542 661<br />
Total Seasonal 0 0 0<br />
Total Vacant 18 23 21<br />
Total Occupied Units 434 519 640<br />
Owner Occupied Units 305 329 399<br />
Renter Occupied Units 129 190 241<br />
Single Family Units 330 371 453<br />
Multi-Family Units 106 115 162<br />
Mobile Homes 16 56 53<br />
Village of Dallas 1980 1990 2000<br />
Total Housing Units 176 177 169<br />
Total Seasonal 5 2 13<br />
Total Vacant 18 16 23<br />
Total Occupied Units 158 161 146<br />
Owner Occupied Units 120 128 116<br />
Renter Occupied Units 38 33 30<br />
Single Family Units 143 138 130<br />
Multi-Family Units 17 13 13<br />
Mobile Homes 16 26 6<br />
Barron County Conditions and Trends Report 105
Table 2.12 continued<br />
Housing Characteristics – 1980 to 2000<br />
Barron County Municipal Units<br />
Municipal Unit 1980 1990 2000<br />
Village of Haugen 1980 1990 2000<br />
Total Housing Units 110 131 131<br />
Total Seasonal 3 7 6<br />
Total Vacant 7 15 11<br />
Total Occupied Units 103 116 120<br />
Owner Occupied Units 78 84 101<br />
Renter Occupied Units 25 32 19<br />
Single Family Units 93 116 118<br />
Multi-Family Units 13 8 12<br />
Mobile Homes 4 7 3<br />
Village of New Auburn<br />
(Chippewa & Barron County) 1980 1990 2000<br />
Total Housing Units 178 195 222<br />
Total Seasonal 0 0 0<br />
Total Vacant 9 13 6<br />
Total Occupied Units 169 182 216<br />
Owner Occupied Units 131 128 162<br />
Renter Occupied Units 38 54 54<br />
Single Family Units 132 141 160<br />
Multi-Family Units 23 23 32<br />
Mobile Homes 23 31 30<br />
Village of Prairie Farm 1980 1990 2000<br />
Total Housing Units 179 207 208<br />
Total Seasonal 1 2 0<br />
Total Vacant 15 16 9<br />
Total Occupied Units 164 191 199<br />
Owner Occupied Units 121 127 146<br />
Renter Occupied Units 43 64 53<br />
Single Family Units 137 147 156<br />
Multi-Family Units 25 37 36<br />
Mobile Homes 23 23 14<br />
Village of Turtle Lake (Polk &<br />
Barron County) 1980 1990 2000<br />
Total Housing Units 325 395 508<br />
Total Seasonal 0 2 5<br />
Total Vacant 12 34 28<br />
Total Occupied Units 310 359 475<br />
Owner Occupied Units 225 234 258<br />
Renter Occupied Units 85 125 217<br />
Single Family Units 263 281 320<br />
Multi-Family Units 57 96 170<br />
Mobile Homes 5 18 14<br />
106 Housing Information
Table 2.12 continued<br />
Housing Characteristics – 1980 to 2000<br />
Barron County Municipal Units<br />
Municipal Unit 1980 1990 2000<br />
City of Barron 1980 1990 2000<br />
Total Housing Units 1,083 1,283 1,442<br />
Total Seasonal 0 4 6<br />
Total Vacant 51 66 47<br />
Total Occupied Units 1,032 1,213 1,389<br />
Owner Occupied Units 717 793 847<br />
Renter Occupied Units 315 420 542<br />
Single Family Units 795 814 827<br />
Multi-Family Units 201 326 468<br />
Mobile Homes 87 143 121<br />
City of Chetek 1980 1990 2000<br />
Total Housing Units 962 991 1,052<br />
Total Seasonal 105 95 56<br />
Total Vacant 81 60 57<br />
Total Occupied Units 776 836 939<br />
Owner Occupied Units 566 541 613<br />
Renter Occupied Units 210 295 326<br />
Single Family Units 664 761 799<br />
Multi-Family Units 146 160 207<br />
Mobile Homes 47 70 59<br />
City of Cumberland 1980 1990 2000<br />
Total Housing Units 892 1,060 1,134<br />
Total Seasonal 24 56 65<br />
Total Vacant 58 59 56<br />
Total Occupied Units 810 945 1,013<br />
Owner Occupied Units 567 615 665<br />
Renter Occupied Units 243 330 348<br />
Single Family Units 672 692 767<br />
Multi-Family Units 190 287 304<br />
Mobile Homes 6 81 59<br />
City of Rice Lake 1980 1990 2000<br />
Total Housing Units 3,116 3,520 3,797<br />
Total Vacant/Seasonal 170 191 184<br />
Total Occupied Units 2,926 3,329 3,615<br />
Owner Occupied Units 1,883 2,011 2,183<br />
Renter Occupied Units 1,043 1,318 1,432<br />
Single Family Units 2,152 2,226 2,470<br />
Multi-Family Units 825 1,058 1,198<br />
Mobile Homes 122 236 168<br />
source: U.S. Census<br />
Barron County Conditions and Trends Report 107
Map 2.1<br />
Housing Unit Change - Barron County<br />
108 Housing Information
3. TRANSPORTATION INFORMATION<br />
Element Context<br />
Transportation facilities have a significant influence on land use, development and<br />
quality of life for County residents. This section includes a review of transportation<br />
facilities found in Barron County, including highways, rail, airports, bike facilities,<br />
pedestrian facilities, and transit. Transportation types primarily recreational in nature,<br />
such as snowmobile, ATV, and hiking trails, are not discussed in this section, but can be<br />
found in the community facilities and natural resources sections. For reference, a map of<br />
the County’s roads, airports, and railroads can be found on the following page.<br />
Barron County provides much of the roadway infrastructure to support inter-county<br />
movements, intra-city movements and the demands of new growth. This road system<br />
also allows the movement of buses, bicycles and pedestrians. A well-maintained and<br />
planned transportation system can aid in economic development, support a variety of land<br />
uses, provide links among community facilities, and facilitate the provision of various<br />
public and emergency services.<br />
This element will function as a guide to identifying the County’s existing and proposed<br />
road network, identifying major transportation needs, and supporting the goals and<br />
objectives of the other elements of the Barron County Comprehensive Plan.<br />
This section was drafted in the context of regional, state and national transportation<br />
planning guidelines and principles. Numerous existing State and local transportation<br />
plans of regional significance are noted in Special Addendum: Inventory of Existing<br />
Plans, Programs, & Land Use Policies in <strong>West</strong> <strong>Central</strong> <strong>Wisconsin</strong> and are considered in<br />
the development of this plan. Transportation issues, needs, and strategies specific to<br />
individual communities will be addressed in their respective plans.<br />
Barron County Conditions and Trends Report 109
MAP 3.1 – Barron County Roads, Airports, and Railroads<br />
3<br />
14<br />
19<br />
<br />
13<br />
6<br />
20<br />
e<br />
<br />
5<br />
<br />
<br />
11<br />
e<br />
12<br />
e<br />
<br />
2<br />
8<br />
18<br />
<br />
4<br />
<br />
1<br />
16<br />
15<br />
10<br />
e<br />
17<br />
<br />
9<br />
<br />
7<br />
e Airports<br />
Railroads<br />
Local Roads<br />
County Highways<br />
State Highways<br />
U.S. Highways<br />
1<br />
Traffic Count Locations<br />
Barron County Area<br />
Comprehensive Plan<br />
110 Transportation Information
Background Data/Existing Conditions<br />
Highways<br />
Barron County is served by 1,973 miles of roads under state, county and local jurisdiction<br />
(see Table 3.1). Major north/south highways include US 53, US 63 and WIS 25. US 8<br />
and WIS 48 are major east/west highways.<br />
Table 3.1 - Road Mileage by Jurisdiction - 2008<br />
Jurisdiction Miles Percent of Total<br />
State 142.4 7.1<br />
County 290.7 14.6<br />
Towns 131.4 6.6<br />
Villages 41.9 2.1<br />
Cities 1386.7 69.6<br />
TOTAL 1993.1 100.0<br />
source: WisDOT, <strong>Wisconsin</strong> Information System for Local Roads,<br />
January 1, 2008.<br />
Traffic volumes have generally increased in the County. In some cases, such as County<br />
SS north of Cameron, volumes have declined when nearby highways, such as US 53,<br />
were improved (See Table 3.2).<br />
Table 3.2 - Traffic Volume History (1992-2003)<br />
Map ID<br />
(Map 3.1)<br />
Location<br />
US 53 (south of US 8)<br />
1992<br />
7,900<br />
1994<br />
NA<br />
1997<br />
8,600<br />
2000<br />
9,200<br />
2003<br />
10,000<br />
(2000-2003)<br />
8.00%<br />
(1992-2003)<br />
21.00%<br />
2 US 53 (north of WIS 48) 4,780 * 8,300 7,600 8,800 9,900 11.11% 51.72%<br />
3 US 53 (north of County V) 5,260 * 6,800 7,500 8,800 10,000 12.00% 47.40%<br />
4 US 8 (east of County M) 3,240 3,600 4,500 3,600 2,900 -24.14% -11.72%<br />
5 US 8 (west of County TT) 5,420 6,800 8,000 7,000 7,800 10.26% 30.51%<br />
6 US 8 (west of County P) 5,720 6,300 5,900 5,000 7,200 30.56% 20.56%<br />
7 County SS (north of County MM) 810 790 900 1,000 1,000 0.00% 19.00%<br />
8 County SS (north of US 8) 9,180 9,180 * 8,900 8,900 7,800 -14.10% -17.69%<br />
9 WIS 25 (north of County A) 1,710 1,700 1,800 2,000 2,200 9.09% 22.27%<br />
10 WIS 25 (between County D & D) 2,730 2,600 2,300 2,500 2,600 3.85% -5.00%<br />
11 WIS 25 (north of WIS 8) 2,300 2,500 2,300 2,300 2,700 14.81% 14.81%<br />
12 WIS 48 (west of US 53) 3,980 4,400 4,400 4,100 5,500 25.45% 27.64%<br />
13 WIS 48 (west of US 63) 2,380 2,400 1,900 2,900 2,900 * 0.00% 17.93% *<br />
14 WIS 48 (north of County V) 2,280 2,400 2,200 4,400 3,100 -41.94% 26.45%<br />
15 County K (south of County D) 290 400 660 440 540 18.52% 46.30%<br />
16 County D (east of County K) 500 590 710 470 460 -2.17% -8.70%<br />
17 County F (south of County A) 820 600 1,000 630 670 5.97% -22.39%<br />
18 County C (east of County M) 1,040 970 1,100 1,200 1,200 * 0.00% 13.33% *<br />
19 US 63 (north of US 8) 3,430 4,100 3,700 4,500 4,300 -4.65% 20.23%<br />
20 County H (west of US 63) 1,080 1,200 1,000 1,600 1,600 * 0.00% 32.50% *<br />
source: Barron County Comprehensive Plan - Existing Conditions Report, (May, 2005), and<br />
2006 <strong>Wisconsin</strong> Highway Traffic Volume Data, WisDOT, (August, 2007).<br />
Percent<br />
Change<br />
Percent<br />
Change<br />
* Denotes use of traffic count from previous recorded year.<br />
Barron County Conditions and Trends Report 111
In Barron County, three highways are classified as backbone or connector routes in the<br />
<strong>Wisconsin</strong> Department of Transportation (WisDOT) Corridors 2020 Plan. US 8 and US<br />
63 are identified as connector routes, while US 53 is classified as a backbone route. As<br />
connector routes, US 8 and US 63 link significant economic and tourism centers into the<br />
backbone system. The backbone system is a collection of multilane highways such as the<br />
interstate system and much of the state trunk highway system (including US 53) that<br />
serve longer interregional trips within the State and between <strong>Wisconsin</strong> and the nation.<br />
Roads can be generally classified into three<br />
categories - arterials, collectors and local roads.<br />
The type of service it provides determines a<br />
road’s classification. Typically, arterials provide<br />
the least amount of access and highest level of<br />
mobility, while local streets provide the most<br />
access and lowest level of mobility. Collector<br />
roads provide a combination of access and<br />
mobility.<br />
The functional classification of the rural areas of<br />
the County is shown on Map 3.2. The only<br />
community over the population threshold of<br />
5,000 persons, considered to be “urban” for the<br />
purposes of functional classification, is Rice Lake<br />
(See Map 3.3). Table 3.3 breaks up road<br />
mileages by jurisdiction within each municipality.<br />
The backbone and connector routes, which link <strong>Wisconsin</strong>’s economic and tourism<br />
centers, are all classified as arterials since they are designed to provide a high level of<br />
mobility between communities. Typically, arterials accommodate higher levels of traffic<br />
at higher speeds than collectors. The actual number of vehicles that a road can<br />
accommodate is determined by a number of factors, including the number of travel lanes,<br />
posted speed limit and the level of access the road provides. Generally, a two-lane road<br />
can accommodate up to 13,500 vehicles per day. A four-lane road with a median can<br />
accommodate between 13,500 and 30,000 vehicles per day.<br />
Of the State and US highways located in Barron County, the State Highway Plan 2020<br />
identifies US 8 as a facility that will experience moderate congestion by the year 2020 if<br />
no capacity expansion improvements are made. No other highways in the County were<br />
identified as having future capacity issues.<br />
112 Transportation Information
Map 3.2 - Barron County Rural Functional Classification<br />
Barron County Conditions and Trends Report 113
Map 3.3 - City of Rice Lake Urban Functional Classification<br />
114 Transportation Information
Table 3.3 – Road Miles by Functional Classification and Jurisdiction for Municipalities<br />
County Jurisdiction<br />
Municipal Jurisdiction<br />
Municipality<br />
Name<br />
Gross Road<br />
Miles<br />
County<br />
Miles<br />
Municpal<br />
Miles Arterial Collector Local Arterial Collector Local<br />
T. Almena 65.92 3.02 62.90 3.02 0.11 62.79<br />
T. Arland 66.66 16.62 50.04 16.36 0.26 50.04<br />
T. Barron 55.84 5.44 50.40 4.68 0.76 50.40<br />
T. Bear Lake 55.93 14.00 41.93 11.22 2.78 5.71 36.22<br />
T. Cedar Lake 67.05 3.26 63.79 2.98 0.28 8.04 55.75<br />
T. Chetek 84.20 12.85 71.35 12.85 3.14 68.21<br />
T. Clinton 70.85 10.38 60.47 9.62 0.76 60.47<br />
T. Crystal Lake 63.98 5.14 58.84 5.14 6.14 52.70<br />
T. Cumberland 72.34 10.94 61.40 10.94 61.40<br />
T. Dallas 56.15 16.53 39.62 16.31 0.22 39.62<br />
T. Dovre 69.62 13.14 56.48 13.14 1.15 55.33<br />
T. Doyle 48.88 9.16 39.72 9.16 3.58 36.14<br />
T. Lakeland 67.04 6.15 60.89 6.15 2.43 58.46<br />
T. Maple Grove 77.80 10.38 67.42 10.12 0.26 67.42<br />
T. Maple Plain 64.19 7.84 56.35 7.84 0.49 55.86<br />
T. Oak Grove 77.40 17.51 59.89 17.51 59.89<br />
T. Prairie Farm 61.88 14.66 47.22 14.66 47.22<br />
T. Prairie Lake 81.06 19.00 62.06 19.00 62.06<br />
T. Rice Lake 64.76 12.96 51.80 1.32 11.64 5.38 46.42<br />
T. Sioux Creek 71.17 17.22 53.95 17.22 53.95<br />
T. Stanfold 56.08 3.01 53.07 3.01 2.93 50.14<br />
T. Stanley 72.79 7.76 65.03 0.65 7.11 7.81 57.22<br />
T. Sumner 51.99 6.37 45.62 6.37 45.62<br />
T. Turtle Lake 71.58 15.24 56.34 15.24 3.64 52.70<br />
T. Vance Creek 63.48 13.40 50.08 13.40 1.46 48.62<br />
V. Almena 6.70 1.10 5.60 1.10 0.84 4.76<br />
V. Cameron 16.01 1.78 14.23 1.78 14.23<br />
V. Dallas 7.08 2.77 4.31 2.77 4.31<br />
V. Haugen 5.03 2.10 2.93 1.69 0.41 2.93<br />
V. New Auburn 0.63 0.38 0.25 0.38 0.25<br />
V. Prairie Farm 6.99 2.13 4.86 2.13 4.86<br />
V. Turtle Lake 11.41 1.70 9.71 1.70 1.28 8.43<br />
C. Barron 22.06 0.00 22.06 5.05 17.01<br />
C. Chetek 27.02 4.02 23.00 4.02 3.24 19.76<br />
C. Cumberland 21.02 1.47 19.55 1.47 2.29 17.26<br />
C. Rice Lake 68.09 1.31 66.78 0.77 0.54 10.79 8.08 47.91<br />
TOTALS 1850.68 290.74 1559.94 2.74 282.27 5.73 10.79 72.79 1476.36<br />
source: <strong>Wisconsin</strong> Information System for Local Roads, WisDOT, January 1, 2008.<br />
Barron County Conditions and Trends Report 115
Highway Projects in the County<br />
Various construction and repair projects are programmed for the State highways in<br />
Barron County between 2008 and 2013. A total of 41.65 miles are scheduled for<br />
improvement over this six-year period (See Table 3.4).<br />
Table 3.4 - WisDOT 6-year Plan Projects for Barron County<br />
Length Estimated<br />
Hwy Project Title<br />
(in miles) Project Cost<br />
$1,000,000 -<br />
53 Rice Lake - Spooner 4.41<br />
$1,999,999<br />
8 Turtle Lake to Cameron Road<br />
53 Rice Lake - Spooner 0<br />
25 Barron to STH 48 1.52<br />
53 Rice Lake - Spooner 2.3<br />
53 New Auburn - Rice Lake 16.28<br />
source: WisDOT 6-Year Plan, 2008.<br />
$750,000 -<br />
$999,999<br />
$250,000 -<br />
$499,999<br />
$500,000 -<br />
$749,999<br />
$7,000,000 -<br />
$7,999,999<br />
$7,000,000 -<br />
$7,999,999<br />
Year<br />
(SFY)<br />
Project Description<br />
2008 Concrete and Joint Repairs.<br />
2009<br />
2009<br />
Replace the existing deck. Add rip rap<br />
on the west slope to prevent further<br />
erosion. Replace the surface drains in the<br />
NE & SE corners.<br />
Bridge rehabilitation, deck overlay on<br />
CTH SS south bound bridge B-03-0056.<br />
2012 Pulverize and overlay the roadway.<br />
2012<br />
Eliminate the at grade intersection,<br />
construct a 2 quadrant, partial cloverleaf<br />
interchange, with ramps in the northwest<br />
and northeastquadrants.<br />
2013 Resurface existing pavement.<br />
Two future highway projects in Barron County have been undergoing significant study<br />
for a number of years. The following discussion summarizes those:<br />
US 8 corridor<br />
Study to address existing safety and congestion concerns along the US 8 corridor,<br />
from WIS 35, in Polk County, to US 53, in Barron County, has been ongoing for<br />
many years. Proposals reached the Environmental Impact Study (EIS) stage, with<br />
WisDOT and their consultant embarking on that study in 2001. The EIS, adopted<br />
by WisDOT in October of 2007, recommends on-alignment improvements in the<br />
Apple River/Clover Lake and Joel Flowage areas, southern realignments in the<br />
Deer Lake, Range, and Poskin areas, and a south bypass at the City of Barron. A<br />
preferred alternative for the Village of Turtle Lake area has not yet been decided<br />
upon. Further discussion of the US 8 Final EIS can be found in the Addendum:<br />
Inventory of Programs, Plans, and Land Use Policies of <strong>West</strong> <strong>Central</strong> <strong>Wisconsin</strong>.<br />
US 53/County V intersection<br />
The intersection of US 53 and County V has been brought to the forefront due to<br />
the severity of crashes that have occurred. The crash rate for this intersection is<br />
not at a level that would be considered high, but the percent that result in injury<br />
and fatal crashes are above the state wide average. In 1993 or 1994, the<br />
116 Transportation Information
Bridges<br />
community expressed concerns with the intersection and the crashes analyzed, but<br />
at that time no changes were made. In 2000, a safety team was put together to<br />
review six intersections on US 53 one of which was County V. The following<br />
year, low cost improvements, including rumble strips and painting in the median,<br />
were installed, and in 2003 flash warning lights were installed along US 53.<br />
Further examination of the intersection is ongoing. A corridor preservation study<br />
began in 2006, and is nearing completion. The Environmental Assessment (EA)<br />
will be available for public comment in late summer 2008, and the mapping will<br />
be adopted following a public hearing following the EA comment period.<br />
The preferred alternative for this segment of USH 53 include an overpass at 26 th<br />
Avenue and 30 th Avenue, an interchange at County V, and closures of 26 th<br />
Avenue, County SS, and 29¾ Avenue. The interchange at County V and the<br />
closure of 27 th Avenue and County SS are tentatively scheduled for 2011 or 2012.<br />
The overpasses at 26 th and 30 th avenues are not currently scheduled for<br />
construction.<br />
There are a total of 317 bridges in Barron County.<br />
WisDOT generally defines a bridge as any structure<br />
spanning 20 feet or more that carries motor vehicle traffic.<br />
Of these bridges, 65 are under State ownership and<br />
maintenance, 59 are owned by the County, and 193 are<br />
under local ownership (See Table 3.5).<br />
State and local bridges are inspected at least once every two<br />
years. WisDOT is responsible for inspections of all bridges<br />
along the State highway system. Municipalities handle<br />
inspections for bridges along the local roadway system.<br />
WisDOT and local governments follow federal guidelines<br />
in their bridge inspection and maintenance procedures.<br />
Bridges are rated and categorized in terms of their<br />
functional and structural situation. Functionally obsolete is<br />
an engineering term frequently used to describe older<br />
bridges that no longer meet modern geometric standards.<br />
For example, it could refer to a bridge with narrow lanes or<br />
shoulders. A bridge classified as functionally obsolete does<br />
not mean the bridge is unsafe for public travel.<br />
Structurally deficient is an engineering term used to<br />
describe a bridge with one or more elements that will<br />
require attention. The classification does not mean the<br />
bridge is unsafe for travel. For example, it could refer to a<br />
combination of elements on a bridge such as potholes on a<br />
bridge deck or rust on metal trusses. These have little to<br />
Table 3.5 - Ownership of Bridges<br />
Owner<br />
No. of Bridges<br />
State of <strong>Wisconsin</strong> 65<br />
Barron County 59<br />
C. Barron 6<br />
C. Chetek 1<br />
C. Rice Lake 5<br />
V. Almena 1<br />
V. Haugen 1<br />
T. Almena 3<br />
T. Arland 11<br />
T. Barron 10<br />
T. Bear Lake 4<br />
T. Cedar Lake 6<br />
T. Chetek 8<br />
T. Clinton 13<br />
T. Cumberland 4<br />
T. Dallas 8<br />
T. Dovre 7<br />
T. Doyle 15<br />
T. Lakeland 1<br />
T. Maple Grove 7<br />
T. Oak Grove 8<br />
T. Prairie Farm 7<br />
T. Prairie Lake 6<br />
T. Rice Lake 1<br />
T. Sioux Creek 9<br />
T. Stanfold 8<br />
T. Stanley 6<br />
T. Sumner 12<br />
T. Turtle Lake 9<br />
T. Vance Creek 16<br />
Total 317<br />
source:WisDOT, 2008.<br />
Barron County Conditions and Trends Report 117
Table 3.6 - Functionally Obsolete and Structurally Deficient Bridges in Barron County<br />
State<br />
Bridge I.D. Owner Location Bridge On Bridge Over Year Built Deficiency<br />
B030184 Town T. Clinton 18th Avenue Hay River 2007 F.O.<br />
P030139 Town T. Prairie Farm 1st Avenue Hay River 1978 F.O.<br />
B030181 Town T. Sumner 12 3/4 Avenue Moose Ear Creek 2006 F.O.<br />
P030037 County T. Chetek CTH D Chetek River 1929 F.O.<br />
B030185 Town T. Oak Grove 29th Avenue Brill River 2006 F.O.<br />
P030711 City C. Barron Memorial Drive Quaderers Creek 1930 F.O.<br />
P030094 Town T. Barron 14 1/2 Avenue Barker Creek 1934 S.D. AND F.O.<br />
P030099 Town T. Clinton 18th Avenue Hay River 1940 S.D. AND F.O.<br />
P030716 City C. Rice Lake Sawyer Street Upper Rice Lake 1953 S.D. AND F.O.<br />
P030101 Town T. Clinton 17th Avenue Hay River 1920 S.D. AND F.O.<br />
P030982 Town T. Cumberland 7th Street W. Branch Hay River 1900 S.D. AND F.O.<br />
P030080 Town T. Sumner 17 1/4 Avenue Pokegama Creek 1925 S.D. AND F.O.<br />
P030090 Town T. Barron 18th Avenue Yellow River 1950 S.D. AND F.O.<br />
B030727 County T. Rice Lake CTH SS Bear Creek 1931 S.D. AND F.O.<br />
source: WisDOT, 2008.<br />
no impact on a bridge’s overall safe function. Depending on the extent of the<br />
structural deficiency, the bridge may be load-posted until improvements are completed.<br />
All bridges under State ownership in Barron County meet all structural and functional<br />
standards. There are 14 bridges under County or local ownership that are classified as<br />
either structurally deficient or functionally obsolete, or both (See Table 3.6).<br />
Rustic Roads System<br />
The Rustic Roads System in <strong>Wisconsin</strong> was created by<br />
the 1973 State legislature to help citizens and local<br />
units of government preserve what remains of<br />
<strong>Wisconsin</strong>'s scenic, lightly traveled country roads for the<br />
leisurely enjoyment of bikers, hikers and motorists.<br />
Unique brown and yellow signs mark the routes of all<br />
officially designated Rustic Roads. These routes provide<br />
bikers, hikers and motorists with an opportunity to<br />
casually travel through some of <strong>Wisconsin</strong>'s scenic<br />
countryside.<br />
All Rustic Roads remain under local jurisdiction and are<br />
eligible for the same State aid as other public highways.<br />
There are three Rustic Roads in Barron County:<br />
Officially designated Rustic Road sign<br />
• Rustic Road 18 begins at County M, follows Gehler Road (23rd St.) south to 15<br />
1/4 Ave., and returns to County M. Its total length is 4.6 miles<br />
• Rustic Road 67 is located in Barron and Polk Counties and follows portions of<br />
Pine Road, 13 3/4 Avenue, <strong>West</strong> County Line Road and 16th Avenue, forming a<br />
loop from US 8 to US 63. Its total length is 4.8 miles.<br />
118 Transportation Information
• Rustic Road 83 follows 13 3/4 -16th Street/Narrow Gauge Road between County<br />
V and 30th Street at the Barron/Washburn County Line. Its total length is 4.6<br />
miles.<br />
Map 3.4 Rustic Roads in Barron County<br />
Rustic Road 18 Rustic Road 67 Rustic Road 83<br />
source: WisDOT travel information website<br />
Access Management<br />
Access management includes planning the number and location of driveways on<br />
roadways. This practice helps maintain safe and efficient traffic movement on roadways,<br />
and access to and from property, particularly in more urban areas. Road function and<br />
safety increase as the number of access points decrease.<br />
WisDOT employs three types of access control authorized by State statutes. They are<br />
referred to as <strong>Wisconsin</strong> Statutes (Wis. Stats.) 84.09, 84.25 and 84.295. A short summary<br />
of the State statutes follows, but it should be noted that the actual content of the statutes is<br />
significantly more detailed, and many special conditions and provisions are not included<br />
in this text. The type of access control that is imposed on various highway road segments<br />
influences how that segment is managed.<br />
• Wis. Stats. 84.09 (purchase access control) – WisDOT acquires land by gift,<br />
devise, purchase or condemnation to establish, extend or improve transportation<br />
facilities.<br />
• Wis. Stats 84.25 (administrative access control) – WisDOT designates some rural<br />
portions of the State trunk highway system as controlled-access highways where<br />
studies show that the potential exists for traffic volumes to exceed 2,000 vehicles<br />
per 24-hour day.<br />
Barron County Conditions and Trends Report 119
• Wis. Stats 84.295 (freeway and expressway access control) – WisDOT designates<br />
highways with greater than 4,000 vehicles per day as freeways or expressways<br />
when it is determined that the volume and character of traffic warrants the<br />
construction or acquisition of right-of-way to accommodate a four-lane highway.<br />
Access control is in effect on several of the highways in Barron County. These highways<br />
include US 8, US 53 and WIS 48, with each having segments that go through, and<br />
directly serve, commercial areas. US 8 has Wis. Stats. 84.09 access control in effect from<br />
WIS 25 to US 53, and between the western Barron County Line and County P. US 53<br />
has Wis. Stats. 84.295 throughout Barron County. Finally, WIS 48 has Wis. Stats. 84.09<br />
access control in effect between US 53 and County SS.<br />
Designated Truck Routes<br />
Truck routes are designed to accommodate semi-trucks and include roadside<br />
accommodations at rest areas for temporary parking. Long truck routes also often<br />
include private truck parking and fueling stations along the routes. Several of the State<br />
and US highways are designated as long truck routes in Barron County, including US 8,<br />
US 53, US 63, WIS 25 and WIS 48 from US 8 south to the County line.<br />
Transit<br />
The only urban public transit service available in Barron County is the Rice Lake City<br />
Cab system, which provides door-to-door service for trips with origins and destinations<br />
within the City. Service hours are Monday through Saturday, 6:00 a.m. to 6:00 p.m. The<br />
service utilizes sedans, vans, and buses, and complies with Americans with Disabilities<br />
(ADA) requirements.<br />
Other specialized transportation services are available on a limited basis through several<br />
County programs serving the aging and human service needs of various County<br />
populations. The Barron County Office on Aging provides fixed route service to adult<br />
day care several days a week, as well as monthly trips from Chetek, Barron, Cumberland<br />
and Turtle Lake, into Rice Lake. A demand response service is also available to the<br />
elderly and persons with disabilities through the Office on Aging, on weekdays, from<br />
10:00 a.m. to 2:00 p.m. The Barron County Health and Human Services Department.<br />
There is currently no intercity bus service available within Barron County. However, a<br />
new service is being introduced by Jefferson Lines, July 17, 2008, between<br />
Minneapolis/St. Paul, Minnesota and Milwaukee, <strong>Wisconsin</strong>, with intermediate stops in<br />
Hudson, Menomonie, Eau Claire, Chippewa Falls, Stanley, Abbotsford, Wausau,<br />
Wittenberg, Shawano, Green Bay, Manitowoc, and Sheboygan. The service runs once in<br />
each direction daily, and allows for connections with Greyhound Lines from Eau Claire<br />
to Tomah and Madison, and from Green Bay to Appleton, Oshkosh, and Fond du Lac.<br />
The service is initially being funded by a federal grant through the Supplemental<br />
Transportation Rural Assistance Program (STRAP), received by the City of Stanley.<br />
120 Transportation Information
Private transit is offered by the St. Croix Casino in Turtle Lake from Bloomer, Chetek,<br />
Chippewa Falls, Eau Claire, Hudson, New Richmond, Rice Lake and Spooner to the<br />
casino. Service is generally offered Monday through Saturday, with Sunday service from<br />
some locations. Departure times vary by location with more frequent service from Eau<br />
Claire. The casino also provides a shuttle service from nearby Minnesota cities including<br />
Fridley, Maplewood and Stillwater. Shuttle service is also offered by the hotel and casino<br />
from the parking lot on the south side of US 8 to the casino and hotel entrance. The<br />
shuttle service is designed to provide safe and efficient access to the hotel and casino for<br />
patrons and employees.<br />
Bicycles<br />
The Wild Rivers Trail (WRT) is one of two designated off-road bicycle facilities in<br />
Barron County. The WRT is a multi-use trail on abandoned rail right-of-way that<br />
parallels US 53 from Rice Lake north to Superior. The trail currently is suited only for<br />
mountain biking, but future plans call for the trail to be paved between Rice Lake and<br />
Haugen to accommodate all bicyclists.<br />
The Cattail Trail runs 18 miles from the trailhead in Amery in Polk County, through<br />
forests, farmlands, prairies, hills, various wildlife habitats, and the Village of Turtle Lake,<br />
to Almena. The multi-use trail is popular for hiking, horseback riding, mountain-biking,<br />
all-terrain vehicle (ATV) use, and snowmobiling.<br />
The Tuscobia Trail is a State-owned trail that exists on a former rail bed. It is located<br />
three and a half miles north of Rice Lake and begins near US 53. The trail extends 76<br />
miles northeast to WIS 13 near Park Falls in Price County. This trail is used for hiking,<br />
horseback riding, and ATVs in the summer, and for snowmobiling in the winter. The trail<br />
is not groomed or surfaced for bicycles, but some mountain biking does occur.<br />
WisDOT has assessed the State and county highways based on their suitability for biking<br />
throughout Barron County (See Map 3.3). The assessment does not consider town roads.<br />
There are numerous county roads that are suitable for biking in Barron County (see Map<br />
3-_). Many of the county highways in particular are well-suited to biking.<br />
While town roads were not explicitly evaluated in WisDOT’s analysis, they are likely to<br />
provide a safe biking facility, as most rural roads have low traffic volumes and are well<br />
maintained. Map 3.4 portrays a number of bicycling routes using mainly paved town<br />
roads. These routes were developed by staff of the Barron County Soil and Water<br />
Conservation Department. The routes are not currently signed as bike routes, and some<br />
of them extend into neighboring counties.<br />
Pedestrian Facilities<br />
Pedestrian facilities exist, at varying levels, within incorporated communities of Barron<br />
County. The cities of Barron, Chetek and Cumberland, and the villages of Almena and<br />
Barron County Conditions and Trends Report 121
Turtle Lake have sidewalks in their commercial areas, with at least some connections into<br />
residential and school areas. With the exception of Almena, each of the communities has<br />
to address the need for pedestrians to safely cross state or county highways. In Barron,<br />
pedestrians frequently cross US 8 in the downtown area, particularly near The Turkey<br />
Store. Employee parking is located on the south side of US 8, while the manufacturing<br />
facility is located on the north side. Similarly in Turtle Lake, the casino is located on the<br />
north side of US 8, and parking for employees and patrons is on the south side of the<br />
highway as are most of the local homes. Barron has crosswalks and a traffic signal to aid<br />
in pedestrian crossing. Turtle Lake does not currently have these facilities.<br />
Downtown Chetek is bisected by County SS/2 nd Street. Shopping and housing is located<br />
on both sides of the highway and, during the summer, tourists are present in large<br />
numbers. Cumberland is similar to Chetek in that US 63 bisects the city, and tourists are<br />
prevalent in the summer. In both<br />
instances, safe facilities for crossing the<br />
respective highways are important.<br />
The cities of Chetek and Rice Lake<br />
completed Safe Routes to Schools plans<br />
in 2008, and received grants through the<br />
same federal program to begin<br />
implementing their respective plans<br />
through engineering, education, and<br />
enforcement improvements, primarily in<br />
the residential areas around elementary<br />
and middle schools. The Safe Routes to<br />
School (SRTS) program is funded<br />
federally and is aimed at making it safe<br />
for students to walk and bike to school<br />
and at encouraging them to do so.<br />
Path worn by students crossing railroad tracks in Chetek<br />
122 Transportation Information
Map 3.5 – Barron County Bicycling Conditions Assessment<br />
source: <strong>Wisconsin</strong> Department of Transportation. http://www.dot.wisconsin.gov/travel/bike-foot/countymaps.htm<br />
Barron County Conditions and Trends Report 123
Map 3.6 – Barron County Bike Routes<br />
source: Barron Co. Soil & Water Conservation Dept., www.co.barron.wi.us/forms/tourism-cyclingroutes.pdf, March,<br />
2008<br />
124 Transportation Information
Safety<br />
While traffic volumes have climbed significantly in Barron County over the past 10<br />
years, reported crashes are below 1998 levels, after peaking in 2003 (See Table 3.7, and<br />
Figure 3.1). Crashes involving injuries have declined, but fatalities have remained fairly<br />
constant over the time period shown. Reported crashes involving bicycles or pedestrians<br />
have declined, slightly, but the numbers are small and easily skewed. The data shown<br />
here includes crashes of all types on public roads, and does not include those occurring in<br />
parking lots or on private roads. The annual count of crashes has also declined for most<br />
municipalities in the County (See Table 3.8).<br />
Table 3.7 – Barron County Crash History (1998-2007)<br />
Data Item 1998 1999 2000 2001 2002 2003 2004 2005 2006 2007<br />
All Crashes 851 992 941 898 983 1007 956 856 691 715<br />
On State Hwys 265 336 278 273 302 267 312 281 183 198<br />
On County Hwys 277 307 271 274 313 305 293 244 212 243<br />
On Local Roads 309 349 392 351 368 435 351 331 296 274<br />
Total Injuries 579 529 487 485 605 521 511 437 366 376<br />
Total Fatalities 8 16 5 10 10 11 9 14 13 10<br />
Bicycle crashes 9 7 6 4 6 11 4 8 3 2<br />
Pedestrian crashes 7 7 4 8 9 2 4 5 5 6<br />
source: <strong>Wisconsin</strong> Traffic Operations and Safety Laboratory; WisTransPortal Crash Database; Crash Data Retrieval Facility,<br />
Version 1.1.3, July 16, 2008.<br />
Figure 3.1 - Barron County Crashes by Highway Type (1998-2007)<br />
500<br />
Total Crashes by Highway Type (1998-2007)<br />
400<br />
number of crashes<br />
300<br />
200<br />
On State Hwys<br />
On County Hwys<br />
On Local Roads<br />
100<br />
0<br />
1998 1999 2000 2001 2002 2003 2004 2005 2006 2007<br />
years<br />
source: <strong>Wisconsin</strong> Traffic Operations and Safety Laboratory; WisTransPortal Crash Database; Crash Data Retrieval Facility,<br />
Version 1.1.3, July 16, 2008.<br />
Barron County Conditions and Trends Report 125
Table 3.8 - Highway Crashes by Municipality<br />
Municipality 2003 2004 2005 2006 2007<br />
T. Almena 25 20 14 10 15<br />
T. Arland 6 8 6 13 2<br />
T. Barron 28 29 29 22 33<br />
T. Bear Lake 9 12 7 5 6<br />
T. Cedar Lake 9 10 12 4 3<br />
T. Chetek 22 12 19 11 11<br />
T. Clinton 26 22 15 14 18<br />
T. Crystal Lake 11 16 10 18 9<br />
T. Cumberland 12 13 13 8 15<br />
T. Dallas 8 18 2 12 10<br />
T. Dovre 26 39 23 16 26<br />
T. Doyle 8 7 10 4 8<br />
T. Lakeland 20 16 9 11 10<br />
T. Maple Grove 27 21 12 7 10<br />
T. Maple Plain 17 9 5 2 11<br />
T. Oak Grove 28 40 37 20 25<br />
T. Prairie Farm 7 8 7 5 8<br />
T. Prairie Lake 19 23 21 16 13<br />
T. Rice Lake 52 39 41 38 38<br />
T. Sioux Creek 12 13 15 10 11<br />
T. Stanfold 19 14 12 15 16<br />
T. Stanley 51 68 53 43 43<br />
T. Sumner 13 9 9 12 3<br />
T. Turtle Lake 14 6 4 1 5<br />
T. Vance Creek 5 5 6 3 5<br />
V. Almena 6 3 4 2 2<br />
V. Cameron 23 22 23 14 11<br />
V. Dallas 1 1 4 0 1<br />
V. Haugen 3 0 1 0 3<br />
V. New Auburn 0 0 0 0 0<br />
V. Prairie Farm 2 3 2 3 0<br />
V. Turtle Lake 21 12 27 11 14<br />
C. Barron 59 69 66 47 37<br />
C. Chetek 37 33 39 27 29<br />
C. Cumberland 58 42 45 29 27<br />
C. Rice Lake 324 291 254 238 237<br />
TOTALS 1008 953 856 691 715<br />
source: <strong>Wisconsin</strong> Traffic Operations and Safety Laboratory; WisTransPortal Crash Database;<br />
Crash Data Retrieval Facility, Version 1.1.3, July 16, 2008.<br />
126 Transportation Information
Commuting Patterns<br />
Residents of Barron County are employed in a wide array of locations, within their own<br />
community, elsewhere in the County, in other <strong>Wisconsin</strong> and Minnesota counties (See<br />
Table 3.9). Of the 22,202 employed residents reported, 33.87 percent work in the city,<br />
village, or town in which they reside. This would include those that work at home, and<br />
most of those working family farms. Just over fifty-two percent of workers reported that<br />
they work in a Barron County community other than the one in which they reside. Those<br />
working in other <strong>Wisconsin</strong> counties include 11.63 percent of employed Barron County<br />
residents, and just less than 2 percent work in Minnesota.<br />
Railroads<br />
Rail service is an important component of the local economic market. Many industries<br />
prefer to have direct access to rail service. Rail lines in Barron County are owned by two<br />
railroads - Union Pacific and Canadian National. The Union Pacific line parallels US<br />
53 and runs from Chetek south where it connects with an east/west rail line near Eau<br />
Claire. Canadian National operates a north/south line between Chetek and Rice Lake and<br />
an east-west line that parallels US 8 between Barron and Ladysmith in Rusk County (See<br />
Map 3.7). The two east/west and north/south lines intersect in Cameron. Both rail lines<br />
can be classified as minor branches that service local industry, and are operated by<br />
Progressive Rail, Inc.<br />
There is a local initiative between Barron and Chippewa counties, the <strong>Wisconsin</strong> <strong>West</strong><br />
Rail Transit Authority (WWRTA) which is working to purchase both the Union Pacific<br />
and Canadian National lines. The purchase from Canadian National is expected to be<br />
finalized in the summer of 2009. Discussions are underway with Union Pacific<br />
concerning the purchase of the line between Chippewa Falls and Chetek, but results are<br />
expected to be longer in coming. Keeping these rail lines in service will ensure that<br />
future economic development opportunities will not be precluded.<br />
Barron County Conditions and Trends Report 127
128 Transportation Information<br />
Table 3.8 3.9 - Commuting Patterns of Barron County Residents by Municipality<br />
Cities Villages Towns<br />
Barron<br />
Chetek<br />
Cumberland<br />
Rice Lake<br />
Almena<br />
Cameron<br />
Dallas<br />
Haugen<br />
New Auburn<br />
Prairie Farm<br />
Turtle Lake<br />
Almena<br />
Arland<br />
Barron<br />
Bear Lake<br />
Cedar Lake<br />
Community of<br />
Work Trip Origin<br />
Destination w/in<br />
origin community 941 362 581 2875 71 103 12 10 75 161 115 93 110 58 56 169 150 66 99 87 77 54 74 114 40 102 79 77 256 84 97 101 25 81 66 7521<br />
Destination outside<br />
community; w/in<br />
Barron County 510 393 361 842 203 597 103 101 3 100 172 248 215 418 228 312 452 280 239 305 135 144 189 303 345 320 312 137 464 1275 244 230 954 256 108 73 11571<br />
Ashland 2 2 4<br />
Brown 2 2 4<br />
Burnett 3 2 4 3 13 3 2 4 2 36<br />
Chippewa 4 57 59 20 3 6 2 2 2 45 4 4 9 56 1 2 9 3 23 29 26 16 2 384<br />
Clark 2 3 5<br />
Dane 2 3 2 7<br />
Douglas 8 4 4 5 21<br />
Dunn 13 14 9 12 15 2 30 3 10 2 2 14 2 4 45 12 2 10 44 14 3 11 12 18 3 10 8 324<br />
Eau Claire 9 39 47 2 4 12 6 2 5 4 10 41 3 39 1 8 10 3 4 7 17 21 9 27 4 334<br />
Fond du Lac 3 3<br />
Green Lake 2 2<br />
Jackson 4 2 3 3 4 16<br />
Juneau 2 2<br />
La Crosse 11 10 2 23<br />
Lincoln 3 3 6<br />
Marathon 2 2 4<br />
Denstinations in<br />
other <strong>Wisconsin</strong><br />
counties<br />
Chetek<br />
Clinton<br />
Monroe 2 2<br />
Oneida 2 2<br />
Pepin 2 2 4<br />
Pierce 1 4 5<br />
Polk 26 2 28 52 22 3 1 2 15 78 56 19 3 4 13 8 19 16 19 11 5 15 14 11 4 21 8 35 4 4 72 75 665<br />
Portage 2 1 3<br />
Price 23 1 4 28<br />
Richland 2 2<br />
Rock 2 2 4<br />
Rusk 3 13 13 13 2 5 3 10 1 1 7 2 2 2 9 2 2 14 9 113<br />
St. Croix 12 2 2 6 8 3 5 4 7 2 13 4 2 2 2 2 2 7 58 143<br />
Sauk 2 2<br />
Sawyer 6 2 5 2 2 2 4 4 27<br />
Taylor 3 3 4 2 12<br />
Trempealeau 4 4<br />
Walworth 2 2<br />
Washburn 8 3 31 55 3 7 9 2 2 8 3 13 50 5 3 2 15 3 9 49 8 21 17 2 2 30 8 2 370<br />
Waushara 2 2<br />
Winnebago 10 2 12<br />
Wood 2 2 2 6<br />
Anoka 4 10 2 2 4 22<br />
Chisago 6 2 2 7 2 19<br />
Dakota 12 1 2 4 2 21<br />
Faribault 2 2<br />
Freeborn 3 3<br />
Hennepin 5 13 3 4 2 5 15 2 7 2 3 5 3 2 11 7 5 7 2 2 6 17 128<br />
Kandiyohi 2 2 4<br />
Mille Lacs 2 2<br />
Destinations in<br />
Minnesota counties Olmsted 3 2 3 8<br />
Polk 3 3<br />
Ramsey 8 3 8 4 3 7 5 19 2 3 4 7 3 7 6 5 2 2 2 8 11 119<br />
Renville 2 2<br />
Scott 3 3<br />
Sherburne 3 3 6<br />
St. Louis 2 2 2 2 2 10<br />
Washington 2 5 6 8 9 4 2 3 2 5 2 7 3 18 11 87<br />
Other 2 10 4 2 2 2 1 14 2 2 3 2 3 2 2 3 2 18 2 6 4 88<br />
Total by home<br />
community 1547 902 1038 4048 319 768 154 133 9 262 445 479 354 567 310 481 794 470 368 461 297 349 265 479 523 417 457 313 635 1666 382 345 1191 324 318 332<br />
source: U.S. Bureau of the Census, Census Transportation <strong>Planning</strong> Package, 2000.<br />
Crystal Lake<br />
Cumberland<br />
Dallas<br />
Dovre<br />
Doyle<br />
Lakeland<br />
Maple Grove<br />
Maple Plain<br />
Oak Grove<br />
Prairie Farm<br />
Prairie Lake<br />
Rice Lake<br />
Sioux Creek<br />
Stanfold<br />
Stanley<br />
Sumner<br />
Turtle Lake<br />
Vance Creek<br />
Total by<br />
workplace
Map 3.7 - Railroad Ownership in <strong>West</strong> <strong>Central</strong> <strong>Wisconsin</strong><br />
Intermodal Facilities<br />
source: excerpted from “<strong>Wisconsin</strong> Railroads-2006” map, Bureau of <strong>Planning</strong>, WisDOT, (January, 2006); and <strong>Wisconsin</strong> Rail Issues and<br />
Opportunities Report, WisDOT, 2004.<br />
Barron County Conditions and Trends Report 129
Air Transportation<br />
Barron County is served by four public airport facilities located near the cities of Rice<br />
Lake, Barron, Chetek and Cumberland. WisDOT classifies the airports according to the<br />
type of aircraft they are capable of accommodating.<br />
The Rice Lake Airport is classified as a Transport/Corporate (T/C) airport because of its<br />
ability to serve corporate, small passenger and cargo jet aircraft used in regional service,<br />
and small airplanes used in commuter air service. The primary runway length of a T/C<br />
airport is between 4,800 and 6,800 feet to accommodate aircraft with a gross takeoff<br />
weight of less than 60,000 pounds, approach speeds below 141 knots, and wingspans of<br />
less than 118 feet.<br />
The Barron Airport is classified as a Basic Utility-A (BU-A) airport because of its ability<br />
to serve all small single-engine piston aircraft and many of the smaller twin-engine piston<br />
aircraft typically seating two to six people. This type of aircraft is typically used for<br />
business, charter and recreational flying. The primary runway length of a BU-A airport is<br />
between 2,800 and 3,900 feet to accommodate aircraft of less than 6,000 pounds gross<br />
weight, approach speeds of less than 91 knots, and wingspans less than 49 feet.<br />
The Chetek and Cumberland airports are both classified as Basic Utility-B (BU-B)<br />
airports because of their ability to serve slightly larger aircraft than a BU-A facility.<br />
These airports normally have a runway length similar to BU-A facilities but they are<br />
designed to accommodate aircraft of less than 12,500 pounds gross weight with approach<br />
speeds of less than 121 knots and wingspans of less than 49 feet.<br />
Table 3.10 - Major Airport Improvement Projects<br />
Construction<br />
Airport<br />
Year Scheduled Improvements<br />
2008<br />
Pave internal roads and hangar taxiways;<br />
construct parking lot; install runway lights<br />
Barron Municipal Airport<br />
2010 Land acquisition for north/south runway<br />
2011 Construct north/south turf runway<br />
2012 Construct terminal building<br />
Chetek Municipal - Southworth Airport 2009 Expand terminal apron<br />
2009 Purchase & install AWOS<br />
Cumberland Municipal Airport<br />
2010 Enlarge maintenance shop<br />
2012 Construct taxiway to Rwy 9/27<br />
2008 Expand terminal building-phase II<br />
2009<br />
Expand parking lot; install sewer & waterphase<br />
I<br />
Rice Lake <strong>Regional</strong> Airport - Carl's Field 2010 Construct helipad<br />
2011<br />
Install HIRLS on primary runway;<br />
reconstruct Rwy 13/31<br />
2012 Develop Southeast Hangar Area<br />
source: 5-Year Airport Improvement Program, WisDOT Bureau of Aeronautics, (February, 2008).<br />
130 Transportation Information
WisDOT’s Five-Year Airport Improvement Program documents airport improvement<br />
projects scheduled to be completed between 2008 and 2012. There are a number of<br />
improvements scheduled for Barron County airports (See Table 3.10).<br />
Water Transportation<br />
There is no significant passenger or freight water transportation in Barron County. The<br />
nearest commercial port is in Duluth-Superior on Lake Superior located approximately<br />
90 miles north. The only notable ferry service in the County is privately operated and<br />
services visitors to Stout’s Island Lodge on the Island of Happy Days on Red Cedar Lake.<br />
Other local water transportation is primarily recreational in nature (e.g., canoeing,<br />
fishing, water-skiing) occurring throughout the County on its many rivers and lakes.<br />
Relevant Transportation Plans<br />
Since transportation systems are most often multi-jurisdictional in nature, it is important<br />
to consider existing State and local plans during local planning efforts. The sub-section<br />
reviews some of the most pertinent of these State and local transportation plans.<br />
Together, these documents provide the following general overarching goals that guide the<br />
development and maintenance of the transportation system in Barron County:<br />
• WisDOT Five-year Airport Improvement Program: Maintain existing facilities of<br />
the State’s airport system.<br />
• WisDOT Five-year Airport Improvement Program: Expand facilities to meet the<br />
needs of commercial passenger and cargo airlines serving <strong>Wisconsin</strong>.<br />
• CTH “SS” Analysis and Proposed Highway Corridor Plan: Maintain the trafficcarrying<br />
capacity and safety and provide for orderly growth and development.<br />
• <strong>Wisconsin</strong> Bicycle Transportation Plan 2020: Increase levels of bicycling<br />
throughout <strong>Wisconsin</strong> doubling the number of trips made by bicycles by the year<br />
2010.<br />
• <strong>Wisconsin</strong> Bicycle Transportation Plan 2020: Reduce crash involving bicyclists<br />
and motor vehicles by at least 10 percent by the year 2010.<br />
• Barron County Land Use Plan: Continue to provide safe, efficient, and adequate<br />
public facilities and services to meet the needs of residents and businesses.<br />
Statewide Transportation Plans<br />
State and federal plans addressing transportation are discussed in Addendum: Inventory of<br />
Existing Plans, Programs, & Land Use Policies in <strong>West</strong> <strong>Central</strong> <strong>Wisconsin</strong>.<br />
Barron County Conditions and Trends Report 131
Barron County Transportation Plans<br />
Barron County Land Use Plan<br />
The Barron County LandUse Plan adopted in May 2001 included a review of Barron<br />
County’s transportation infrastructure and identified the following goals and policies<br />
related to transportation planning:<br />
Goal:<br />
• Continue to provide safe, efficient, and adequate public facilities and services to<br />
meet the needs of residents and businesses.<br />
Policies:<br />
• Maintain the existing transportation network in order to meet the needs of residents<br />
and businesses.<br />
• Establish policies and procedures the require new development to incur the costs<br />
of infrastructure improvements.<br />
• Support improvements to the county, state, and national highway system that<br />
enhance safety and efficiency.<br />
CTH “SS” Analysis and Proposed Highway Corridor Plan<br />
This analysis and plan was prepared in 1995 in response to development occurring<br />
between the City of Rice Lake and the Village of Cameron. The plan proposes<br />
alternative access controls and driveway entrances which will provide needed access<br />
while helping to maintain a safe, efficient roadway and orderly growth.<br />
Overarching Transportation Goals of Individual Plans<br />
The 2005 Barron Area Multi-Jurisdictional Comprehensive Plan Existing Condition<br />
Report suggested the following general transportation planning goals:<br />
• Provide a transportation system that is integrated with county land use and<br />
development plans, preserves historical resources, and conserves and enhances<br />
the natural environment.<br />
• Provide a transportation system for the efficient and effective movement of<br />
people and goods in Barron County.<br />
• Develop a balanced and appropriately connected network of roads based on<br />
functional classification where arterials provide mobility, collectors provide a mix<br />
of mobility and access, and local roads provide access.<br />
• Update local zoning and subdivision ordinances to be consistent with other plan<br />
strategies and recommendations.<br />
• Develop official maps for future transportation corridors to minimize social and<br />
environmental costs.<br />
• Implement access management strategies on existing roads.<br />
132 Transportation Information
• Provide sufficient capacity in the transportation system to accommodate existing<br />
and future travel demands.<br />
• Require major developments to cover their “fair share” of transportation<br />
improvements.<br />
• Undertake improvements that enhance the safety and operational characteristics<br />
of the transportation system.<br />
• Promote transportation alternatives in the form of transit, bicycle, and pedestrian<br />
facilities and services for persons who cannot, or choose not to, use automobiles.<br />
Summary<br />
Overall Barron County’s highway system is well-developed and maintained, and serves<br />
automobile users particularly well; however, the availability of other modes of<br />
transportation such as transit, bicycle and pedestrian facilities may not be meeting needs<br />
as more people use these modes out of necessity, environmental concerns, convenience,<br />
or for health reasons. Key to the future of transportation in and around Barron County<br />
over the next several decades are the aging of the population, the rising cost of operating<br />
a vehicle, and changing technology.<br />
The following summarizes the existing conditions and trends of transportation in Barron<br />
County:<br />
• There are slightly fewer than 2,000 miles of public road in Barron County, under<br />
the jurisdiction of the State of <strong>Wisconsin</strong>, Barron County, or local governments.<br />
• Traffic volumes in Barron County have increased, on average, approximately 17<br />
percent from 1992 to 2003, according to WisDOT counting program.<br />
• WisDOT’s six year highway plan includes between $16,000,000 and $20,000,000<br />
in projects within Barron County (See Table 3.4).<br />
• The preferred alternative in the adopted Environmental Impact Study for WIS 8<br />
(October, 2007) includes a bypass of the City of Barron, to the south, but a<br />
preferred alternative for the Village of Turtle Lake has not yet been chosen.<br />
• The preferred alternative for USH 53/County V intersection include an overpass<br />
at 26 th Avenue and 30 th Avenue, an interchange at County V, and closures of 26 th<br />
Avenue, County SS, and 29¾ Avenue. The interchange at County V and the<br />
closure of 27 th Avenue and County SS are tentatively scheduled for 2011 or 2012.<br />
The overpasses at 26 th and 30 th avenues are not currently scheduled for<br />
construction.<br />
• There are 317 bridges in Barron County, fourteen of which (4.4 percent) are<br />
classified as either functionally obsolete or structurally deficient. This does not<br />
mean that they are unsafe for travel.<br />
Barron County Conditions and Trends Report 133
• Rice Lake City Cab system provides door-to-door service for trips with origins<br />
and destinations within the City, Monday through Saturday, 6:00 a.m. to 6:00<br />
p.m. The service utilizes sedans, vans, and buses, and complies with Americans<br />
with Disabilities (ADA) requirements.<br />
• The Barron County Office on Aging provides fixed route service to adult day care<br />
several days a week, monthly trips from Chetek, Barron, Cumberland and Turtle<br />
Lake, into Rice Lake, and a demand response service for elderly and persons with<br />
disabilities, on weekdays, from 10:00 a.m. to 2:00 p.m.<br />
• The Barron County Health and Human Services Department provides fixed route<br />
services to their clients, primarily to sheltered employment and training locations.<br />
• Barron County is considering enter into a coordinated rural transportation effort<br />
with five other counties (Chippewa, Eau Claire, Dunn, St. Croix, and Pierce).<br />
• Barron County has a good network of multi-use trails, but most are not<br />
recommended for bicycle use.<br />
• Several cities and villages in Barron County recognize a deficiency in pedestrian<br />
facilities. Rice Lake and Chetek have completed Safe Routes to School plans and<br />
are subsequently implementing the recommendations of those plans.<br />
• Just over one-third of employed persons in Barron County work in the same town,<br />
village, or city where they live; Fifty-two percent work in a different Barron<br />
County community; twelve percent work in another <strong>Wisconsin</strong> county; and two<br />
percent in Minnesota.<br />
• Efforts are underway to acquire some of the rail lines in Barron County, for<br />
operation by Progressive Rail, to ensure future viability in the region.<br />
• Barron County has four public airports – Barron, Chetek, and Cumberland<br />
municipal airports and Rice Lake <strong>Regional</strong> Airport – all of which are programmed<br />
for a number of maintenance and expansion projects over the next five years (See<br />
Table 3.10).<br />
134 Transportation Information
4. UTILITIES AND COMMUNITY FACILITIES<br />
INFORMATION<br />
Element Context<br />
Utilities and community facilities provide the<br />
foundation on which a community is built and<br />
maintained. Utilities include sanitary sewer,<br />
storm sewer and water systems, and<br />
electricity, natural gas, telecommunications,<br />
and solid waste disposal systems. Community<br />
facilities include parks, schools, health and<br />
safety services, and libraries, among other<br />
things. Utilities and community facilities<br />
contribute to the quality of life in Barron<br />
County and affect the community’s ability to<br />
attract and retain residents, visitors, businesses, and industries.<br />
Barron County Justice Center<br />
The State of <strong>Wisconsin</strong> Comprehensive <strong>Planning</strong> Law (§66.1001) requires that<br />
comprehensive plans include a “compilation of objectives, policies, goals, maps and<br />
programs to guide the future development of utilities and community facilities in the<br />
local governmental unit”. This section of the Barron County Conditions and Trends<br />
Report provides an inventory of many of the utilities and community facilities in the<br />
County which are typically included in comprehensive plans.<br />
Since the availability, condition, and capacity of utilities and community facilities often<br />
change frequently, and since much of this information is only available at a local level,<br />
this inventory may need to be further supplemented during County and local planning<br />
efforts. For example, information not included here which may be needed during the<br />
development of local plans includes:<br />
condition and availability of public structures or major equipment (e.g., town<br />
halls, fleet vehicles, heavy equipment)<br />
service areas and capacity of utilities and treatment systems (e.g., sewer, water,<br />
stormwater, natural gas, fiber optic)<br />
condition, capacity, and location of parks and libraries<br />
analysis of capacity of existing facilities (e.g., child care, schools, elderly<br />
services) compared to current and projected population<br />
Such supplemental information may be needed more frequently in incorporated<br />
communities and urban areas, while this inventory should provide the bulk of the<br />
community facility and utility information needed for rural towns where public utilities<br />
and facilities are more limited.<br />
Barron County Conditions and Trends Report 135
Inventory of Utilities<br />
While this subsection provides a basic inventory of utilities, a more detailed discussion of<br />
related issues, needs, and policies related to the provision of utilities within a community<br />
can be found in the utilities and community facilities element of each individual<br />
community’s comprehensive plan.<br />
Sanitary Sewer and Wastewater Treatment<br />
Several major federal laws have been enacted over the past 100 years to protect our<br />
nation’s waters, and each of these laws imposed subsequently greater restrictions upon<br />
the discharge of pollution into lakes, rivers, and streams. With the passage of the 1972<br />
Clean Water Act, all discharges of pollution required a permit, the use of best<br />
management practices was encouraged, and billions of dollars were provided to construct<br />
sewage treatment plants.<br />
Ten Barron County communities have collection and treatment facilities for the proper<br />
treatment of wastewater, with the City of Barron and Village of Cameron sharing a single<br />
treatment facility (see Table 4.1). In addition, there are two sanitary districts located in<br />
the Towns of Crystal Lake and Lakeland.<br />
Table 4.1—Municipal Wastewater Systems in Barron County<br />
Municipality/District<br />
Crystal Lake Sanitary District<br />
Lakeland Sanitary District #1<br />
Village of Almena<br />
Village of Dallas<br />
Village of Haugen<br />
Village of Prairie Farm<br />
Village of Turtle Lake<br />
City of Barron/Village of Cameron<br />
City of Chetek<br />
City of Cumberland<br />
City of Rice Lake<br />
L.E. Phillips Scout Reservation<br />
source: <strong>Wisconsin</strong> Department of Natural Resources<br />
Monthly<br />
Design Flow<br />
(GPD)<br />
Monthly<br />
Average Flow<br />
(GPD)<br />
Construction<br />
Year<br />
This data is currently not available via the <strong>Wisconsin</strong> DNR database.<br />
For more information, please contact the community’s public works<br />
department or engineering firm.<br />
No municipalities in Barron County are required to engage in sewer service area planning<br />
as part of area-wide water quality management planning.<br />
136 Utilities and Community Facilities Information
On-Site Septic Systems<br />
Nearly all development in Barron County that is not located in a city or village uses<br />
private on-site sewer systems. These systems can be divided into three basic types, with<br />
pretreatment increasing in use:<br />
Figure 4.1 – Typical Septic System<br />
source: U.S. Environmental Protection Agency.<br />
Homeowner’s Guide to Septic Systems, rev. March 2005.<br />
In-Ground Gravity Systems –<br />
Most systems in Barron County<br />
include a gravity flow design<br />
where waste flows from the home<br />
to the septic tank and from the<br />
septic tank into a soil absorption<br />
field (see Figure 4.1). The<br />
wastewater is purified as it moves<br />
down through the soil and into the<br />
groundwater.<br />
Pressurized Systems – Typically,<br />
pressurized systems can either be a<br />
mound, at-grade, or in-ground.<br />
These systems either add a lift<br />
pump to pump the storage chamber<br />
or incorporate a mound absorption<br />
area to increase soil depth for<br />
purification purposes.<br />
For all conventional systems, a soil depth of at least three feet is needed to adequately<br />
purify the wastewater before it discharges into the groundwater. As noted in Chapter 5,<br />
much of the naturally occurring soil in Barron County is unsuitable for proper operation<br />
of in-ground gravity or pressurized on-site sewer systems; therefore, when new systems<br />
are constructed, it is common for soil to be imported to the site to help ensure that the<br />
new system operates properly.<br />
Holding Tank Systems – Many areas and lots in Barron County lack the required soil<br />
depth or drain field area requirements for conventional septic systems. As a result,<br />
residents may use a holding tank to dispose of their wastewater. A holding tank is an<br />
underground storage unit with no outlet into the soil. The contents of the tank must be<br />
pumped regularly and transferred to a proper disposal facility. This type of waster<br />
disposal system is particularly prevalent in lakefront development areas where lot sizes<br />
prohibit full septic systems.<br />
Pretreatment systems have been gaining in popularity for difficult sites or poor soils, or<br />
when an existing private septic system is failing on a small lot. Larger commercial<br />
operations in areas without municipal sewer may also be required to pre-treat wastewater.<br />
Barron County Conditions and Trends Report 137
These systems reduce the high levels of organic matter through aeration by treating<br />
wastewater in conjunction with a standard gravity or pressurized system.<br />
The <strong>Wisconsin</strong> Department of Commerce (COMM) regulates the siting, design,<br />
installation and inspection of most private on-site sewage systems in the State. In 2000,<br />
the State adopted a revised private system policy called COMM 83. The revised policy<br />
allows for conventional sewage systems and advanced pre-treatment sewage systems.<br />
There are several types of on-site disposal system designs authorized for use today:<br />
conventional (underground), mound, pressure distribution, at-grade holding tank, and<br />
sand filter systems. Sanitary permits are required under state law. To obtain a permit,<br />
one must contact a <strong>Wisconsin</strong>-licensed master plumber who will complete the necessary<br />
forms and obtain the sanitary permit. The plumber is also responsible for installing the<br />
private sewage system.<br />
Under COMM 83, <strong>Wisconsin</strong> counties can further regulate private on-site waste disposal<br />
systems through a sanitary code. Barron County has adopted the Barron County Sanitary<br />
Ordinance which is enforced through the County Zoning Office. The Zoning Office will<br />
review and file soil tests, issue State and County sanitary permits, and inspect the system<br />
during installation. The <strong>Wisconsin</strong> Fund administered by the <strong>Wisconsin</strong> Department of<br />
Commerce provides funding assistance to eligible landowners for the replacement or<br />
rehabilitation of failing private on-site wastewater treatment systems.<br />
Water Supply<br />
In the 1974 Safe Drinking Water Act, Congress mandated that safe drinking water be<br />
provided to and paid for by the consumer. Today, <strong>Wisconsin</strong> water providers must<br />
provide an abundant water supply to their customers that is not only safe, but also free of<br />
objectionable taste and odor, turbidity, and staining elements. While the amount of water<br />
treatment varies from community to community, water is typically treated for corrosion<br />
control, disinfection, and fluoridation prior to consumption.<br />
Barron County communities receive their water from<br />
groundwater sources. Groundwater sources in the area<br />
include drilled wells, dug wells, and screened wells with and<br />
without gravel packs. Drilled wells are typically the deepest<br />
wells and access large aquifers that are lower than the<br />
aquifers tapped for shallow private wells. Dug wells are<br />
considered the least desirable type, as they lack the 60-foot<br />
casing and cement grout now required of newly constructed<br />
wells to prevent contamination. Most dug wells in the area<br />
have been replaced.<br />
Storage facilities are classified as pressure tanks, ground<br />
reservoirs, or elevated storage tanks. The majority of public<br />
water storage facilities in the area are elevated storage<br />
Village of Almena Water Tower<br />
138 Utilities and Community Facilities Information
facilities such as water towers. The capacity of the elevated storage facilities is a critical<br />
component of providing adequate fire protection via fire hydrants and related facilities.<br />
Table 4.2 shows the active municipal and community water supply systems in Barron<br />
County.<br />
Table 4.2 – Municipal and Community Water Systems in Barron County<br />
System Name/Owner<br />
Location<br />
Approx.<br />
Population # of Wells<br />
Served<br />
Almena Waterworks Village of Almena 765 2<br />
Cameron Waterworks Village of Cameron 1,573 2<br />
Dallas Waterworks Village of Dallas 477 2<br />
Haugen Waterworks Village of Haugen 251 1<br />
Turtle Lake Waterworks Village of Turtle Lake 1,065 2<br />
Barron Light & Water Department City of Barron 3,319 5<br />
Chetek Waterworks City of Chetek 1,931 2<br />
Cumberland Waterworks City of Cumberland 1,983 5<br />
Rice Lake Waterworks City of Rice Lake 8,300 5<br />
Andersons Trailer Court 2183 18 ½ Avenue Rice Lake 95 1<br />
Canoe Villa Trailer Court 1898 12 ½ Ave. Cameron 70 1<br />
Country View Mobile Home Court 1863 Highway 63 Comstock 54 1<br />
Nordquist Mobile Home Park 480 Hepburn Prairie Farm 14 1<br />
Pioneer Nursing Home Prairie Farm 44 1<br />
Prairie Lake Estate Mobile Home Park 1781 18 th Street Barron 40 1<br />
Red Cedar Valley Estates Mobile Home Park 1971 16 ½ Ave. Cameron 40 1<br />
source: <strong>Wisconsin</strong> Department of Natural Resources. Drinking Water System database as of 7/30/08<br />
The Village of Prairie Farm is the only incorporated area without a municipal water<br />
system. Of the seven non-municipal water systems, six provide water services to trailer<br />
courts.<br />
With the exception of the population served by public systems identified in Table 4.2, the<br />
far majority of remaining Barron County residents depend on individual private wells for<br />
their water supply needs. These wells draw water from the upper aquifer, which can be<br />
more susceptible to contamination.<br />
Stormwater Management<br />
Stormwater management is important in order to reduce or prevent soil erosion, mitigate<br />
flooding, and limit run-off of pollutants, nutrients, and sediment to water bodies.<br />
Communities approach stormwater management in a wide variety of ways and solutions<br />
are often site specific.<br />
Barron County Conditions and Trends Report 139
For most of Barron County, as well as for most rural areas in the State, stormwater<br />
facilities are limited to ditches along roadways, combined with culverts under roads and<br />
drives. Many farmers also use drainage<br />
tile in their fields to drain stormwater in<br />
low areas. More developed areas,<br />
villages, and cities have a varying range<br />
of ditches, storm water retention areas,<br />
curb and gutter, and storm sewer. Most<br />
systems in both urban and rural settings<br />
use a combination of engineered<br />
stormwater solutions and natural<br />
approaches which take advantage of<br />
existing swales, creeks, ponds, or other<br />
potential storage areas.<br />
Stormwater drain in the City of Barron<br />
Currently, municipalities in Censusdefined<br />
urbanized areas and<br />
municipalities with more than 10,000 population are required by State and Federal law 1<br />
to develop a stormwater program with measurable goals, required permitting, and<br />
educational efforts for municipal-owned stormwater conveyances which discharge to<br />
public waters. <strong>West</strong> central <strong>Wisconsin</strong> includes only one urbanized area (consisting of<br />
fifteen municipalities total) in the Eau Claire/Chippewa Falls area. Outside of this<br />
urbanized area, only the cities of Hudson and Menomonie exceed the 10,000 population<br />
threshold in our region. In Barron County, only the City of Rice Lake, with a 2007<br />
estimated population of 8,653, is approaching this threshold.<br />
State law also requires landowners to develop an erosion control plan and obtain<br />
necessary <strong>Wisconsin</strong> DNR erosion control and stormwater discharge permits for all<br />
construction sites where one or more acres of land will be disturbed. The exceptions to<br />
this are for public buildings and <strong>Wisconsin</strong> DOT projects which have special regulations.<br />
The lack of a Federal or State mandate does not limit a municipality’s ability to plan for<br />
or regulate stormwater. The Barron County subdivision regulations cover all<br />
unincorporated areas of the County and include a site plan review process by the Land<br />
Records Director and County Surveyor, working in conjunction with the Department of<br />
Land & Water Resources. The 1996 ordinance update increased attention to stormwater<br />
issues, and the County may require the applicant to submit stormwater management and<br />
erosion control plans based upon accepted State of <strong>Wisconsin</strong> guidelines. Drainageway<br />
easements may be required to accommodate anticipated stormwater discharge from the<br />
development.<br />
1 Rules applicable to stormwater management can be found in the Federal Clean Water Act and Chapter<br />
NR 216, Wis. Admin. Code and are regulated through the EPA’s National Pollutant Discharge Elimination<br />
System (NPDES) and permitted under the <strong>Wisconsin</strong> Pollutant Discharge Elimination System (WPDES).<br />
More information can be found at: http://www.dnr.state.wi.us/runoff/stormwater.htm.<br />
140 Utilities and Community Facilities Information
Incorporated municipalities may create a stormwater utility that is responsible for<br />
maintaining and managing the surface water management system. Stormwater utilities<br />
have the ability to charge fees to generate revenue to support these activities. A<br />
stormwater management plan describes community-wide surface water management<br />
needs. This local tool is useful in determining actions to improve surface water quality<br />
and stormwater detention storage needs. Stormwater detention facilities are typically<br />
ponds that collect storm water and help prevent damage caused by large rainfalls and<br />
small-scale flooding. As of 2005, no Barron County community had adopted a formal<br />
stormwater management plan or utility, though a number of cities were considering such.<br />
Instead, stormwater planning is typically approached similarly to, or in concert with, road<br />
or street projects, capital budgeting, or as part of development proposals on a project-byproject<br />
basis.<br />
State funding for local governments is available to address land management activities<br />
which contribute to urban and rural runoff in priority watershed areas. Much of the<br />
western half of Barron County falls within the priority watershed areas of the Yellow<br />
River, Hay River, and South Fork of the Hay River.<br />
Stormwater flooding has been an increasing concern in Barron County. The Barron<br />
County Natural Hazards Mitigation Plan identifies stormwater flooding issues and<br />
“hotspots” for the County and each municipality which participated in the plan. The<br />
recommendations of this plan may be useful for local comprehensive planning efforts.<br />
Telecommunications Facilities<br />
In broad terms, telecommunications facilities allow users to communicate and share data<br />
over long geographic distances. Telecommunications facilities and networks are critical<br />
components to public safety, economic development, and quality of life. Inventorying<br />
telecommunications facilities is difficult given the quickly changing nature of<br />
technology, ever-expanding service areas, and the<br />
multitude of providers in a deregulated market. Further,<br />
detailed service area maps for all telecommunication<br />
options are not available. Communities may need to<br />
identify their specific telecommunications issues and<br />
goals, prior to obtaining specific information and maps<br />
from their local telecommunications providers.<br />
Cell Tower, Town of Almena<br />
With the adoption of the 1996 Federal<br />
Telecommunications Act regulating wireless<br />
communications providers, local government action on<br />
telecommunications has commonly focused on wireless<br />
communications towers. Access to wireless, seamless<br />
communication networks is becoming increasingly<br />
important in the modern world. Due to the increase in<br />
use of wireless communication for public safety,<br />
Barron County Conditions and Trends Report 141
usiness, and personal use, constructing telecommunication towers is an issue that many<br />
municipalities are addressing more often than in the past. Barron County and some<br />
municipalities have adopted ordinances regulating the citing and placement of cell<br />
towers.<br />
Several companies provide telephone, wireless, and Internet services in Barron County.<br />
Wireless coverage is provided by AT&T Wireless, CellularOne, and others. Similarly,<br />
Internet service providers include Charter Communications, McLeodUSA, Farmers<br />
Independent Telephone Company, and DCS Netlink. Table 4.3 shows the telephone<br />
providers for Barron County municipalities, some of which offer other<br />
telecommunications services, such as cable and Internet access.<br />
Much, if not most, of Barron County has access to broadband (high-speed) Internet via<br />
telephone or cable lines, though some larger gaps exist in the northern half of the County.<br />
As an alternative, some of these areas may have broadband access via other means (e.g.,<br />
satellite).<br />
Due to its high bandwidth and low data loss, fiber optic is preferred, if not required, for<br />
many technology businesses and information services. Fiber optic communicates by<br />
sending light through optical fiber as opposed to traditional electrical transmission by<br />
copper wire. Fiber optic does come with a higher price tag however, and is more difficult<br />
to splice into. For many communities, providing fiber optic service to their industrial or<br />
business park(s) is a priority. The economic development section of the Addendum:<br />
Inventory of Programs, Plans, and Land Use Policies in <strong>West</strong> <strong>Central</strong> <strong>Wisconsin</strong><br />
compiled by WCWRPC as part of the regional comprehensive planning effort includes a<br />
table of the industrial parks in Barron County and whether fiber optic is available.<br />
142 Utilities and Community Facilities Information
Table 4.3 – Telephone Providers in Barron County<br />
Municipality<br />
Amery Telcom Inc<br />
CenturyTel of the Midwest, LLC<br />
T ALMENA X X<br />
T ARLAND X X X X<br />
T <strong>BARRON</strong> X X X<br />
T BEAR LAKE X X X X<br />
T CEDAR LAKE X X X<br />
T CHETEK X X X X<br />
T CLINTON X X X X<br />
T CRYSTAL LAKE X X X X<br />
T CUMBERLAND X X X X X<br />
T DALLAS X X<br />
T DOVRE X X X X<br />
T DOYLE X X X X<br />
T LAKELAND X X<br />
T MAPLE GROVE X X X<br />
T MAPLE PLAIN X X<br />
T OAK GROVE X X<br />
T PRAIRIE FARM<br />
X<br />
T PRAIRIE LAKE X X X X X<br />
T RICE LAKE X X<br />
T SIOUX CREEK X X X X<br />
T STANFOLD X X X<br />
T STANLEY X X X<br />
T SUMNER X X X X<br />
T TURTLE LAKE X X X X<br />
T VANCE CREEK X X X<br />
V ALMENA<br />
X<br />
V CAMERON X X<br />
V DALLAS<br />
X<br />
V HAUGEN X X<br />
V NEW AUBURN X X<br />
V PRAIRIE FARM<br />
X<br />
V TURTLE LAKE<br />
X<br />
C <strong>BARRON</strong> X X X<br />
C CHETEK X X X<br />
C CUMBERLAND X X X X<br />
C RICE LAKE X X X X<br />
source: Public Service Commission of <strong>Wisconsin</strong>. Local Service Providers database as of 7/31/08<br />
CenturyTel Aquisition LLC<br />
Charter Fiberlink LLC<br />
Chibardun Telephone Coop.<br />
Citizens Telephone Coop. Inc.<br />
Clear Lake Telephone Co.<br />
CTC Telcom, Inc (dba Chibardun)<br />
Granite Telecomunications, Inc.<br />
Telephone USA, LLC (dba CenturyTel)<br />
Barron County Conditions and Trends Report 143
Power Plants, Substations, and Transmission Lines<br />
Power plants are industrial facilities that generate electricity for distribution to a large<br />
area. Substations are industrial installations at which electricity is received from one or<br />
more power stations for conversion from alternating to direct current, reducing the<br />
voltage or switching before distribution by a low-tension network for general<br />
consumption.<br />
Transmission lines are the largest electric lines on the landscape. These lines generate<br />
the most public interest because they are the most noticeable electric lines and because of<br />
the potential human and animal health side affects associated with them. Transmission<br />
lines transport electricity from power plants to substations and operate at several<br />
thousand volts (typically ranging from 46,000 to 345,000 volts), stand anywhere between<br />
60 and 100 feet tall, and serve several hundred thousand customers.<br />
The Public Service Commission (PSC) is the branch of the <strong>Wisconsin</strong> State government<br />
with the overall responsibility of regulating electric utilities. Map 4.2 at the end of this<br />
section shows the primary electric transmission lines, substations, and line owners in west<br />
central <strong>Wisconsin</strong>. If more specific information on power plants, substations, or<br />
transmission lines is needed, communities should contract the PSC, line owners, or their<br />
local electric utility.<br />
Electric Utilities<br />
Electric service is provided to Barron County by Xcel Energy and a mix of municipal<br />
electric services and cooperatives. Generally, Xcel Energy often provides the electric<br />
service to developed areas (e.g., Almena, Turtle Lake, Chetek). Barron Light and Water<br />
serves the area in and around the City of Barron, while the cities of Cumberland and Rice<br />
Lake are on municipal systems. The majority of the rural area of the County is served by<br />
Barron Electric Cooperative which provides electric service to over 17,600 customers in<br />
61 towns in the region. Approximate electric utility service areas for west central<br />
<strong>Wisconsin</strong> are included on Map 4.2 at the end of this section.<br />
Natural Gas Utilities<br />
Natural gas is provided to the Barron County area by the <strong>Wisconsin</strong> Gas Company (dba<br />
We Energies) which is headquartered in Milwaukee. Many areas of the County do not<br />
have access to natural gas. Map 4.3 at the end of this section shows those communities<br />
which have natural gas service in west central <strong>Wisconsin</strong> and the natural gas transmission<br />
lines. Service areas are shown by town, though natural gas service may not be available<br />
in all areas shown.<br />
144 Utilities and Community Facilities Information
Inventory of Educational Facilities<br />
Barron County residents are served by a wide assortment of educational facilities at the<br />
elementary, primary, secondary, and post-secondary levels. In addition, some facilities<br />
offer preschool, kindergarten, special<br />
education, religious, business, industrial,<br />
trade, and vocational training. The<br />
specialized educational opportunities, such<br />
as Head Start, tend to be clustered in the<br />
larger communities. Overall,<br />
municipalities in the County generally<br />
have a limited role in the planning and<br />
function of educational facilities, primarily<br />
relying on the educational institution itself<br />
for required planning and operations.<br />
Non-Public Schools<br />
Ten private schools serve Barron County residents as shown in Table 4.4. The majority<br />
of these schools do not have grade levels above 8 th grade. Local communities typically<br />
do not participate in the planning and function of these private schools.<br />
Table 4.4 – Private Schools in Barron County (2008)<br />
Public School<br />
2008<br />
District Area<br />
Private Schools<br />
Enrollment<br />
Barron Area Barron Christian School 38<br />
Growing Lights Christian Academy 43<br />
Hillcrest Mennonite School 41<br />
Cameron Abundant Life Academy 7<br />
Chetek Pleasant View Amish School<br />
not avail.<br />
Sunny Meadow Amish School<br />
not avail.<br />
Cumberland Gospel Mennonite School 49<br />
Rice Lake Area Meadow Creek Adventist School 9<br />
Redeemer Evangelical Lutheran School 25<br />
St. Joseph School 180<br />
Source: <strong>Wisconsin</strong> Department of Public Instruction<br />
Public Schools<br />
Turtle Lake School District<br />
Public education for grades K-12 is available for all <strong>Wisconsin</strong> residents. Table 4.5 lists<br />
the public school facilities located within Barron County and their 2008 enrollment. A<br />
school district map for Barron County is included at the end of this section (see Map 4.4).<br />
Barron County Conditions and Trends Report 145
Table 4.5 – Public Schools in Barron County (2008)<br />
District<br />
Public Schools<br />
2008<br />
Enrollment<br />
Barron Area Almena Elementary 75<br />
Barron Area Montessori School 16<br />
Barron County Learning Center 9<br />
Barron High 462<br />
Ridgeland Elementary (Dunn Co.) 96<br />
Riverview Middle 258<br />
Woodland Elementary 412<br />
Cameron Barron County Learning Center 7<br />
Cameron Elementary 360<br />
Cameron High 244<br />
Cameron Middle 273<br />
Chetek Chetek High 324<br />
Chetek Middle 202<br />
Roselawn Elementary 417<br />
Cumberland Barron County Learning Center 2<br />
Cumberland Elementary 408<br />
Cumberland High 398<br />
Cumberland Middle 297<br />
Island City Research Academy 20<br />
Prairie Farm Prairie Farm Elementary 170<br />
Prairie Farm High 111<br />
Prairie Farm Middle 77<br />
Rice Lake Area Barron County Alternative School 19<br />
Haugen Elementary 129<br />
Head Start 46<br />
Hilltop Day Care & Preschool 20<br />
Hilltop Elementary 294<br />
Jefferson Elementary 136<br />
Kiddie Korner Preschool 40<br />
Lincoln Elementary 128<br />
Red Cedar School 50<br />
Rice Lake High 814<br />
Rice Lake Middle 548<br />
Tainter Elementary 286<br />
Turtle Lake Turtle Lake Elementary 351<br />
Turtle Lake High 159<br />
Total<br />
Enrollment 7,658<br />
source: <strong>Wisconsin</strong> Department of Public Instruction<br />
146 Utilities and Community Facilities Information
Cooperative Educational Service Agencies (CESAs)<br />
CESA agencies were established in 1965 to replace county school supervisors. The<br />
state’s 12 regional CESAs offer a variety of leadership and program services that link the<br />
state’s 428 school districts with each other and with the Department of Public Instruction.<br />
CESA’s provide specific programs identified by school districts as priorities; often<br />
several schools jointly share CESA services.<br />
The majority of school districts overlapping Barron County fall within CESA District #11<br />
which is located in Turtle Lake. Small portions of the County, such as the New Auburn<br />
School District, fall within CESA District #10 located in Chippewa Falls.<br />
Vocational, Technical, and Adult Education<br />
<strong>Wisconsin</strong> has a very strong technical college system that works closely with industry,<br />
businesses, and the public sector to provide practical workforce training in a wide variety<br />
of fields. The State is divided into sixteen vocational districts with a technical college<br />
serving each district with a variety of classes, seminars, and vocational degree programs.<br />
Map 4.1 – Vocational Districts in the Region<br />
Barron County is within the <strong>Wisconsin</strong><br />
Indianhead Technical College (WITC)<br />
vocational district (see Map 4.1).<br />
According to the WITC website<br />
(www.witc.edu), nearly 1 in 9 residents<br />
in their district have taken some sort of<br />
class through a WITC campus, branch<br />
campus, or outreach center.<br />
source: <strong>Wisconsin</strong> Technical College System webpage.<br />
http://www.wtcsystem.edu/colleges.htm<br />
Technical college programs include<br />
apprenticeships, staff development,<br />
agriculture, marketing, driver education,<br />
health careers, law enforcement, home<br />
economics, trade and industrial, and<br />
adult education. Also, clinics and<br />
seminars are held throughout the year.<br />
<strong>Wisconsin</strong> Indianhead Technical<br />
College has regional campuses in Rice Lake, New Richmond, Ashland, and Superior<br />
with branch campuses in Hayward and Ladysmith and an outreach center in Spooner.<br />
WITC recently opened a technology center within Rice Lake’s south industrial park<br />
which is adjacent to its main Rice Lake campus. Total 2007-2008 WITC enrollment for<br />
credit courses was 7,382, while noncredit enrollment exceeded 20,000.<br />
Some Barron County residents also attend courses at Chippewa Valley Technical College<br />
(CTVC) which has campuses in Chippewa Falls, Eau Claire, Menomonie, River Falls,<br />
Barron County Conditions and Trends Report 147
and an outreach center in Neillsville. CVTC’s enrollment for credit courses was 8,855 in<br />
2007-2008, while noncredit enrollment was 10,741.<br />
University of <strong>Wisconsin</strong> System<br />
The University of <strong>Wisconsin</strong> system of public universities consists of two doctoral<br />
research universities (UW-Madison and UW-Milwaukee), eleven comprehensive<br />
universities, thirteen two-year colleges, and the Statewide UW-Extension system.<br />
<strong>West</strong> central <strong>Wisconsin</strong> is particularly blessed with three comprehensive universities,<br />
being home to UW-Eau Claire, UW-Stout (Menomonie), and UW-River Falls (see Table<br />
4.6). Of the thirteen University of <strong>Wisconsin</strong> colleges in the State offering associates<br />
degrees, UW-Barron County located in Rice Lake is the only one located in west central<br />
<strong>Wisconsin</strong>. Residents may also access associates-degree programming via the Internetbased<br />
UW Colleges Online.<br />
Table 4.6 – Enrollment of UW Campuses in <strong>West</strong> <strong>Central</strong> <strong>Wisconsin</strong><br />
Campus<br />
1998-99 2007-08<br />
Enrollment Enrollment<br />
% change<br />
UW-Eau Claire 10852 10854 0.02%<br />
UW-River Falls 5617 6452 14.87%<br />
UW-Stout 7731 8477 9.65%<br />
UW-Barron County 491 606 23.42%<br />
source: University of <strong>Wisconsin</strong> system<br />
University of <strong>Wisconsin</strong>-Extension partners closely with county governments to provide<br />
supportive services to all residents, businesses, and governments. This is a very active<br />
expression of the “<strong>Wisconsin</strong> Idea”, which is a philosophy that the University of<br />
<strong>Wisconsin</strong> System is a partner in improving the quality of life of all <strong>Wisconsin</strong> residents<br />
through education.<br />
Other Colleges and Universities<br />
There are no independent colleges or universities located in west central <strong>Wisconsin</strong><br />
which are fully accredited, degree-granting, and a member of the <strong>Wisconsin</strong> Association<br />
of Independent Colleges and Universities.<br />
148 Utilities and Community Facilities Information
Inventory of Other Community Facilities and Services<br />
In most cases, the planning and operations of the following community facilities and<br />
services occurs at the local or facility level. Often, the local community may only be<br />
marginally involved, with most planning and operational decisions made by the private<br />
entity that operates the facility or provides the service. As such, the majority of the<br />
specific circumstances, needs, issues, or policies associated with these community<br />
facilities and services are addressed in the individual community plans and not in this<br />
conditions and trends report. Given that the County’s population is anticipated to<br />
increase by approximately 11.2 percent (or by +5,000 residents) over the next twenty-five<br />
years, some increases in the level of services can be anticipated.<br />
Libraries<br />
Communities in Barron County are served by the following primary libraries:<br />
Barron Public Library<br />
Cameron Public Library<br />
Cumberland Public Library<br />
Calhoun Memorial Library (Chetek)<br />
Rice Lake Public Library<br />
Turtle Lake Public Library<br />
Some communities or interest groups (e.g., historical societies) may also have small-scale<br />
collections of books and related resources at other facilities.<br />
Barron Public Library<br />
The six public Barron County libraries, in<br />
addition to two public libraries in Rusk<br />
County, are supported through the Barron<br />
County Library Service (BCLS). The<br />
BCLS is a member of the Indianhead<br />
Federated Library System, a state-funded<br />
library agency serving ten counties in west<br />
central <strong>Wisconsin</strong>. BCLS assists and<br />
connects these local libraries through the<br />
sharing of materials, computer library<br />
cataloging, training assistance, cataloging<br />
of materials, and funding.<br />
The planning and operation of libraries are<br />
the primarily the responsibility of the library board, library district (BCLS), and<br />
community, often working collaboratively with the local school district.<br />
Barron County Conditions and Trends Report 149
Solid Waste Disposal and Recycling Facilities<br />
Solid waste is commonly referred to as garbage, trash, refuse or rubbish. Solid waste<br />
disposal is one of the more expensive community investments made. An adequate solid<br />
waste disposal system is important in attracting business and industry. Industry usually<br />
generates more waste than residential uses, and all generated solid waste requires proper<br />
disposal.<br />
There are several private refuse haulers that operate in Barron County that offer door-todoor<br />
and roll-off or dumpster service, including B&B Disposal BFI, Hayward Garbage,<br />
Lake Area Disposal, and Waste Management. Some of these providers, and others, offer<br />
recycling collection and processing services. The Barron County Incinerator and<br />
Recycling Center is a waste-to-energy solid waste incineration facility in Almena.<br />
Barron County also has a landfill owned by Sanitary Northwoods Refuse Disposal LLC.<br />
“Sharp Collection” and related dangerous or biohazard items such as needles, syringes,<br />
and lancets are handled by facilities in Barron, Cumberland and Chetek.<br />
There are three responsibility units for recycling in Barron<br />
County: City of Rice Lake, Town of Rice Lake, and Barron<br />
County (which covers everything outside the first two<br />
communities). Since Barron County has an incinerator, no<br />
paper products are required to be recycled. Other recyclables<br />
(tin/steel/aluminum, glass, plastics) can be left at the drop<br />
box collection sites scattered throughout the County:<br />
Almena.......................Across from Almena Meat<br />
Locker<br />
Barron ........................Econo Foods on LaSalle Avenue<br />
Barronett ....................Lakeland Town Shop on Highway 63.<br />
Brill ............................Next to Oak Grove Town Shop<br />
Cameron.....................Behind Town Shop<br />
Canton........................Town Shop on Highway M<br />
Chetek ........................Treatment plant on Water Street<br />
Cumberland................Holiday Station on Elm<br />
Dallas .........................Behind the Fire Hall<br />
Haugen .......................Corner of Raymond & 3rd Street<br />
Mikana .......................Cedar Lake Town Shop<br />
Prairie Farm ...............Town Shop North of Village<br />
Reeve..........................Next to Town Hall<br />
Stanfold......................Town Shop at Highway 25 & 48<br />
Turtle Lake.................Becker's Super Value<br />
Most appliances can be left at the Barron County Recycling Office/Incinerator in Almena<br />
for a small fee. They typically do not accept tires, brush, demolition waste, etc., though<br />
other local recyclers and waste management providers may accept these items for a fee.<br />
150 Utilities and Community Facilities Information
Barron County has also periodically coordinated “Clean Sweeps” to provide residents a<br />
safe means of disposing hazardous chemicals, paints, solvents, etc, when State grant<br />
assistance is available. These Clean Sweeps are publicized through local newspapers and<br />
posters. The following Clean Sweeps have been held in Barron County in recent years:<br />
Agriculture Clean Sweeps - 1992, 1997, 2001<br />
Household Clean Sweeps - 2000, 2004<br />
Combined Agricultural & Household Clean Sweep- 1994, 2008<br />
Law Enforcement<br />
Law enforcement services fall under the statewide <strong>Wisconsin</strong> mutual aid agreement, with<br />
additional support and coordination through <strong>Wisconsin</strong> Emergency Management—<br />
Emergency Police Services in times of crisis. Overall, most planning and operations<br />
related to law enforcement occurs at the local level. The following constitute the primary<br />
law enforcement agencies in Barron County:<br />
City of Barron Police Department<br />
City of Chetek Police Department<br />
City of Cumberland Police Department<br />
City of Rice Lake Police Department<br />
Village of Almena Police Department<br />
Village of Cameron Police Department<br />
Village of Dallas Police Department<br />
Village of Prairie Farm Police Department<br />
Village of Turtle Lake Police Department<br />
Village of New Auburn<br />
Barron County Sheriff’s Department<br />
St. Croix Tribal Police Department<br />
<strong>Wisconsin</strong> State Patrol<br />
Barron County Emergency Management provides additional support to the County’s<br />
emergency response providers and local governments through emergency operations<br />
planning, training, coordination, crisis response, and recovery. In addition to County and<br />
local emergency operating plans which encompass the entire County, the Barron County<br />
Natural Hazards Mitigation Plan was adopted in 2005 which identifies proactive<br />
strategies to mitigate the potential impacts of a natural hazard event.<br />
Fire Departments<br />
Multiple fire departments provide fire protection<br />
for Barron County communities, and each gives<br />
mutual aid to neighboring departments, whereas<br />
neighboring jurisdictions share resources in<br />
responding to large-scale emergencies. The fire<br />
districts for Barron County are shown on Map<br />
Almena Fire Station<br />
Barron County Conditions and Trends Report 151
4.5 at the end of this section. The Department of Natural Resources provides the primary<br />
fire fighting protection in the area for wildfires. Overall, most planning and operations<br />
related to fire departments occurs at the local level.<br />
Ambulance<br />
There are several public and private ambulance and first responder services available in<br />
Barron County as shown on Map 4.6 at the end of this section. Additional details on the<br />
five primary ambulance services located in Barron County are provided below. Overall,<br />
most planning and operations related to ambulance and rescue services occurs at the local<br />
level or is undertaken by the private, contracted firm.<br />
City of Barron<br />
Barron Memorial Medical Center Ambulance Service<br />
Service type: private non-profit – hospital based<br />
Service level: intermediate provisional<br />
City of Chetek<br />
Chetek Ambulance Service<br />
Service type: municipal ambulance<br />
Service level: basic<br />
City of Cumberland<br />
Cumberland Memorial Hospital Ambulance Service<br />
Service type: Private non-profit – hospital based<br />
Service level: basic<br />
City of Rice Lake<br />
Lakeview Medical Center Ambulance Service<br />
Service type: Private non-profit hospital based<br />
Service level: basic<br />
Village of Dallas<br />
Dallas Area Ambulance Service<br />
Service type: Municipal volunteer fire department<br />
Service level: basic<br />
First Responders<br />
First responders are trained in medical techniques, medical equipment, patient<br />
assessment, and emergency scene management beyond basic first aid. First responders<br />
respond directly from their home (or other location) to the scene of an emergency. At the<br />
scene, the responders provide critical medical care until an ambulance arrives. First<br />
responders are sometimes associated with local fire departments, and many firefighters<br />
also have first responder training.<br />
152 Utilities and Community Facilities Information
Responders receive 59 hours of certified training and are State licensed, with many going<br />
on to be licensed as Emergency Medical Technicians (EMTs). EMTs require up to 756<br />
hours of training prior to certification, while full paramedics require 1,200 hours. Most<br />
first responders are volunteers who must complete a bi-annual 30-hour refresher course,<br />
in addition to specialized and local (often monthly) training programs.<br />
First responder service is contracted by the local municipality. As shown on Map 4.7 at<br />
the end of this section, all areas of County are covered by a separate first responder<br />
service. Some communities rely on a fire department or ambulance service for<br />
emergency medical services, such as the Rice Lake Fire Department which provides<br />
services to the City, the Town of Rice Lake, and the Town of Oak Grove. The following<br />
is a list of the first responder services active in Barron County:<br />
Bear Lake/Haugen First Responders<br />
Cameron First Responders<br />
Clayton First Responders<br />
New Auburn First Responders<br />
Prairie Farm First Responders<br />
Ridgeland First Responders<br />
Sand Creek First Responders<br />
Timberland Barronett Area First Responders<br />
Turtle Lake First Responders<br />
Hazardous Materials Response<br />
Personnel from the City of Rice Lake Fire Department serve as the Barron County Level<br />
“B” Hazardous Materials Response Team. The Team may be activated for any incident<br />
involving a hazardous materials release,<br />
leak, explosion, injury or potential of<br />
immediate threat to life, the<br />
environment, or property. County or<br />
"Level B" Teams respond to chemical<br />
incidents which require a lower level of<br />
protective gear, potentially with selfcontained<br />
breathing apparatus, but still<br />
exceeds the capabilities of standard fire<br />
departments.<br />
As needed, the <strong>West</strong> <strong>Central</strong> <strong>Wisconsin</strong><br />
<strong>Regional</strong> Response Team, based in the<br />
Chippewa Falls and Eau Claire Fire<br />
WC WI <strong>Regional</strong> Response Team Practice Drill<br />
Departments, can be contacted for<br />
additional reconnaissance and research support. This Level A team can also be requested<br />
to respond to the most serious of spills and releases requiring the highest level of skin<br />
Barron County Conditions and Trends Report 153
and respiratory protective gear. This includes all chemical, biological, or radiological<br />
emergencies requiring vapor-tight Level A gear with self-contained breathing apparatus.<br />
<strong>Planning</strong> and exercises regarding hazard materials is coordinated through the Barron<br />
County Emergency Management Office in conjunction with the Barron County Local<br />
Emergency Preparedness Committee.<br />
Medical Facilities<br />
Medical facilities are becoming increasingly important regional assets, improving the<br />
health of residents, while offering an important source of employment and a better quality<br />
of life. The availability of medical facilities in Barron County has expanded significantly<br />
within the past year with the newly opened Marshfield Clinic-Rice Lake and Cumberland<br />
Centers. Overall, most planning and operations related to medical facilities is undertaken<br />
by the private hospital or clinic, and includes little involvement of the local community.<br />
Table 4.7 lists the general medical clinics and hospitals in Barron County.<br />
Table 4.7 – Clinics and Hospitals in Barron County<br />
Location Facility Name Approx. Capacity<br />
Barron Barron Medical Center 100 people<br />
Midelfort Clinic-Barron<br />
50 people<br />
Cameron Midelfort Clinic-Cameron 15 people<br />
Chetek Marshfield Clinic-Lake Country avg 20 people<br />
Midelfort Clinic-Chetek<br />
avg 20 people<br />
Cumberland Cumberland Memorial Hospital 40 beds<br />
Cumberland Medical Clinic<br />
30 people<br />
Marshfield Clinic-Cumberland Center<br />
7 staff+patients<br />
Rice Lake Lakeview Medical Center 355 people (75 bed)<br />
Marshfield Clinic-Lakewoods<br />
25 people<br />
Marshfield Clinic-Rice Lake Center<br />
150,000 s.f.<br />
Prairie Farm Midelfort Clinic-Prairie Farm 4 physicians<br />
Turtle Lake Turtle Lake Medical Clinic 7 staff+patients<br />
source: Barron County Emergency Management, Marshfield & Midelfort Clinics websites<br />
Child Care Services<br />
<strong>Wisconsin</strong> State Law requires that anyone caring for four or more children under the age<br />
of seven years who are unrelated to the provider must obtain a license through the<br />
Department of Children and Families. Table 4.8 is a list of State licensed child care<br />
facilities in Barron County for both family child care (up to 8 children) and group child<br />
care (9 or more children). Over half of the County’s child care facilities are licensed for<br />
family child care.<br />
154 Utilities and Community Facilities Information
Communities may need to consider population and demographic trends compared to the<br />
capacity of available child care in their area to help determine if child care needs of the<br />
community are being met.<br />
Table 4.8 – Licensed Child Care Facilities in Barron County<br />
City Day Care Name Capacity<br />
ALMENA LITTLE TIKES LEARNING CTR 8<br />
SHARON'S DAY CARE 8<br />
<strong>BARRON</strong> BUZZING BEES DAY CARE 8<br />
CAROLYN'S DAY CARE 8<br />
CREATIVE KIDS' DISCOVERY CTR LLC 39<br />
HAPPY HANDS DAY CARE & PRESCHOOL 8<br />
SALEM LUTHERAN PRESCHOOL 20<br />
THE CLUBHOUSE 26<br />
CAMERON CORNERSTONES LEARNING CENTER 55<br />
CHETEK LITTLE CREATIONS CHILD CARE CTR 30<br />
LITTLE STEPS DAY CARE 8<br />
CUMBERLAND BUSY BEAVERS DAY CARE 50<br />
LITTLE HANDS FAMILY DAY CARE 8<br />
LYNN'S LITTLE TREASURES DAYCARE 8<br />
ST PAUL LUTH PRESCH & CHILD CARE 15<br />
DALLAS DALLAS CESA #11 HEAD START 51<br />
PRAIRIE FARM JUST LIKE HOME CHILD CARE 8<br />
THE TOT'S SPOT FAMILY DAYCARE 8<br />
RICE LAKE BRIGHT SMILES LEARNING CTR 8<br />
FIRST LUTHERAN PRESCHOOL 32<br />
HILLTOP DAY CARE 65<br />
IMAGINATION STATION 8<br />
KIDDIE KORNER CHILD CARE CTR 65<br />
KIDS WORLD LEARNING CTR 61<br />
LIL BRITCHES DAY CARE LEARN CTR 8<br />
LITTLE BEAR DAYCARE & PRESCH LTD 52<br />
MARGIE'S FAMILY DAY CARE 8<br />
PAM'S DAY CARE 8<br />
PRECIOUS STEPS DAY CARE 8<br />
PURPLE STAR DAYCARE 8<br />
RICE LAKE KIDS' CLUB 50<br />
THE CLUBHOUSE 50<br />
UMOS RICE LAKE MIGRANT HEAD START 40<br />
TURTLE LAKE BUSY BEES FAMILY DAY CARE 8<br />
PRESCHOOL PLAYHOUSE CORPORATION 30<br />
source: <strong>Wisconsin</strong> Department of Children & Families, July 2008.<br />
Barron County Conditions and Trends Report 155
Assisted Living Facilities, Nursing Homes, and Senior Programs<br />
Senior care facilities are becoming increasingly important regional assets to meet the<br />
changing needs of our aging population in a manner that permits residents to age with<br />
dignity. Since 1982, the State of <strong>Wisconsin</strong> has maintained a moratorium on the<br />
construction of new nursing home beds due to high vacancy rates. This has created a<br />
problem in some areas, meanwhile encouraging the use of alternative assisted-living<br />
approaches. Per capita, Barron County has a higher number of nursing home beds than<br />
State averages. However, the actual availability of beds in Barron County can vary<br />
widely, and there are occasional waiting lists.<br />
Barron County has a limited supply of affordable assisted living facilities. The higher<br />
costs of these facilities, combined with decreased access to related governmental support,<br />
sometimes encourages residents to choose nursing care over assisted living. As the baby<br />
boomer generation ages, demand for such facilities is expected to increase. And with<br />
advances in medicines and technology, there has been an increasing trend in the provision<br />
of "in-home care” as an alternative to group homes or nursing care, which is also less<br />
costly overall.<br />
Table 4.9 lists the assisted living facilities and nursing homes in Barron County, along<br />
with their capacities. These facilities are organized by five types:<br />
Adult Day Care provides services for part of a day, primarily on weekdays, in a group<br />
setting to adults who need assistance with activities of daily living, supervision, or<br />
protection. Adult day care centers are not licensed by the State, but may be certified.<br />
Adult Family Homes provides residence and care for up to four adults of minimum age<br />
18 who are not related to the operator, with up to seven hour per week of nursing care per<br />
resident. Counties certify one- and two-bed adult family homes, while the State licenses<br />
homes with three or four adults.<br />
Community-Based Residential Facilities are a place where five or more adults reside<br />
who receive care, treatment, or services that are above the level of room and board, but<br />
includes not more than three hours of nursing care (at the intermediate level or below) per<br />
week per resident. These facilities often provide services to a particular group, such as<br />
persons with dementia, developmental disabilities, or mental health problems. CBRFs<br />
are licensed by the State.<br />
Residential Care Apartment Complexes are independent-living apartments where five<br />
or more adults reside which are provided up to 28 hours per week of supportive and/or<br />
nursing services. These complexes may be a distinct part of a nursing home or<br />
community-based residential facility and are certified by the State.<br />
Nursing Homes provide constant nursing care and supportive services to residents who<br />
have significant deficiencies with activities of daily living. Residents are typically the<br />
156 Utilities and Community Facilities Information
elderly, younger adults with physical disabilities, and those requiring rehabilitative<br />
therapies. Nursing homes are licensed by the State.<br />
Like child care, communities may<br />
need to consider population and<br />
demographic trends compared to the<br />
capacity of available assisted living<br />
facilities and nursing homes in their<br />
area to help determine if needs are<br />
being met. And with Barron County’s<br />
aging population, the availability of<br />
such facilities could be a potential<br />
issue for the future.<br />
There is a large variety of additional<br />
Barron Nursing Home<br />
supportive services available to the<br />
elderly and those with disabilities, ranging from in-home support to transportation to<br />
financial services to social activities. Such services are provided through a mix of<br />
governmental and non-profit institutions, often relying on volunteer support. Senior<br />
activities and lunches are available at ten sites in Barron County:<br />
Almena Town Hall<br />
Barron Senior Center<br />
Cameron Senior Center<br />
Chetek Senior Center<br />
Cumberland Senior Center<br />
Haugen Senior Center<br />
Riverview Manor (Prairie Farm)<br />
Rice Lake Senior Center<br />
Turtle Lake American Legion Hall<br />
Dallas Village Hall/Senior Citizen’s Building<br />
For more information on aging and disability programs in Barron County, please contact<br />
the Barron County Office of Aging (715-537-6225) or visit its Aging and Disability<br />
Resource Center website (www.co.barron.wi.us/connect.htm).<br />
Barron County Conditions and Trends Report 157
Table 4.9 – Assisted Living Facilities in Barron County<br />
City Facility Type Facility Name<br />
Capacity<br />
or # of<br />
Beds<br />
<strong>BARRON</strong> Adult Day Care DAYBREAK I 15<br />
Adult Day Care DAYBREAK II 15<br />
Nursing Home <strong>BARRON</strong> CARE AND REHABILITATION 50<br />
Nursing Home<br />
LUTHER MIDELFORT-NORTHLAND MAYO HEALTH<br />
SYSTEM<br />
27<br />
Adult Family Home HUSETS KOUNTRY KARE 4<br />
Community Based Residetial<br />
(developmentally disabled)<br />
T J A CAMPBELL HILLTOP HOME 8<br />
Community Based Residetial<br />
(developmentally disabled)<br />
HANSENS GROUP HOME 6<br />
Community Based Residetial<br />
(senior and/or dementia/alz.)<br />
MONROE MANOR 45<br />
Residential Care Apt. Complex<br />
<strong>BARRON</strong> MEMORIAL MED CNTR--MAYO HEALTH<br />
SYST<br />
36<br />
CAMERON Adult Family Home SUE HUSETS GROUP HOME 4<br />
Community Based Residetial<br />
(developmentally disabled)<br />
NORTHWEST PATHWAYS TO IND INC 8<br />
CHETEK Nursing Home KNAPP HAVEN NURSING HOME 97<br />
Adult Family Home BIRD STREET MEMORY CARE 4<br />
Adult Family Home HAPPY ACRES 4<br />
Adult Family Home JUST LIKE HOME 4<br />
Community Based Residetial<br />
(senior and/or dementia/alz.)<br />
CHETEK RIVERS EDGE 8<br />
COMSTOCK Community Based Residetial (other) AURORA RES ALTERNATIVES INC 8<br />
CUMBERLAND Nursing Home CUMBERLAND MEMORIAL HOSPITAL ECU 50<br />
DALLAS Nursing Home DALLAS CARE AND REHABILITATION 50<br />
PRAIRIE FARM Nursing Home PIONEER NURSING HOME 42<br />
Adult Family Home CIRCLE OF HOPE INC 4<br />
RICE LAKE Nursing Home HERITAGE MANOR 92<br />
Nursing Home RICE LAKE CONVALESCENT CENTER 95<br />
Adult Family Home PATRICK STREET HOUSE 4<br />
Community Based Residetial<br />
(senior and/or dementia/alz.)<br />
OUR HOUSE MEMORY CARE 24<br />
Community Based Residetial<br />
(senior and/or dementia/alz.)<br />
CARE PARTNERS ASSISTED LIVING LLC 15<br />
Community Based Residetial<br />
(senior and/or dementia/alz.)<br />
COUNTRY TERRACE OF WISCONSIN INC 16<br />
Community Based Residetial (other) NEW BEGINNINGS OF <strong>BARRON</strong> <strong>COUNTY</strong> INC 8<br />
Community Based Residetial<br />
(developmentally disabled)<br />
CORNERSTONE WEST CBRF 8<br />
Community Based Residetial (other) MAGNA HOUSE 8<br />
Community Based Residetial (other) CHRISMARK HOME LLC 8<br />
Community Based Residetial<br />
(senior and/or dementia/alz.)<br />
OUR HOUSE SENIOR LIVING 20<br />
Community Based Residetial (other) MITCHELLS CBRF 8<br />
Residential Care Apt. Complex BRENTWOOD SENIOR COMMUNITIES 2<br />
source: <strong>Wisconsin</strong> Department of Health Services, July 2008.<br />
Parks and Recreation Facilities<br />
Visitors and residents of Barron County have many recreational opportunities. The<br />
majority of park and recreational planning in Barron County occurs at the local level or,<br />
for County and State facilities, under the direction of Barron County Forest & Recreation<br />
Department and the <strong>Wisconsin</strong> Department of Natural Resources, respectively. Any<br />
specific circumstances, issues, or policies associated with parks and recreational facilities<br />
158 Utilities and Community Facilities Information
specific to a community will be addressed in the utilities and community facilities<br />
element of the respective, individual community plan.<br />
Cattail Trail, Village of Almena<br />
Barron County is the western<br />
originating point for Tuscobia State<br />
Trail, the longest in the State. The Ice<br />
Age National Scenic Trail crosses part<br />
of northern Barron County, but is<br />
currently not continuous for its entire<br />
length within the county. Eight miles<br />
of the 22-mile Cattail Trail runs from<br />
Almena into Polk County and is used<br />
for ATVs, snowmobiling, and hiking.<br />
The 62-mile Wild Rivers Trail<br />
originating in Rice Lake and<br />
continuing north through Washburn<br />
and Douglas Counties also is available<br />
for ATVs, snowmobiles, and hikers.<br />
As of 2005, a few of the outdoor recreational opportunities found within Barron County<br />
were:<br />
13 designated swimming areas<br />
50 miles of canoe trails<br />
996 camping sites<br />
230 miles of snowmobile trails, including links to regional corridor trails 2<br />
7 golf courses<br />
40 fishing lakes (50+ acres)<br />
64 boat launches<br />
45 miles of hiking trails<br />
29 parks and picnic areas<br />
21,587 acres of public hunting lands<br />
22 waysides<br />
No complete inventory of all parks and recreation areas in the County exists. Some<br />
recreation areas may be on private land or maintained by a community organization,<br />
while school facilities (e.g., playgrounds, ballfields, basketball courts) are often used by<br />
the public for outdoor recreation in many communities. And the definition of parks and<br />
recreation areas can vary significantly by community. For instance, in a rural area, a<br />
small, unimproved pull-out for fishing along a river bank may perform an important<br />
recreational function.<br />
2 The Barron County Snowmobile Association makes available a snowmobile trail map for a small<br />
donation which shows the location of the many trails in Barron County.<br />
Barron County Conditions and Trends Report 159
Table 4.10 is a list of the primary County and<br />
municipal recreational facilities in Barron<br />
County. Data for Table 4.10 was taken from the<br />
Barron County Outdoor Recreation Plan which<br />
was last updated in 1989, comprehensive plans<br />
on file at WCWRPC, and community webpages.<br />
Not included are privately owned facilities (e.g.,<br />
Lion’s Club parks), all boat ramps, trails,<br />
unimproved waysides, and State lands. In many<br />
cases, communities will need to amend this list<br />
and consider resident demand for park facilities<br />
during their comprehensive planning efforts.<br />
Many of the available nature-based outdoor<br />
recreational amenities (e.g., County, Wildlife<br />
Areas) are discussed in the Agricultural,<br />
Natural, and Cultural Resources section of this<br />
report. Bicycling is covered previously in the<br />
City of Barron Park<br />
Transportation section. If State grant funding is<br />
being considered for outdoor recreation amenities, a State-reviewed outdoor recreation<br />
plan, adopted within the last five years, is a required prerequisite.<br />
Boat Ramp in the Town of Stanley<br />
160 Utilities and Community Facilities Information
Table 4.10 – Primary Parks in Barron County<br />
Facility Facility Type Owner Notes (some data outdated)<br />
T ALMENA<br />
Upper Turtle Lake Wayside wayside State 8 tables<br />
T ARLAND<br />
Barron County Rifle Range rifle range County 2 tables<br />
T CEDAR LAKE<br />
Waldo Carlson Park park/camping County 35 campsites; swimming<br />
Mikana Dam Wayside wayside County 1 table<br />
Sec. 11 Wayside wayside County 1 table<br />
Sec. 27 Wayside wayside County 1 table<br />
T CHETEK<br />
Southworth Memorial Park park/camping County 29 campsites; swimming<br />
T CLINTON<br />
Poskin Wayside wayside Town 4 tables<br />
T CRYSTAL LAKE<br />
Sec. 9 Wayside wayside County 1 table<br />
T CUMBERLAND<br />
Highway Gravel Pit Rifle Range rifle range<br />
T DALLAS<br />
STH 25 Wayside wayside Town 1 table<br />
T DOVRE<br />
USH 53 Waysides wayside State 2 total<br />
T LAKELAND<br />
Grant Park park County boat ramp; swimming<br />
Wayside Landing (Sec. 28) wayside County 1 table<br />
T OAK GROVE<br />
CTH "V" Wayside wayside Town 1 table<br />
T PRAIRIE LAKE<br />
Sec. 8 Wayside wayside County 1 table<br />
Sec. 2 Wayside wayside Town 3 tables w/ boat ramp<br />
T RICE LAKE<br />
Lake Desair Wayside wayside County 1 table<br />
T SIOUX CREEK<br />
Sec. 22 Wayside wayside County 1 table w/ boat ramp<br />
Sec. 3 Wayside wayside County 3 tables w/ boat ramps<br />
T STANLEY<br />
Veteran's Memorial Park park/camping County 29 campsites; swimming<br />
Sec. 8 Wayside wayside County 1 table<br />
Sec. 30 Wayside wayside County 2 tables<br />
T SUMNER<br />
Bill Park/Mike Jalowitz Field park/ballfield Town<br />
USH 8 Wayside wayside State<br />
Sec. 26 Wayside wayside County 1 table<br />
T VANCE CREEK<br />
Reeve Park park Town<br />
V ALMENA<br />
Shadyside Park<br />
21 tables<br />
V CAMERON<br />
Guy Speirs Recreation Area park Village 8 tables; swimming<br />
Sportsman's Field ballfield Village 2 tables<br />
V DALLAS<br />
Dallas Community Park park Village 12 tables; swimming<br />
Barron County Conditions and Trends Report 161
Table 4.10 – Primary Parks in Barron County continued<br />
Facility Facility Type Owner Notes (some data outdated)<br />
V HAUGEN<br />
Baseball Park park/ballfield Village 2 tables<br />
V PRAIRIE FARM<br />
Prairie Farm Pioneer Village Park park/camping Village 6 camp.; 26 tbls; swim.<br />
V TURTLE LAKE<br />
Tom Hartzell Memorial Field park Village softball<br />
Railway Park park Village picnic tables<br />
Turtle Lake Village Park park Village 6 campsite<br />
Skinaway Lake Public Access park Village boat landing<br />
Skinaway Lake Park park Village day use<br />
<strong>West</strong>ern Park park Village small neighborhood park<br />
C <strong>BARRON</strong><br />
Anderson Park park City includes municipal pool<br />
Becker Community Park park City 8 tables<br />
Peter S. Olson Memorial Park park City 4 tables<br />
Yellow River Wayside wayside City 1 table w/ boat ramp<br />
Rockman's Woods mostly trail County/Private cross-country skiing<br />
C CHETEK<br />
Leslie Phillips Memorial Park park City 23 tables; swimming<br />
City Ballpark & Tennis Courts ballfields City<br />
Long Bridge Public Fishing Area fishing City<br />
Chetek Dam Public Fishing park/fishing a/k/a Lions Memorial Park<br />
Gotham Park park City undeveloped<br />
Main Street Park park City pavilion<br />
CTH "I"/"SS" Wayside wayside City 2 tables<br />
C CUMBERLAND<br />
Tourist Park park City 54 tables; swimming<br />
Outdoor Laboratory<br />
special<br />
former WWTP park<br />
City<br />
City Golf Course golf City 18-holes<br />
Eagle Point Park park City 23 campsites<br />
C RICE LAKE<br />
Rice Lake City Park park City 45 tables<br />
Indian Mounds Park park City 13 tables; historic<br />
Narrows Park park City 45 tables; dock<br />
FFA Park park City natural/passive<br />
Knapp-Stout Park park City tables, farmer's market<br />
Florence Shudlick Park park City 8 tables<br />
Roux City Park park/ballfields City 5 tables<br />
Clanton Park park/ballfields City includes skatepark<br />
Hiawatha Park park City natural/passive<br />
Holsum Riverside Park park City natural/passive<br />
Hunter's Memorial Park park City shelter & tables<br />
Lakefront Park park City 5 boat docks<br />
Moon Lake Park park/ballfields City soccer, hiking<br />
Richter Park park City tables<br />
Scharbillig-Jones Nature Area natural area City natural/passive<br />
Tate Park park/ballfields City<br />
Veteran's Park park City 8 tables; fishing pier<br />
Wolfinger Bird Sanctuary natural area City natural/passive<br />
162 Utilities and Community Facilities Information
Cemeteries<br />
The following are the cemeteries in Barron County as identified at the Barron County<br />
USGenWeb site (http://www.rootsweb.ancestry.com/~wibarron/). This list does not<br />
necessarily include all smaller cemeteries, family plots, or Native American burial sites.<br />
Further, some of these cemeteries may be no longer in use. As needed, each individual<br />
community plan may identify any additional known cemeteries and any issues, needs, or<br />
policies related to those cemeteries in their community.<br />
Town of Almena/Village of Almena/Village of Turtle Lake<br />
Lake View Cemetery (aka Perley Cemetery)<br />
Sacred Heart Catholic Cemetery<br />
St. Ann's Catholic Cemetery<br />
St. Matthews Cemetery<br />
Zion Lutheran Cemetery<br />
Town of Arland<br />
Independent Cemetery (aka Arland Lutheran<br />
Cemetery)<br />
Town of Barron/City of Barron<br />
Barron Mennonite Cemetery<br />
First Lutheran Cemetery<br />
Wayside Cemetery<br />
Town of Chetek/City of Chetek<br />
Laaland Cemetery (aka Lolland or Johnson Cemetery)<br />
Lakeview Cemetery<br />
St. Boniface Catholic Cemetery<br />
Lakeview Cemetery, Town of Almena<br />
Town of Clinton<br />
Ebenezer Lutheran Cemetery (aka Swedish Lutheran Cemetery)<br />
Poskin First Lutheran Cemetery<br />
St. Matthew Lutheran Cemetery (aka German Lutheran)<br />
Town of Crystal Lake<br />
Comstock Cemetery (aka K Legacy Cemetery)<br />
Town of Cumberland/Village of Cumberland<br />
Bethany Cemetery (aka Neby Cemetery)<br />
Collingwood Cemetery (aka German Lutheran or St. Luke's)<br />
East Cumberland Cemetery (aka Section 10 Cemetery)<br />
Lakeside Cemetery<br />
St. Anthony Catholic Cemetery<br />
Barron County Conditions and Trends Report 163
Town of Dallas/Village of Dallas<br />
Dallas Cemetery (aka Norwegian Evangelical)<br />
Glenwood Cemetery (aka Young or Logan Cemetery)<br />
Greenwood Cemetery (aka O'Flanagans or Pine Creek)<br />
St. Paul's Evangelical Lutheran (aka German Lutheran)<br />
Town of Dovre<br />
Dovre Cemetery<br />
Town of Doyle<br />
Cedar Lake Cemetery<br />
Our Saviors Lutheran Cemetery (a.k.a. Campia Cem.)<br />
Town of Maple Grove<br />
Maple Grove Baptist Cemetery<br />
New Scandinavia Cemetery (aka Nye Scandinavia)<br />
Old Hillsdale Cemetery (aka Wiseman Cemetery)<br />
Town of Maple Plain<br />
Indian Burials<br />
Town of Oak Grove/Village of Haugen<br />
Bohemian National Cemetery<br />
Holy Trinity Catholic Cemetery<br />
Our Lady of Lourdes Catholic Cemetery (aka Dobie Cemetery)<br />
Town of Prairie Farm/Village of Prairie Farm<br />
Akers Cemetery<br />
Evergreen Cemetery<br />
Solum Cemetery<br />
St. Paul's Evangelical Lutheran (aka German Lutheran)<br />
Sunset Cemetery<br />
Town of Prairie Lake<br />
Otterholt Cemetery<br />
Prairie Lake Cemetery (aka Joelson & Pleasant Plain Cemetery)<br />
Town of Rice Lake/City of Rice Lake<br />
Nora Cemetery<br />
Orchard Beach Cemetery<br />
St. Joseph Cemetery<br />
Swede Cemetery<br />
Town of Sioux Creek<br />
Evergreen Cemetery (aka Pine Creek Cemetery)<br />
Sioux Creek Cemetery (aka Garner or Massie Cemetery)<br />
164 Utilities and Community Facilities Information
Town of Stanfold<br />
Stanfold Lutheran Cemetery<br />
Wiesner Cemetery<br />
Town of Stanley/Village of<br />
Cameron<br />
Faaberg Cemetery<br />
Meadow Creek Cemetery<br />
Pine Grove Cemetery<br />
Town of Sumner<br />
New Sumner Cemetery<br />
Old Sumner Cemetery<br />
Pioneers Rest Cemetery (aka Bandli<br />
Cemetery)<br />
Town of Turtle Lake<br />
Bethany Lutheran Cemetery<br />
Big Moon Lake Cemetery (aka Evangelical Lutheran Cemetery)<br />
Silver Creek Lutheran Cemetery<br />
St. Charles Catholic Cemetery<br />
Town of Vance Creek<br />
Holy Trinity Russian Orthodox Cemetery<br />
Reeve Cemetery (aka Vance Creek Cemetery)<br />
St. John's Catholic Cemetery<br />
Dams<br />
Sioux Creek Cemetery, Town of Sioux Creek<br />
In total, Barron County has 60 dams, most being small earthen works for livestock or<br />
recreational ponds and flowages; no dam in the County is used for electric generation. In<br />
most cases, if the majority of these smaller dams failed, the runoff downstream would be<br />
hardly noticed. There may be the potential to remove some of the older smaller dams<br />
which no longer serve a function, in order to improve water quality and lower the risk of<br />
failure.<br />
The following is a list of those governments which own dams, dikes, or levees in Barron<br />
County:<br />
<strong>Wisconsin</strong> DNR 6+ dams, dikes, or levees Village of Cameron 1<br />
<strong>Wisconsin</strong> DOT 3 Village of Dallas 1<br />
Barron County 11 Village of Prairie Farm 1<br />
City of Barron 3 Town of Maple Plan 1<br />
City of Cumberland 1 Town of Stanley 1<br />
Barron County Conditions and Trends Report 165
The majority of these dams have low or no hazard potential. Only two dams in Barron<br />
County have been given a high hazard rating, based on impacts if a failure should<br />
occur— Rice Lake Dam and Chetek Dam. Both of these dams are owned by Barron<br />
County. However, development pressure in dam shadows is high in some areas and<br />
updated dam failure analyses are not available for all dams.<br />
Only five dams in Barron County have 1,000 acres or more of normal storage: Cedar<br />
Lake/Mikana (30,000), Chetek (28,500), Bear Lake/Haugen (27,254), Rice Lake (7,500),<br />
and Beaver Dam Lake (1,000). Barron County owns all of these largest five<br />
impoundments, except Beaver Dam Lake Dam which is owned by the City of<br />
Cumberland.<br />
For additional details on the dams of Barron County, their hazard ratings, and some key<br />
development trends in dam shadows, please see the Barron County Natural Hazards<br />
Mitigation Plan.<br />
Other Government Facilities<br />
No comprehensive list of every<br />
government facility in Barron County<br />
exists. Such facilities can range from<br />
administrative and recreation buildings<br />
to airports and dams. Utilities, such as<br />
municipal wastewater, have<br />
corresponding facilities. The law<br />
enforcement and emergency services<br />
Town of Doyle Hall and Shop<br />
identified previously also have<br />
associated facilities, though some of<br />
these services may be co-located with other municipal functions. The following<br />
government facilities or related services have been discussed in other sections of this<br />
report:<br />
Airports (4) & Transportation Infrastructure<br />
Public Wastewater Treatment Facilities (12)<br />
Municipal & Community Water Systems (16)<br />
Law Enforcement & Emergency Services<br />
Parks and Outdoor Recreation Facilities<br />
Schools<br />
Libraries<br />
Dams<br />
see transportation section<br />
previously in this section<br />
previously in this section<br />
previously in this section<br />
previously in this section<br />
previously in this section<br />
previously in this section<br />
previously in this section<br />
Barron County and each local municipal government has at least one structure in which<br />
administrative functions are carried out and services are provided. Towns, villages, and<br />
smaller cities typically have a single hall or municipal building, while larger cities and<br />
counties typically have multiple buildings. Separate structures are also required for road,<br />
166 Utilities and Community Facilities Information
highway, public works, and maintenance; these sites may include recycling drop-off<br />
facilities as well. In towns, the “town shop” is often co-located with the town hall, but<br />
not in all cases. Most counties have a primary Highway Department facility, with a<br />
number of smaller ancillary facilities for the storage of vehicles, salt, sand, etc.,<br />
strategically located throughout the county.<br />
The following is a list of the other critical government facilities in Barron County:<br />
Barron County Courthouse (Barron)<br />
Barron County Justice Center (Barron)<br />
Barron County Highway Department (Barron)<br />
Barron County Health & Social Services (Barron)<br />
Almena Village Hall and Public Works/Maintenance<br />
Cameron Village Hall and Public Works/Maintenance<br />
Dallas Village Hall and Public Works/Maintenance<br />
Haugen Village Hall and Public Works/Maintenance<br />
Prairie Farm Village Hall and Public Works/Maintenance<br />
Turtle Lake Village Hall and Public Works/Maintenance<br />
Barron City Hall and Public Works/Maintenance<br />
Barron Area Community Center (Barron)<br />
Chetek City Hall and Public Works/Maintenance<br />
Cumberland City Hall and Public Works/Maintenance<br />
Rice Lake City Hall and Public Works/Maintenance<br />
Town Halls and Shops (25)<br />
The above list is not complete and does not include Federal and State facilities. As part<br />
of their individual comprehensive planning efforts, each community may need to<br />
supplement the above list, identify issues related to their facilities (e.g., availability,<br />
capacity, condition), and develop corresponding plan policies to address local concerns.<br />
Summary<br />
Utilities and community facilities in Barron County vary from small-scale facilities<br />
serving primarily local needs to regional facilities and networks serving large portions of<br />
the County’s population. As municipalities grow and change, the infrastructure, essential<br />
services and related community facilities must evolve as well.<br />
This section presented an initial inventory of the principal utilities and community<br />
facilities of Barron County. During local planning efforts, this section may need to be<br />
supplemented to include additional facilities and details, and analyzed more closely to<br />
identify issues and community needs.<br />
Barron County Conditions and Trends Report 167
Utilities and Community Facilities Maps<br />
Map 4.2 – Electric Service in <strong>West</strong> <strong>Central</strong> <strong>Wisconsin</strong><br />
source: <strong>Wisconsin</strong> Public Service Commission<br />
168 Utilities and Community Facilities Information
Map 4.3 – Natural Gas Service in <strong>West</strong> <strong>Central</strong> <strong>Wisconsin</strong><br />
source: <strong>Wisconsin</strong> Public Service Commission<br />
Barron County Conditions and Trends Report 169
Map 4.4 – Barron County School Districts<br />
source: U.S. Census TIGER Files, 2000<br />
170 Utilities and Community Facilities Information
Map 4.5 – Barron County Fire Districts<br />
source: Barron County Land Information Office<br />
Barron County Conditions and Trends Report 171
Map 4.6 – Barron County Ambulance Service Areas<br />
source: Barron County Land Information Office<br />
172 Utilities and Community Facilities Information
Map 4.7 – Barron County First Responder Service Areas<br />
source: Barron County Land Information Office<br />
Barron County Conditions and Trends Report 173
174 Utilities and Community Facilities Information
5. AGRICULTURAL, NATURAL, AND CULTURAL<br />
RESOURCES INFORMATION<br />
Element Context<br />
Barron County’s history and development is rooted in its natural resources. Prior to<br />
settlement by those of European heritage, Barron County had two commodities that were<br />
of great value to the Indian Tribes in the region – wild rice and pipe stone.<br />
French and English fur traders were attracted to the region’s abundant wild game in the<br />
late 1700s and early 1800s. But it was the large, dense forests which first attracted white<br />
men in large numbers. The timber industry (logging, sawmills, woodworking, etc) was<br />
the primary economic activity in Barron County from 1860 until the turn of the 19 th<br />
Century.<br />
Agricultural land in Barron County<br />
During the late 1880s and 1890s, agriculture<br />
began to increase in importance as German<br />
and Scandinavian immigrants settled in cutover<br />
areas and made productive use of the<br />
fertile soils. By 1900, agriculture was the<br />
basic industry of Barron County, with most<br />
cities and villages becoming farm trade<br />
centers with dairies, mills, and other related<br />
services. In time, Barron County became<br />
renowned for its high-bred and pure-bred<br />
dairy cattle.<br />
In the last part of the 20 th Century, agriculture declined as the primary economic activity<br />
in the County as employment in manufacturing, services, and retail trade increased. Even<br />
though the agricultural industry decreased, well over half of the County’s land base<br />
remains in agricultural production. Concurrently, tourism and recreational uses of the<br />
County’s natural resources has increased, offering both residents and visitors access to<br />
recreational trails, hunting lands, and surface waters for fishing, boating, and canoeing.<br />
During the first decade of the 21 st Century, the agriculture and natural resource industries<br />
of Barron County have experienced a lift from both the increased interest and investment<br />
in local and organic food and renewable energy. The increase in demand for local and/or<br />
organic food has grown significantly since the turn of the century. This has helped<br />
existing family farms and has provided a catalyst for new farms to start in Barron County.<br />
In addition, the abundance of farmland and natural areas are providing Barron County an<br />
opportunity to take advantage of the growing renewable energy and biomass industries.<br />
Barron County is currently experiencing a wide range of industries, public entities, farms,<br />
and individuals that are utilizing farmland and natural areas as a source to profit and/or<br />
save resources by using renewable resources and bio-energy.<br />
Barron County Conditions and Trends Report 175
Scattered throughout Barron County remain many unique historical structures and sites<br />
that are important vestiges of its past. Through these changes, it is the characteristics of<br />
Barron County’s natural and cultural resources that continue to define the local<br />
communities and provide the cornerstone for the quality of life for local residents. Clean<br />
and abundant water is needed for drinking, industry, and agriculture. Prime farmlands<br />
continue to provide the basis for the agricultural economy and for the preservation of the<br />
County’s rural character. A diversity of other natural habitats are protected and managed<br />
for aesthetic value, recreational purposes, economic importance, and a healthy ecosystem.<br />
Cultural and historic resources are identified and preserved for their social and economic<br />
value.<br />
This section describes the existing conditions of the agricultural, natural, and cultural<br />
resources of Barron County. These resources provide the foundation for most, if not all,<br />
of the other comprehensive plan elements, and they may be discussed in numerous other<br />
places within the comprehensive plan. To plan for the future, a firm understanding of the<br />
resource base of the community is needed.<br />
This provides an important context for developing objectives, policies, goals, maps, and<br />
programs for the conservation and promotion of the effective management of the<br />
agricultural, natural, and cultural resources for each participating community, as required<br />
by <strong>Wisconsin</strong> comprehensive planning legislation (Wis. Stat. § 66.1001(2)(e)). It should<br />
also be noted that under <strong>Wisconsin</strong> Comprehensive <strong>Planning</strong> Law, the term “cultural<br />
resources” includes historic buildings and structures as well as ancient and historic<br />
archeological sites.<br />
This element is further organized into six sub-sections:<br />
Agricultural Resources<br />
Natural Resources—Physical Features<br />
Natural Resources—Sensitive Lands<br />
Cultural Resources<br />
Existing Agricultural, Natural, and Cultural Programs<br />
Summary<br />
Considerable portions of this element are adapted from the 2001 Barron County Land<br />
Use Plan and supplemented with additional information from the U.S. Census Bureau,<br />
<strong>Wisconsin</strong> Department of Revenue, <strong>Wisconsin</strong> Department of Natural Resources,<br />
<strong>Wisconsin</strong> State Historical Society, and Soil Survey of Barron County, <strong>Wisconsin</strong>, among<br />
other sources. The vision and goals from the 2001 Barron County Land Use Plan are<br />
particularly relevant to this section, most notably the County goals of preserving<br />
productive farmlands, maintaining rural character, protecting water resources, and<br />
preserving large tracts of forest lands. The 2001 Barron County Land Use Plan vision<br />
and goals are included in the Issues and Opportunities element for reference.<br />
The maps for this section will be located in Appendix A: Barron County Resource Maps.<br />
In addition, the maps will be located on the Barron County Resource and Land Use Atlas<br />
DvD-ROM.<br />
176 Agricultural, Natural, and Cultural Resources Information
Agricultural Resources<br />
The Barron County Land Use Plan vision and goals placed great emphasis on preserving<br />
farms and protecting valuable, productive farmlands as a principle value of local citizens.<br />
Agricultural resources maps referred to in this subsection appear at the end of this<br />
element. Unless otherwise noted, all agricultural statistics in this subsection are from the<br />
U.S. Department of Agriculture—National Agricultural Statistics Service (Census of<br />
Agriculture -- <strong>Wisconsin</strong>-State and County Data. Part 49 <strong>Wisconsin</strong>. 1978, 1982, 1987,<br />
1992, 1997, 2002).<br />
Local Agricultural Industry Trends<br />
Although not as dominant as an industry as some surrounding counties, agriculture is an<br />
important element of the social and economic characteristics of Barron County. Changes<br />
in agriculture due to socio-economic conditions and the development pressures to convert<br />
agricultural land to other uses can have profound impacts in Barron County and<br />
surrounding communities. Several indicators point to these changes.<br />
In 2002, there were 229 fewer farms in Barron County than in 1978, though there has<br />
only been a loss of 34 farms over the last five years (See Figure 5.1). The average farm<br />
size has also stayed relatively the same over the last five years at an average farm size of<br />
214 acres.<br />
FIGURE 5.1 - Number and Average Size of Farms - 1978 to 2002 – Barron County<br />
2,000<br />
250<br />
1,800<br />
240<br />
Number of Farms<br />
1,600<br />
1,400<br />
230<br />
220<br />
Acres<br />
1,200<br />
210<br />
1,000<br />
1978 1982 1987 1992 1997 2002<br />
Year<br />
200<br />
Farms<br />
Acres/Farm<br />
source: U.S. Department of Agriculture, Census of Agriculture<br />
Countywide, farmland declined by 41,154 acres or 10.5 percent, between 1978 and 2002<br />
(See Table 5.1). Farm acres accounted for 70 percent of the total land area in the county<br />
in 1978, but only 63 percent in 2002.<br />
Barron County Conditions and Trends Report 177
Table 5.1 - Acres in Farmland – 1978 to 2002 – Barron County<br />
1978 1982 1987 1992 1997 2002<br />
Acres 393,084 385,555 374,522 350,866 359,388 351,930<br />
Percent of County Land Area 70.2 68.9 66.9 62.7 64.2 62.9<br />
Source: U.S. Department of Agriculture, National Agricultural Statistics Service<br />
As shown in Table 5.2 below, in 2002, approximately 92 percent of the farms in Barron<br />
County were individual or family farms.<br />
Table 5.2 - Number of Farms by Ownership – 1978 to 2002 – Barron County<br />
Ownership 1978 1982 1987 1992 1997 2002<br />
Individual/Family Farms 1,712 1,673 1,501 1,338 1,520 1,514<br />
Partnership 140 139 113 84 70 67<br />
Corporation – Family 20 34 42 47 62 63<br />
Corporation – Other 2 2 2 --- 4 0<br />
Other (Coop, Trust, etc...) 4 2 1 5 2 3<br />
Source: U.S. Department of Agriculture, National Agricultural Statistics Service<br />
From 1978 to 2002, the number of farms declined by 12.2 percent and farmland acreage<br />
declined by 10.5 percent (See Figure 5.1). Nonetheless, agriculture is still the<br />
predominant use of the land in Barron County. The assessed agricultural acreage in the<br />
County was 266,300 or about 54 percent of the land acreage in 1993. Map 5.1 shows the<br />
agricultural lands of Barron County as of 2000.<br />
The towns of Oak Grove (15,235), Stanfold (14,988), Maple Grove (14,500), Turtle Lake<br />
(14,083), and Barron (14,011) have the greatest number of agricultural acres (See Table<br />
5.3). In comparison, the towns of Bear Lake, Cedar Lake, Lakeland, Maple Plain, and<br />
Sumner all have less than 7,000 acres in agricultural use. Several towns, including Oak<br />
Grove, Cumberland, Barron, Stanfold, Turtle Lake, and Clinton have about two-thirds or<br />
more of their land in agriculture.<br />
The agricultural acreage has<br />
declined by 87,402 acres from 1990<br />
to 2007 in Barron County. The<br />
largest loss, which was 6,479 acres,<br />
occurred in Vance Creek. Other<br />
substantial losses occurred in the<br />
towns of Stanley (-5,178),<br />
Prairie Farm (-4,945), Sioux Creek<br />
(-4,788), Crystal Lake (-<br />
4,405), Doyle (-4,300), Turtle Lake<br />
(-4,269), Maple Plain (-4,250), and<br />
Prairie Lake (-4,155). The cities and<br />
villages that also saw large<br />
agricultural land losses were Turtle<br />
Lake (-423), Dallas (-339),<br />
Cameron (-329), and Chetek (-219).<br />
Agricultural land in Barron County<br />
178 Agricultural, Natural, and Cultural Resources Information
Table 5.3 Assessed Agricultural Parcels and Acreage by Municipality – 1990 and 2007 –<br />
Barron County<br />
Total Parcels<br />
Total Acres<br />
1990 2007 No. Change 1990 2007 No. Change % Change<br />
TOWNS<br />
Almena 466 417 -52 13,183 10,145 -3,038 -23.0<br />
Arland 529 488 -48 15,119 11,584 -3,535 -23.4<br />
Barron 572 567 -8 13,347 14,011 664 5.0<br />
Bear Lake 271 267 -18 9,336 6,340 -2,996 -32.1<br />
Cedar Lake 237 262 27 6,862 5,619 -1,243 -18.1<br />
Chetek 395 314 -77 10,935 7,471 -3,464 -31.7<br />
Clinton 593 592 -38 16,947 13,617 -3,330 -19.6<br />
Crystal Lake 403 353 -68 11,800 7,395 -4,405 -37.3<br />
Cumberland 550 556 -16 16,595 13,393 -3,202 -19.3<br />
Dallas 591 520 -82 16,829 12,742 -4,087 -24.3<br />
Dovre 565 462 -88 12,454 10,349 -2,105 -16.9<br />
Doyle 372 305 -97 12,122 7,822 -4,300 -35.5<br />
Lakeland 371 330 -7 7,172 6,092 -1,080 -15.1<br />
Maple Grove 632 582 -61 18,081 14,500 -3,581 -19.8<br />
Maple Plain 272 178 -100 7,767 3,517 -4,250 -54.7<br />
Oak Grove 601 526 -68 17,519 15,235 -2,284 -13.0<br />
Prairie Farm 609 559 -59 17,662 12,717 -4,945 -28.0<br />
Prairie Lake 566 473 -120 14,336 10,181 -4,155 -29.0<br />
Rice Lake 451 415 -43 12,232 8,880 -3,352 -27.4<br />
Sioux Creek 562 504 -84 16,157 11,369 -4,788 -29.6<br />
Stanfold 615 589 -37 17,840 14,988 -2,852 -16.0<br />
Stanley 564 465 -150 14,612 9,434 -5,178 -35.4<br />
Sumner 353 267 -103 9,545 6,227 -3,318 -34.8<br />
Turtle Lake 562 539 -31 18,352 14,083 -4,269 -23.3<br />
Vance Creek 583 546 -39 19,332 12,853 -6,479 -33.5<br />
TOTALS 12,285 11,076 -1,209 346,136 260,564 -85,572 -24.7<br />
VILLAGES<br />
Almena 23 17 -15 266 206 -60 -22.6<br />
Cameron 32 19 -6 678 349 -329 -48.5<br />
Dallas 29 21 -8 734 395 -339 -46.2<br />
Haugen 5 6 0 96 42 -54 -56.3<br />
New Auburn 0 0 0 0 0 0 0<br />
Prairie Farm 20 19 1 303 198 -105 -34.7<br />
Turtle Lake 42 24 -17 831 408 -423 -50.9<br />
TOTAL 151 106 -45 2,908 1598 -1310 -45.0<br />
CITIES<br />
Barron 16 8 -7 267 116 -151 -56.6<br />
Chetek 8 1 -7 224 5 -219 -97.8<br />
Cumberland 8 10 1 131 134 3 2.3<br />
Rice Lake 30 25 -9 603 450 -153 -25.4<br />
TOTAL 62 44 -18 1,225 705 -520 -42.4<br />
County Total 12,498 11,226 -1,272 350,269 262,867 -87,402 -25.0<br />
Turtle Lake, Polk Co. 0 6 6 0 72 72 n/a<br />
Turtle Lake TOTAL 42 30 -12 831 480 -351 -42.2<br />
Source: <strong>Wisconsin</strong> Department of Revenue<br />
In total, this amounted to a 25 percent reduction in agricultural land in Barron County<br />
from 1990 to 2007. That is a loss of about 1.5 percent per year during that period. Of the<br />
towns, Maple Plain (-54.7 percent), Crystal Lake (-37.3 percent), Stanley (-35.4 percent),<br />
Doyle (-35.5 percent), Sumner (-34.8 percent), and Vance Creek (-33.5 percent) had the<br />
largest percentage reductions in agricultural land. Of the cities and villages, the largest<br />
Barron County Conditions and Trends Report 179
percentage losses of agricultural lands occurred in Chetek (-97.8 percent), Haugen (-56.3<br />
percent), Barron (-56.6 percent), and Turtle Lake (-50.9 percent).<br />
In comparing this data with the data in the 2005 Barron Area Multi-Jurisdictional<br />
Comprehensive Plan Existing Conditions Report, several communities have experienced<br />
a leveling off of the reduction of farmland, and in instances some towns have seen an<br />
increase in assessed farmland since 2003. For example, Stanley (465), Sumner (389),<br />
Doyle (352), Prairie Lake (320), Dallas (190), Stanford (166), Crystal Lake (92), Vance<br />
Creek (75), Maple Plain (25), Arland (18), and Maple Grove (11) all saw increases in<br />
farmland acreage since 2003. As a whole, Barron County experienced an increase from<br />
10,964 total parcels of<br />
assessed farmland to<br />
11,226 from 2003 to 2007.<br />
At the same time, the<br />
county lost 3,433 acres of<br />
assessed farmland, or<br />
equivalent to 5.4 square<br />
miles of assessed farmland<br />
from 2003 to 2007.<br />
The number of dairy farms<br />
Agricultural business in Barron County, which has recently closed.<br />
in Barron County has<br />
continued to decrease over the past two decades, with 461 dairy farms comprising nearly<br />
28 percent of the total farms in 2002. In 1982, Barron County was home to 1,183 dairy<br />
farms (64 percent of the total farms), which was 722 more dairy farms than existed in<br />
2002. This is a 61 percent decrease in the number of dairy farms in Barron County<br />
between 1982 and 2002. Hay and silage production was the most common crop in 2002,<br />
with 1,123 farms producing hay on more than 82,000 acres. Corn production for grain<br />
and silage represents the next most common use of these agricultural lands, with<br />
approximately 60,500 acres being used for seed and grain production, and an additional<br />
13,600 acres for silage.<br />
Over the past few years, Barron County has seen an increase in the number of farms that<br />
are supplying the growing number of consumers that want to purchase local food and/or<br />
organic food. At this time, there are currently dozens of such farms in Barron County.<br />
These direct market farms are marketing themselves locally and regionally. <strong>Regional</strong>ly,<br />
products from these farms make their way to, among other places, the Eau Claire<br />
metropolitan area and the Twin Cities metropolitan area. In addition, Barron County<br />
currently has weekly farmers markets in Barron and Rice Lake during the summer and<br />
fall months.<br />
180 Agricultural, Natural, and Cultural Resources Information
Barron County direct market farms that cater to local and/or organic food<br />
- Apple Creek J Farm<br />
- Mommsen’s Produce Patch<br />
- Backyard Garden<br />
- North Creek Community Farm<br />
- Berry Best Strawberries<br />
- Northstar Bison<br />
- Bill Simpson’s Rocky Ridge Sugar Bush - Nuto Farms<br />
- Blaser’s Premium Cheeses<br />
- On Twin Lakes<br />
- Bob’s Barronett Produce<br />
- Opportunity Llamas<br />
- Bruder’s Riverdale<br />
- R Own Choose and Cut<br />
- Donna’s Kooler<br />
- Rocky Ridge Angus<br />
- DragSmith Farms, Inc and CSA<br />
- Schultz Farm Pumpkin Patch<br />
- Erb’s Classics<br />
- Seasons of Change CSA<br />
- Forty Acres and Ewe<br />
- Snow Bound Bison<br />
- Granite Creek Farm<br />
- Spring Hill Community Farm<br />
- Hustad’s Sugar Bush<br />
- Talking Oak Farm<br />
- Indian Creek Elk and Orchard<br />
- Twin Valley Bison<br />
- Litscher Farm<br />
- Viking Brewing Company<br />
- Loland Farms<br />
- Watkins-Oberli Family Farms<br />
- Mabel’s Maple<br />
- Woolies for EWE<br />
- Milk and Honey Acres<br />
At the same time that Barron County is experiencing an increase in the number of direct<br />
market farms, Barron County has also seen an increase in the interest and investment in<br />
renewable energy, primarily from the wood sector. At this time, several farms and<br />
companies are working on creating fuel from local sources. This includes the wood pellet<br />
industry, on-site bio-diesel production, and on-site straight vegetable oil production. In<br />
addition, different school districts in Barron County are heating several of their buildings<br />
from local wood feedstock.<br />
The loss of farmland is the most substantial trend that directly conflicts with Barron<br />
County Land Use Plan vision and goals. But the decrease in the number of farms and<br />
leveling off of the average farm size are notable as well. As the number of farms<br />
decrease, local services that support the farms may also go out of business, or raise prices<br />
due to decreased demand. This can be a vicious cycle that places additional business and<br />
economic hardships upon the remaining farmers who must pay higher prices for services<br />
or other needed operating expenses. These agricultural trends are discussed more in the<br />
Economic Development conditions and trends section. In 2007, the US Department of<br />
Agriculture will conduct their most recent Census of Agriculture. The data will be<br />
released in February 2009. Barron County will have the ability to analyze how their<br />
county has changed in relation to agriculture since 2002.<br />
Prime Agricultural Lands<br />
Prime agricultural land is the land that is best suited for food, feed, forage, fiber, and oil<br />
seed crops. It may be cultivated land, pasture, woodland, or other land, but it is not<br />
existing urban and developed land or water areas. The soil qualities, growing season and<br />
moisture supply are those needed for a well managed soil to produce a sustained high<br />
Barron County Conditions and Trends Report 181
yield of crops in an economic manner. Prime agricultural land is able to produce the<br />
highest yields with the minimal inputs of energy and economic resources.<br />
The Natural Resources Conservation Service (NRCS), formerly known as the Soil<br />
Conservation Service (SCS), has established a system of soils classification to uniformly<br />
evaluate the potential suitability of soils for agriculture production. The capability<br />
classification of soils is published as part of the Soil Survey of Barron County, <strong>Wisconsin</strong>.<br />
The capability classification is a grouping of soils that shows, in a general way, how<br />
suitable soils are for most kinds of farming. The capability classification system is<br />
intended to help decision-makers evaluate areas for their desirability for continued<br />
agricultural productivity. It does this by considering characteristics and suitability for<br />
supporting various crops and activities, and is based on the limitations of the soils, risk of<br />
damage as they are used, and the way they respond to treatment. Soils are classified in<br />
capability classes, subclasses and units in accordance with the degree and kind of their<br />
permanent limitations, but without consideration of major and generally expensive landforming<br />
that would change the slope, depth or other characteristics of the soil, and<br />
without consideration of possible but unlikely major reclamation projects.<br />
Class I, II, and III soils are considered prime farmland under the classification system and<br />
are each defined as:<br />
Class I -- Class I soils have few limitations that restrict their use.<br />
Class II -- Class II soils have some limitations that reduce the choice of plants or<br />
require moderate conservation practices.<br />
Class III -- Class III soils have severe limitations that reduce the choice of plants or<br />
require special conservation practices, or both. They can be cultivated safely with<br />
special precautions.<br />
Of the total land acres in Barron County, 384,634 acres are classified as Class I, II, and<br />
III soils by the NRCS. These soils make up nearly 68 percent of the total land acres of the<br />
county (See Table 5.4). Of the total area in Barron County, less than one percent are<br />
Class I, 46 percent are Class II soils, and 20 percent are Class III soils.<br />
Table 5.4<br />
Soil Capability Classification for Agricultural Lands – Barron County<br />
Soils Acres Percent of Total Land<br />
Acreage<br />
Class I 3,597 0.6%<br />
Class II 264,022 46.4%<br />
Class III 117,015 20.5%<br />
Total Classes I, II & III 384,634 67.5%<br />
source:Barron County Soil Survey<br />
Map 5.2 delineates those areas of prime farmland in Barron County under the Natural<br />
Resources Conservation Service's prime farmland designation. Map 5.3 shows soils that<br />
are classified as Class I, II, and III. As recognized in the Barron County Farmland<br />
Preservation Plan, soils with the capability classifications I, II, and III are considered<br />
prime agricultural lands. These are areas where the soils and other land characteristics are<br />
182 Agricultural, Natural, and Cultural Resources Information
likely to be highly suited for agricultural activity. The value of these lands is associated<br />
with not only their soil class, but also with their size, present use and any regulatory<br />
framework for their protection. Preserving these prime farmlands helps sustain the<br />
County’s agricultural economy and rural character.<br />
Natural Resources – Physical Features<br />
The following primary physical features of<br />
Barron County are discussed in this<br />
subsection:<br />
Topography<br />
Bedrock Geology<br />
Surface Geology<br />
Soils<br />
Mineral Resources<br />
Watersheds and Surface Waters<br />
Groundwater<br />
Natural resource maps of physical features<br />
appear in Appendix A.<br />
Topography<br />
Rolling agricultural land in Barron County<br />
Local areas of Barron County are part of larger geographic structures sharing some<br />
common characteristics or connections. Physically, the county is part of the “<strong>Central</strong><br />
Plain,” “<strong>West</strong>ern Upland,” and “Northern Highland” physiographic provinces of<br />
<strong>Wisconsin</strong>. The <strong>Central</strong> Plain region extends southeasterly from northern Polk and<br />
southern Burnett counties to south-central <strong>Wisconsin</strong>, and then northeasterly to Marinette<br />
County and the Michigan border. The <strong>West</strong>ern Upland region extends parallel to the<br />
Mississippi and St. Croix Rivers from Barron County to the Illinois border, and to the<br />
east from 30 to 75 miles. The Northern Highland region includes nearly all of the area<br />
north of the <strong>Central</strong> Plain regions, with the exception of the very northern part of the<br />
state.<br />
Generally, the topography of Barron County is moderately rolling, becoming increasingly<br />
more rugged in the northwest, north and extreme eastern portions of the county (See Map<br />
5.4). Surface features have been formed or modified by two distinct periods of glaciation.<br />
Pitted glacial outwash covers portions of the county resulting in many lakes, wetlands,<br />
and areas of uneven topography. A series of glacial end moraines rim the county on the<br />
western, northwestern, northern, and eastern portions of the County. The area between<br />
the end moraines is quite level, and much of the County’s best agricultural land is found<br />
here.<br />
Local relief in Barron County is over 200 meters, ranging from 300 meters above mean<br />
sea level to over 500 meters. The highest point of elevation is located in the east-<br />
Barron County Conditions and Trends Report 183
northeast part of the county in an area known as the Blue Hills. This region is located east<br />
of Rice Lake and is comprised of quartzite bedrock that is located close to the surface.<br />
Bedrock Geology<br />
Barron County is underlain by nearly all Cambrian sediments that overlie an ancient<br />
broad plain of granite bedrock. The formations consist of beds, or strata, of sandstones,<br />
siltstones and shales, which vary considerably in thickness and other characteristics.<br />
The pre-Cambrian bedrock reaches the surface in the northeastern part of the County as<br />
the Keweenawan quartzite of the Barron Hills. The quartzite is generally very resistant to<br />
weathering but varies in hardness and color. In the west-southwest part of the County,<br />
dolomite (limestone) forms the bedrock.<br />
The Cambrian sandstone, pre-Cambrian quartzite, and dolomite bedrock regions within<br />
the County also form the division of three physiographic provinces that comprise parts of<br />
the County. These provinces are the <strong>Central</strong> Plain (Cambrian sandstone), which covers<br />
most of the county, the Northern Highland (pre-Cambrian quartzite), which includes part<br />
of the northeastern part of the county, and the <strong>West</strong>ern Upland (dolomite), which covers<br />
the west-southwest portion of the county.<br />
The <strong>Central</strong> Plain (Cambrian sandstone) slopes to the south and was strongly dissected by<br />
streams before glaciation. This area is now covered by glacial drift of varying thickness.<br />
These areas tend to be the most favorable for agricultural crop lands in Barron County.<br />
The southwestern hills are part of the <strong>West</strong>ern Upland province. They are composed of<br />
dolomite limestone that overlies the Cambrian sandstone of the <strong>Central</strong> Plain. This area<br />
has been covered by glacial drift with only a few outcrops of limestone exposed. Much of<br />
these areas are still in agricultural use, though the steeper slopes have resulted in more<br />
forest lands.<br />
The Northern Highland (pre-Cambrian quartzite), known as the Barron Hills, lies in the<br />
northeastern part of the County. This group of rolling quartzite hills rises 300 to 600 feet<br />
above the nearby <strong>Central</strong> Plain. The hills consist of pre-Cambrian rock covered by a<br />
relatively thin deposit of glacial till. The rolling topography and thin soils have resulted<br />
in less agricultural croplands in this area and more forest lands.<br />
Both of the sandstone and dolomite types of bedrock are porous and have the ability to<br />
serve as good natural groundwater aquifers depending on their thickness, degree of<br />
fracture, overlying soil characteristics, and proximity to the land surface. However, these<br />
types of bedrock are also susceptible to contamination in areas where this fractured rock<br />
occurs at or near the land surface, especially where there is little or no soil to attenuate<br />
groundwater contaminants.<br />
184 Agricultural, Natural, and Cultural Resources Information
Surface Geology<br />
The surface geology of Barron County is primarily the result of glacial deposition over<br />
bedrock. The modern landscape was most strongly influenced by the glaciers that<br />
invaded the County from about 25,000 to 15,000 years ago, and by a glacier that moved<br />
into the County from the west about 12,000 years ago. Since the last period of glacial<br />
activity, the landscape has been further sculpted by naturally occurring and humaninduced<br />
erosion and drainage activity.<br />
During the last major glacial advance, the <strong>Wisconsin</strong> stage, ice covered only the<br />
northwestern and northeastern parts of Barron County. This glacial activity has left<br />
thicker glacial deposits than that of the previous glacial activity in the County.<br />
Based on the local surface relief and geologic materials, six landscape types can be<br />
distinguished in Barron County. These landscape types include:<br />
Rough Uplands – including the northern, western, and eastern edges of Barron<br />
County.<br />
Smooth Uplands (Rolling Till Plains) – including the central and northern parts of the<br />
County. Recessional moraines are outstanding on the till plain.<br />
Flats – including the eastern, east-central, and west-central parts of the county.<br />
Hilly Uplands – including the sandstone and siltstone located in southern Barron<br />
County.<br />
Barron Hills – including the rugged quartzite terrain located in northeastern part of<br />
the County.<br />
Alluvial and Colluvial Soils – located in small patches that are scattered throughout<br />
the County.<br />
Landforms produced by glacial activity include a diverse landscape ranging from broad,<br />
nearly level glacial outwash plains to rough, broken glacial moraines and areas of pitted<br />
outwash. The moraines are rough and broken, having abrupt hills and short, steep ridges<br />
of soil rock, and other debris that was deposited from a halt in the advance or retreat of<br />
glaciers. Between the moraines, the landscape is more level, especially in the central part<br />
of the County. Large outwash plains, formed from material carried and deposited by<br />
glacial melt water, are mostly level or undulating, but in some areas are also pitted with<br />
depressions. Lakes, ponds, and bogs are common in the depressions in the moraines and<br />
areas of pitted outwash.<br />
The most distinct glacial features of Barron County are the extensive outwash plains and<br />
the prominent recessional moraine that circles the County on the west, northwest, north,<br />
and east. Terminal moraines mark the furthest advance of a lobe of glacial ice. Moraines<br />
are generally rough hills with numerous undrained depressions. Many of these kettles in<br />
northwest and eastern Barron County are presently small lakes or swamps.<br />
Barron County also has both pitted and unpitted outwash plains. The smooth unpitted<br />
outwash consists of level plains of sand and gravel that were deposited by glacial melt<br />
waters. The pitted outwash plains contain many kettles, or holes, formed when ice blocks<br />
buried in the drift melted.<br />
Barron County Conditions and Trends Report 185
Between the recessional moraines, the surface is gently rolling to level. The land south of<br />
the recessional moraines is covered with drift from earlier glacial activity. Because this<br />
drift is older, it has been thinned out and leveled off by erosion over a longer period of<br />
time. Subsequently, this area is characterized by slopes that are long and gentle, and well<br />
developed drainage. Along the eastern part of the County is the Red Cedar River Valley.<br />
This area acted as a major glacial drainageway and was formed as the glaciers melted and<br />
receded.<br />
Soils<br />
Soil properties are an important factor in how land is used. Soils determine how<br />
productive farmland is, and the type and amount of development that can be reasonably<br />
supported based on the various soil characteristics. In fact, the best use of the land is<br />
often dictated by the types of soils there are in an area. Subsequently, identifying and<br />
reviewing soil suitability interpretations, for specific urban and rural land uses, are<br />
essential for physical development planning and determining the most suitable land use.<br />
Soils of Barron County were formed principally from thin loess, wind-carried soil<br />
material and glacial drift, except in the southern most portion of the county. Here soils<br />
have formed on bedrock of sandstone, siltstone, and shale.<br />
The following is a description of the generalized soils located in Barron County and<br />
corresponds to Map 5.5 at the end of this element. Each association contains several<br />
major and minor soils in a pattern that varies throughout the association. The soils within<br />
an association differ in many properties such as drainage, wetness, slope, and depth to<br />
bedrock. These characteristics affect the suitability of the land for agriculture and for<br />
development. For these reasons, the generalized information provided in this report is<br />
intended to be used for general policy and planning purposes, and not to provide<br />
information for site-specific applications.<br />
Crystal Lake-Comstock-Barronett Association<br />
Very deep, nearly level, and gently sloping, poorly drained to moderately drained, silty soils on<br />
glacial lake plains.<br />
Haugen-Amery Association<br />
Very deep, gently sloping to steep, moderately well drained and well drained, loamy soils on end<br />
moraines and disintegration moraines.<br />
Hayriver-Arland Association<br />
Moderately deep, gently sloping to very steep, well- drained, loamy and silty soils on uplands<br />
underlain by sandstone.<br />
Ribhill-Magnor-Freeon Association<br />
Moderately deep to very deep, nearly level to very steep, somewhat poorly drained to well<br />
drained, silty soils on glaciated bedrock controlled (quartzite) uplands.<br />
186 Agricultural, Natural, and Cultural Resources Information
Freeon-Magnor-Newood Association<br />
Deep and very deep, nearly level to moderately steep, somewhat poorly drained and moderately<br />
well drained, loamy and silty soils on ground moraines.<br />
Arland-Freeon-Magnor Association<br />
Moderately deep to very deep, nearly level to moderately steep, somewhat poorly drained to well<br />
drained, loamy and silty soils on glaciated bedrock (glauconitic sandstone) controlled uplands.<br />
Newot-Newood Association<br />
Deep and very deep, gently sloping to very steep, well-drained and moderately well drained,<br />
loamy soils on disintegration and end moraines.<br />
Freeon-Magnor Association<br />
Deep and very deep, nearly level to sloping, moderately well drained and somewhat poorly<br />
drained, silty soils on ground moraines and disintegration moraines.<br />
Freeon-Spencer-Magnor Association<br />
Deep and very deep, nearly level to sloping, somewhat poorly drained and moderately well<br />
drained, silty soils on ground moraines.<br />
Haugen-Freeon-Amery Association<br />
Deep and very deep, gently sloping to steep, moderately well drained and well drained, loamy<br />
and silty soils on ground moraines.<br />
Rosholt-Cromwell-Menahga Association<br />
Very deep, nearly level to steep, well drained to excessively drained, loamy and sandy soils on<br />
collapsed and uncollapsed outwash plains.<br />
Chetek-Rosholt-Menahga Association<br />
Very deep, nearly level to steep, well drained to excessively drained, loamy and sandy soils on<br />
collapsed and uncollapsed outwash plains.<br />
Anigon-Rosholt Association<br />
Very deep, nearly level to moderately steep, well drained silty and loamy soils on outwash plains.<br />
Rosholt-Cress Association<br />
Very deep, nearly level to steep, well drained loamy and sandy soils on collapsed and<br />
uncollapsed outwash plains.<br />
Anigon-Antigo Association<br />
Very deep, nearly level to moderately steep, well drained silty soils on collapsed outwash plains.<br />
Chetek-Hayriver-Rosholt Association<br />
Moderately deep to very deep, nearly level to steep, well drained, loamy soils on outwash plains<br />
and stream terraces.<br />
Based on the Barron County Soil Survey, and the National Resource Conservation<br />
Service’s (formerly Soil Conservation Service) most recent interpretation of soil<br />
limitations, nearly all land area in Barron County (99.6 percent) has severe limitations for<br />
Barron County Conditions and Trends Report 187
septic tank absorption fields, with the remaining 0.4 percent having slight or moderate<br />
limitations. Severe limitations can require special design, significant increases in<br />
construction costs, increased maintenance, or be unsuitable for private sanitary systems.<br />
Mineral Resources<br />
There are no metallic mining operations in Barron County. According to the <strong>Wisconsin</strong><br />
Department of Natural Resources, there are currently no known metallic mineral deposits<br />
or occurrences in sufficient tonnage and grade in Barron County to warrant extraction<br />
(<strong>Wisconsin</strong> Department of Natural Resources. Potential Metallic Mining Development in<br />
Northern <strong>Wisconsin</strong>. Mining Information Sheet. April 1997).<br />
Barron County does have 64 operating non-metallic mining sites permitted under Chapter<br />
NR 135 of the <strong>Wisconsin</strong> Administrative Code, including eight sites operated by the<br />
Barron County Highway<br />
Department. The towns of<br />
Clinton, Crystal Lake, Cedar<br />
Lake, and Vance Creek also<br />
operate mine sites, with Vance<br />
Creek having two such sites. The<br />
other mine sites are privately<br />
operated, primarily for road<br />
aggregate, concrete mix, and<br />
construction fill. Chapter NR 135<br />
covers annual permitting by local<br />
governments and the reclamation<br />
Mining operation in Barron County<br />
of non-metallic mine sites.<br />
Significant supplies of sand and gravel are available throughout Barron County. The soils<br />
amongst glacial outwash are the most likely sources for sand and gravel as the melting<br />
waters of the glacier were most active in sorting and depositing high-quality sand and<br />
gravel in this area. Where the bedrock is at or near the surface of the ground are areas that<br />
are possibly more suited for quarrying stone. It is helpful to identify the locations of these<br />
deposits so potential extraction sites can be considered before development occurs.<br />
Development almost always precludes extraction, while these lands can often be<br />
reclaimed for development after extraction is complete.<br />
Sand and gravel deposits in the County that have a relatively higher potential for<br />
extraction based on the National Resources Conservation Service’s latest Soil Survey of<br />
Barron County, <strong>Wisconsin</strong> (Map 5.6). Other local conditions, such as access/egress,<br />
existing development, current land uses, ownership, and public sentiment may preclude<br />
extraction at some of these locations. As communities begin to develop local land use<br />
goals, these maps should be considered to reduce potential land use conflicts. Such<br />
mineral resources are important raw material inputs to help achieve the County’s land use<br />
plan goal for continuing to provide safe, efficient, and adequate community facilities.<br />
188 Agricultural, Natural, and Cultural Resources Information
Watersheds & Surface Waters<br />
Lakes, ponds, rivers, streams, intermittent waterways, and natural drainageways make up<br />
the surface waters of Barron County. These resources are all water bodies, standing still<br />
or flowing, navigable, and intermittent, and include natural drainageways that collect and<br />
channel overland rainwater or snowmelt runoff. Natural drainageways are characterized<br />
by intermittent streams, threads, rills, gullies, and drywashes that periodically contribute<br />
water to first-order streams. There are also many artificial drainageways where the<br />
natural drainageways have been altered by human activity. All of these features have the<br />
ability to transport sediment and pollutants and are affected by their watersheds.<br />
Barron County has a total surface water area of 18,551 acres (see Map 5.7). This includes<br />
369 lakes (17,748 acres). Barron County has 104 miles of trout streams. Of these, 29<br />
miles are Class I; 59 miles are<br />
Class II; and 16 miles are Class<br />
III.<br />
Barron County is comprised of all<br />
or parts of 13 watersheds, eight<br />
watersheds from the Lower<br />
Chippewa River Basin and small<br />
portions of five watersheds from<br />
the St. Croix River Basin (See<br />
Map 5.8). A watershed is an area<br />
of land that drains or “sheds” its<br />
water to a lake, river, stream, or<br />
wetland. Some watersheds<br />
encompass several hundred square<br />
Red Cedar River in Barron County<br />
miles, while others may be small,<br />
covering only a few square miles that drain into a lake. This is important to understand<br />
since the effects of natural and human activities in one area can have a direct impact on<br />
other areas.<br />
Similar to surrounding counties, the source of nearly all potable water is groundwater.<br />
However, surface water can be a major source of groundwater recharge, and in the case<br />
of Barron County, a major factor in maintaining the County’s natural and recreational<br />
values. Consequently, there is also significant concern for understanding the impacts of<br />
development on the surface water resources in the County.<br />
Water Quality by Watershed<br />
The 2001 Barron County Land Use Plan analyzed surface water contamination risks by<br />
watershed. In general, the water quality in the Lower Chippewa River and St. Croix River<br />
Basins is good. The following is a summary of these findings:<br />
The Hay River watershed should be studied to determine sources and acceptable<br />
limits for phosphorus.<br />
Barron County Conditions and Trends Report 189
The South Fork Hay River watershed should be considered a high priority for<br />
protection from water quality degradation by non-point source water pollution. The<br />
South Fork Hay River habitat is limited by severe streambank erosion caused from<br />
livestock pasturing the streambanks.<br />
The majority of streams in the Pine Creek and Red Cedar River watershed are<br />
degraded by polluted runoff. Many of the Class II trout streams have the potential to<br />
become Class I with habitat improvements and controls of polluted runoff.<br />
The Lake Chetek watershed should be considered a high priority for selection for a<br />
priority watershed project. The Chetek chain of lakes comprises 82 percent of the<br />
total lake area of the watershed and improvement and protection of water quality of<br />
the Chetek chain of lakes should be the number one priority of the watershed.<br />
The Yellow River watershed contains high quality warm water fishery streams as well<br />
as 39 miles of trout streams. The main priority of the Yellow River watershed is to<br />
reduce the phosphorus loading, mainly from upland agricultural fields<br />
Long Lake (Washburn County) and Bear Lake, as part of the Brill and Red Cedar<br />
River watersheds, are classified as outstanding resource waters. Trout streams and<br />
warm water streams are significantly impaired by non-point sources of pollution.<br />
Red Cedar Lake, located in Barron County, is highly developed. Most of the streams<br />
in the watershed are only partly meeting their fishery potential due to beaver activity.<br />
A lake management plan covering Red Cedar, Balsam, and Hemlock Lakes has been<br />
prepared and is being reviewed by <strong>Wisconsin</strong> Department of Natural Resources prior<br />
to final approval.<br />
The Duncan Creek Priority Watershed Project has identified reduction goals for nonpoint<br />
source pollutants.<br />
Issues in the Upper Willow River watershed include the reduction of sedimentation,<br />
protection of groundwater from contamination by surface water entering through<br />
sinkholes, and livestock waste entering the streams.<br />
The Upper Apple River watershed should be considered a medium priority for<br />
protection from water quality degradation by non-point source water pollution. The<br />
Apple River has moderate water quality impacts as a result of agricultural and<br />
stormwater runoff.<br />
The Beaver Brook watershed should be considered a high priority for protection from<br />
water quality degradation by non-point source water pollution.<br />
The Clam River is classified as an outstanding resource water. Parts of the river are<br />
also classified as Class I and Class III trout waters.<br />
The North and South Forks of the Clam River are classified as outstanding resource<br />
waters. Six additional trout streams in the watershed were designated as outstanding<br />
resource waters in 1993.<br />
Surface and ground water quality can be affected by a wide variety of point and nonpoint<br />
sources, including agricultural run-off, stormwater from parking lots and roads, soil<br />
erosion, and spills of hazardous materials. The risk of water contamination increases as<br />
development occurs. These finding are important for individual communities to consider<br />
as they develop local land use and natural resources goals and strategies for their<br />
respective communities. Communities may select to participate in or support existing<br />
190 Agricultural, Natural, and Cultural Resources Information
County or State programs to protect their water resources or implement local educational<br />
or regulatory programs.<br />
Impaired Waters<br />
According to the <strong>Wisconsin</strong> Department of Natural Resources, two water bodies in<br />
Barron County are on the 2002 impaired waters list due to water quality concerns. These<br />
water bodies are Desair Lake and three miles of the Red Cedar River downstream of<br />
County Highway “W”. Both of these water bodies were listed as impaired due to high<br />
phosphorus levels resulting in low dissolved oxygen, with Desair Lake also experiencing<br />
problems with sediment loads, plant growth, and eutrophication. Other water bodies are<br />
at similar risk, since many of the native soils of the area have high levels of phosphorus.<br />
Barron County Land & Water Conservation Department is actively working to minimize<br />
soil erosion through best management practices to reduce such impacts.<br />
The plentiful surface waters are generally healthy. At the same time, many are suffering<br />
from the results of the soil erosion in the form of sedimentation. The native soils of the<br />
area contain a high level of phosphorous. This creates a situation of reduced habitat and<br />
high weed growth levels in the lakes and streams. There is an approach of planning high<br />
levels of soil conservation on the land to protect the waters of Barron County.<br />
An additional seven water bodies in Barron County have fish consumption advisories due<br />
to elevated mercury level likely the result of atmospheric deposition. These water bodies<br />
are: Bass Lake, Beaver Dam Lake, Echo Lake, Loon Lake, North Lake, Scott Lake and<br />
Sylvan Lake. The concern level is low, however, and these water bodies may no longer<br />
meet the criteria for listing.<br />
Outstanding and Exceptional Resource Waters<br />
Through its <strong>Wisconsin</strong>'s Outstanding and Exceptional Resource Waters Program, the<br />
<strong>Wisconsin</strong> Department of Natural Resources is working to maintain the water quality in<br />
<strong>Wisconsin</strong>'s cleanest waters. These waters have been classified into outstanding and<br />
exceptional waters. Outstanding resource water is defined as a lake or stream that has<br />
excellent water quality, high recreational and aesthetic value, high-quality fishing, and is<br />
free from point source or non-point source pollution. Exceptional resource water is<br />
Table 5.5 - Outstanding and Exceptional Waters – Barron County<br />
Outstanding Waters<br />
Exceptional Waters<br />
Bear Lake<br />
Brill River<br />
Engle Creek<br />
Brown Creek<br />
Hickey Creek<br />
Dority Creek<br />
Red Cedar Lake<br />
Jones Creek<br />
Sand Lake<br />
Moose Ear Creek<br />
Silver Lake<br />
Rice Creek<br />
Upper Pine Creek<br />
Silver Creek<br />
Yellow River<br />
Tuscobia Creek<br />
Vance Creek<br />
source: <strong>Wisconsin</strong> Department of Natural Resources Website. http://www.dnr.state.wi.us/org/water/wm/glwsp. January 2004<br />
Barron County Conditions and Trends Report 191
defined as a stream that exhibits the same high-quality resource values as outstanding<br />
waters, but that may be impacted by point source pollution or have the potential for future<br />
discharge from a small sewer community.<br />
Barron County has eight outstanding resources waters and nine exceptional resource<br />
waters identified (See Table 5.5).<br />
Point Source Discharges<br />
Private and public sewer systems and wastewater discharges are two potential sources of<br />
water pollutants. In 1990, there were a total of 10,031 (420 in incorporated areas) private<br />
sewage systems in Barron County. This was an increase of 2,894, or 40.5 percent, from<br />
1980. Though the 2000 census did not report sewage systems, this trend is continuing. In<br />
2003, Barron County issued 449 private sanitary permits – well above the annual average<br />
during the 1980s. The increased number and density of private sewage systems can lead<br />
to nitrates in the groundwater. There are 12 municipal and sanitary district wastewater<br />
treatment plants that discharge to either surface or ground water in Barron County, in<br />
addition to six permitted industrial discharges in Barron County (See Table 5.6).<br />
Table 5.6 - Permitted Municipal and Industrial Discharges to Surface and Groundwater<br />
Barron County<br />
Water Body Owner Type<br />
Hay River (LC05) Almena Municipal WWTP<br />
Crystal Lake<br />
Cumberland<br />
Prairie Farm<br />
Seneca Foods<br />
Stella Cheese<br />
Turtle Lake<br />
WI Dairies Coop–Clayton<br />
Municipal WWTP<br />
Municipal WWTP<br />
Municipal WWTP<br />
Industrial Food Products<br />
Industrial Dairy<br />
Municipal WWTP<br />
Industrial Dairy<br />
Pine Creek & Red Cedar River (LC07) Dallas Municipal WWTP<br />
Ridgeland<br />
Municipal WWTP<br />
Lake Chetek (LC08) Chetek Municipal WWTP<br />
Yellow River (LC09) Barron-Cameron Municipal WWTP<br />
Jerome Foods, Inc.<br />
Lakeland Sanitary District<br />
Northern Soft Water<br />
Foremost Farms Coop–Barron<br />
Industrial Turkey Products<br />
Municipal WWTP<br />
Industrial Water Softening<br />
Industrial Dairy<br />
Brill & Red Cedar River (LC10) Haugen Municipal WWTP<br />
source: Barron County Land Use Plan, 2001<br />
Rice Lake<br />
Municipal WWTP<br />
192 Agricultural, Natural, and Cultural Resources Information
Groundwater<br />
Groundwater is an important natural resource in Barron County. Understanding how<br />
groundwater is used in the County and how it can become contaminated is important to<br />
understanding the relationship between land use and groundwater quality.<br />
The first step in this process is to understand the source of groundwater. As rain and<br />
snow fall to the ground, some runs off into the lakes, rivers, and streams; some<br />
evaporates; and some is used by plants. The rest trickles down through the soil and<br />
subsoil material. This water eventually reaches a saturated zone that comprises<br />
groundwater. These saturated zones, called aquifers, are geologic formations that can<br />
store and transmit water. The concept of water moving from the land’s surface into<br />
groundwater is the starting point for thinking about the relationship between land use and<br />
groundwater quality. Nearly anything that is dumped, spilled, or spread on the ground can<br />
seep down to groundwater. This groundwater is then used by residents for drinking,<br />
farming, and other activities. Groundwater can also return to the surface as springs or as<br />
discharge to lakes, river, and streams.<br />
Protecting groundwater means modifying or even prohibiting certain activities in areas<br />
where contaminants can easily enter the groundwater. This can mean changing the type<br />
of septic system required, or limiting the concentration of development in areas that are<br />
most susceptible to contamination.<br />
In Barron County, the principal sources of potable water supplies are the sand and gravel<br />
aquifer, sandstone aquifer (which consists of Cambrian sandstone and Ordovician<br />
dolomite), and Precambrian aquifer. Most groundwater used in Barron County comes<br />
from the sand and gravel aquifer and the Cambrian sandstone. The sand and gravel<br />
aquifer consists of unconsolidated sand and gravel in glacial drift and alluvium. The sand<br />
and gravel aquifer is located in various areas throughout the county.<br />
Sandstone generally yields enough water for domestic use. The sandstone aquifer<br />
includes all sedimentary bedrock younger than the Precambrian age. Precambrian rocks<br />
generally have low permeability and mark the lower limit of groundwater movement. The<br />
sandstone aquifer underlies almost the entire county. Due to the abundance of water and<br />
depth of the sandstone, the aquifer is a reliable source of water for wells that require large<br />
amounts of water, such as municipal water supplies and industries.<br />
The <strong>Wisconsin</strong> Department of Natural Resources (DNR) has developed the Groundwater<br />
Contamination Susceptibility Model (GCSM) used to estimate the susceptibility of the<br />
groundwater based on particular natural resource characteristics. The natural resource<br />
characteristics include bedrock depth, bedrock type, soil characteristics, surficial<br />
deposits, and water table depth.<br />
The GCSM assigned a value to each of the resource characteristics. A weighting scheme<br />
was also developed to indicate the strength of each resource characteristic in estimating<br />
Barron County Conditions and Trends Report 193
groundwater contamination susceptibility. The result was a groundwater contamination<br />
susceptibility numerical score for different areas of Barron County (see Map 5.9).<br />
Natural Resources – Sensitive Lands<br />
In addition to the more distinct physical land features, there are other environmentally<br />
sensitive and valued land resources that should be considered for the potential impacts of<br />
growth and development activities. These areas, referred to as sensitive lands, should be<br />
identified and evaluated for their significance as a valued resource in the County. In<br />
addition, growth and development policies and management techniques will need to be<br />
established to affect the desired impacts on these resources.<br />
The following are the Sensitive Lands that are briefly reviewed and discussed in this<br />
section.<br />
Shorelands<br />
Floodplains<br />
Wetlands<br />
Steep Slopes<br />
Forests and Woodlands<br />
Grasslands and Prairie<br />
Wildlife, Wildlife Habitat, and Open Space<br />
Parks and Recreational Resources<br />
Natural resource maps of sensitive lands referred to in this subsection appear at the end of<br />
this conditions and trends element.<br />
Shorelands<br />
Shorelands provide valuable habitat for both aquatic and terrestrial animals and<br />
vegetation, and also act as buffers and thus serve to protect water quality. Shorelands are<br />
also considered prime residential building areas because of their scenic beauty.<br />
Recognizing this conflict, and to maintain the environmental, recreational, and<br />
economical quality of our water resources, the State of <strong>Wisconsin</strong> requires counties to<br />
adopt and enforce a shoreland ordinance.<br />
As required by the State, shorelands are defined as:<br />
all land within 1,000 feet of the ordinary high water mark of a lake, pond or flowage;<br />
or<br />
all land within 300 feet of the ordinary high water mark of a river or stream or to the<br />
landward side of the floodplain, whichever is greater.<br />
Each county must meet or exceed the minimum state standards for shoreland protection.<br />
The identified shoreland areas are based on the standards as defined in the Barron County<br />
Shoreland Ordinance.<br />
194 Agricultural, Natural, and Cultural Resources Information
Floodplains<br />
One sensitive land feature that most residents are aware of is the floodplain, which are the<br />
flood-prone lands adjacent to water bodies. Floodplains can be desirable development<br />
areas due to the proximity to lakes, rivers, and streams, but pose problems by possibly<br />
putting residents and property at risk. Development in floodplains can also affect the<br />
environmental quality of the waterway.<br />
To better protect the residents throughout the state, and to minimize the loss of property,<br />
the State of <strong>Wisconsin</strong>, under <strong>Wisconsin</strong> Statute 87.30(1), requires counties, cities, and<br />
villages to adopt and enforce floodplain zoning. In addition, <strong>Wisconsin</strong> Administrative<br />
Code NR116, Floodplain Management Program, has been promulgated for the protection<br />
of property and public investments from the effects of flooding.<br />
Development within the floodplain is usually assessed through the use of the Flood<br />
Insurance Rate Maps (FIRM) developed by the Federal Emergency Management Agency<br />
(FEMA). The floodplains have been identified for Barron County based on the FEMA<br />
flood insurance maps (see Map 5.10). It is important to remember that this map is no<br />
substitute for site-specific analysis. Natural and human changes in the landscape and the<br />
age and accuracy of the flood insurance maps has, in some cases, limited their reliability<br />
for identifying and designating floodplains.<br />
Wetlands<br />
There are a number of wetland areas within the watersheds that can affect water levels of<br />
rivers and creeks flowing through Barron County (see Map 5.11). Wetlands are defined<br />
by the State Statute as “an area where water is at, near, or above the land surface long<br />
enough to be capable of supporting aquatic or hydrophytic (water-loving) vegetation and<br />
which has soils indicative of wet conditions.” Wetlands may be seasonal or permanent<br />
and are commonly referred to as swamps, marshes, or bogs. Wetland plants and soils<br />
have the capacity to store and filter pollutants, replenish groundwater supplies, store<br />
floodwaters, and maintain stream flows.<br />
Steep Slopes<br />
It is generally more desirable, both environmentally and economically, to avoid steep<br />
slopes and disrupting natural drainageways with construction and land development.<br />
Problems with erosion and runoff pollution can occur with development on steep slopes,<br />
and flooding and wet basements can occur with drainageway disruptions.<br />
Steep slopes are any area where the gradient of the land is 12 percent or greater (each<br />
percent of slope is measured as one unit in elevation for every 100 horizontal units).<br />
Areas having steep slopes can be categorized into two levels, 12 percent to 19 percent<br />
slope, and 20 percent and greater.<br />
Barron County Conditions and Trends Report 195
Development on slopes of 12 percent to 19 percent should consider direct runoff into<br />
lakes, rivers, or streams, follow state approved construction site erosion control<br />
standards, and institute best management practices to control on-site runoff and pollution.<br />
Land with slopes of 20 percent or greater represent a definite limiting environmental<br />
condition. Development on these slopes results in high construction costs and severe<br />
erosion with resultant negative impacts to surface and ground waters. Development on<br />
slopes of 20 percent or greater is highly discouraged.<br />
Based on the Soil Survey for Barron County, there are 52,731 acres that potentially have<br />
a slope of 12 percent or greater (See Map 5.12), representing 9.2 percent of the total land<br />
base. Of this, 38,627 acres (6.8 percent) have slopes of 20 percent or greater. Additional<br />
localized and site-specific variations in topography and slope may exist. Glacial activity<br />
created some scenic topography, but may also be very sensitive to development activities.<br />
Forests and Woodlands<br />
Woodlands are an important feature of Barron County. In fact, its forests are the second<br />
most extensive land use and land cover after agriculture. The largest concentrations of<br />
woodlands occur in the northwest and northeast corners. Other large woodland areas are<br />
scattered throughout the County. In 2007, the combined assessed acres in forestland (both<br />
private and public) amounted to about 115,469 acres or about 20 percent of the total<br />
County acreage (See Map 5.13).<br />
Assessed forest acreage increased by more than 10,000 acres between 1990 and 2007 (see<br />
Table 5.7). This was about a 10 percent increase. The greatest percentage increases<br />
occurred in the towns of Vance Creek<br />
(195 percent), Rice Lake (115 percent),<br />
Stanley (70 percent), Dallas (57<br />
percent), Maple Grove (49 percent),<br />
and Prairie Farm (48 percent).<br />
Forested area in Barron County<br />
Between 1990 and 2007 the towns of<br />
Cedar Lake (-23 percent), Lakeland<br />
(-21 percent), and Dovre (-21 percent)<br />
saw the largest percentage declines in<br />
forested acreage. In 2007, the Town of<br />
Sumner had the greatest amount of<br />
forested acreage (8,657 acres) followed<br />
by Doyle (7,780) and Maple Plain<br />
(7,719).<br />
196 Agricultural, Natural, and Cultural Resources Information
Barron County Conditions and Trends Report 197
In Barron County, woodlands are a valuable part of the environment, aesthetics and<br />
economy. Woodlands provide:<br />
Habitat for a variety of plants and animals;<br />
The basic resource for many wood-based industries, including the expanding bioenergy<br />
sector;<br />
Resources for the agricultural community;<br />
An environment for recreational activities; and<br />
For the scenic beauty of the landscape and the rural character of the county.<br />
Woodlands managed according to approved forest management practices can support<br />
varying and sometimes complementary objectives, such as timber production and wildlife<br />
habitat. On the other hand, strict preservation of woodlands would be unusual and<br />
reserved for the most rare and unique stands in the County.<br />
Unmanaged development and the fragmentation of woodlands in residential lots can<br />
diminish or eliminate a woodlands capacity to provide wood products, habitat for plants<br />
and animals, and aesthetic quality. Barron County has experienced a loss of woodland<br />
acres in some towns, in part due to the subdividing of woodlands into residential lots (see<br />
Table 5.7). Because woodlands are considered a valued resource for these reasons,<br />
significant woodlands are often protected from conversion to other uses or properly<br />
managed in order to retain their desirable characteristics. For example, residential<br />
development in woodland areas could use conservation design techniques in order to<br />
allow for development and preserve the environmental and aesthetic value.<br />
Grasslands and Prairie<br />
Much of southern Barron County was originally covered by prairie, most of which does<br />
not remain today (Map 5.14). Prairie is the term used to describe the grassland type that<br />
predominated <strong>Wisconsin</strong> prior to Euro-American settlement. Prairies are dominated by<br />
grasses and sedges, lack trees and tall shrubs, and are home to a rich variety of plants and<br />
animals. Within the prairie designation there are variations due to soils and climate.<br />
Prairies continue to be a threatened plant community in <strong>Wisconsin</strong>. The reduction of<br />
prairie in the state means that an estimated 20 percent of the original grassland plants are<br />
considered rare in the state. Consequently, many species of plants and animals associated<br />
with <strong>Wisconsin</strong> prairies are endangered, threatened, or of special concern.<br />
There are few high quality prairie remnants remaining. Research shows it will take more<br />
than the preservation of these remnants to recover or retain the biodiversity this<br />
ecosystem can offer. Degraded areas that were once prairie can often be restored with<br />
moderate effort to yield a habitat suitable for most of the associated plant and animal<br />
species. Even certain managed agricultural and livestock practices can accommodate the<br />
maintenance of the open habitats needed by many grassland species. Grasslands can be<br />
restored and maintained through preserving a certain amount of open space for this type<br />
of cover as development occurs. Hence, development can occur in such a way that it can<br />
198 Agricultural, Natural, and Cultural Resources Information
maintain sufficient grasslands for its habitat value while preserving the rural character of<br />
the landscape.<br />
Wildlife, Wildlife Habitat, and Open Space<br />
Scattered throughout Barron County are various federal, state, and local wildlife, fishery,<br />
natural and scientific areas, including private conservancy areas. These often encompass<br />
one or more of the sensitive land areas discussed previous (e.g., wetlands, forests,<br />
shorelands, prairies). These areas are managed as open space to provide important<br />
feeding, breeding, nesting, cover, and<br />
other habitat values to a wide variety<br />
of plant and animal species.<br />
Agricultural lands can also provide<br />
important open space and wildlife<br />
habitat, while maintaining the rural<br />
character of the area.<br />
Rare and Endangered Species and<br />
Natural Communities<br />
According to the <strong>Wisconsin</strong><br />
Department of Natural Resources<br />
Natural History Inventory, Barron<br />
Wildlife in a wetland area in Barron County<br />
County is home to 26 animal species,<br />
12 plant species, and 18 natural communities that can be considered rare or endangered<br />
(<strong>Wisconsin</strong> Department of Natural Resources. Natural Heritage Inventory Program.<br />
. January 2004).<br />
The Natural History Inventory is a statewide inventory of known locations of rare and<br />
endangered species and communities. This information is for general planning purposes<br />
only, and the lack of known occurrences in an area does not mean that no significant<br />
endangered resources are present. These species and communities are listed on Map 5.15,<br />
provided by the <strong>Wisconsin</strong> Department of Natural Resources. The specific locations of<br />
some resources may not be mapped due to their sensitive nature and in order to minimize<br />
impacts.<br />
Only one species found within Barron County has Federal endangered or threatened<br />
status designated by the U.S. Fish and Wildlife Service:<br />
Karner Blue Butterfly Endangered Species (unmapped)<br />
Three Barron County species have been categorized as endangered by the <strong>Wisconsin</strong><br />
Department of Natural Resources:<br />
Loggerhead Shrike (Bird)<br />
Squashberry<br />
(Plant)<br />
Spotted Pondweed (Plant)<br />
Barron County Conditions and Trends Report 199
A threat to some of these natural communities is invasive plant and animal specific. Most<br />
notably is Purple Loosestrife, which is present in some areas of Barron County. Purple<br />
loosestrife is a wetland herb that was introduced as a garden perennial from Europe<br />
during the 1800s. This plant's optimal habitat includes marshes, stream margins, alluvial<br />
flood plains, sedge meadows, and wet prairies. It is tolerant of moist soil and shallow<br />
water sites such as pastures and meadows, although established plants can tolerate drier<br />
conditions. Purple loosestrife displaces native wetland vegetation and degrades wildlife<br />
habitat. As native vegetation is displaced, rare plants are often the first species to<br />
disappear. Eventually, purple loosestrife can overrun wetlands thousands of acres in size,<br />
and almost entirely eliminate the open water habitat. The plant can also be detrimental to<br />
recreation by choking waterways. Other invasive plant species found within Barron<br />
County that can have similar impacts are Reed Canary Grass and Eurasian Water-Milfoil.<br />
Other invasives, such as Gypsy Moth, Buckthorn, and Zebra Mussel, have not become<br />
firmly established to date in Barron County, but should be watched.<br />
State Natural Areas<br />
Currently, there are four State Natural Areas in Barron County, managed to protect rare<br />
plants, animals, or native landscapes (See Table 5.8). State Natural Areas may be part of<br />
a larger State Wildlife Area, though permitted recreational activities may be less<br />
intensive.<br />
Table 5.8 - State Natural Areas – Barron County<br />
Name Acres Location Owner<br />
Bear Lake Sedge Meadow 167 Town of Bear Lake &<br />
Village of Haugen<br />
Barron County &<br />
Village of Haugen<br />
Rock Creek Felsenmeer 70 Town of Doyle Barron County<br />
Loon Lake Woods 59 Town of Crystal Lake <strong>Wisconsin</strong> DNR<br />
New Auburn Sedge Meadow 325 Town of Dovre <strong>Wisconsin</strong> DNR<br />
source: WiDNR<br />
<strong>Wisconsin</strong>’s Land Legacy Report<br />
The <strong>Wisconsin</strong> Department of Natural Resources has completed a draft study that<br />
identifies unique places that are critical to meeting <strong>Wisconsin</strong>’s future conservation and<br />
recreation needs for the next 50 years. A range of criteria were used in determining these<br />
places, including: high quality ecosystems, outstanding scenic beauty, accessibility,<br />
recreational opportunities, size of the resource, networks between resources, and water<br />
quality protection. The following locations in Barron County were identified as important<br />
legacy places: Blue Hills, Haugen-Birchwood Lakeland, Hay River, and Upper Cedar<br />
Creek River<br />
200 Agricultural, Natural, and Cultural Resources Information
Parks and Recreational Resources<br />
Visitors and residents of Barron County have many opportunities to enjoy the natural<br />
resources of the county through parks, trails, and other public lands. A few of these<br />
opportunities found within Barron County are:<br />
13 swimming areas<br />
50 miles of canoe trails<br />
996 camping sites<br />
230 miles of snowmobile trails<br />
seven golf courses<br />
40 fishing lakes (50+ acres)<br />
64 boat launches<br />
45 miles of hiking trails<br />
29 parks and picnic areas<br />
21,587 acres of public hunting lands<br />
Much of the activity is based on the large number of lakes, rivers, and streams in the<br />
County, which are navigable waterways and open to public recreational pursuits (e.g.,<br />
fishing, canoeing, boating, swimming, hunting, bird watching). Barron County has 32<br />
natural lakes and impoundments of 100 acres or more that allow for major boating<br />
activities (e.g., water skiing). The County also has 104 miles of trout streams. Of these,<br />
29 miles are Class I; 59 miles are Class II; and 16 miles are Class III.<br />
In addition to its many lakes and rivers, the County manages five county parks, five<br />
designated swimming areas, 15,565 acres of forests, 250 miles of snowmobile trails, 17<br />
miles of ATV trails, and additional trails for skiing, snowshoeing, and mountain biking<br />
(See Table 5.9). Almost all of Barron County forestlands are in the County Forest Tax<br />
Law Program and are open for public use. All five county parks offer boat ramps and<br />
swimming. All of the county parks, except Grant Park, offer overnight camping.<br />
Table 5.9 - Parks and Recreational Lands – Barron County<br />
County Resource Size Location Notes<br />
Waldo Carlson Park 17 acres Town of Cedar Lake 35 campsites (33 w/ electric)<br />
Veterans Memorial Park 160 acres Town of Stanley 29 campsites (24 w/ electric)<br />
Southworth Memorial Park 17 acres Town of Chetek 29 campsites (25 w/ electric)<br />
Grant Park ~ 10 acres Town of Lakeland day use<br />
Kirby Lake Primitive Park 80 acres Town of Maple Plain walk-in tent camping<br />
County Forest Lands 15,565 acres various<br />
CASTA Trail Town of Maple Plain lighted skiing trail<br />
Pipestone Trails 17 miles Town of Doyle mountain bike/skiing<br />
Wild Rivers Trail 9.1 miles in County Rice Lake to Solon Springs ATV/snowmobiling<br />
Cattail Trail 8 miles in County Almena to Amery ATV/snowmobiling<br />
source:Barron County Outdoor Recreation Plan<br />
Though there are no State Parks in Barron County, the State Department of Natural<br />
Resources does manage 5,770 acres in nine different State Public Wildlife Recreational<br />
Lands in which a full range of recreational activities may be pursued (See Table 5.10).<br />
Barron County Conditions and Trends Report 201
Table 5.10 - State Public Wildlife Recreational Lands – Barron County<br />
State Recreational Lands Acres Location<br />
Grassy Lake 308 Town of Lakeland<br />
Loon Lake 2,751 Towns of Crystal Lake and Almena<br />
Yellow River Fishery 708 Towns of Cumberland and Stanfold<br />
Engle Creek Fishery 180 Town of Stanfold<br />
Lightning Creek 329 Town of Almena<br />
Sweeney Pond Creek 281 Town of Clinton<br />
County “T” Flowage 287 Town of Clinton<br />
Quaderery Creek 350 Towns of Barron and Clinton<br />
New Auburn 1,176 Town of Dovre<br />
source: WiDNR<br />
The state-owned Tuscobia Trail also begins in Barron County at US Highway 53, three<br />
and a half miles north of Rice Lake and runs northeast to near Park Falls. At 76 miles, it<br />
is longest state trail in <strong>Wisconsin</strong>. The trail is located in an old railroad grade and is<br />
primarily used by hikers in summer and snowmobilers in winter.<br />
A portion of the Ice Age National Scenic Trail, when fully developed, will also traverse<br />
across part of northern Barron County. This hiking trail is planned to extend from<br />
Potawatomi State Park in Door County to Interstate State Park in Polk County,<br />
approximating the terminal edge of the last glacial advance. Currently, only about 600 of<br />
miles of its planned 1,000 miles length are available for use. Within Barron County, the<br />
trail follows the Tuscobia Trail for part of its length, but is currently not contiguous<br />
within Barron County. The Ice Age National Scenic Trail is one of eight such national<br />
scenic trails in the United States.<br />
Residents and visitors also have the option to enjoy the natural resources of Barron<br />
County through many privately operated campgrounds, resorts, and other ventures. The<br />
majority of camping facilities in Barron County are privately owned, with 16 private<br />
campgrounds offering 863 campsites as of the last County Outdoor Recreation Plan<br />
update. These private-owned recreational activities vary broadly, from golfing to tubing<br />
on the Red Cedar River to skiing and snowboarding at Mt. Hardscrabble. Individual cities<br />
and villages also maintain their own parks and recreational activities discussed as part of<br />
the Utilities and Community Facilities Element.<br />
Cultural Resources<br />
Barron County has a long and storied history, with many significant sites. These sites<br />
include Native American encampments, fur trading outposts, lumbering camps and<br />
historic buildings. Historic structures, sites, and districts are often targeted for hazard<br />
mitigation strategies due to their unique, often irreplaceable, social value. Such historic<br />
resources can also be responsible for defining much of a community’s identity.<br />
According to the National Register of Historic Places, Barron County has five historic<br />
properties and one historic district that have received federal historic landmark<br />
designation (See Table 5.11).<br />
202 Agricultural, Natural, and Cultural Resources Information
Table 5.11 - Site and Structures on the National Register of Historic Places – Barron County<br />
Historic Site Location Municipality Listed<br />
Barron County Pipestone Quarry restricted Town of Doyle 1978<br />
Cumberland Public Library 1305 Second Ave. Cumberland 1992<br />
Island of Happy Days Red Cedar Lake; Stout Island Town of Cedar Lake 1995<br />
Rice Lake Mounds (47 BN-90) restricted Rice Lake 1979<br />
Wajiwan ji Mashkode<br />
Archeological District<br />
restricted Rice Lake 2003<br />
ZCBJ Hall 320 <strong>West</strong> 3 rd Street Haugen 1985<br />
source: National Park Service. National Register Information System Web Page. . August 27,<br />
2003<br />
Three of the above are of archeological significance thus their exact locations are<br />
restricted in order to offer greater protection to their preservation. This reflects the rich<br />
Native American history of the area.<br />
Additional older structures and homes within Barron County also likely qualify for the<br />
National Register of Historic Places. For instance, the <strong>Wisconsin</strong> Historical Society<br />
maintains the <strong>Wisconsin</strong> Architecture and History Inventory (AHI). This is a database of<br />
approximately 120,000 buildings, structures, and objects that illustrate <strong>Wisconsin</strong>'s<br />
unique history. The AHI documents a wide range of historic properties, mostly privately<br />
owned, such as the round barns, log houses, metal truss bridges, small town commercial<br />
buildings and Queen Anne houses that create <strong>Wisconsin</strong>'s distinct cultural landscape. The<br />
inventory is not comprehensive, and in some cases, the inventory may be dated if<br />
structures are altered or no longer exist. No comprehensive inventory of such historic<br />
places exists for Barron County.<br />
In Barron County, a total of 258 historic places and objects have been identified as<br />
having historic value and are on the AHI (See Table 5.12). The majority of these places<br />
are privately owned homes. Some locations may have multiple records or historic<br />
buildings, such as the F.D. Stout Lone Pine Farm in the Town of Cedar Lake that had 12<br />
AHI records.<br />
Any development should be reviewed, pursuant to <strong>Wisconsin</strong> Statute 44.40 (1989),<br />
against the historic resource list to determine whether historic properties within the area<br />
will be affected. The <strong>Wisconsin</strong> Historical Society should be contacted for a<br />
determination of possible impacts on these resources from development. The <strong>Wisconsin</strong><br />
Historical Society also strongly recommends that all proposed developments be surveyed<br />
by a qualified archeologist to identify any sites.<br />
The <strong>Wisconsin</strong> Historical Society has grant funding available to help local communities<br />
undertake a historical survey, with additional grant funds for a variety of historic<br />
preservation activities. In addition, historic commercial structures on the National<br />
Register, or historic commercial structures located in a historic district, may also qualify<br />
for tax credits. Owner-occupied homes that are eligible for listing in the National Register<br />
do not have to be formally listed in the National Register to be eligible for historic<br />
preservation tax credits for rehabilitation projects.<br />
Barron County Conditions and Trends Report 203
Table 5.12 - Architecture and History Inventory Listings – Barron County<br />
# of AHI<br />
Municipality<br />
Records<br />
Towns<br />
Almena 3<br />
Arland 0<br />
Barron 3<br />
Bear Lake 0<br />
Cedar Lake 20<br />
Chetek 1<br />
Clinton 4<br />
Crystal Lake 1<br />
Cumberland 0<br />
Dallas 1<br />
Dovre 0<br />
Doyle 2<br />
Lakeland 4<br />
Maple Grove 6<br />
Maple Plain 0<br />
Oak Grove 3<br />
Prairie Farm 3<br />
Prairie Lake 0<br />
Rice Lake 8<br />
Sioux Creek 0<br />
Stanfold 0<br />
Stanley 3<br />
Sumner 0<br />
Turtle Lake 0<br />
Vance Creek 1<br />
Villages<br />
Almena 0<br />
Cameron 3<br />
Dallas 1<br />
Haugen 1<br />
New Auburn (pt) 0<br />
Prairie Farm 1<br />
Turtle Lake (pt) 0<br />
Cities<br />
Barron 87<br />
Chetek 5<br />
Cumberland 4<br />
Rice Lake 92<br />
Source: <strong>Wisconsin</strong> Historical Society. Architecture and History Inventory Home Page. http://www. wisconsinhistory.org/ahi/>. 2003.<br />
204 Agricultural, Natural, and Cultural Resources Information
Summary<br />
The Barron County Land Use Plan provides an important foundation and vision for local<br />
land use planning and decisions. In addition, numerous programs at the State and County<br />
level are available to assist local communities in their planning efforts and in the<br />
protection of local agricultural, natural, and cultural resources. Protection of such<br />
resources needs to be balanced with, and can be complementary to, other community<br />
goals as discussed in the Issues & Opportunities, Land Use, and Economic Development<br />
conditions and trends sections.<br />
Agricultural Resources Conditions Summary<br />
• Agriculture is the predominant use of the land in the towns of Barron County. The<br />
2007 assessed agricultural acreage in the County was 262,867 or about 43 percent of<br />
the total land acreage.<br />
• From 1990 to 2007, Barron County lost 87,402 acres of assessed agricultural lands - a<br />
25 percent reduction from 1990. The largest loss of acreage occurred in Vance Creek,<br />
with a decline of 6,479 acres. Other substantial losses occurred in the towns of Stanley<br />
(-5,178), Prairie Farm (-4,945), Sioux Creek (-4,788), Crystal Lake (-4,405), Doyle<br />
(-4,300), Turtle Lake (-4,269), Maple Plain (-4,250), and Prairie Lake (-4,155). The<br />
cities and villages that also saw large agricultural land losses were Turtle Lake (-423),<br />
Dallas (-339), Cameron (-329), and Chetek (-219).<br />
• As a whole, Barron County experienced an increase from 10,964 total parcels of<br />
assessed farmland to 11,226 from 2003 to 2007. At the same time, the county lost<br />
3,433 acres of assessed farmland, or equivalent to 5.4 square miles of assessed<br />
farmland from 2003 to 2007.<br />
• The towns of Oak Grove (15,235), Stanfold (14,988), Maple Grove (14,500), Turtle<br />
Lake (14,083), and Barron (14,011) have the greatest number of agricultural acres. In<br />
comparison, the towns of Bear Lake, Cedar Lake, Lakeland, Maple Plain, and Sumner<br />
all have less than 7,000 acres in agricultural use.<br />
• From 1978 to 2002, the number of farms in Barron County decreased by 12.2 percent<br />
to 1,647, while the average farm size increased slightly to 214 acres.<br />
• Sixty-seven and a half (67.5) percent of the soils in Barron County are classified as<br />
prime farmland.<br />
• Barron County has seen a dramatic increase in the number of direct market farms and<br />
interest and investment in renewable energy, primarily bio-energy, in the past decade.<br />
Natural Resources - Physical Features Conditions Summary<br />
• The topography of Barron County is moderately rolling and increasingly more rugged<br />
in the northwest, north, and extreme eastern portions of the County.<br />
Barron County Conditions and Trends Report 205
• Based on general soil types, 99.6 percent of the County’s land area has severe soil<br />
limitations for septic tank absorption fields. The remaining 0.4 percent of the land area<br />
has slight or moderate limitations.<br />
• Barron County has 64 operating and licensed non-metallic mining sites. There are no<br />
known metallic mineral deposits in sufficient tonnage or quality to warrant extraction.<br />
• Sand and gravel resources are available throughout the county, but are more abundant<br />
near rivers, and in the northwest and northeast portions of the County that has thicker<br />
glacial deposits from the last major glacial advance.<br />
• Barron County has a total surface water area of 18,551 acres, including 369 lakes<br />
(17,748 surface acres). The County’s six lake districts and 13 lake associations are<br />
important stakeholders and managers of a substantial proportion of these surface<br />
waters.<br />
• Barron County is almost entirely in the Lower Chippewa River Basin. A small part of<br />
western and northwestern Barron County lies within the St. Croix River Basin.<br />
• In general, the surface water quality in the Lower Chippewa River and St. Croix River<br />
Basins is good, with eight outstanding resource water bodies and nine exceptional<br />
resource water bodies. Two water bodies, Desair Lake and three miles of Red Cedar<br />
River, are considered impaired due to elevated sediment (Desair only), and<br />
phosphorus levels. Additional water bodies have similar risks, due to high phosphorus<br />
levels in many local soils, if soil erosion should increase.<br />
• The principle sources of groundwater in Barron County are the Sandstone Aquifer and<br />
the Sand and Gravel Aquifer. The Sandstone Aquifer underlies all of Barron County,<br />
while the Sand and Gravel Aquifer underlies only parts of the County.<br />
• Approximately 92 percent of all the water potable used in Barron County is<br />
groundwater. Eight percent is surface water. The quality of groundwater in Barron<br />
County is generally good.<br />
Natural Resources - Sensitive Lands Conditions Summary<br />
• Approximately 6.9 percent of Barron County (38,627 acres) has steep slopes of 20<br />
percent or greater, on which development should be limited or discouraged.<br />
• Combined, agricultural and forest acres account for 62 percent, or 378,858 acres of the<br />
assessed land in the County.<br />
• In 2007, the combined assessed acres in forestland amounted to 115,991 acres or about<br />
19 percent of the total County acreage.<br />
• Assessed forest acreage increased by more than 10,000 acres between 1990 and 2007.<br />
This was about a 10 percent increase. The greatest percentage increases occurred in<br />
the towns of Vance Creek (195 percent), Rice Lake (115 percent), Stanley (70<br />
percent), Dallas (57 percent), Maple Grove (49 percent), and Prairie Farm (48<br />
percent).<br />
206 Agricultural, Natural, and Cultural Resources Information
• Between 1990 and 2007 the towns of Cedar Lake (-23 percent), Lakeland (-21<br />
percent), and Dovre (-21 percent) saw the largest percentage declines in forested<br />
acreage. In 2007, the Town of Sumner had the greatest amount of forested acreage<br />
(8,657 acres) followed by Doyle (7,780) and Maple Plain (7,719). Residential<br />
development of woodlands can fragment wildlife habitat and may impact the viability<br />
of timber production.<br />
• Between 2003 and 2007, there was a reduction of 10,990 acres of assessed forested<br />
land, or 17 square miles, in the unincorporated areas. The noticeable reduction of<br />
assessed forested land could be partially attributed to the change of classification<br />
system designed by the Department of Revenue.<br />
• Barron County is home to 26 animal species, 12 plant species, and 18 natural<br />
communities that are considered rare or endangered. Two species—Karner Blue<br />
Butterfly and Bald Eagle—found in Barron County have Federal protection status.<br />
• Sensitive habitats can be encroached upon or degraded by invasive species. Purple<br />
Loosestrife, Reed Canary Grass, and Eurasian Water-Milfoil are three such invasive<br />
plants that have been found Barron County.<br />
• Barron County has four State Natural Areas managed to protect local plants, animals,<br />
or ecosystems.<br />
• Barron County has four <strong>Wisconsin</strong> Land Legacy Places identified in the draft State<br />
plan: Blue Hills, Haugen-Birchwood Lakeland, Hay River, and Upper Cedar Creek<br />
River.<br />
• Barron County manages five county parks, 15,565 acres of forest, 250 miles of<br />
snowmobile trails, 17 miles of ATV trails, and additional trails for skiing,<br />
snowshoeing, or mountain biking.<br />
• Barron County has 104 miles of trout streams. Of these, 29 miles are Class I; 59 miles<br />
are Class II; and 16 miles are Class III.<br />
• <strong>Wisconsin</strong> Department of Natural Resources manages 5,770 acres in nine different<br />
State Public Wildlife Recreational Lands in the County.<br />
• Barron County is the western originating point for Tuscobia State Trail, the longest in<br />
the state. The Ice Age National Scenic Trail crosses part of northern Barron County,<br />
but is currently not continuous for its entire length within the county.<br />
Cultural Resources Conditions Summary<br />
• There are five places in Barron County on the National Register of Historic Places.<br />
• A total of 258 historic places and objects in Barron County have been identified as<br />
having historic value and are on the <strong>Wisconsin</strong> Architecture and History Inventory.<br />
Barron County Conditions and Trends Report 207
Barron County Natural Resource Map Series<br />
The Barron County Resource and Land Use Atlas DvD-ROM contains resource maps in<br />
Adobe Acrobat .pdf format for Barron County and each municipality. The county-wide<br />
maps are also included within Appendix A at the end of this report. These maps (Maps<br />
5.1 through 5.15) correspond to the previous discussion within the Agricultural, Natural,<br />
and Cultural Resources Information section.<br />
208 Agricultural, Natural, and Cultural Resources Information
6. ECONOMIC DEVELOPMENT INFORMATION<br />
Element Context<br />
Economic development as part of comprehensive planning is the process by which the<br />
Barron County community initiates and generates solutions to local economic problems.<br />
The primary purpose of economic development initiatives is to promote the stabilization,<br />
retention, or expansion of the economic base and to provide quality employment<br />
opportunities in the local governmental unit. This includes assisting existing businesses,<br />
encouraging business expansion, recruiting new businesses, and strategically planning<br />
important capital improvements and related infrastructure expenditures. Such endeavors<br />
should be guided by the vision and goals in county and local comprehensive plans to<br />
encourage efficiency and ensure a positive impact on the community.<br />
These efforts collectively build long-term local economic capacity so the community is<br />
more self-sufficient and able to better weather economic downturns. As successful<br />
economic development endeavors strengthen and diversify local economies, local<br />
businesses may locate in close proximity to the primary industry that supports them.<br />
These secondary or support businesses take advantage of economic spillovers of the<br />
primary industry. A local example of this is the close relationship between the existing<br />
agriculture and food processing industries.<br />
This information should also be considered in the context of the economic development<br />
programs, plans, and tools at work in Barron County and its communities which are<br />
identified in the Addendum: Inventory of Programs, Plans, and Land Use Policies in<br />
<strong>West</strong> <strong>Central</strong> <strong>Wisconsin</strong> compiled by WCWRPC as part of the regional comprehensive<br />
planning effort.<br />
The <strong>Wisconsin</strong> Economy 3<br />
Perhaps more than many comprehensive plan elements, the local economy and economic<br />
development are influenced by regional, State, national, and global factors. As such,<br />
great uncertainty exists when analyzing and forecasting the economy.<br />
3 Unless otherwise noted, the information in this section was largely extracted from the following two<br />
sources: (1) Winters, Dennis, Chief Economist. Department of Workforce Development-Office of<br />
Economic Advisors. Data Dashboard-Statewide Analysis.<br />
. May 1, 2008. (2) <strong>Wisconsin</strong> Department of Revenue-<br />
Division of Research & Policy. <strong>Wisconsin</strong> Economic Outlook. May 2008.<br />
Barron County Conditions and Trends Report 209
Recent Economic Trends<br />
The economy is always in flux, often occurring in cycles or periods of growth, prosperity,<br />
and expansion followed by periods of decline, contraction, or recession. There is no<br />
reliable methodology to predicting such cycles, and some economists argue that these<br />
fluctuations are the result of “shocks” to the economy in terms of productivity or demand<br />
changes, and the use of the term “cycle” is a misnomer.<br />
Gross domestic product is often used to measure economic cycles, though <strong>Wisconsin</strong>’s<br />
Figure 6.1 – Composite Index of Leading Indicators for <strong>Wisconsin</strong> (1990-May 2008)<br />
Composite Index of Leading Indicators<br />
(1994 avg. = 100)<br />
170<br />
160<br />
150<br />
140<br />
130<br />
120<br />
110<br />
100<br />
90<br />
80<br />
70<br />
1990<br />
1991<br />
1992<br />
1993<br />
1994<br />
1995<br />
1996<br />
1997<br />
1998<br />
1999<br />
2000<br />
2001<br />
2002<br />
2003<br />
2004<br />
2005<br />
2006<br />
2007<br />
2008<br />
source: <strong>Wisconsin</strong> Office of Economic Advisors<br />
annual average GDP has been growing quite steadily over the last decade. Instead, in<br />
order to show these economic fluctuations, Figure 6.1 charts the composite index of<br />
leading indicators between 1990 and May 2008 for <strong>Wisconsin</strong>.<br />
Leading economic indicators are based on certain economic activities which foreshadow<br />
a forthcoming economic change. In the case of Figure 6.1, the composite indicator<br />
includes average work week, overtime, job openings, new business starts, and<br />
unemployment compensation claims.<br />
Figure 6.1 reflects that <strong>Wisconsin</strong> strongly felt the economic recession that hit much of<br />
the world in the early 1990s following the October 1987 Black Monday stock market<br />
collapse, the savings and loan crisis, and the 1990 spike in oil prices at the beginning of<br />
the Gulf War. This downturn lagged in <strong>Wisconsin</strong> until 1993-1994.<br />
210 Economic Development Information
The <strong>Wisconsin</strong> economy grew rapidly on the “dot-com bubble” of the mid-to-late 1990s,<br />
as an exuberant market and venture capitalists speculated on the stocks of dot-com<br />
companies during a period of low interest. But in March 2000, the bubble began to burst<br />
and by October 2002, $5 trillion in market value of technology companies had been lost.<br />
This sudden economic decline is very apparent in Figure 6.1. Also about this time,<br />
<strong>Wisconsin</strong> and much of the world entered a period of manufacturing recession which was<br />
particularly felt in our State.<br />
Between 2004 and 2007, job growth in <strong>Wisconsin</strong> was relatively strong and the economy<br />
rebounded, though there was a noticeable shift in the new jobs being created. Much of<br />
this growth was in the services sectors, while the manufacturing industry continued to<br />
struggle with job losses.<br />
The Current Economic Slowdown<br />
Economists are in disagreement over the current extent of the economic slowdown on a<br />
national level and forecasting the economy’s future. But as of May 1, 2008, it was<br />
generally agreed that the U.S. economy overall had not yet entered a period of less than<br />
positive growth.<br />
Two significant factors have largely contributed to our nation’s current economic<br />
situation—the downturn in the housing market and escalating oil prices. As of May<br />
2008, the single-family residential housing sector had not yet hit bottom; and the market<br />
continues to be plagued by high inventories, uncertain prices, and challenges for<br />
mortgage lenders, especially for those engaging in more risky sub-prime lending.<br />
According to the <strong>Wisconsin</strong> Realtors Association, home sales in the first quarter of 2008<br />
were down 24.9 percent from the first quarter of 2007. Home prices in <strong>Wisconsin</strong> held<br />
fairly steady in 2007, though the median home price statewide declined 3.8 percent in the<br />
first quarter of 2008. This decline was still less than half of the 7.7 percent decline<br />
nationwide.<br />
Housing permits in <strong>Wisconsin</strong> have had double-digit annual declines since 2004.<br />
According to the Office of Economic Advisors’ May 2008 Statewide Analysis, “[w]hile<br />
foreclosures are up in the state, <strong>Wisconsin</strong>’s housing sector is not as exposed to the<br />
mortgage/price dilemma as much as other states such as Arizona, California, Florida,<br />
Nevada, and Ohio.” 4 In fact, <strong>Wisconsin</strong> ranked 27 th nationally in foreclosures during the<br />
first quarter of 2008.<br />
4 Ibid.<br />
Barron County Conditions and Trends Report 211
As shown in Figure 6.2 to the<br />
right, gasoline prices have<br />
increased tremendously since<br />
the mid part of this decade.<br />
With the record-breaking<br />
increases in the cost of oil,<br />
retail prices in the U.S.<br />
increased by five percent<br />
between June 2007 and June<br />
2008. 5 Gas prices jumped by<br />
nearly one-third during this<br />
same time period. This<br />
increase in gas and energy<br />
prices has had corresponding<br />
Figure 6.2 - Gasoline & Medical Costs Compared to<br />
Consumer Price Index: All Items<br />
220<br />
190<br />
160<br />
130<br />
100<br />
2001 = 100<br />
All items<br />
Gasoline<br />
Medical<br />
70<br />
2001 2002 2003 2004 2005 2006 2007 2008<br />
source: <strong>Wisconsin</strong> Office of Economic Advisors, May 2008.<br />
increases in food and other commodities, thereby decreasing household purchasing power<br />
and decreasing spending by consumers and businesses. In particular, automotive sales<br />
have been hurt as consumers hold on to their existing vehicles longer or begin to use<br />
alternative modes of transportation. General Motors has announced its intent to close its<br />
Janesville plant, which primarily makes SUVs, resulting in the loss of 2,390 jobs. Major<br />
restructuring and downsizing of airlines are also taking place due to increasing costs,<br />
thereby impacting routes, availability, and shipping.<br />
The May unemployment rate for <strong>Wisconsin</strong> increased from 4.2 percent in 2007 to 4.7<br />
percent in 2008. 6 Yet, the State rate was a full one percent below the national average in<br />
May 2008; and unemployment in <strong>Wisconsin</strong> has risen at a slower rate during the past<br />
year than the national average. Since mid 2007, employment numbers in <strong>Wisconsin</strong> have<br />
been relatively flat, while the employment growth rate has been diminishing since 2004.<br />
Even though unemployment has increased and the housing- and automotive-related<br />
industries have suffered, the previously referenced Office of Economic Advisors’<br />
analysis does state that other sectors in <strong>Wisconsin</strong> are doing relatively well. “The weak<br />
dollar is benefitting exports of machinery, equipment, and agricultural commodities.<br />
Milk and grain prices are at or near record highs, although high feed prices are cutting<br />
into dairy profits.” The report goes on to note that during the previous year, 9,600 new<br />
jobs were created in the service sector, particular in the health-care industry. Business<br />
and professional services showed an annual increase of 1,800 jobs.<br />
The combination of a slowing economy and inflating prices is an added challenge to<br />
address. Interest rate cuts, a primary tool for avoiding an economic recession, can add to<br />
economic pressure. Meanwhile, the reduction in tax revenues related to decreasing<br />
development and new housing starts, combined with quickly escalating gas and<br />
5 Isidore, Chris. CNN Money.com. Inflation: Price Jump Worst Since ’91. June 16,<br />
2008.<br />
6 <strong>Wisconsin</strong> Department of Workforce Development. May 2008 Local Unemployment Rates Announced.<br />
press release. June 25, 2008.<br />
212 Economic Development Information
commodity prices, has created a budgetary conundrum for many state, county, and local<br />
governments.<br />
<strong>Wisconsin</strong>’s Economic Outlook<br />
Forecasting the economy is difficult at best and such projections are based on historical<br />
economic fluctuations, current trends, and a variety of economic indicators. The<br />
<strong>Wisconsin</strong> Economic Outlook report issued by the <strong>Wisconsin</strong> Department of Revenue-<br />
Division of Research and Policy in May 2008 states that the <strong>Wisconsin</strong> economy is<br />
expected to slow for 2009 with the number of jobs slightly decreasing in 2008 and being<br />
steady in 2009. The following is a brief summary of the report’s employment outlook by<br />
some key industry sectors based on the most likely forecast scenario:<br />
Construction - continue to decline to reach bottom by the end of 2008 and<br />
recovering positive growth toward 2010.<br />
Education, Health, Professional, & Business Services - continued growth of 1.6%<br />
to 2.4% for 2008 and 2009.<br />
Trade Transportation & Utilities - mild decreases of 0.2% to 0.5%, then<br />
recovering positive growth in 2010.<br />
Manufacturing – loss of 2% of jobs in 2008 and 2009, 0.2% loss in 2010, then<br />
recovering job growth in 2011.<br />
Natural Resources & Mining – job losses in 2008 and 2009, with growth in 2010.<br />
Leisure & Hospitality – 1.1% decline in 2009, then healthy growth rate thereafter.<br />
Financial Sector – no growth in 2008, slight growth in 2009, then healthy growth<br />
thereafter.<br />
Information Sector – slight declines or no increases until 2011.<br />
Government – 0.6% decline in 2008, slight decrease in 2009, peak in 2010 as the<br />
2010 Census is carried out.<br />
While the economy adjusts, opportunities do arise. Consumers are turning more to fuelefficient<br />
vehicles, and the sale of hybrid vehicles is increasing. Research and<br />
development funding for alternative energy and energy-reducing technology is on the<br />
increase. Greater attention is being given to the planning and use of alternative means of<br />
passenger and commercial transportation. For instance, many public transit and Amtrak<br />
services are setting new records. And increased energy costs have increased attention on<br />
land use patterns, alternative building materials, and other related sustainability concepts.<br />
In response to these trends, the <strong>West</strong> <strong>Central</strong> <strong>Wisconsin</strong> <strong>Regional</strong> Comprehensive Plan,<br />
under development by WCWRPC, will include an energy and sustainability section<br />
analyzing and providing advisory recommendations on how these concepts may be<br />
applied within our region.<br />
Barron County Conditions and Trends Report 213
Barron County Economic Profile<br />
Economic Data<br />
There is a significant amount of background data and information that is available from<br />
various public and private sources that is integrated into this document, including<br />
information from the following sources:<br />
U.S. Census Bureau data<br />
o<br />
o<br />
American Fact Finder Fact Sheets<br />
County Business Patterns<br />
State of <strong>Wisconsin</strong> Department of Administration<br />
o<br />
Demographics Services Center<br />
State of <strong>Wisconsin</strong> Department of Workforce Development<br />
o<br />
o<br />
o<br />
County Workforce Profiles and Snapshots<br />
<strong>Regional</strong> Metrics Benchmarks<br />
Office of Economic Advisors<br />
State of <strong>Wisconsin</strong> Department of Revenue<br />
o<br />
<strong>Wisconsin</strong> Economic Outlook<br />
State of <strong>Wisconsin</strong> Department of Commerce<br />
University of <strong>Wisconsin</strong>-Extension<br />
<strong>West</strong> <strong>Central</strong> <strong>Wisconsin</strong> <strong>Regional</strong> <strong>Planning</strong> Commission (WCWRPC)<br />
o<br />
o<br />
County summaries available at www.wcwrpc.org<br />
Comprehensive Economic Development Strategy<br />
Indiana Business Research Center USA County Profiles<br />
Barron County and other local agencies<br />
Given the wealth of economic data available at the State, regional, county, and local<br />
levels, the plethora of specialized business studies, and the wide variety of economic<br />
models, no such compilation can truly be comprehensive in scope. As such, a<br />
community may need to consider<br />
additional studies focusing on a specific<br />
Relationship to the<br />
issue or topic as their planning efforts Issues & Opportunities Section<br />
proceed. For instance, the Barron<br />
County Economic Development<br />
Corporation sponsored the creation of a<br />
Business Retention and Expansion<br />
Survey in 2005 which offers additional<br />
findings and recommendations on the<br />
retention and expansion of existing<br />
businesses in the County.<br />
Further, there has been no clear<br />
consensus to date in the region on a<br />
single particular data source and those<br />
This section relies heavily on data provided<br />
previously in the issues and opportunities<br />
section (Section 1). The State<br />
Comprehensive <strong>Planning</strong> Law requires that<br />
the issues and opportunities element<br />
includes a variety of economic background<br />
information, including employment<br />
forecasts, educational levels, income levels,<br />
and employment characteristics. As<br />
appropriate, this section refers back to these<br />
data tables instead of repeating them here.<br />
economic indicators which should be used to measure economic vitality, challenges, and<br />
progress, and to allow for comparison between communities and regions. The State of<br />
214 Economic Development Information
<strong>Wisconsin</strong>, through the Department of Workforce Development-Office of Economic<br />
Advisors, has developed <strong>Wisconsin</strong> <strong>Regional</strong> Metrics Benchmarks with a common set of<br />
core economic, demographic, and labor market indicators.<br />
Certain types of economic data and forecasts are only available at a county or regional<br />
level, and inferences must be made as to how it may be applicable for individual<br />
communities. However, earlier in the issues and opportunities section of this report, a<br />
variety of demographic, education, and labor force data tables were provided for Barron<br />
County and its municipalities. This section does not restate the data tables and maps<br />
provided earlier, but, instead, builds upon this data to provide an economic “snapshot” of<br />
Barron County.<br />
Demographic Overview<br />
Describing current demographic trends, including population changes and educational<br />
attainment, are important foundational factors in many economic development initiatives.<br />
The population profile describes the existing and potential labor force that may fill the<br />
jobs located in the region. Educational attainment statistics are a proxy for the general<br />
skill level of the population. And household income allows inferences to be made about<br />
discretionary spending in Barron County as a whole.<br />
Population and Labor Force<br />
As of January 1, 2007, Barron County had an estimated population of 47,551. 7 This is a<br />
5.8 percent increase since 2000, which is a slower rate of growth compared to the region<br />
as a whole. As shown previously in Table 1.3 and Map 1.2, much of County’s recent<br />
population growth has occurred in communities along the Highway 53 corridor and in<br />
lakeshore communities. In particular, the Towns of Cedar Lake, Dovre, Prairie Lake, and<br />
Sumner, and the Village of Cameron saw the largest population percentage increases.<br />
Overall, the Barron County population is stable, with births, deaths, in-migration and outmigration<br />
relatively balanced. Between 2000 and 2025, the <strong>Wisconsin</strong> Department of<br />
Administration has projected that Barron County’s population will increase by 5,041<br />
residents (or 11.2%). 8 However, a comparison of this projection to the 2007 estimate<br />
shows that Barron County has been growing at a faster pace than forecasted in 2003. For<br />
additional population statistics by municipality, please see Tables 1.1 to 1.13 in Section 1<br />
of this report.<br />
Between 1990 and 2000, the County’s median age increased from 34.5 years to 38.8<br />
years. The 2005 University of <strong>Wisconsin</strong>-Extension analysis of Barron County’s labor<br />
market noted that Barron County’s aging population is a significant concern for the future<br />
and will place a greater emphasis on job training in the region. 9 Figure 6.3 provides a<br />
7 <strong>Wisconsin</strong> Department of Administration. Final Population Estimates. January 1, 2007.<br />
8 <strong>Wisconsin</strong> Department of Administration. Final Population Projections. November 25, 2003.<br />
9 Dane, Andrew and Gary Paul Green. Labor Market Conditions in Barron County. University of<br />
<strong>Wisconsin</strong>-Extension. January 12, 2005.<br />
Barron County Conditions and Trends Report 215
visual representation of Barron County’s decreasing labor force size using <strong>Wisconsin</strong><br />
Department of Administration population projections.<br />
Figure 6.3 – Barron County Age/Labor Force Projection (2005-2030)<br />
Population by Age Group<br />
15,000<br />
14,000<br />
13,000<br />
12,000<br />
11,000<br />
10,000<br />
9,000<br />
8,000<br />
7,000<br />
6,000<br />
5,000<br />
2005 2010 2015 2020 2025 2030<br />
Year<br />
source: <strong>Wisconsin</strong> Department of Administration<br />
0-19<br />
20-44<br />
45-64<br />
65+<br />
Age Groups<br />
Currently, most of the Barron County labor force is between the ages of 25 and 54.<br />
Based on current trends, the total number of County residents under the age of 44 is<br />
expected to decrease over the next 30 years, reducing the labor force size. Meanwhile, as<br />
Figure 6.3 shows, the number of residents over the age of 65 nearly doubles. So while<br />
the County’s overall population is expected to increase by nine percent from 2005 to<br />
2030, and the number of seniors requiring services increases dramatically, the size of the<br />
primary workforce (ages 20-64) to support the local economy and provide services will<br />
decrease by six percent. The Office of Economic Advisors’ County Workforce Profiles<br />
are an excellent source of additional insight into the workforces of each <strong>Wisconsin</strong><br />
county and are updated annually.<br />
Housing Market<br />
According to data provided by the US Bureau of the Census, the number of single-family<br />
residential building permits issued in 2001 was 283 compared to 188 in 2006, a 33<br />
percent decrease. Permits for all units decreased even more substantially (62%) from 640<br />
units in 2001 to 244 units in 2006. This was over a $30 million decrease in estimated<br />
value in housing units permitted.<br />
Education<br />
As shown in Table 6.1, of the 2000 Barron County population that is 25 years and over,<br />
82.4 percent had a high school education or higher, and 14.9 percent had a bachelor’s<br />
degree or higher. A significantly higher percentage of County residents had at least some<br />
post-secondary education compared to a decade earlier, but the number of residents with<br />
a Bachelor’s degree or higher still significantly lagged behind the State average.<br />
216 Economic Development Information
Table 6.1 – Barron County Educational Attainment (1990, 2000)<br />
Educational Attainment (residents<br />
Barron County <strong>Wisconsin</strong><br />
25 years or older)<br />
1990 2000 90 to '00 2000<br />
% % % Change %<br />
Less than high school diploma 27.0 17.6 -34.8 15.0<br />
High school graduate 38.9 39.5 1.5 34.6<br />
Some college, no degree 14.8 19.4 31.1 20.6<br />
Associate degree 7.7 8.6 11.7 7.5<br />
Bachelor’s degree or higher 11.8 14.9 26.3 22.5<br />
High school graduate or higher 73.0 82.4 12.9 85.1<br />
source: U.S. Census Bureau, 1990, 2000.<br />
The demand for labor in the region is shifting toward more skilled work, although not as<br />
quickly as some other regions in the State. This trend increases the need for worker<br />
training opportunities. A strong, traditional secondary educational system and a variety<br />
of worker training programs are important factors in economic development.<br />
There are seven K-12 school districts headquartered in Barron County: Barron, Cameron,<br />
Chetek, Cumberland, Prairie Farm, Rice Lake and Turtle Lake. Rice Lake is also home<br />
to the University of <strong>Wisconsin</strong> Center-Barron County and <strong>Wisconsin</strong> Indianhead<br />
Technical College (WITC). These institutions meet many of the training needs for many<br />
Barron County businesses, though select industries may require additional educational<br />
support. In west central <strong>Wisconsin</strong>, University of <strong>Wisconsin</strong> campuses are located in Eau<br />
Claire, River Falls, and Menomonie-Stout, in addition to Superior to the north.<br />
For more detailed data on educational attainment by municipality in Barron County,<br />
please see Table 1.13 in Section 1 of this report.<br />
Income and Wages<br />
Summarizing income statistics yields insight on purchasing power. The 2005 median<br />
household income for Barron County was $40,501, which was 49 th in the State of<br />
<strong>Wisconsin</strong> and 85.9 percent of the State average. Figure 6.4 compares Barron County’s<br />
per capita personal income 10 to State averages. While Barron County is significantly<br />
below the overall State average, it has maintained pace with and remains just below the<br />
State average for non-metropolitan counties.<br />
The income difference compared to the overall State average is due, in part, to the lack of<br />
corporate and administrative offices in the County, translating into fewer high-paying and<br />
professional jobs than entry-level jobs. Adjusted for inflation, the median household<br />
income actually decreased 6.5 percent between 2000 to 2005.<br />
10 Personal income is the income received by persons from all sources.<br />
Barron County Conditions and Trends Report 217
Figure 6.4 – Barron County vs. State Per Capita Personal Income (1997-2006)<br />
$40,000<br />
$35,000<br />
$34,405<br />
$30,000<br />
$29,022<br />
$25,000<br />
$20,000<br />
$24,514<br />
$20,734<br />
$19,643<br />
$27,584<br />
<strong>Wisconsin</strong> (all)<br />
Wisc. (non-metro)<br />
Barron County<br />
$15,000<br />
1997 1998 1999 2000 2001 2002 2003 2004 2005 2006<br />
source: U.S. Department of Commerce – Bureau of Economic Analysis.<br />
As of 1999, the mean retirement income in Barron County was $16,684. About 8.8<br />
percent of individuals in the County were below the poverty level. Of the 2000<br />
population that was 15 years and over (35,968), 21,413 (or 59.5%) were married. For<br />
household income comparisons by municipality, please see Tables 1.21 and 1.22 in<br />
Section 1, respectively.<br />
Overall average annual wages for Barron County increased by 8.2 percent in the six years<br />
from 2001 to 2006 as shown in Table 6.2. The biggest percentage increase was in the<br />
financial activities industry, while manufacturing saw the lowest percentage increase.<br />
For 2004 estimated salary and wages by occupation, please see Table 6.8 later in this<br />
section.<br />
Table 6.2 – Barron County Average Annual Wages by Industry (2001-2006)<br />
for covered employment and wages<br />
Industry 2001 2002 2003 2004 2005 2006<br />
% change<br />
'01-'06<br />
Natural Resources $23,067 $24,585 $23,634 $22,352 $22,762 $23,867 3.5%<br />
Construction $31,041 $29,830 $30,633 $30,617 $31,368 $31,871 2.7%<br />
Manufacturing $33,216 $28,062 $29,423 $31,288 $32,828 $33,819 1.8%<br />
Trade, Transportation, Utilities $19,903 $20,584 $21,138 $22,262 $22,754 $23,304 17.1%<br />
Financial Activities $24,595 $25,787 $28,496 $28,109 $29,360 $31,311 27.3%<br />
Education & Health $28,332 $28,868 $30,003 $30,912 $32,212 $32,871 16.0%<br />
Information $28,088 suppressed $26,876 $27,341 suppressed $30,409 8.3%<br />
Leisure & Hospitality $12,846 $13,073 $13,410 $14,078 $14,698 $14,646 14.0%<br />
Professional & Business Services $26,075 $27,912 $29,173 $31,153 $27,335 $28,673 10.0%<br />
Other Services $18,677 $18,943 $19,527 $19,287 $18,859 $19,676 5.3%<br />
Public Admininistration $23,947 $24,475 $24,923 $25,783 $26,410 $27,024 12.8%<br />
All Industries $25,514 $24,187 $25,063 $26,057 $26,892 $27,608 8.2%<br />
source: <strong>Wisconsin</strong> Department of Workforce Development, Office of Economic Advisors<br />
218 Economic Development Information
Employment Trends<br />
Of Barron County residents 16 years of age and over, 67.6 percent were in the labor force<br />
as of 2006. As the monthly employment rates presented in Figure 6.5 show, Barron<br />
County experiences a significantly higher amount of employment seasonality compared<br />
to State averages, with increased unemployment during the winter months. For example,<br />
in February 2008, the Barron County unemployment rate was 7.7 percent, but this<br />
dropped to 4.4 percent by May 2008 and 5.0 percent by June 2008.<br />
Figure 6.5 – Barron County & <strong>Wisconsin</strong> Monthly Unemployment Rate (1990-June 2008)<br />
not seasonally adjusted<br />
10.0<br />
9.0<br />
Barron County<br />
<strong>Wisconsin</strong><br />
8.0<br />
Unemployment (%)<br />
7.0<br />
6.0<br />
5.0<br />
4.0<br />
3.0<br />
2.0<br />
Lines are averaged<br />
trend lines (polynomial method)<br />
for relative comparison<br />
purposes only.<br />
1990<br />
1990<br />
1991<br />
1992<br />
1993<br />
1993<br />
1994<br />
1995<br />
1996<br />
1996<br />
1997<br />
1998<br />
1999<br />
1999<br />
2000<br />
2001<br />
2002<br />
2002<br />
2003<br />
2004<br />
2005<br />
2005<br />
2006<br />
2007<br />
2008<br />
source: <strong>Wisconsin</strong> Department of Workforce Development, Office of Economic Advisors<br />
Average annual unemployment in Barron County has increased slightly since 2002, while<br />
the State average has decreased. In 2002, Barron County’s average annual<br />
unemployment was 5.4 percent compared to 5.3 percent for the State. In 2007, Barron<br />
County’s annual average unemployment increased to 5.9 percent, while the State average<br />
decreased to 4.9 percent.<br />
Unemployment is not only a reflection of job availability, but total available labor force.<br />
Figure 6.6 shows that the Barron County labor force grew by over 3,500 persons or 17<br />
percent from 1900 to 2001. From 2001 through 2007, however, the total potential labor<br />
force has been stable and decreased slightly, much like the unemployment rate. The total<br />
labor force once again began to increase in 2008, with May 2008 having approximately<br />
800 more persons in the Barron County potential labor force compared to a year earlier.<br />
Barron County Conditions and Trends Report 219
According to the 2005 labor market conditions report, the Barron County labor market<br />
remains tight, with most employers having a difficult time attracting and retaining<br />
qualified workers. 11 The report goes on to note that the most important employee skills<br />
for Barron County employers are attendance/punctuality, productivity, integrity/honesty,<br />
safety awareness, and teamwork.<br />
Figure 6.6 – Barron County Monthly Total Potential Labor Force (1990-June 2008)<br />
not seasonally adjusted<br />
27,000<br />
26,000<br />
Monthly Labor<br />
Force<br />
26,444<br />
Total Potential Labor Force<br />
25,000<br />
24,000<br />
23,000<br />
22,000<br />
21,000<br />
20,000<br />
20,589<br />
Red line is the<br />
averaged<br />
trend line<br />
(polynomial method).<br />
1990<br />
1990<br />
1991<br />
1992<br />
1993<br />
1993<br />
1994<br />
1995<br />
1996<br />
1996<br />
1997<br />
1998<br />
1999<br />
1999<br />
2000<br />
2001<br />
2002<br />
2002<br />
2003<br />
2004<br />
2005<br />
2005<br />
2006<br />
2007<br />
2008<br />
source: <strong>Wisconsin</strong> Department of Workforce Development, Office of Economic Advisors<br />
Table 1.14 in Section 1 provides unemployment statistics for the 1990 and 2000 labor<br />
force by municipality.<br />
11 Ibid.<br />
220 Economic Development Information
Commuting Patterns<br />
Of Barron County workers 16 years of age and over in 2000, 88.1 percent drove to work<br />
alone; and workers had a mean travel time of 19.2 minutes. Figure 6.7 shows that<br />
commuting distances and travel time for Barron County resident workers have been<br />
increasing, especially for those travelling farther, with fewer persons working at home.<br />
Even so, 86 percent of the Barron County resident labor force worked within Barron<br />
County as of 2000.<br />
Figure 6.7 – Barron County Travel Time to Work (1990, 2000)<br />
7,000<br />
6,834<br />
6,906<br />
6,000<br />
6,185<br />
5,784<br />
1990<br />
5,000<br />
2000<br />
# of Commuters<br />
4,000<br />
3,000<br />
2,000<br />
2,118<br />
1,519<br />
2,325<br />
3,183<br />
1,799<br />
3,772<br />
1,000<br />
0<br />
Worked at home < 10 min. 10-19 min. 20-29 min. 30+ min.<br />
Travel Time to Work<br />
source: U.S. Census<br />
Tables 1.18 and 1.19 provide statistics on travel time to work and place of work for the<br />
County and by municipality. Commuting patterns are discussed in greater detail within<br />
the transportation discussion (See Section 3. Transportation).<br />
Barron County Conditions and Trends Report 221
Economic Base<br />
While the previous sub-section focused on general economic indicators for Barron<br />
County, the following information focuses more on the different industry sectors and<br />
occupations which constitute the County’s economic base.<br />
Industry Composition<br />
According to statistics from the US Bureau of Labor Statistics and the US Bureau of<br />
Economic Analysis as of 2006 for Barron County:<br />
about 79% of the jobs were in the private sector<br />
about 28.5% of the jobs were in businesses owned by sole proprietors, rather<br />
than incorporated entities<br />
average earnings per job in sole proprietorships were less than one-half of the<br />
County’s total average earnings per job<br />
As shown in Table 6.3, the retail trade industry has the largest number of establishments<br />
by far, though this number has been stable since the late 1990s. The construction<br />
industry has had the largest number of new establishments between 1998 and 2006, while<br />
the fastest growing industry in terms of new establishments was real estate, rental, and<br />
leasing.<br />
Table 6.3 – Barron County Number of Establishments by Industry (1998-2006)<br />
Industry Code 1998 1999 2000 2001 2002 2003 2004 2005 2006 % change<br />
'98-'06<br />
Forestry, fishing, hunting, and agri. support 8 9 6 9 12 12 7 11 10 25.0%<br />
Mining 2 2 2 1 1 2 2 2 2 0.0%<br />
Utilities 5 5 5 5 5 5 5 5 4 -20.0%<br />
Construction 129 137 137 151 165 159 155 156 170 31.8%<br />
Manufacturing 95 94 96 93 92 96 102 95 95 0.0%<br />
Wholesale trade 65 65 65 65 57 51 52 52 49 -24.6%<br />
Retail trade 253 252 249 252 247 248 253 260 258 2.0%<br />
Transportation & warehousing 56 53 53 52 55 58 60 61 62 10.7%<br />
Information 21 20 20 17 13 15 16 17 18 -14.3%<br />
Finance & insurance 56 58 59 65 65 63 70 70 71 26.8%<br />
Real estate & rental & leasing 29 29 30 31 42 41 38 41 43 48.3%<br />
Professional, scientific & technical services 59 62 59 58 64 59 56 62 62 5.1%<br />
Management of companies & enterprises 3 4 3 4 3 3 3 3 3 0.0%<br />
Admin, support, waste mgt, remediation 45 43 42 52 53 55 54 52 53 17.8%<br />
Educational services 7 8 8 8 8 5 5 5 5 -28.6%<br />
Health care and social assistance 103 99 101 106 112 109 113 117 125 21.4%<br />
Arts, entertainment & recreation 23 19 24 27 28 30 28 28 26 13.0%<br />
Accommodation & food services 148 148 145 147 134 137 139 139 142 -4.1%<br />
Other services (except public administration) 159 160 158 155 157 158 157 162 160 0.6%<br />
Unclassified/Auxillary establishments 8 12 24 17 2 1 1 1 1 -87.5%<br />
Total 1,274 1,279 1,286 1,315 1,315 1,307 1,316 1,339 1,359 6.7%<br />
source: U.S. Census Bureau County Business Patterns<br />
222 Economic Development Information
Employment by Industry<br />
As shown in Table 6.4 below, employment in the services sectors (e.g., professional,<br />
business, education/health, financial) has been growing at a faster rate than the goodsproducing<br />
sectors in Barron County. In fact, manufacturing and construction<br />
employment decreased from 2001 to 2006.<br />
Table 6.4 – Barron County Employment by Industry (2001-2006)<br />
Industry 2001 2002 2003 2004 2005 2006 % change<br />
'01-'06<br />
Natural resources 240 235 249 260 272 264 10.0%<br />
Construction 724 685 684 707 676 663 -8.4%<br />
Manufacturing 6,564 6,443 6,176 5,898 5,643 5,604 -14.6%<br />
Trade, Transportation, Utilities 4,109 4,133 4,122 4,186 4,157 4,237 3.1%<br />
Financial activities 421 498 550 583 598 585 39.0%<br />
Education & Health 3,437 3,508 3,555 3,688 3,734 3,791 10.3%<br />
Information 219 0 231 231 0 230 5.0%<br />
Leisure & Hospitality 2,853 2,934 2,913 3,045 2,994 2,913 2.1%<br />
Professional & Business Services 536 569 573 593 893 850 58.6%<br />
Other services 387 414 406 414 413 433 11.9%<br />
Public Admininistration 1,477 1,462 1,456 1,454 1,453 1,451 -1.8%<br />
All industries 20,966 21,108 20,916 21,058 21,056 21,022 0.3%<br />
source: <strong>Wisconsin</strong> Department of Workforce Development-Office of Economic Advisors<br />
These trends are consistent with the historical employment data provided previously for<br />
Barron County and its municipalities in Tables 1.15 and 1.16. However, while the<br />
historical data is arranged by Standard Industrial Classification (SIC) code, most industry<br />
data available today is organized by the North American Industry Classification System<br />
(NAICS), often making comparisons between newer and older industry data challenging.<br />
Even with decreasing manufacturing employment, manufacturing remains the largest<br />
industry by employment as shown in Figure 6.8. The second largest employment<br />
sector—trade, transportation, and utilities—is service-providing, with retail trade<br />
constituting the largest component. While professional and business services and<br />
financial activities are the faster growing sectors, they still constitute less than ten percent<br />
of Barron County’s total employment.<br />
Barron County Conditions and Trends Report 223
Figure 6.8 – Barron County Employment by Industry (2006)<br />
Information & Other<br />
Services<br />
3%<br />
Prof., Business, & Financial<br />
Services<br />
7%<br />
Public Admininistration<br />
7% Construction & Nat.<br />
Resources<br />
4%<br />
Manufacturing<br />
27%<br />
Leisure & Hospitality<br />
14%<br />
Education & Health<br />
18%<br />
source data:: <strong>Wisconsin</strong> Department of Workforce Development-Office of Economic Advisors<br />
Trade, Transportation,<br />
Utilities<br />
20%<br />
Over 50 percent of Barron County’s manufacturing employment is in six employers<br />
ranked within the top-15 employers in the County (see Table 6.5).<br />
The largest manufacturing employers in Barron County include the Jennie-O Turkey<br />
Store (previously Jerome Foods), which has been the County’s largest employer since<br />
1976, and McCain Foods USA. As of 2004, turkey production alone employs<br />
approximately 1,900 people earning a combined $56.5 million in wages and salaries, with<br />
23,000 turkeys processed daily.<br />
Jennie-O Turkey Store, Barron, WI<br />
224 Economic Development Information
Table 6.5– Barron County Top Employers as of March 2007<br />
(with 100+ employees)<br />
Rank Employer Name Industry Type<br />
Employee<br />
size range<br />
1 Jennie-O Turkey Store Poultry processing 1000+<br />
2 St Croix Casino Casinos, except casino hotels 1000+<br />
3 Rice Lake Public School Elementary & secondary schools 250-499<br />
4 Wal-Mart Discount department stores 250-499<br />
5 Lakeview Medical Center General medical & surgical hospitals 250-499<br />
6 County of Barron Executive & legislative offices, combined 250-499<br />
7 Rice Lake Weighing Systems Inc Scale & balance, except laboratory, mfg. 250-499<br />
8 Barron Memorial Medical Center Inc General medical & surgical hospitals 250-499<br />
9 Coop Educational Service Agency #12 Administration of education programs 250-499<br />
10 Nichols-Homeshield Metal window & door manufacturing 250-499<br />
11 SCI Technology Inc All other plastics product manufacturing 250-499<br />
12 Barron Area School District Elementary & secondary schools 250-499<br />
13 McCain Foods USA Inc Frozen specialty food manufacturing 250-499<br />
14 Mastercraft Industries Inc Wood kitchen cabinet & countertop mfg. 100-249<br />
15 Cumberland Memorial Hospital Inc General medical & surgical hospitals 100-249<br />
16 Johnson Truck Bodies LLC Motor vehicle body manufacturing 100-249<br />
17 First American Enterprises Inc Nursing care facilities 100-249<br />
18 <strong>Wisconsin</strong> Indianhead Technical College Junior colleges 100-249<br />
19 3M Company Abrasive product manufacturing 100-249<br />
20 Ardisam Inc Lawn & garden equipment manufacturing 100-249<br />
21 Menards Home centers 100-249<br />
22 Cumberland School District Elementary & secondary schools 100-249<br />
23 Manpower Temporary help services 100-249<br />
23 City of Chetek Executive & legislative offices, combined 100-249<br />
25 Cameron Public School Elementary & secondary schools 100-249<br />
26 Chetek Public School Elementary & secondary schools 100-249<br />
27 American Excelsior Co Miscellaneous wood product manufacturing 100-249<br />
28 City of Rice Lake Executive & legislative offices, combined 100-249<br />
29 Marketplace Foods Supermarkets & other grocery stores 100-249<br />
30 Parker Hannifin Corp Fluid power valve & hose fitting mfg. 100-249<br />
31 Farm & Fleet Department stores, except discount 100-249<br />
32 McDonald's Limited-service restaurants 100-249<br />
33 <strong>West</strong>aff Temporary help services 100-249<br />
34 Automated Building Components Engineered wood member manufacturing 100-249<br />
34 Saputo Cheese USA Inc Cheese manufacturing 100-249<br />
34 School District of Turtle Lake Elementary & secondary schools 100-249<br />
source: <strong>Wisconsin</strong> Department of Workforce Development-Office of Economic Advisors<br />
The second-largest share of jobs was in retail and wholesale trade which continues to<br />
grow slowly, but steadily. As of 2000, slightly less than 20 percent of jobs in the County<br />
were with retail trade employers who sell groceries, gas, furniture, cars, hardware,<br />
general merchandise, and food and drinks in restaurants and bars. Wal-Mart Stores is<br />
among the 10 largest employers in the County. Many of the jobs with retail trade<br />
employers are seasonal and part time, and contribute to the reason for the low annual<br />
average wage for the industry (see Table 6.6). Barron County collects a 0.5 percent sales<br />
Barron County Conditions and Trends Report 225
tax, and revenue generated from this source has grown from $1,097,745 in 1987 to<br />
$2,834,691 in 2000.<br />
The third-largest share of jobs was with education and health entities. This sector has<br />
been growing strongly. Two school districts, WITC, and CESA #12 are all ranked within<br />
the County’s top 20 employers. Lakeview Medical Center is the County’s largest health<br />
service employer and one of the 10 largest employers in the County along with Barron<br />
Memorial Medical Center. And available employment data does not reflect the April<br />
2008 opening of the Marshfield Clinic Rice Lake Center.<br />
A number of government agencies rank within the top employers, including the St. Croix<br />
Tribal enterprises and Barron County. Just over twenty percent of the wage and salary<br />
jobs in the County in 2000 were institutions classified by government ownership.<br />
Government jobs increased from 2,610 in 1990 to 4,350 in 2000 according to the State<br />
Department of Workforce Development, though these numbers are somewhat misleading<br />
given that they include St. Croix Casino and Hotel in Turtle Lake. As of 2007, public<br />
administration jobs constituted less than ten percent of the County’s employment and<br />
have been decreasing.<br />
As of 2000, about 6.5 percent of<br />
Barron County jobs were in<br />
farming of which 75.3% were<br />
sole proprietors. Agriculture is<br />
an important element of the<br />
economic profile of Barron<br />
County, which ranked seventh<br />
among the State’s 72 counties in<br />
total value of agricultural<br />
products sold in 2002.<br />
However, as discussed<br />
previously in Section 5, the<br />
Town of Dovre Farm, Barron County, WI<br />
number of farms has decreased<br />
dramatically over the last 30 years, while average farm size is increasing. Even with<br />
these changes in agriculture, the Barron County Agriculture Agent indicated that in 2000,<br />
Barron County farmers sold more than $200 million worth of agricultural products,<br />
which has a significant economic impact. In 2002, 79 percent of the total value of<br />
products sold were livestock, poultry, and related products, as opposed to crops and<br />
nursery products.<br />
Of particular note, Barron County ranked first in <strong>Wisconsin</strong> and 12 th in the United States<br />
in the number of livestock turkeys in 2002. The County also ranked 5 th in the State in<br />
forage and in vegetables, melons, and potatoes. The State’s Agriculture Agent has noted<br />
that the $1 billion economic impact of the food processing industry in Barron County is<br />
significantly due to local agricultural activity.<br />
226 Economic Development Information
Employment by Occupation<br />
Like employment by industry, employment by occupation is also difficult to compare<br />
across years due to changing definitions and data-gathering approaches. Employment by<br />
occupation for 1990 and 2000 for each Barron County municipality is included in Table<br />
1.17 in Section 1 of this report. According to the 2000 U.S. Census, of the Barron<br />
County employed civilian population 16 years of age and over (22,583):<br />
26.4% were employed in management, professional, and related occupations<br />
22.4% were in sales and office occupations<br />
23% were in production, transportation, and material moving occupations<br />
Together, these three general occupation categories constitute nearly 72 percent of the<br />
County’s workforce.<br />
Average<br />
Annual<br />
Table 6.6 – <strong>West</strong> <strong>Central</strong> <strong>Wisconsin</strong> WDA Region<br />
Estimated Employment and Salary by Occupation (2004)<br />
2004 % of Total<br />
Occupation<br />
Employ-<br />
Employ-<br />
ment ment Salary<br />
Office and Administrative Support 27,090 15.6% $27,099<br />
Production 21,580 12.4% $28,765<br />
Sales and Related 17,120 9.8% $27,743<br />
Food Preparation and Serving Related 16,870 9.7% $16,748<br />
Transportation and Material Moving 14,670 8.4% $26,349<br />
Education, Training, and Library 11,010 6.3% $39,300<br />
Healthcare Practitioners and Technical 8,580 4.9% $49,793<br />
Construction and Extraction 7,480 4.3% $39,111<br />
Installation, Maintenance, and Repair 6,700 3.9% $34,441<br />
Management 6,070 3.5% $74,714<br />
Healthcare Support 5,830 3.4% $23,325<br />
Business and Financial Operations 5,560 3.2% $48,430<br />
Building and Grounds Cleaning and Maintenance 5,380 3.1% $22,256<br />
Personal Care and Service 4,570 2.6% $19,567<br />
Protective Service 3,260 1.9% $33,184<br />
Architecture and Engineering 2,960 1.7% $55,024<br />
Community and Social Services 2,800 1.6% $38,992<br />
Computer and Mathematical 2,060 1.2% $54,277<br />
Arts, Design, Entertainment, Sports, and Media 1,930 1.1% $33,885<br />
Life, Physical, and Social Science 1,410 0.8% $49,461<br />
Legal 670 0.4% $63,731<br />
Farming, Fishing, and Forestry 270 0.2% $24,922<br />
Total 173,880 100.0% $32,266<br />
<strong>West</strong> <strong>Central</strong> WDA includes Barron, Chippewa Clark, Dunn, Eau Claire, Pepin, Pierce, Polk and St. Croix Counties.<br />
source: <strong>Wisconsin</strong> Department of Workforce Development-Office of Economic Advisors<br />
Barron County Conditions and Trends Report 227
Table 6.6 provides additional insight into the occupations of our area, but this<br />
information is available at a regional scale. Even so, these numbers are similar to the<br />
2000 U.S. Census Bureau occupation statistics for Barron County.<br />
Figure 6.9 – <strong>West</strong> <strong>Central</strong> <strong>Wisconsin</strong><br />
Workforce Development Area<br />
In the <strong>West</strong> <strong>Central</strong><br />
<strong>Wisconsin</strong> Workforce<br />
Development Area (see<br />
Figure 6.9) which includes<br />
Barron County, office and<br />
administrative support and<br />
production are the most<br />
frequent occupations, though<br />
they are below the average<br />
annual salary for the region.<br />
Employment Projections<br />
In November 2003, the<br />
<strong>Wisconsin</strong> Department of<br />
Workforce Development<br />
(WDWD) released a<br />
publication entitled<br />
<strong>Wisconsin</strong> Projections, 2000-<br />
2010. This publication<br />
makes economic projections<br />
for the State regarding the<br />
labor force, industries, and<br />
occupations. This information was further supplemented by ten-year projections (2004-<br />
2014) by regional workforce development area (WDA). This sub-section relies, in large<br />
part, on these WDWD documents.<br />
source: <strong>Wisconsin</strong> Department of Workforce Development-Office of Economic Advisors<br />
Municipal units within Barron County have employment patterns that are similar to the<br />
State. It is anticipated that for the near future, <strong>Wisconsin</strong>’s total population will grow<br />
more slowly while average age will increase more rapidly than the nation as a whole,<br />
leading to lower participation rates in the workforce. <strong>Wisconsin</strong> is also having difficulty<br />
attracting international immigrants and domestic migrants and retaining its own citizens.<br />
<strong>Wisconsin</strong> will continue to face the challenge of filling job openings.<br />
As shown in Table 6.7, the region’s WDA industries that are projected to add the most<br />
jobs from 2004-2014 are education and health services. Ambulatory health case services<br />
jobs alone will grow 36.6 percent, reflecting, in part, our region’s aging demographic.<br />
The number of total jobs in the manufacturing industry is estimated to remain fairly<br />
unchanged during this timeframe. These projections account for anticipated changes in<br />
<strong>Wisconsin</strong>’s economy within the timeframe, though unanticipated events may impact<br />
accuracy.<br />
228 Economic Development Information
Table 6.7<br />
<strong>West</strong> <strong>Central</strong> <strong>Wisconsin</strong> WDA Region Industry Projections (2004-2014)<br />
Industry Title 2004<br />
Estimated<br />
Employment<br />
2014<br />
Projected<br />
Employment<br />
2004-2014<br />
Employment<br />
Change<br />
2004-2014<br />
Percentage<br />
Change<br />
Total Non-Farm Employment 173,880 194,330 20,450 11.8%<br />
Construction/Mining/Natural<br />
Resources<br />
8,380 9,880 1,500 17.9%<br />
Manufacturing 31,990 32,030 40 0.1%<br />
Paper Manufacturing 1,720 1,720 0 0.0%<br />
Plastics and Rubber Products<br />
Manufacturing<br />
Computer and Electronic<br />
Product Manufacturing<br />
3,400 3,670 270 7.9%<br />
3,220 3,020 -200 -6.2%<br />
Trade 28,800 30,900 2,100 7.3%<br />
Food and Beverage Stores 5,040 5,250 210 4.2%<br />
Transportation and Utilities<br />
(Including US Postal)<br />
8,270 9,520 1,250 15.1%<br />
Financial Activities 7,010 7,710 700 10.0%<br />
Education and Health Services<br />
(Including gov’t)<br />
37,330 45,540 8,210 22.0%<br />
Ambulatory Health Care 5,540 7,570 2,030 36.6%<br />
Hospitals (Including gov’t) 7,050 8,640 1,590 22.6%<br />
Leisure and Hospitality 17,300 19,930 2,630 15.2%<br />
Information/Prof Services/Other<br />
Services<br />
Government (Excluding US<br />
Postal, State and Local Educ and<br />
Hospitals)<br />
21,470 24,920 3,450 16.1%<br />
13,310 13,930 620 4.7%<br />
<strong>West</strong> <strong>Central</strong> WDA includes Barron, Chippewa Clark, Dunn, Eau Claire, Pepin, Pierce, Polk and St. Croix Counties.<br />
source: <strong>Wisconsin</strong> Dept. of Workforce Development, Bureau of Workforce Information, 2006<br />
Barron County Conditions and Trends Report 229
Table 6.8 provides the estimated employment by occupation in 2004 and projected<br />
employment occupation for 2014 in the west central WDA. Overall, total employment is<br />
expected to increase by 11.8 percent in the region from 2004 to 2014, with 2,050 new<br />
jobs created annually and 4,300 job replacements annually. The largest increase in the<br />
total number of jobs is expected in the food preparation- and serving-related occupations.<br />
Large employment growth (both total and percentage) is also expected in the health care<br />
practitioners and related technical occupations. Notably, these two occupation groups<br />
have very different salary and wage estimates.<br />
Table 6.8 – <strong>West</strong> <strong>Central</strong> <strong>Wisconsin</strong> WDA Region Occupation Projections and Estimated Wages<br />
(2004-2014)<br />
Estimated Employment (<br />
Estimated Average<br />
Annual Openings<br />
Average<br />
Annual<br />
Salary<br />
<strong>West</strong> <strong>Central</strong> WDA includes Barron, Chippewa Clark, Dunn, Eau Claire, Pepin, Pierce, Polk and St. Croix Counties.<br />
source: <strong>Wisconsin</strong> Dept. of Workforce Development – Office of Economic Advisors<br />
Estimated Salary and Wages<br />
(2005)<br />
Entry<br />
Level Experienced<br />
Hourly Hourly<br />
Wage Wage<br />
Occupational Title<br />
2004 2014 Change<br />
%<br />
Change<br />
New<br />
Jobs<br />
Replacements<br />
Total<br />
Management 6,070 6,860 790 13.0% 80 110 190 $74,714 $18.55 $44.61<br />
Business and Financial Operations 5,560 6,530 970 17.4% 100 100 200 $48,430 $13.84 $28.01<br />
Computer and Mathematical 2,060 2,570 510 24.8% 50 30 80 $54,277 $16.17 $31.06<br />
Architecture and Engineering 2,960 3,230 270 9.1% 30 70 100 $55,024 $16.79 $31.29<br />
Life, Physical, and Social Science 1,410 1,640 230 16.3% 20 30 50 $49,461 $14.58 $28.38<br />
Community and Social Services 2,800 3,300 500 17.9% 50 50 100 $38,992 $12.79 $21.73<br />
Legal 670 780 110 16.4% 10 10 20 $63,731 $13.59 $39.17<br />
Education, Training, and Library 11,010 12,740 1,730 15.7% 170 240 410 $39,300 $10.82 $22.93<br />
Arts, Design, Entertainment, Sports, and Media 1,930 2,190 260 13.5% 30 40 70 $33,885 $8.74 $20.06<br />
Healthcare Practitioners and Technical 8,580 10,920 2,340 27.3% 230 160 390 $49,793 $11.44 $30.19<br />
Healthcare Support 5,830 7,510 1,680 28.8% 170 90 260 $23,325 $8.91 $12.37<br />
Protective Service 3,260 3,480 220 6.7% 20 100 120 $33,184 $9.02 $19.42<br />
Food Preparation and Serving Related 16,870 19,260 2,390 14.2% 240 670 910 $16,748 $5.91 $9.12<br />
Building and Grounds Cleaning and Maintenance 5,380 6,290 910 16.9% 90 110 200 $22,256 $7.26 $12.42<br />
Personal Care and Service 4,570 5,640 1,070 23.4% 110 110 220 $19,567 $6.80 $10.71<br />
Sales and Related 17,120 18,320 1,200 7.0% 120 610 730 $27,743 $6.74 $16.64<br />
Office and Administrative Support 27,090 28,170 1,080 4.0% 110 640 750 $27,099 $8.57 $15.26<br />
Farming, Fishing, and Forestry 270 300 30 11.1%
is based on the greatest percent change in employment; for example, an occupation that<br />
increases from 5 to 10 jobs increased 100 percent whereas an occupation that increases<br />
from 2,000 to 2,200 jobs increased only 10 percent. A 2005 UW-Extension study states<br />
that the largest demand in the region continues to be for assemblers, processors, and<br />
laborers. 12<br />
Table 6.9 - <strong>West</strong> <strong>Central</strong> <strong>Wisconsin</strong> WDA Region Occupation Projections (2014)<br />
Typically Required<br />
Top 10 Occupations<br />
Education/Training<br />
Fastest Growth<br />
Most Openings<br />
Average<br />
Wage<br />
Home Health Aides 1-month on-the-job training $9.29<br />
Medical Assistants 1-12 mo. on-the-job training $12.63<br />
Network and Data Analysts Bachelor’s degree $22.19<br />
Computer Software Engineers,<br />
Applications<br />
Bachelor’s degree $37.08<br />
Personal and Home Care Aides 1-month on-the-job training $8.82<br />
Dental Assistants 1-12 mo. on-the-job training $12.50<br />
Dental Hygienists Associate degree $23.34<br />
Employment, Recruitment &<br />
Placement<br />
Bachelor’s degree $19.67<br />
Medical Records & Health Information Associate degree $12.71<br />
Occupational Therapists Master’s degree $25.53<br />
Cashiers 1-month on-the-job training $7.64<br />
Retail Salespersons 1-month on-the-job training $11.06<br />
Comb Food Prep/Serv Wrk/Incl Fast 1-month on-the-job training $7.04<br />
Waiters/Waitresses 1-month on-the-job training $7.34<br />
Registered Nurses<br />
Labrs/Frght/Stock/Material<br />
Movers/Handlers<br />
Janitors/Cleaners, except<br />
Maids/Housekeeping<br />
Associate’s or Bachelor’s<br />
degree<br />
$25.83<br />
1-month on-the-job training $10.09<br />
1-month on-the-job training $10.67<br />
Team Assemblers 1-12 mo. on-the-job training $12.94<br />
Stock Clerks/Order Fillers 1-month on-the-job training $9.47<br />
Bartenders 1-month on-the-job training $8.16<br />
<strong>West</strong> <strong>Central</strong> WDA includes Barron, Chippewa Clark, Dunn, Eau Claire, Pepin, Pierce, Polk and St. Croix Counties.<br />
source: <strong>Wisconsin</strong> Dept. of Workforce Development, Bureau of Workforce Information, 2006<br />
12 Ibid.<br />
Barron County Conditions and Trends Report 231
Tourism<br />
Barron County offers a wide variety of<br />
natural, historical, and other tourist<br />
amenities and attractions as reflected in part<br />
by the substantial number of seasonal<br />
housing units in some areas. Visitors can<br />
enjoy attractions typical of <strong>Wisconsin</strong>’s<br />
Northwoods, which also boasts the scenic<br />
Barron Blue Hills, a vestige of an ancient<br />
mountain range left by glaciers of times<br />
long past. Twenty-two lakes and the Red<br />
Cedar River provide access for boating and<br />
canoeing, along with opportunities for<br />
fishing and picnicking on these and other<br />
Pioneer Village, Cameron, WI<br />
smaller water bodies. Numerous county and<br />
municipal parks, trail systems, rustic roads (3), wildlife areas, campgrounds/resorts, golf<br />
courses (10), and public hunting grounds offer a variety of places to play, picnic, hike,<br />
lodge, and enjoy the outdoors. And with over 250 miles of snowmobile trails and many<br />
cross-country ski trails, Barron County is a year-round destination. Many of these<br />
outdoor recreational assets are inventoried in the community facilities and natural<br />
resources sections of this report.<br />
Travelers also can experience the area’s history through museums and historical sites,<br />
such as the Pioneer Village Museum, Calhoun Memorial Museum, Isle of Happy Days,<br />
and Pipestone Quarry, or explore the County’s many antique stores and specialty shops.<br />
And many, many more contemporary attractions are also available, such as Czeska Opera<br />
House, Hydroflites Water Ski Team, Blaser’s Alpine Cheese House, Viking Brewery,<br />
Rice Lake Speedway, and St. Croix Casino.<br />
The Economic Impact of Expenditures by<br />
Travelers on <strong>Wisconsin</strong> 2007, compiled<br />
by Davidson-Peterson & Associates,<br />
provides insight into the positive<br />
economic impacts of tourism on the<br />
Barron County economy. As shown in<br />
Figure 6.10, traveler expenditures in<br />
Barron County increased by 61 percent in<br />
the ten years between 1998 and 2007.<br />
St. Croix Casino, Turtle Lake, WI<br />
232 Economic Development Information
Figure 6.10 Traveler Expenditures in Barron County (1998 to 2007)<br />
$120,000,000<br />
$110,000,000<br />
$100,000,000<br />
$90,000,000<br />
$80,000,000<br />
$70,000,000<br />
$60,000,000<br />
$50,000,000<br />
1998 1999 2000 2001 2002 2003 2004 2005 2006 2007<br />
source: Davidson-Peterson & Associates. Economic Impact of Expenditures by Travelers on <strong>Wisconsin</strong> 2007.<br />
In 2007, travelers spent an estimated $109 million in Barron County, ranking the County<br />
32 nd in the State for traveler spending. This was over a $41-million increase from the<br />
amount spent ten years earlier. The study goes on to estimate that employees in Barron<br />
County earned $43 million in wages generated from traveler spending, supporting an<br />
estimated 3,372 full-time equivalent jobs. Additionally, an estimated $5.5 million in<br />
local revenues (e.g., sales taxes, property taxes) were collected in 2007 as a result of<br />
travelers in Barron County.<br />
As Figure 6.11 shows, tourism is<br />
an important year-round<br />
contributor to the Barron County<br />
economy with 15 percent of<br />
traveler expenditures made during<br />
the winter, 18 percent during the<br />
spring, 41 percent during the<br />
summer, and 26 percent in the fall<br />
in 2007.<br />
Figure 6.11 Seasonality of Traveler Expenditures<br />
in Barron County (2007)<br />
41%<br />
26%<br />
18%<br />
15%<br />
For more information on the many<br />
tourism opportunities in Barron<br />
County, please visit the Barron<br />
County Economic Development<br />
Winter Spring Summer Fall<br />
source: Davidson-Peterson & Associates. Economic Impact of<br />
Expenditures by Travelers on <strong>Wisconsin</strong> 2007.<br />
Barron County Conditions and Trends Report 233
Corporation website, 13 which includes an on-line version of their tourism publication<br />
entitled “Uniquely-Barron County.”<br />
Environmentally Contaminated Sites<br />
The State Comprehensive <strong>Planning</strong> Law (§66.1001) states that the economic<br />
development element “shall also evaluate and promote the use of environmentally<br />
contaminated sites for commercial or industrial uses.”<br />
Barron County has no hazardous waste sites eligible for long-term remedial action<br />
financed under the federal Superfund program. However, numerous smaller leaking<br />
underground storage tank, environmental repair, and spill sites are located throughout the<br />
County. The <strong>Wisconsin</strong> Bureau for Remediation and Redevelopment Tracking System<br />
(BRRTS) provides an inventory of the contaminated properties and other activities<br />
related to the investigation and cleanup of contaminated soil or groundwater in<br />
<strong>Wisconsin</strong>.<br />
Table 6.10 at the end of this section is a list of the 212 sites in Barron County where<br />
contamination has occurred requiring significant attention, 14 including closed sites where<br />
clean-up has been completed. Of these, 73 percent (or 154) are associated with leaking<br />
underground storage tanks (LUSTs). Twenty-seven percent (or 57) are environmental<br />
repair (ERP) sites which have contaminated soil or groundwater requiring long-term<br />
attention from non-LUST activities, such as industrial spills, dumping, buried containers,<br />
and landfills. As could be expected, the largest concentration of these sites (79) was<br />
located within the City of Rice Lake. The City of Barron had the next largest number of<br />
sites with 31. Many, if not most, of the sites identified in Table 6.10 may currently be in<br />
active use and may not be available for redevelopment activities. Further, communities<br />
will need to consider the appropriateness and land use compatibility of the redevelopment<br />
of such sites for commercial or industrial use.<br />
Redevelopment opportunities are not limited to contaminated sites, however. Local<br />
comprehensive planning efforts may need to identify those deteriorating structures and<br />
under-utilized properties within their communities which have potential for re-use.<br />
13 www.barroncounty.com<br />
14 Table 6.10 excludes abandoned containers and spills for which no discharge to the environment has been<br />
identified or were cleaned up quickly.<br />
234 Economic Development Information
Summary<br />
The data presented in this report should be kept in mind as communities develop their<br />
economic development strategies. This information can highlight certain weaknesses to<br />
be mitigated, as well as existing and potential opportunities to encourage economic<br />
growth and diversification.<br />
For convenience, here are some of the highlights of the economic development section:<br />
The Barron County economy is impacted by regional, State, national, and<br />
international decisions and fluctuations. At the State level, growth has slowed,<br />
while the price of gas and commodities has inflated. Home purchases and new<br />
home construction in <strong>Wisconsin</strong> have also decreased in recent years, though<br />
foreclosure rates remain well below national averages.<br />
Barron County’s population has grown at a faster rate than originally anticipated.<br />
Growth has especially been strong in those communities with lakeshores and<br />
along US Highway 53. The County’s aging population is a labor force concern<br />
for the future.<br />
There is increasing demand for skilled workers, though the post-secondary<br />
educational attainment of County residents is significantly below the State<br />
average.<br />
Average per capita personal income remains well below the overall State average,<br />
but is only slightly below the State average for non-metropolitan areas.<br />
Barron County’s unemployment is typically above the State average with more<br />
seasonal fluctuations. Unemployment dropped to 4.5% in May 2008, and Barron<br />
County was better off than most counties in the State at the time.<br />
86% of the County’s labor force works within the County, though the resident<br />
labor force is commuting longer distances.<br />
26.4% of the potential labor force is employed in management, professional, and<br />
related occupations; 22.4% are in sales and office occupations; and 23% are in<br />
production, transportation, and material moving occupations.<br />
31% of employment in the County was in manufacturing, followed by education,<br />
health, and social services with 18%<br />
The education and health services industry is expected to have the largest increase<br />
in jobs (+22%) from 2004 to 2014 in our region.<br />
The overall number of manufacturing jobs in the region is expected to remain<br />
fairly unchanged between 2004 and 2014.<br />
The food services and the health care practitioners/technicians occupations are<br />
expected to have the greatest total number of job increases in the region from<br />
2004 to 2014.<br />
Barron County Conditions and Trends Report 235
Tourism in Barron County is strongly connected to its many natural resources, the<br />
access provides via U.S. Highway 53, and its proximity to the Twin Cities.<br />
The State BRRTS database includes 212 sites in Barron County which have had<br />
significant contamination, though many of these sites have been remediated and<br />
are now closed. Environmentally contaminated sites are sometimes left vacant<br />
and deteriorating following remediation and offer opportunities for<br />
redevelopment. Communities may identify other redevelopment opportunities at<br />
locations which are not contaminated, but may be vacant or deteriorating.<br />
In response to economic conditions and goals, there are a variety of economic<br />
development tools that are available to municipalities, including tax incentives, creative<br />
financing and loan guarantees, and business incubator industrial parks. As shown in<br />
Addendum: Inventory of Programs, Plans, and Land Use Policies in <strong>West</strong> <strong>Central</strong><br />
<strong>Wisconsin</strong>, communities and economic development agencies have been very active in<br />
utilizing many of these tools and programs. This list is not all-inclusive and communities<br />
may have additional community-specific reports and services. For instance, Barron<br />
County Economic Development Corporation maintains an annual Integrated Marketing<br />
Communication Plan which should be considered as County and local economic<br />
development plan sections are developed.<br />
In numerous cases, these programs will prove more accessible as municipalities band<br />
together with other organizations and jurisdictions to collaborate and mutually pursue<br />
economic development efforts. Such collaboration will maximize a municipality’s ability<br />
to catalyze additional investment and meet shared economic development goals.<br />
236 Economic Development Information
Table 6.10 – Contaminated Sites in Barron County (open & closed)<br />
ACTIVITY STATUS LOCATION MUNICIPALITY<br />
ERP CLOSED ALMENA COOP ASSN ALMENA<br />
ERP CLOSED COUNTRY PRIDE COOP BULK PLT ALMENA<br />
ERP CONDITIONALLY CLOSED ALMENA AG CENTER INC - ALMENA ALMENA<br />
ERP OPEN ALMENA AG CTR ALMENA<br />
LUST CLOSED COUNTRY PRIDE COOP ALMENA<br />
LUST CLOSED ALMENA COOP SPORT & CONVENIENCE ALMENA<br />
LUST CLOSED ALMENA AG CTR ALMENA<br />
LUST CLOSED GREGS EXCAVATING INC ALMENA<br />
ERP CLOSED <strong>BARRON</strong> CNTY HWY SHOP <strong>BARRON</strong><br />
ERP CLOSED FAIRVIEW GROWING FARM <strong>BARRON</strong><br />
ERP CLOSED KOSER IRON WORKS INC <strong>BARRON</strong><br />
ERP CLOSED <strong>BARRON</strong> LIGHT & WATER <strong>BARRON</strong><br />
ERP CLOSED <strong>BARRON</strong> FARMERS UNION COOP <strong>BARRON</strong><br />
ERP OPEN <strong>BARRON</strong> CTY LF <strong>BARRON</strong><br />
ERP OPEN OLSON OIL CO <strong>BARRON</strong><br />
ERP OPEN <strong>BARRON</strong> CTY OLD GENERATING FACILITY <strong>BARRON</strong><br />
ERP OPEN AMOCO BULK PLT (FORMER) <strong>BARRON</strong><br />
ERP OPEN <strong>BARRON</strong> FARMERS UNION COOP <strong>BARRON</strong><br />
ERP OPEN <strong>BARRON</strong> FARMERS UNION COOP-<strong>BARRON</strong> <strong>BARRON</strong><br />
LUST CLOSED KORNER STOP <strong>BARRON</strong><br />
LUST CLOSED <strong>BARRON</strong> FARMERS UNION <strong>BARRON</strong><br />
LUST CLOSED FOREMOST FARMS USA <strong>BARRON</strong><br />
LUST CLOSED <strong>BARRON</strong> SCHOOL BUS GARAGE <strong>BARRON</strong><br />
LUST CLOSED SCAPYAK, BETTY RESIDENCE <strong>BARRON</strong><br />
LUST CLOSED <strong>BARRON</strong> FARMERS UNION COOP <strong>BARRON</strong><br />
LUST CLOSED HOLIDAY STATION STORES #170 <strong>BARRON</strong><br />
LUST CLOSED <strong>BARRON</strong> MUTUAL INSURANCE CO <strong>BARRON</strong><br />
LUST CLOSED <strong>BARRON</strong> ELECTRIC COOP <strong>BARRON</strong><br />
LUST CLOSED <strong>BARRON</strong> SALES & SERVICE <strong>BARRON</strong><br />
LUST CLOSED JEROME FOODS SITE B <strong>BARRON</strong><br />
LUST CLOSED JEROME HATCHERY BLDG <strong>BARRON</strong><br />
LUST CLOSED RITCHIE AUTO <strong>BARRON</strong><br />
LUST CLOSED PURE OIL STATION <strong>BARRON</strong><br />
LUST CLOSED BANK OF <strong>BARRON</strong> <strong>BARRON</strong><br />
LUST CLOSED FEDERATED COOP TRANSPORT <strong>BARRON</strong><br />
LUST CLOSED <strong>BARRON</strong> CNTY SHERIFFS DEPT <strong>BARRON</strong><br />
LUST CLOSED AUTO STOP <strong>BARRON</strong><br />
LUST OPEN <strong>BARRON</strong> FARMERS COOP <strong>BARRON</strong><br />
LUST OPEN <strong>BARRON</strong> SALES & SERVICE <strong>BARRON</strong><br />
LUST CLOSED BOS HENRY <strong>BARRON</strong>ETT<br />
LUST CLOSED AMPI - BRILL BRILL<br />
ERP CLOSED NORTHLAND FS COOP CAMERON<br />
ERP CLOSED DONS REPAIR CAMERON<br />
ERP OPEN FOUR SEASONS FS - CAMERON CAMERON<br />
LUST CLOSED IC EXPRESS CAMERON<br />
LUST CLOSED MATHY CONST C0 MONARCH PAVING CAMERON<br />
LUST CLOSED EBNER BOX CO CAMERON<br />
LUST CLOSED NORTHLAND FS COOP CAMERON<br />
LUST CLOSED CAMERON CAR CORNER CAMERON<br />
LUST OPEN CAMERON HARDWARE CAMERON<br />
LUST CLOSED LOCH LOMOND BEACH CLUB CEDAR LAKE<br />
ERP CLOSED RIDGELAND CHETEK COOP CHETEK<br />
ERP CLOSED CHETEK COOP INC CHETEK<br />
ERP CLOSED NSPW-CHETEK CHETEK<br />
ERP CLOSED BASIC FARM SERVICE-CHETEK CHETEK<br />
ERP OPEN CHETEK CTY SHOP CHETEK<br />
LUST CLOSED PRO SERVICE CHETEK<br />
LUST CLOSED RIDGELAND CHETEK COOP - CARDTROL CHETEK<br />
LUST CLOSED KWIK TRIP #602 CHETEK<br />
LUST CLOSED GAS PLUS CHETEK<br />
LUST CLOSED <strong>BARRON</strong> CNTY HWY DEPT CHETEK<br />
LUST CLOSED RIDGELAND CHETEK COOP CHETEK<br />
Barron County Conditions and Trends Report 237
Table 6.10 – Contaminated Sites in Barron County (open & closed)<br />
continued<br />
ACTIVITY STATUS LOCATION MUNICIPALITY<br />
LUST OPEN BRYANT, JIM RESIDENCE CLAYTON<br />
LUST OPEN BENTS MOTORS INC COMSTOCK<br />
ERP OPEN CRYSTAL LAKE TN LF - #1457* CRYSTAL LAKE<br />
ERP CLOSED COUNTRY PRIDE COOP CUMBERLAND<br />
ERP CLOSED JORDON J C RESIDENCE CUMBERLAND<br />
ERP CLOSED LABBES PETROLEUM CUMBERLAND<br />
ERP CONDITIONALLY CLOSED 1230 CENTRAL CAFE (FORMER) CUMBERLAND<br />
ERP OPEN COUNTRY PRIDE COOP CUMBERLAND<br />
ERP OPEN COUNTRY PRIDE COOP CUMBERLAND<br />
ERP OPEN CUMBERLAND CTY LF - #0159* CUMBERLAND<br />
ERP OPEN IRWIN INDUSTRIAL TOOL CO FORMER CUMBERLAND<br />
ERP OPEN COUNTRY PRIDE COOPERATIVE-CUMBERLAND CUMBERLAND<br />
LUST CLOSED IC EXPRESS/CUMBERLAND CUMBERLAND<br />
LUST CLOSED SMOKIES PIT STOP CUMBERLAND<br />
LUST CLOSED NORTH COUNTRY LIQUOR CUMBERLAND<br />
LUST CLOSED SENECA FOODS CORP CENTRAL DIV CUMBERLAND<br />
LUST CLOSED CIRCLE C CUMBERLAND<br />
LUST CLOSED CUMBERLAND MUNICIPAL - HWY P CUMBERLAND<br />
LUST CLOSED CUMBERLAND MUNICIPAL UTILITIES CUMBERLAND<br />
LUST CLOSED AUTO STOP CUMBERLAND<br />
LUST CLOSED CUMBERLAND MUNICIPAL AIRPORT CUMBERLAND<br />
LUST CLOSED AT&T CUMBERLAND NWD CUMBERLAND<br />
LUST CLOSED TALBOT CHEV OLDS BUICK CUMBERLAND<br />
LUST CLOSED ROMAR LTD CUMBERLAND<br />
LUST CLOSED LAKESIDE STATION CUMBERLAND<br />
LUST CLOSED CUMBERLAND CTY GARAGE CUMBERLAND<br />
LUST OPEN COUNTRY PRIDE COOP CUMBERLAND<br />
LUST OPEN HOLIDAY STATION STORE #32 CUMBERLAND<br />
ERP CLOSED LENTZ FARMS - DALLAS DALLAS<br />
LUST CLOSED BERGS TRUCKING DALLAS<br />
LUST CLOSED RIDGELAND CHETEK COOP DALLAS<br />
ERP CLOSED CHETEK WAYSIDE DOVRE<br />
LUST OPEN LOREN WIESNER INC DOYLE<br />
ERP CLOSED MATHY CONST CO BRUHA PIT HAUGEN<br />
LUST CLOSED HAUGEN OIL HAUGEN<br />
ERP CLOSED CUMBERLAND COOP BULK TANK LAKELAND<br />
LUST CLOSED MAPLE PLAIN TN SHOP MAPLE PLAIN<br />
LUST OPEN AMUNDSONS SERVICE PRAIRIE FARM<br />
LUST CLOSED OUTERS RESORT PRAIRIE LAKE<br />
LUST CLOSED PRAIRIE LAKE TN SHOP PRAIRIE LAKE<br />
ERP CLOSED RICE LAKE CENEX COOP RICE LAKE<br />
ERP CLOSED SHIELD AVE BARRELS RICE LAKE<br />
ERP CLOSED KLEENAIR DISPOSAL RICE LAKE<br />
ERP CLOSED KLEENAIR VACUUM RICE LAKE<br />
ERP CLOSED LEMLER LF RICE LAKE CTY RICE LAKE<br />
ERP CLOSED RICE LAKE CTY LF RICE LAKE<br />
ERP CLOSED MASTERCRAFT INDUSTRIES INC RICE LAKE<br />
ERP CLOSED JOHNSON REFRIGERATION TRUCK BODIES LLC RICE LAKE<br />
ERP CLOSED INDIANHEAD OIL CO BULK PLT RICE LAKE<br />
ERP CLOSED LARSON OIL RICE LAKE<br />
ERP CLOSED SIMPSON LARRY PROPERTY RICE LAKE<br />
ERP CLOSED JOHNSON REFRIGERATION TRUCK BODIES LLC RICE LAKE<br />
ERP CLOSED DON THE MUFFLER MAN RICE LAKE<br />
ERP OPEN AUTO GLASS SPECIALISTS RICE LAKE<br />
ERP OPEN SNYDER, CECIL PROPERTY RICE LAKE<br />
ERP OPEN HENRY REPEATING ARMS RICE LAKE<br />
LUST CLOSED RAINBOW HOME CENTER RICE LAKE<br />
LUST CLOSED KUNDEL IRREVOCABLE TRUST RICE LAKE<br />
LUST CLOSED RICE LAKE AIRPORT (FORMER) RICE LAKE<br />
LUST CLOSED DON JOHNSON MOTORS RICE LAKE<br />
LUST CLOSED HYMAN FREIGHTWAYS RICE LAKE<br />
LUST CLOSED ROUND TOWNER BUS GARAGE RICE LAKE<br />
238 Economic Development Information
Table 6.10 – Contaminated Sites in Barron County (open & closed)<br />
continued<br />
ACTIVITY STATUS LOCATION MUNICIPALITY<br />
LUST CLOSED SPUR STATION 1674 (FORMER) RICE LAKE<br />
LUST CLOSED RICE LAKE CTY STREET DEPT RICE LAKE<br />
LUST CLOSED RAINBOW HOME CENTER RICE LAKE<br />
LUST CLOSED RICE LAKE CTY LF RICE LAKE<br />
LUST CLOSED ARNOLDS MOBIL RICE LAKE<br />
LUST CLOSED AMPI RICE LAKE<br />
LUST CLOSED BERGERONS SPECIALTY STORE RICE LAKE<br />
LUST CLOSED BOBS REPAIR SERVICE RICE LAKE<br />
LUST CLOSED METZ BAKING CO RICE LAKE<br />
LUST CLOSED JOHNSON REFRIGERATION TRUCK BODIES LLC RICE LAKE<br />
LUST CLOSED SPUR STATION 1674 (FORMER) RICE LAKE<br />
LUST CLOSED COE DALRYMPLE HEATHMAN SC RICE LAKE<br />
LUST CLOSED LAKEVIEW MEDICAL CENTER RICE LAKE<br />
LUST CLOSED COOPER ENGINEERING CO INC RICE LAKE<br />
LUST CLOSED VONASEK & SCHIEFFER CONST CO RICE LAKE<br />
LUST CLOSED MASTERCRAFT INDUSTRIES INC RICE LAKE<br />
LUST CLOSED RONS AUTO BODY RICE LAKE<br />
LUST CLOSED UW <strong>BARRON</strong> CENTER RICE LAKE<br />
LUST CLOSED RICE LAKE CTY STREET DEPT RICE LAKE<br />
LUST CLOSED RICE LAKE CTY UTILITY RICE LAKE<br />
LUST CLOSED DAVID ALDERMAN EZ STOP RICE LAKE<br />
LUST CLOSED WILLIAMS WELDING RICE LAKE<br />
LUST CLOSED GUSTAFSON ICE CREAM CO RICE LAKE<br />
LUST CLOSED BIRCHWOOD MFG CO RICE LAKE<br />
LUST CLOSED S&J SMITH CORP RICE LAKE<br />
LUST CLOSED OWENS & SKAR TRUCKING RICE LAKE<br />
LUST CLOSED WI ARMY NATL GUARD RICE LAKE RICE LAKE<br />
LUST CLOSED INDIANHEAD OIL RICE LAKE<br />
LUST CLOSED LAZY A RANCH RICE LAKE<br />
LUST CLOSED REICHS SERVICE RICE LAKE<br />
LUST CLOSED UNITED PARCEL SERVICE RICE LAKE<br />
LUST CLOSED WI DOT RICE LAKE RICE LAKE<br />
LUST CLOSED WIESNER, LOREN INC RICE LAKE<br />
LUST CLOSED INDIANHEAD TECHNICAL COLLEGE RICE LAKE<br />
LUST CLOSED SPEEDWAY 4247 (FORMER) RICE LAKE<br />
LUST CLOSED DEMERS, LEROY RICE LAKE<br />
LUST CLOSED HOLIDAY STATION #169 RICE LAKE<br />
LUST CLOSED WICK, JOHN RESIDENCE RICE LAKE<br />
LUST CLOSED RIVERSIDE ARMS RICE LAKE<br />
LUST CLOSED F & F AUTO RICE LAKE<br />
LUST CLOSED HARDYS LIQUOR STORE RICE LAKE<br />
LUST OPEN NORTHWEST TRANSPORT RICE LAKE<br />
LUST OPEN RICE LAKE FARMERS UNION COOP RICE LAKE<br />
LUST CLOSED SIOUX CREEK SHOP SIOUX CREEK<br />
ERP CLOSED DARLING DELAWARE STANLEY<br />
ERP OPEN <strong>BARRON</strong> CNTY LF - #01887 STANLEY<br />
LUST CLOSED NORTH OAKS RENDERING STANLEY<br />
LUST CLOSED SUMNER TN SHOP SUMNER<br />
ERP CLOSED HEINTZ BULK PLT TURTLE LAKE<br />
ERP OPEN HEINTZ BULK PLT TURTLE LAKE<br />
LUST CLOSED HOFFMAN, LLOYD PROPERTY TURTLE LAKE<br />
LUST CLOSED AUTO STOP TURTLE LAKE<br />
LUST CLOSED HOLIDAY STATION STORE #038 TURTLE LAKE<br />
LUST CLOSED ALLTECH INC TURTLE LAKE<br />
LUST CLOSED TURTLE LAKE MOTOR CO INC TURTLE LAKE<br />
LUST CLOSED DAVIS AUTO BODY TURTLE LAKE<br />
LUST CLOSED BYRNES & PERGA LAW OFFICE TURTLE LAKE<br />
LUST CLOSED TURTLE LAKE FEED MILL TURTLE LAKE<br />
LUST CLOSED SANMINA-SCI (HARTZELL MFG) TURTLE LAKE<br />
LUST CLOSED BECKERS TRUCKING INC TURTLE LAKE<br />
LUST OPEN WILD CARD BAR TURTLE LAKE<br />
LUST OPEN HEINTZ BULK PLT TURTLE LAKE<br />
source: <strong>Wisconsin</strong> BRRTS database, April 21, 2008.<br />
Barron County Conditions and Trends Report 239
240 Economic Development Information
7. LAND USE INFORMATION<br />
Element Context<br />
Land use is a critical factor in managing the future growth of any community. Land use<br />
trends indicate what changes are occurring regarding type, location and intensity of uses<br />
over time. It is these land use changes that have to be managed in a manner that is<br />
beneficial to the residents and environment of each community.<br />
Much of the information within this section has been adapted from the 2003 Barron<br />
County Land Use Plan and supplemented by a variety of data sources such as the<br />
<strong>Wisconsin</strong> Department of Revenue and United States Department of Agriculture.<br />
In this section is the basic landuse data necessary to further explore the land use issues<br />
facing those communities participating in this planning effort and to begin the process of<br />
developing individual community land use plans to meet the requirements of <strong>Wisconsin</strong><br />
Comprehensive <strong>Planning</strong> Law (s. 66.1001 (2)(h), Stats.).<br />
Once developed, the resulting land use plans will act as a sound basis for the orderly<br />
development of their communities, and will assist the communities in achieving their<br />
individual goals. The plan, along with the implementation tools, will provide local<br />
governments with the ability to effectively and efficiently make public investment<br />
decisions and to work with developers to ensure private investments are compatible with<br />
the public interest.<br />
Existing Land Use and Land Use Trends<br />
The land use/land coverage acreage statistics were taken from the most recent assessment<br />
data collected by the <strong>Wisconsin</strong> Department of Revenue. This is the only consistent data<br />
on land use/land cover acreage for all communities involved in the Comprehensive Plan,<br />
and allows for trend analysis. These classifications are: residential, commercial, industrial<br />
(manufacturing), agricultural, forest, undeveloped lands (vacant) and other.<br />
The predominant land use in the rural areas of Barron County is agriculture as shown<br />
below (Source: <strong>Wisconsin</strong> Department of Revenue - based on assessment record). The<br />
2007 land uses based on reported assessments for all communities in Barron County are<br />
presented in Table 7.6. The percent of acres in agriculture range from highs of 70.7<br />
percent, 69.8 percent and 69.5 percent in the Towns of Oak Grove, Barron and<br />
Cumberland, respectively, to lows of 22.8 percent, 33.5 and 35.4 percent in the Towns of<br />
Maple Plain, Lakeland and Sumner, respectively. Sixteen of Barron County’s twentyfive<br />
towns (64%) have more than 50 percent of their assessed land assessed as<br />
agriculture. Seven towns (28%) have at least two-thirds of their assessed land assessed as<br />
agriculture.<br />
Barron County Conditions and Trends Report 241
Table 7.1—Barron County Land Use - 2007<br />
Assessment Class<br />
1998 Acres 2007Acres ’98-’07 %<br />
Assessed Assessed change<br />
Agricultural 302,212 262,867 -13.0%<br />
Forest 126,211 116,122 -8.0%<br />
Undeveloped 32,041 61,021 9.0%<br />
Residential 20,174 26,911 33.4%<br />
Commercial 2,716 4,060 49.5%<br />
Manufacturing 1,212 1,326 9.4%<br />
Other 4,465 4,331 -3.0%<br />
Total 489,031 476,638<br />
source: <strong>Wisconsin</strong> Department of Revenue<br />
Those towns that have lower agricultural acreage generally have higher forested acres,<br />
significant surface water acres, or both. For example, the Towns of Maple Plain and<br />
Sumner have about 50 percent of their land assessed as forested. Towns with low<br />
agricultural acreage and significant surface water acres are Cedar Lake, Crystal Lake,<br />
Lakeland and Maple Plain. As expected, large amounts of commercial and industrial land<br />
occurs in the village and cities. Incorporated communities also generally have a greater<br />
percentage and concentration of residential uses.<br />
The existing land uses in Barron County are summarized and discussed in the remainder<br />
of this section.<br />
Agricultural Land Use<br />
The agricultural acreage has declined by 87,400 acres from 1990 to 2007 in Barron<br />
County. See Table 7.8. The largest decrease of 6,479 acres occurred in Vance Creek.<br />
Other substantial losses occurred:<br />
Table 7.2—Leading Acreage Loss of Agricultural Land by Municipality, 1990-2007<br />
Town Town City/Village<br />
Stanley -5,178 Turtle Lake -4,269 Turtle Lake -423<br />
Prairie Farm -4,945 Maple Plain -4,250 Dallas -339<br />
Sioux Creek -4,788 Prairie Lake -4,155 Cameron -329<br />
Crystal Lake -4,405 Dallas -4,087 Chetek -219<br />
Doyle -4,300 Maple Grove -3,581 Rice Lake -153<br />
source: <strong>Wisconsin</strong> Department of Revenue<br />
There was a 33 percent reduction in agricultural land in Barron County from 1990 to<br />
2007. That is a loss of about two percent per year. The largest percent of agricultural land<br />
reductions between 1990 and 2007 were seen by the following communities:<br />
242 Land Use Information
Table 7.3—Leading Percentage Loss of Agricultural Land by Municipality, 1990-2007<br />
Town<br />
City/Village<br />
Maple Plain -54.7% Chetek -97.8%<br />
Sumner -34.8% Almena -66.2%<br />
Doyle -35.4% Barron -56.6%<br />
Stanley -35.4% Haugen -56.3%<br />
Crystal Lake -37.3% Turtle Lake -50.9%<br />
Vance Creek -33.5% Cameron -48.5%<br />
Bear Lake -32.1% Dallas -46.2%<br />
source: <strong>Wisconsin</strong> Department of Revenue<br />
Agriculture is the predominant use of the land in the towns of Barron County. The<br />
assessed agricultural acreage in the County was 262,867 or about 55% of total land<br />
acreage. The greatest number of agricultural acres is broken down as follows:<br />
Table 7.4—Most Agricultural Acres by Municipality, 2007<br />
Town<br />
Oak Grove 15,235<br />
Stanfold 14,988<br />
Maple Grove 14,500<br />
Turtle Lake 14,083<br />
Barron 14,011<br />
Clinton 13,617<br />
Cumberland 13,395<br />
source: <strong>Wisconsin</strong> Department of Revenue<br />
The Towns of Bear Lake, Sumner, Cedar Lake, Lakeland and Maple Plain all have less<br />
than 7,000 acres in agricultural use. Several towns, including Oak Grove (70.7 percent),<br />
Barron (69.8 percent), Cumberland (69.5 percent), Stanfold (68.4 percent), Vance Creek<br />
(67.4 percent) and Turtle Lake (66.3 percent) have about two-thirds or more of their land<br />
in agriculture.<br />
Forest Land Use<br />
In 2007, the combined assessed acres in forestland amounted to about 116,122 acres or<br />
about 24 percent of the total County acreage. These lands included private and public<br />
forestlands. See Table 7.9.<br />
Assessed forest acreage increased by more than 10,000 acres between 1990 and 2007,<br />
peaking around 1998. The greatest percentage increases occurred in the Towns of Vance<br />
Creek (195 percent), Rice Lake (115 percent), Maple Grove (48.8 percent), Stanley (71<br />
percent), Dallas (57 percent), and Prairie Farm (48 percent). Between 1990 and 2007 the<br />
Towns of Cedar Lake (-22.7 percent), Dovre (-21.4 percent), Lakeland (-21.2 percent),<br />
Barron County Conditions and Trends Report 243
Sumner (-17.8 percent) and Crystal Lake (-11.1 percent) saw percentage declines in<br />
forested acreage.<br />
The Towns of Vance Creek (3,163), Prairie Farm (1,350), Doyle (1,949), Stanley (2,059),<br />
and Dallas (1,444) had the greatest increase, and the Towns of Lakeland (-1,753),<br />
Sumner (-1,600), Dovre (-1,086), and Cedar Lake (-904), had the greatest decrease in<br />
forested land acres from 1990 to 2007. In 2007, the Town of Sumner had the greatest<br />
amount of forested acreage (8,657 acres) followed by Doyle (7,780), Maple Plain<br />
(7,719), Arland (6,579) and Lakeland (6,519).<br />
Residential Land Use<br />
In 2007, the residential acreage in the unincorporated areas of the County was 24,294, or<br />
approximately 90.3 percent of the total residential acreage in the county. This is up from<br />
83 percent in 1990. The residential acreage increase in unincorporated areas from 1990 to<br />
2007 was 9,482 acres or a 54 percent increase. That is a 3.2 percent annual increase. The<br />
Town of Chetek had significant residential acreage (2,495) in 2007. This is due to the<br />
residential development on the chain of lakes (Mud, Prairie, Chetek, Pokegama, Ten Mile<br />
and Bass) in the town. The Towns of Rice Lake (2,321 acres) and Stanley (2,003 acres)<br />
also had significant residential acreage in 2007. This is reflective of the substantial rural<br />
residential development occurring primarily west and south of Rice Lake. The Town of<br />
Chetek (959) had the greatest absolute increase in residential acres, followed by the<br />
Towns of Rice Lake (889), Prairie Lake (738), Stanley (728), and Sumner (684). See<br />
Table 7.5.<br />
Other towns with significant residential acreage are Lakeland (1,762), Maple Plain<br />
(1,398), Prairie Lake (1,492), Bear Lake (1,157), Cedar Lake (1,002) and Sumner (888).<br />
All of these towns have significant seasonal and year-round development on lakes or in<br />
natural areas.<br />
Regarding residential acreage percentage increases between 1990 and 2007, the Town of<br />
Sumner (335 percent) had the greatest increase, followed by the Towns of Vance Creek<br />
(194 percent), Prairie Farm (142 percent), and Sioux Creek (139 percent). These<br />
communities have grown in residential acreage at a rate of at least 10 percent per year<br />
since 1990. Other towns that have at least<br />
doubled their residential acreage between<br />
1990 and 2007 are Arland (112 percent),<br />
Turtle Lake (109 percent), Dovre (108<br />
percent), and the Towns of Prairie Lake (98<br />
percent) and Oak Grove (94 percent) nearly<br />
have.<br />
The cities and villages in Barron County,<br />
with the exception of Cumberland, have<br />
seen less dramatic growth in residential<br />
244 Land Use Information
land. While the City of Cumberland (148 percent) more than doubled its residential<br />
acreage from 1990 to 2007, the Villages of Turtle Lake (71 percent) and New Auburn<br />
(66.7 percent) increased by at least two-thirds, the Cities of Chetek (35 percent) and Rice<br />
Lake (33.4 percent) increased by about a third, and the Village of Dallas (32.4 percent)<br />
increased almost two percent annually. The other cities and villages experienced only a<br />
small increase in residential land during the period.<br />
Commercial Land Use<br />
While the majority of commercial lands are located in the County’s unincorporated<br />
communities, the commercial areas located in and adjacent to incorporated areas are<br />
much more intensively developed and contain larger buildings. Current commercial lands<br />
account for less than one percent of the total County acreage. See Table 7.6.<br />
In 2007, the towns with the largest commercial acreage were Rice Lake (676), Sioux<br />
Creek (261), Chetek (227), Stanley (214), Cedar Lake (198), Oak Grove (153), Prairie<br />
Lake (152), Almena (136) and Doyle (124). Collectively, they comprised about 80% of<br />
the commercial lands in the unincorporated areas of the County. Between 1990 and<br />
2007, the Towns of Rice Lake (308), Sioux Creek (246) and Almena (132), and the City<br />
of Rice Lake (147), experienced significant increases in commercial acreage.<br />
There were very large percentage increases in commercial acreage between 1990 and<br />
2007 in the Towns of Stanfold (0 acres in 1990 to 16 acres in 2007), Almena (3,300<br />
percent), Prairie Farm (2,900 percent) and Sioux Creek (1,640 percent), and the Villages<br />
of Cameron (1,150 percent) and Turtle Lake (435 percent). Communities that at least<br />
doubled the amount of commercial land between 1990 and 2007 were the Towns of<br />
Sumner (333 percent), Maple Grove (333 percent), Arland (200 percent), Bear Lake (142<br />
percent) and Barron (114 percent), and the Village of Almena (112 percent), while the<br />
City of Chetek (96 percent) nearly did so. As seen above, many other communities had<br />
significant growth in commercial land, while the Towns Crystal Lake, Cumberland,<br />
Dovre, Doyle, and Stanley, and the Village of Dallas had a decrease in commercial land.<br />
Industrial Land Use<br />
Manufacturing acreage in the County’s unincorporated areas is significant (753 acres or<br />
57 percent of all industrial land). However, non-metallic mining which occurs<br />
exclusively in unincorporated areas and uses a lot of land is considered industrial. The<br />
vast majority of actual manufacturing land (assembly, fabrication, processing,<br />
production, etc.) is in the County’s incorporated areas. See Table 7.7.<br />
Manufacturing acreage decreased 29 acres between 1990 and 2007 in the County’s<br />
unincorporated areas; however, the Town of Cumberland gained 97 acres of<br />
manufacturing land and the Towns of Rice Lake and Barron acquired 57 and 41 acres by<br />
2007, respectively, where they had none in 1990. Other unincorporated communities with<br />
a significant change in industrial land were the Towns of Chetek, Doyle and Turtle Lake.<br />
Barron County Conditions and Trends Report 245
The remainder of towns either had manufacturing lands decrease or had none. The<br />
Village of Prairie Farm gained 19 acres, while all the cities gained manufacturing land;<br />
Barron gained 97 acres, Chetek gained 34 acres, Rice Lake gained 51 acres and<br />
Cumberland gained ten acres.<br />
Land Demand and Prices<br />
Two indicators of a dynamic economy and potentially changing land use patterns are land<br />
sales and prices. These two indicators could mean a demand to convert land to more<br />
intensive uses such as residential, commercial or industrial. In turn, additional community<br />
services may be needed to support this change.<br />
An indicator of the demand for various land types is the number of land sales during the<br />
year for a given community or the county. Tables 7.11 and 7.12 show the sales of<br />
agricultural lands and forested lands respectively. These lands, converted to other uses,<br />
would include those for residential development. It can be seen that there is a steady<br />
demand for these lands for their conversion to other uses. The price paid is also listed. Up<br />
until around 2001 there was virtually no difference in the price paid for forested lands<br />
being converted to other uses than that paid for lands remaining in the original use. This<br />
recently changed dramatically as the price for forest land converted to other uses now<br />
brings a 40% premium over that which stays as forest. The price paid for agricultural<br />
land that is converted to other uses is significantly higher than that for lands remaining in<br />
agriculture. Over the last ten years, even with land use value assessment and an<br />
improving farm economy, agricultural land that was converted to other uses brought a<br />
28.4% premium over agricultural land that was sold and remained in agriculture. In 2007<br />
that could be a difference of $83,400 for 200 acres of farmland sold for conversion rather<br />
than remaining in agriculture. While the selling price for agricultural land without<br />
buildings staying in agricultural use increased by 71 percent between 2000 and 2007,<br />
during the same period the selling price for agricultural land without buildings that was<br />
converted to other uses increased by 110 percent. These conditions reveal the market<br />
pressure for farmland conversion.<br />
Assessment information can help indicate land prices; however, this information has<br />
certain limitations due to assessment methods, timing and whether a particular assessor<br />
has completely established current fair-market value comparables for a given community.<br />
The State of <strong>Wisconsin</strong> attempts to equalize values so communities whose assessments<br />
are in different years will have assessments that are fair. Eventually all assessments are<br />
supposed to reflect fully equalized, fair-market value of property. Table 7.13 presents the<br />
price per acre of various land types based on assessment.<br />
Residential land value is highest in those communities with lakefront property. The<br />
assessments for agricultural land are dramatically altered through State law that provides<br />
for land use value assessment. As can be seen comparing Table 7.11 with Table 7.13, the<br />
use value assessment for agricultural land does not correspond to sale prices for<br />
246 Land Use Information
agricultural land. Forested land in areas more suitable for conversion to residential use<br />
will have higher value than lands better suited for forest production.<br />
In general, land prices in Barron County have been increasing much faster than the rate of<br />
inflation. This is particularly true in the last few years with annual inflation being quite<br />
low. Lakeshore property has increased dramatically in price in the 1990s and early 2000s.<br />
Demand for lakeshore land continues to be high, which drives the prices for these<br />
properties even higher. Forested land is also increasing in price at a rather dramatic rate.<br />
Tracts of forest land (“wild forties”) are being purchased, and a portion of these tracts is<br />
being converted to residential use. This is contributing to forest parcel fragmentation.<br />
Development Limitations<br />
The Agricultural, Natural and Cultural Resources section provided information about the<br />
natural resource limitations to development of shorelands, floodplains, wetlands, and<br />
steep slopes. Certain soil survey interpretations provide information on individual<br />
landscape characteristics posing limitations to development. Such limitations may not be<br />
absolute but often require additional cost be incurred to address the potential negative<br />
impacts caused by developing in such areas. These mapped interpretations can be found<br />
in the countywide maps in Appendix A and for Barron County and each local jurisdiction<br />
in the Barron County Resource and Land Use Atlas DvD-ROM.<br />
Shallow Depth to Bedrock<br />
The extreme of this condition results in rock outcroppings; however, shallow depth to<br />
bedrock usually creates problems for excavation during certain development activities.<br />
See Map 7.1 in Appendix A or on the Atlas DvD-ROM.<br />
Shallow Depth to Groundwater<br />
When groundwater is close to the surface of the ground, development activity can be<br />
curtailed or severely limited. These areas are often associated with wetlands, wet,<br />
poorly-drained soils or thin soils over saturated bedrock. See Map 7.2 in Appendix A or<br />
on the Atlas DVD-ROM.<br />
Limitations for Septic Systems<br />
Septic tank absorption fields are subsurface systems of perforated pipe which distribute<br />
effluent from septic tanks to the soil. Soil between 18 inches and 6 feet is evaluated for<br />
properties that affect absorption of effluent and construction and operation of the system.<br />
Properties that affect absorption are permeability, depth to bedrock and water table, and<br />
susceptibility to flooding. The layout and construction of a system is affected by soil<br />
conditions related to slope, erosion potential, lateral seepage, and downslope flow of<br />
Barron County Conditions and Trends Report 247
effluent. Soils with characteristic large rocks and boulders present additional problems,<br />
and increase the costs of septic system construction. See Map 7.3 in Appendix A or on<br />
the Atlas DVD-ROM.<br />
The State requirements for septic system siting are specified in Chapter COMM 83 of the<br />
<strong>Wisconsin</strong> Administrative Code. This code relies heavily on the ability of the soil to<br />
efficiently absorb the effluent discharged from the septic system drainfield. However, the<br />
NRCS soil interpretations for septic tank absorption fields consider most excessively<br />
drained soils occurring over fractured bedrock or high water tables a limitation to septic<br />
system development because effluent in these situations can be readily transported to the<br />
groundwater. Hence, even though the siting of septic systems in some areas may be<br />
allowed by State code, doing so has the potential for threatening groundwater quality. It<br />
is the new on-site wastewater treatment and disposal technologies that COMM 83 now<br />
allows for that can provide adequate protections in areas with limitations for conventional<br />
septic systems.<br />
Limitations for Residential Basements<br />
Dwellings for this interpretation are no taller than three stories and are supported by<br />
foundation footings in undisturbed soil. The capacity to support load and resist settling<br />
under load, and the ease of excavation affect the soil rating for dwellings. Wetness,<br />
susceptibility to flooding, density, plasticity, texture, and shrink-swell potential are soil<br />
properties that affect the capacity to support load. Soil properties which affect excavation<br />
are wetness, slope, depth to bedrock, and the content of stones and rocks. Soils with<br />
severe limitations preclude basements in most instances. Soils with moderate limitations<br />
may preclude basement development in some instances. However, it is more likely that<br />
these soils will result in an increased cost for basement construction as engineering can<br />
often overcome these limitations. See Map 7.4 in Appendix A or on the Atlas DVD-<br />
ROM.<br />
Limitations for Small Commercial Buildings<br />
Single story, small commercial building development is limited by soil factors related to<br />
steep slope, wetness, susceptibility to flooding, density, plasticity, texture, and shrinkswell<br />
potential. These are the same factors which affect the construction of dwellings<br />
without basements and this interpretation can be used to evaluate these dwellings as well.<br />
See Map 7.5 in Appendix A or on the Atlas DVD-ROM.<br />
248 Land Use Information
Summary<br />
Land development, the demand for housing, the transportation system, the natural<br />
environment, the extent of public services and facilities, land ownership patterns,<br />
economic activity and governmental boundaries and actions, all guide and shape the built<br />
environment and determine its impact on the natural environment. Combining these<br />
factors determines the pattern of development that occurs throughout the County. Hence,<br />
the Housing; Transportation; Agricultural, Natural and Cultural Resources, Utilities and<br />
Community Facilities; Economic Development; and, Intergovernmental Cooperation<br />
Elements will also contain conditions and trends that affect land use.<br />
Land use planning is concerned with properly combining development factors to attain<br />
the optimal or desired use of land. In total, the land use element of each community will<br />
set the proposed pattern of the physical environment for the activities of people and<br />
organizations within that community. Land use planning depends on population and<br />
economic projections and an understanding of the interrelationship of land use activities<br />
and types for living, livelihood and leisure. It is the interrelated nature of the components<br />
that comprise a community that make a comprehensive plan worthwhile.<br />
Barron County is experiencing significant residential growth in its unincorporated areas.<br />
This growth can have a dramatic impact on these rural communities. Rural residential<br />
growth consumes more land than residential development in incorporated communities.<br />
Often development of good productive farm or forest land impacts water resources,<br />
places greater demand on roads and schools, and causes conflicts between farm and nonfarm<br />
uses.<br />
From 1990 to 2003, residential acreage increased by 68 percent in unincorporated areas<br />
while these communities’ populations increased by only 21 percent. Indeed, many<br />
unincorporated communities have doubled the amount of residential land in just 17 years.<br />
On the other hand, from 1990 to 2003, residential acreage in incorporated areas increased<br />
by about 13 percent while these<br />
communities’ populations<br />
increased by just over 9 percent. If<br />
this trend is to continue, it has<br />
serious implications for impacts on<br />
natural resources and productive<br />
lands, demands for services and<br />
conflicts between farm and nonfarm<br />
uses in the rural communities<br />
of Barron County.<br />
While<br />
unincorporated<br />
communities in Barron County<br />
have about twice as much<br />
commercial land than incorporated<br />
Barron County Conditions and Trends Report 249
communities, there is twice as much commercial evaluation in the cities and villages than<br />
in the towns. This indicates commercial activity in cities and villages is more intensive<br />
and includes commercial uses much larger in scale than in the towns. However, scattered<br />
local-serving, resource-based and agriculturally related commercial enterprises in the<br />
rural area serve a useful purpose in those communities. Yet, cities and villages will<br />
continue to provide more regional shopping goods.<br />
Industrial activity will continue to largely occur in the cities and villages where urban<br />
services are available; however, there are significant industrial activities in<br />
unincorporated areas, such as light fabricating and non-metallic resources extraction.<br />
The most prevalent land use in Barron County is agriculture. In fact, more than half of the<br />
land in the County is considered agricultural; however, the County experienced a 25<br />
percent reduction in agricultural land from 1990 to 2007, with one town losing over a<br />
half, five others losing over a third, and six others losing over a quarter of their<br />
agricultural land during that period. It is evident that this has serious implications for<br />
many of the towns in Barron County. Sustaining agricultural economic activity in the<br />
face of increasing agricultural land conversion to non-farm uses will be a challenge for<br />
these communities.<br />
Not all the land converted from agriculture is going to non-resource-based productive<br />
land. It is likely that some of it is being converted to forested land. Forested land<br />
increased by 10 percent in the County between 1990 and 2007. But the loss of farmland<br />
was about eight times the amount of forested land gained. Productive forested land will<br />
continue to be an important part of Barron County’s landscape and economy, not only for<br />
forest products but also for recreational opportunities.<br />
Land use projections are an important part of a comprehensive plan. They are a “best<br />
guess” of the amount of land that will be needed for future development and are based on<br />
population and household projections, community development standards (accepted<br />
density or intensity of various land uses) and community desires. Each community will<br />
prepare its 25-year land use projections in five-year increments for its comprehensive<br />
plan land use element. These projections will be reflected in the individual community’s<br />
future land use maps that will show the general locations of different land uses for the<br />
next 25 years. It is from these projections and the future land use map that each<br />
community will communicate how land use change is likely to occur, influenced by how<br />
they would like it to occur.<br />
250 Land Use Information
Land Use by Municipality Discussion<br />
Following is a general description of the land use/cover in the communities of Barron<br />
County based on reported assessed land. This discussion is intended to augment Table<br />
7.10.<br />
Town Land Use Summaries<br />
Almena<br />
The Town of Almena is predominantly agricultural, with 62 percent of its assessed land<br />
assessed as agriculture. A considerable amount of land area is also covered by forest (15<br />
percent), surface water and wetlands. During the period from 1990 to 2007, the number<br />
of improved residential parcels increased by 31 percent. Much of this development is<br />
located around the Town’s main water bodies of Echo Lake, Horseshoe Lake, Lower<br />
Turtle Lake and Upper Turtle Lake. The Town of Almena surrounds the majority of the<br />
Village of Turtle Lake and the Village of Almena.<br />
Arland<br />
The Town of Arland is 56 percent agricultural and 32 percent forested. The Town<br />
experienced a 52 percent increase in improved residential parcels from 1990-2007. The<br />
unincorporated settlement of Arland is located in the Town.<br />
Barron<br />
The Town of Barron is largely agricultural, with 70 percent of its land assessed as such.<br />
Since 1990, the Town experienced a 68 percent increase in improved residential parcels.<br />
Bear Lake<br />
The Town of Bear Lake has 45 percent of its land assessed as agricultural and 29 percent<br />
as forested. A considerable amount of County forestland exists in the northwest corner of<br />
the Town. There is a significant amount of lakeshore development around Bear Lake and<br />
Lake Thirty. The Town experienced a 43 percent increase in improved residential parcels<br />
since 1990.<br />
Cedar Lake<br />
The Town of Cedar Lake has 44 percent of its land assessed as agricultural land. On the<br />
other hand, it has 24 percent of its land assessed as forested, along with a sizeable amount<br />
of County forestland. Considerable lakeshore development exists on both Red Cedar and<br />
Hemlock Lakes. The Town experienced a 95 percent increase in improved residential<br />
parcels since 1990. The unincorporated settlements of Mikana and Angus are located in<br />
the Town.<br />
Chetek<br />
The Town of Chetek had 44 percent of its assessed land assessed as agricultural. There is<br />
a substantial amount of lakeshore development around Prairie, Chetek, Pokegama, Ten<br />
Mile and Bass Lakes. The Town had 15 percent of its land assessed as residential in<br />
Barron County Conditions and Trends Report 251
2007. This was one of the highest town percentages in the County, with much of this<br />
residential development attributable to the lakeshore development. The Town of Chetek<br />
experienced a 39 percent increase in improved residential parcels since 1990.<br />
Clinton<br />
The Town of Clinton has about 64 percent of its land in agriculture. The Town<br />
experienced a 96 percent increase in improved residential parcels since 1990. There is<br />
substantial lakeshore development around Poskin Lake. The unincorporated settlement of<br />
Poskin is in the Town.<br />
Crystal Lake<br />
The Town of Crystal Lake has 42 percent of its land assessed as agricultural. It also has a<br />
considerable amount assessed as forested (32 percent). The Town has many lakes<br />
throughout, and these have varying degrees of lakeshore development around them.<br />
Considerable development exists on Loon, Bass, Staples and Scott Lakes. The<br />
unincorporated area of Comstock is located in the Town. The Town experienced a 51<br />
percent increase in improved residential parcels since 1990.<br />
Cumberland<br />
The Town of Cumberland has 70 percent of its land assessed as agricultural. It has<br />
considerable lakeshore development around Beaver Dam and Lower Vermillion Lakes.<br />
The Town experienced a 41 percent increase in improved residential parcels since 1990.<br />
Dallas<br />
The Town of Dallas has 64 percent of its assessed land as agricultural and 20 percent<br />
assessed as forested. The Town experienced a 68 percent increase in improved residential<br />
parcels since 1990.<br />
Dovre<br />
The Town of Dovre has 54 percent of its land assessed as agricultural land and 21 percent<br />
assessed as forested lands. The Town experienced a 184 percent increase in improved<br />
residential parcels since 1990, the highest among all of the towns in the County.<br />
Considerable development exists on the southern ends of Ten Mile and Bass lakes.<br />
Doyle<br />
The Town of Doyle has 44 percent of its land assessed as agricultural and 44 percent<br />
assessed as forested. It also has a sizeable amount of County forestland in the southcentral<br />
part of the Town. The Town experienced a 62 percent increase in improved<br />
residential parcels since 1990.<br />
Lakeland<br />
The Town of Lakeland basically has an equal percentage of land assessed as agricultural<br />
(34 percent) as forested (36 percent). The Town has 10 percent of its land assessed as<br />
residential. This is due to considerable lakeshore development around Silver, Big<br />
Dummy, Little Dummy, Granite, Duck and Sylvan lakes. The Town of Lakeland<br />
252 Land Use Information
experienced a 55 percent increase in improved residential parcels since 1990. The<br />
unincorporated settlement of Barronett is located in the Town.<br />
Maple Grove<br />
The Town of Maple Grove is predominantly agricultural with 67 percent of its land<br />
assessed as agricultural. The Town experienced a 101 percent increase in improved<br />
residential parcels since 1990. The unincorporated settlement of Hillsdale is located in<br />
the Town.<br />
Maple Plain<br />
The Town of Maple Plain has only 23 percent of its land assessed as agricultural. It has<br />
50 percent assessed as forested lands, along with considerable acres in County forest<br />
land. It also has substantial lakeshore development around Horseshoe, Sand, Kirby,<br />
Beaver Dam, Little Sand, Lower Spirit and Spring lakes. The Town has about 9 percent<br />
of its land in residential acreage. It increased in improved residential parcels by about 32<br />
percent since 1990.<br />
Oak Grove<br />
The Town of Oak Grove is heavily agricultural, with 71 percent of its land assessed as<br />
agricultural. The Town experienced a 59 percent increase in improved residential parcels<br />
since 1990. The unincorporated settlements of Brill and Dobie are located in the Town.<br />
Prairie Farm<br />
The Town of Prairie Farm is predominantly agricultural, with 64 percent of assessed land<br />
assessed as agricultural and another 21 percent assessed as forested. The Town of Prairie<br />
Farm has doubled its improved residential parcels since 1990 with a 105 percent increase.<br />
Prairie Lake<br />
The Town of Prairie Lake has 52 percent of its land assessed as agricultural and another<br />
24 percent as forest. It has considerable lakeshore development around Prairie Lake. It<br />
has about 8 percent of its land assessed as residential, primarily due to the<br />
aforementioned lakeshore development. Since 1990, it has experienced a 52 percent<br />
increase in improved residential parcels in the Town.<br />
Rice Lake<br />
The Town of Rice Lake has 55 percent of its land assessed as agricultural. The larger<br />
agricultural land holdings are in the eastern half of the Town. The western half has<br />
experienced considerable rural residential development. There is also a significant<br />
amount of lakeshore development around Tuscobia, Rice and Montanis lakes. The Town<br />
has 14.5 percent of its land assessed as residential, which made it the most residentially<br />
developed of all the towns in the County. It also had the highest percentage of<br />
commercial land of any town, with 4 percent or 676 acres. The Town experienced a 46<br />
percent increase in improved residential parcels since 1990. The unincorporated<br />
settlement of Campia is located in the Town.<br />
Barron County Conditions and Trends Report 253
Sioux Creek<br />
The Town of Sioux Creek has 55 percent of its assessed land assessed as agricultural and<br />
27 percent assessed as forested. The Town experienced a 63 percent increase in improved<br />
residential parcels since 1990.<br />
Stanfold<br />
The Town of Stanfold has 68 percent of its assessed land assessed as agricultural. It also<br />
has 20 percent assessed as forested. Between 1990 and 1997, the Town experienced the<br />
lowest increase in improved residential parcels of any town in the County (4 percent);<br />
however, between 1997 and 2007, improved residential parcels doubled, increasing by<br />
100 percent.<br />
Stanley<br />
The Town of Stanley has 51 percent of its land assessed as agricultural and another 27<br />
percent assessed as forested. The Town is experiencing significant residential<br />
development along CTH SS between Rice Lake and Cameron. Additional residential<br />
development has occurred along the Red Cedar River, USH 53, CTH W, the Dietz Lakes<br />
area, and the north end of Prairie Lake. In 2007, the Town had about 11 percent of its<br />
land assessed as residential. Since 1990, the Town of Stanley has had a two-thirds<br />
(66.7%) increase in improved residential parcels.<br />
Sumner<br />
The Town of Sumner is heavily forested, having 50 percent of its land assessed as such. It<br />
has only 35 percent assessed as agricultural. The Town experienced a 78 percent increase<br />
in improved residential parcels from 1990-2007. There are two unincorporated<br />
settlements in the Town, Canton and Sumner. There is a small amount of County<br />
forestland in the Town.<br />
Turtle Lake<br />
The Town of Turtle Lake is predominantly agricultural with 65 percent of its land<br />
assessed as agricultural. It has the smallest amount of land assessed as forest, 12 percent,<br />
of any town in the County. It has a small amount of County forestland in the southwest<br />
corner of the Town. The Town experienced an increase of 54 percent in improved<br />
residential parcels since 1990.<br />
Vance Creek<br />
The Town of Vance Creek has 67 percent of its land assessed as agricultural and 25<br />
percent assessed as forested. It has over a section of land in County forest in the northeast<br />
corner of the Town. The Town had a 95 percent increase in improved residential parcels<br />
since 1990.<br />
254 Land Use Information
Village Land Use Summaries<br />
Almena<br />
The Village of Almena has 24 percent of its land assessed as residential, 14 percent as<br />
commercial and 6 percent as manufacturing. Approximately 6 percent of the Village is<br />
undeveloped and 40 percent is in agriculture. The Village had an 18 percent increase in<br />
improved residential parcels since 1990.<br />
Cameron<br />
The Village of Cameron has 18 percent of its land assessed as residential, 8 percent as<br />
commercial and 2 percent as manufacturing. Almost 28 percent of the Village is<br />
undeveloped, while 38 percent is in agriculture. Since 1990, improved residential parcels<br />
have increased in the Village of Cameron 42 percent.<br />
Dallas<br />
The Village of Dallas has about 7 percent of its land assessed as residential, 2 percent as<br />
commercial and less than 1 percent as manufacturing. Approximately 35 percent of the<br />
Village is undeveloped, and 54 percent is in agriculture. The Village had a 13 percent<br />
increase in improved residential parcels since 1990.<br />
Haugen<br />
The Village of Haugen has 37 percent of its land assessed as residential, 3 percent as<br />
commercial and 26 percent as manufacturing. Approximately 26 percent of the Village is<br />
in agriculture, and less than 1 percent is undeveloped. The Village had a 14.5 percent<br />
increase in improved residential parcels since 1990.<br />
New Auburn<br />
The Village of New Auburn within Barron County comprises five acres of residential<br />
land in 10 parcels. This portion of the Village had a one-third increase in improved<br />
residential parcels since 1990.<br />
Prairie Farm<br />
The Village of Prairie Farm has 13 percent of its land assessed as residential, 2 percent as<br />
commercial and less about 5 percent as manufacturing. Undeveloped land accounts for<br />
about one percent of assessed land in the Village, while 51 percent and 27 percent are in<br />
agriculture and forest, respectively. The Village had a 13 percent increase in improved<br />
residential parcels since 1990.<br />
Turtle Lake<br />
All of the Village of Turtle Lake (in Polk and Barron Counties) has 15 percent of its land<br />
assessed as residential, 8 percent as commercial and 2 percent as manufacturing.<br />
Approximately 11 percent of the Village is undeveloped, and 38 percent is in agriculture.<br />
The Village had a 6.5 percent increase in improved residential parcels since 1990, but<br />
actually saw a 70 percent increase in residential acreage during the period. The Village<br />
Barron County Conditions and Trends Report 255
had a 20 percent increase in improved commercial parcels since 1990, and saw<br />
commercial acreage increase by 74 acres or 435 percent during the period.<br />
City Land Use Summaries<br />
Barron<br />
The City of Barron has 26 percent of its land assessed as residential, 20 percent as<br />
commercial and 25 percent as manufacturing. Approximately 4 percent of the City is<br />
undeveloped, and 5 percent is in agriculture. Since 1990, the City had a 10 percent<br />
increase in improved residential parcels, and saw a ten percent decrease in improved<br />
commercial parcels.<br />
Chetek<br />
The City of Chetek has about half of its land assessed as residential, 10 percent as<br />
commercial and 11 percent as manufacturing. Approximately 27 percent of the City is<br />
undeveloped, and only 1 percent is in agriculture. Since 1990, the City had a 17 percent<br />
increase in improved residential parcels. During the same period, the City saw an 8.5<br />
percent increase in improved commercial parcels, and saw manufacturing acreage<br />
increase by 200 percent.<br />
Cumberland<br />
The City of Cumberland has 46 percent of its assessed land assessed as residential, 13<br />
percent as commercial and 5 percent as manufacturing. Approximately 15 percent of the<br />
City is undeveloped, and 14 percent is in agriculture. Since 1990, the City had a 14<br />
percent increase in improved residential parcels. During the same period, the City saw a<br />
36 percent increase in improved commercial parcels, while improved manufacturing<br />
parcels grew by 43 percent.<br />
Rice Lake<br />
The City of Rice Lake has 43 percent its land assessed as residential, 30 percent as<br />
commercial and 2 percent as manufacturing. Only 1.7 percent of the City is undeveloped,<br />
yet 16 percent is in agriculture. Since 1990, the City had an 11 percent increase in<br />
improved residential parcels. During the same period, the City saw a 34 percent increase<br />
in improved commercial parcels and lost two improved manufacturing parcels, yet saw<br />
an 35 percent increase in manufacturing acreage.<br />
256 Land Use Information
Land Use Tables<br />
Table 7.5<br />
Assessed Residential Acres by Municipality • 1990, 2003 and 2007<br />
Barron County<br />
Total Acres 90-07 Acreage 90-07 Percent<br />
Town 1990 2003 2007 Change Change<br />
Almena 528 1,042 869 341 64.6%<br />
Arland 268 453 567 299 111.6%<br />
Barron 385 547 553 168 43.6%<br />
Bear Lake 881 1,020 1,157 276 31.3%<br />
Cedar Lake 756 890 1,002 246 32.5%<br />
Chetek 1,533 2,211 2,492 959 62.6%<br />
Clinton 346 695 609 263 76.0%<br />
Crystal Lake 601 759 833 232 38.6%<br />
Cumberland 599 722 746 147 24.5%<br />
Dallas 210 318 504 294 140.0%<br />
Dovre 306 659 636 330 107.8%<br />
Doyle 245 402 449 204 83.3%<br />
Lakeland 1,343 1,552 1,762 419 31.2%<br />
Maple Grove 322 578 608 286 88.8%<br />
Maple Plain 848 1,293 1,398 550 64.9%<br />
Oak Grove 400 747 776 376 94.0%<br />
Prairie Farm 171 393 413 242 141.5%<br />
Prairie Lake 754 1,347 1,492 738 97.9%<br />
Rice Lake 1,432 2,199 2,321 889 62.1%<br />
Sioux Creek 277 664 663 386 139.4%<br />
Stanfold 339 401 464 125 36.9%<br />
Stanley 1,275 2,016 2,003 728 57.1%<br />
Sumner 204 799 888 684 335.3%<br />
Turtle Lake 230 443 480 250 108.7%<br />
Vance Creek 207 523 609 402 194.2%<br />
TOTAL 14,460 22,673 24,294 9,834 68.0%<br />
Villages<br />
Almena 47 51 126 79 168.09%<br />
Cameron 416 480 164 -252 -60.6%<br />
Dallas 37 39 49 12 32.4%<br />
Haugen 54 55 60 6 11.1%<br />
New Auburn 3 5 5 2 66.7%<br />
Prairie Farm 38 41 49 11 28.9%<br />
Turtle Lake 95 72 162 67 70.5%<br />
TOTAL 690 743 615 -75 -10.9%<br />
Cities<br />
Barron 156 153 150 -6 -3.8%<br />
Chetek 168 233 227 59 35.1%<br />
Cumberland 178 351 441 263 147.8%<br />
Rice Lake 1,777 1,892 1,184 -593 -33.4%<br />
TOTAL 2,279 2,629 2,002 -277 -12.2%<br />
<strong>COUNTY</strong> TOTAL 17,429 28,048 26,911 9,482 54.4%<br />
source: WI DOR<br />
Barron County Conditions and Trends Report 257
Table 7.6<br />
Assessed Commercial Acres by Municipality • 1990, 2003 and 2007<br />
Barron County<br />
Total Acres 90-07 Acreage 90-07 Percent<br />
Town 1990 2003 2007 Change Change<br />
Almena 4 111 136 132 3300.0%<br />
Arland 3 9 9 6 200.0%<br />
Barron 43 90 92 49 114.0%<br />
Bear Lake 36 10 87 51 141.7%<br />
Cedar Lake 195 209 198 3 1.5%<br />
Chetek 140 205 227 87 62.1%<br />
Clinton 17 23 19 2 11.8%<br />
Crystal Lake 59 32 31 -28 -47.5%<br />
Cumberland 18 27 11 -7 -38.9%<br />
Dallas 64 89 96 32 50.0%<br />
Dovre 20 17 14 -6 -30.0%<br />
Doyle 345 440 124 -221 -64.1%<br />
Lakeland 38 36 57 19 50.0%<br />
Maple Grove 3 11 13 10 333.3%<br />
Maple Plain 15 20 20 5 33.3%<br />
Oak Grove 85 123 153 68 80.0%<br />
Prairie Farm 1 25 30 29 2900.0%<br />
Prairie Lake 93 83 152 59 63.4%<br />
Rice Lake 368 673 676 308 83.7%<br />
Sioux Creek 15 359 261 246 1640.0%<br />
Stanfold 0 11 16 16 16000.0%<br />
Stanley 266 277 214 -52 -19.5%<br />
Sumner 3 13 13 10 333.3%<br />
Turtle Lake 26 28 30 4 15.4%<br />
Vance Creek 2 2 2 0 0.0%<br />
TOTAL 1,859 2,923 2,681 822 44.2%<br />
Villages<br />
Almena 34 41 72 38 111.8%<br />
Cameron 6 56 75 69 1150.0%<br />
Dallas 13 13 12 -1 -7.7%<br />
Haugen 5 6 5 0 0.0%<br />
New Auburn 1 0 0 -1 -100.0%<br />
Prairie Farm 0 0 9 9 9000.0%<br />
Turtle Lake 17 57 91 74 435.3%<br />
TOTAL 76 173 264 188 247.4%<br />
Cities<br />
Barron 103 112 119 16 15.5%<br />
Chetek 23 33 45 22 95.7%<br />
Cumberland 95 93 122 27 28.4%<br />
Rice Lake 682 829 829 147 21.6%<br />
TOTAL 903 1,067 1,115 212 23.5%<br />
<strong>COUNTY</strong> TOTAL 2,838 4,163 4,060 1,222 43.1%<br />
source: WI DOR<br />
258 Land Use Information
Table 7.7<br />
Assessed Industrial Acres by Municipality • 1990, 2000 and 2007<br />
Barron County<br />
Total Acres 90-07 Acreage 90-07 Percent<br />
Town 1990 2000 2007 Change Change<br />
Almena 25 0 0 -25 -100.0%<br />
Arland 152 139 0 -152 -100.0%<br />
Barron 0 41 41 41 41000%<br />
Bear Lake 0 0 0 0 0%<br />
Cedar Lake 0 0 0 0 0%<br />
Chetek 1 5 13 12 1200.0%<br />
Clinton 5 5 5 0 0.0%<br />
Crystal Lake 8 6 22 14 175.0%<br />
Cumberland 16 0 113 97 606.3%<br />
Dallas 0 0 0 0 0%<br />
Dovre 0 0 0 0 0%<br />
Doyle 0 6 6 6 6000%<br />
Lakeland 15 15 15 0 0.0%<br />
Maple Grove 0 0 0 0 0%<br />
Maple Plain 0 0 0 0 0%<br />
Oak Grove 116 83 83 -33 -28.4%<br />
Prairie Farm 0 0 0 0 0%<br />
Prairie Lake 1 4 3 2 200.0%<br />
Rice Lake 0 57 57 57 57000%<br />
Sioux Creek 0 0 0 0 0%<br />
Stanfold 50 10 10 -40 -80.0%<br />
Stanley 150 173 134 -16 -10.7%<br />
Sumner 0 0 0 0 0%<br />
Turtle Lake 243 211 251 8 3.3%<br />
Vance Creek 0 0 0 0 0%<br />
TOTAL 782 755 753 -29 -3.7%<br />
Villages<br />
Almena 19 31 31 12 63.2%<br />
Cameron 61 28 16 -45 -73.8%<br />
Dallas 0 1 1 1 1000%<br />
Haugen 42 42 42 0 0.0%<br />
New Auburn 0 0 0 0 0%<br />
Prairie Farm 1 25 20 19 9000.0%<br />
Turtle Lake 20 18 18 -2 -10.0%<br />
TOTAL 143 145 128 -15 -10.5%<br />
Cities<br />
Barron 50 148 147 97 194.0%<br />
Chetek 17 55 51 34 200.0%<br />
Cumberland 40 45 50 10 25.0%<br />
Rice Lake 146 173 197 51 34.9%<br />
TOTAL 253 421 445 192 75.9%<br />
<strong>COUNTY</strong> TOTAL 1,178 1,321 1,326 148 12.6%<br />
source: WI DOR<br />
Barron County Conditions and Trends Report 259
Table 7.8<br />
Assessed Agricultural Parcels and Acreage by Municipality • 1990, 2003 and 2007<br />
Barron County<br />
Total Parcels Total Acres 1990-2003<br />
2003-2007<br />
Acres<br />
Acres<br />
Town 1990 2003 2007 1990 2003 2007 % Change % Change<br />
Almena 466 414 417 13,183 10,219 10,145 -22.5% -0.7%<br />
Arland 529 481 488 15,119 11,568 11,584 -23.5% 0.1%<br />
Barron 572 564 567 13,347 14,070 14,011 5.4% -0.4%<br />
Bear Lake 271 253 267 9,336 7,976 6,340 -14.6% -20.5%<br />
Cedar Lake 237 264 262 6,862 5,823 5,619 -15.1% -3.5%<br />
Chetek 395 318 314 10,935 7,830 7,471 -28.4% -4.6%<br />
Clinton 593 555 592 16,947 14,090 13,617 -16.9% -3.4%<br />
Crystal Lake 403 335 353 11,800 7,303 7,395 -38.1% 1.3%<br />
Cumberland 550 534 556 16,595 13,769 13,395 -17.0% -2.7%<br />
Dallas 591 509 520 16,829 12,552 12,742 -25.4% 1.5%<br />
Dovre 565 477 462 12,454 10,531 10,349 -15.4% -1.7%<br />
Doyle 372 275 305 12,122 7,470 7,822 -38.4% 4.7%<br />
Lakeland 371 364 330 7,172 6,820 6,092 -4.9% -10.7%<br />
Maple Grove 632 571 582 18,081 14,489 14,500 -19.9% 0.1%<br />
Maple Plain 272 172 178 7,767 3,492 3,517 -55.0% 0.7%<br />
Oak Grove 601 533 526 17,519 16,082 15,235 -8.2% -5.3%<br />
Prairie Farm 609 550 559 17,662 12,591 12,717 -28.7% 1.0%<br />
Prairie Lake 566 446 473 14,336 9,861 10,181 -31.2% 3.2%<br />
Rice Lake 451 408 415 12,232 9,061 8,880 -25.9% -2.0%<br />
Sioux Creek 562 478 504 16,157 11,716 11,369 -27.5% -3.0%<br />
Stanfold 615 578 589 17,840 14,822 14,988 -16.9% 1.1%<br />
Stanley 564 414 465 14,612 8,969 9,434 -38.6% 5.2%<br />
Sumner 353 250 267 9,545 5,838 6,227 -38.8% 6.7%<br />
Turtle Lake 562 531 539 18,352 14,264 14,083 -22.3% -1.3%<br />
Vance Creek 583 544 546 19,332 12,778 12,853 -33.9% 0.6%<br />
TOTAL 12,285 10,818 11,076 346,136 263,984 260,566 -23.7% -1.3%<br />
Villages<br />
Almena 23 8 17 266 90 206 -66.2% 128.9%<br />
Cameron 32 26 19 678 524 349 -22.7% -33.4%<br />
Dallas 29 21 21 734 396 395 -46.0% -0.3%<br />
Haugen 5 5 6 96 43 42 -55.2% -2.3%<br />
New Auburn 0 0 0 0 0 0 0% 0%<br />
Prairie Farm 20 21 19 303 218 198 -28.1% -9.2%<br />
Turtle Lake 42 25 24 831 412 408 -50.4% -1.0%<br />
TOTAL 151 106 106 2,908 1,683 1,598 -42.1% -5.1%<br />
Cities<br />
Barron 16 9 8 267 133 116 -50.2% -12.8%<br />
Chetek 8 1 1 224 5 5 -97.8% 0.0%<br />
Cumberland 8 9 10 131 125 134 -4.6% 7.2%<br />
Rice Lake 30 21 25 603 370 450 -38.6% 21.6%<br />
TOTAL 62 40 44 1,225 633 705 -48.3% 11.4%<br />
<strong>COUNTY</strong> TOTAL 12,498 10,964 11,226 350,269 266,300 262,869 -24.0% -12.9%<br />
source: WI DOR<br />
260 Land Use Information
Table 7.9<br />
Assessed Forest Parcels and Acreage by Town • 1990, 1997 and 2007<br />
Barron County<br />
Total Parcels<br />
Total Acres<br />
Town 1990 1997 2007 1990-1997 1997-2007<br />
% Change % Change<br />
1990 1997 2007 1990-1997 1997-2007 1990-2007<br />
% Change % Change % Change<br />
Almena 172 170 189 -1.2% 11.2% 2,850 2,468 2,662 -13.4% 7.9% -6.6%<br />
Arland 285 279 358 -2.1% 28.3% 5,417 5,233 6,579 -3.4% 25.7% 21.5%<br />
Barron 425 277 289 -34.8% 4.3% 3,092 2,961 3,342 -4.2% 12.9% 8.1%<br />
Bear Lake 161 160 242 -0.6% 51.3% 4,042 3,977 4,167 -1.6% 4.8% 3.1%<br />
Cedar Lake 186 183 190 -1.6% 3.8% 3,988 3,953 3,084 -0.9% -22.0% -22.7%<br />
Chetek 258 256 287 -0.8% 12.1% 3,786 3,842 4,198 1.5% 9.3% 10.9%<br />
Clinton 252 259 400 2.8% 54.4% 3,749 3,599 3,739 -4.0% 3.9% -0.3%<br />
Crystal Lake 256 435 402 69.9% -7.6% 6,294 6,689 5,593 6.3% -16.4% -11.1%<br />
Cumberland 157 155 267 -1.3% 72.3% 2,380 2,315 2,435 -2.7% 5.2% 2.3%<br />
Dallas 237 324 305 36.7% -5.9% 2,535 4,502 3,979 77.6% -11.6% 57.0%<br />
Dovre 367 283 297 -22.9% 4.9% 5,063 4,881 3,977 -3.6% -18.5% -21.4%<br />
Doyle 214 302 310 41.1% 2.6% 5,831 8,391 7,780 43.9% -7.3% 33.4%<br />
Lakeland 437 435 392 -0.5% -9.9% 8,272 7,637 6,519 -7.7% -14.6% -21.2%<br />
Maple Grove 180 189 354 5.0% 87.3% 2,746 2,725 4,086 -0.8% 49.9% 48.8%<br />
Maple Plain 338 381 390 12.7% 2.4% 8,265 9,239 7,719 11.8% -16.5% -6.6%<br />
Oak Grove 197 193 242 -2.0% 25.4% 3,023 2,908 3,655 -3.8% 25.7% 20.9%<br />
Prairie Farm 154 327 311 112.3% -4.9% 2,826 4,868 4,176 72.3% -14.2% 47.8%<br />
Prairie Lake 321 339 395 5.6% 16.5% 4,463 4,828 4,677 8.2% -3.1% 4.8%<br />
Rice Lake 62 168 183 171.0% 8.9% 929 2,012 1,997 116.6% -0.7% 115.0%<br />
Sioux Creek 229 230 364 0.4% 58.3% 4,220 4,318 5,614 2.3% 30.0% 33.0%<br />
Stanfold 386 385 344 -0.3% -10.6% 3,823 3,776 4,420 -1.2% 17.1% 15.6%<br />
Stanley 210 405 398 92.9% -1.7% 2,905 5,373 4,964 85.0% -7.6% 70.9%<br />
Sumner 449 430 379 -4.2% -11.9% 10,527 10,074 8,657 -4.3% -14.1% -17.8%<br />
Turtle Lake 170 172 201 1.2% 16.9% 2,604 2,650 2,665 1.8% 0.6% 2.3%<br />
Vance Creek 58 132 246 127.6% 86.4% 1,622 3,546 4,785 118.6% 34.9% 195.0%<br />
TOTALS 6,161 6,869 7,735 11.5% 12.6% 105,252 116,765 115,469 10.9% -1.1% 9.7%<br />
source: WI DOR<br />
Barron County Conditions and Trends Report 261
Table 7.10<br />
Land Use Acreage by Municipality • 2007*<br />
Barron County<br />
Town<br />
Residential<br />
Commercial<br />
Manufacturing<br />
Agricultural<br />
Undeveloped<br />
Forest +<br />
Other<br />
Total<br />
Almena 869 136 0 10,145 3,359 2,662 200 17,371<br />
Arland 567 9 0 11,584 1,653 6,579 195 20,587<br />
Barron 553 92 41 14,011 1,632 3,342 393 20,064<br />
Bear Lake 1,157 87 0 6,340 2,341 4,167 139 14,231<br />
Cedar Lake 1,002 198 0 5,619 2,893 3,084 104 12,900<br />
Chetek 2,492 227 13 7,471 2,276 4,198 116 16,793<br />
Clinton 609 19 5 13,617 2,818 3,739 221 21,229<br />
Crystal Lake 833 31 22 7,395 3,711 5,593 132 17,717<br />
Cumberland 746 11 113 13,393 2,362 2,435 209 19,269<br />
Dallas 504 96 0 12,742 2,310 3,979 198 19,829<br />
Dovre 636 14 0 10,349 3,928 3,977 184 19,088<br />
Doyle 449 124 6 7,822 1,385 7,780 174 17,740<br />
Lakeland 1,762 57 15 6,092 3,608 6,519 118 18,171<br />
Maple Grove 608 13 0 14,500 2,325 4,086 182 21,714<br />
Maple Plain 1,398 20 0 3,517 2,742 7,719 52 15,448<br />
Oak Grove 776 153 83 15,235 1,471 3,655 190 21,563<br />
Prairie Farm 413 30 0 12,717 2,310 4,176 175 19,821<br />
Prairie Lake 1,492 152 3 10,181 2,805 4,677 192 19,502<br />
Rice Lake 2,321 676 57 8,880 1,977 1,997 105 16,013<br />
Sioux Creek 663 261 0 11,369 2,485 5,614 273 20,665<br />
Stanfold 464 16 10 14,988 1,841 4,420 180 21,919<br />
Stanley 2,003 214 134 9,434 1,591 4,964 180 18,520<br />
Sumner 888 13 0 6,227 1,745 8,657 41 17,571<br />
Turtle Lake 480 30 251 14,083 3,584 2,665 161 21,254<br />
Vance Creek 609 2 0 12,853 672 4,785 163 19,084<br />
TOTAL 24,294 2,681 753 260,564 59,824 115,469 4,277 468,063<br />
Villages<br />
Almena 126 72 31 206 30 45 5 515<br />
Cameron 164 75 16 349 243 47 13 907<br />
Dallas 49 12 1 395 258 14 7 736<br />
Haugen 60 5 42 42 1 14 0 164<br />
New Auburn 5 0 0 0 0 0 0 5<br />
Prairie Farm 49 9 20 198 4 104 2 386<br />
Turtle Lake 162 91 18 408 121 221 16 1,086<br />
TOTAL 615 264 128 1,598 657 445 43 3,799<br />
Cities<br />
Barron 150 119 147 116 25 28 2 587<br />
Chetek 227 45 51 5 124 0 0 452<br />
Cumberland 441 122 50 134 143 74 1 965<br />
Rice Lake 1,184 829 197 450 47 57 8 2,772<br />
TOTAL 2,002 1,115 445 705 339 159 11 4,776<br />
<strong>COUNTY</strong> TOTAL 26,911 4,060 1,326 262,867 60,820 116,073 4,331 476,638<br />
source: WI DOR * Based on assessment records. + Includes Forest and Ag Forest.<br />
262 Land Use Information
Table 7.11<br />
Agricultural Land Sales • 1998 - 2007<br />
Barron County<br />
Agricultural land continuing in Agricultural land being diverted Total of all agricultural land<br />
Year<br />
agricultural use<br />
to other uses<br />
2007 Number of Acres Sold Dollars per Number of Acres Sold Dollars per Number of Acres Sold Dollars per<br />
transactions<br />
acre transactions<br />
acre transactions<br />
acre<br />
All 37 2,024 2,444 12 535 2,501 49 2,559 2,455<br />
Without<br />
Buildings 25 1,338 1,841 5 135 2,258 30 1,473 1,879<br />
2006 Number of Acres Sold Dollars per Number of Acres Sold Dollars per Number of Acres Sold Dollars per<br />
transactions<br />
acre transactions<br />
acre transactions<br />
acre<br />
All 51 3,160 2,250 14 470 3,128 65 3,630 2,363<br />
Without<br />
Buildings 26 1,365 1,896 8 286 2,009 34 1,651 1,916<br />
2005 Number of Acres Sold Dollars per Number of Acres Sold Dollars per Number of Acres Sold Dollars per<br />
transactions<br />
acre transactions<br />
acre transactions<br />
acre<br />
All 54 3,208 2,247 12 322 3,843 66 3,530 2,392<br />
Without<br />
Buildings 32 1,618 1,663 7 200 3,589 39 1,818 1,875<br />
2004 Number of Acres Sold Dollars per Number of Acres Sold Dollars per Number of Acres Sold Dollars per<br />
transactions<br />
acre transactions<br />
acre transactions<br />
acre<br />
All 58 3,944 1,769 28 990 2,652 86 4,934 1,946<br />
Without<br />
Buildings 34 1,933 1,453 20 685 1,444 54 2,618 1,451<br />
2003 Number of Acres Sold Dollars per Number of Acres Sold Dollars per Number of Acres Sold Dollars per<br />
transactions<br />
acre transactions<br />
acre transactions<br />
acre<br />
All 64 4,147 1,724 29 1,091 1,518 93 5,238 1,681<br />
Without<br />
Buildings 38 2,415 1,201 23 915 1,433 61 3,330 1,264<br />
2002 Number of Acres Sold Dollars per Number of Acres Sold Dollars per Number of Acres Sold Dollars per<br />
transactions<br />
acre transactions<br />
acre transactions<br />
acre<br />
All 67 4,060 1,347 18 587 1,948 85 4,647 1,423<br />
Without<br />
Buildings 51 2,648 1,106 12 301 1,276 63 2,949 1,123<br />
2001 Number of Acres Sold Dollars per Number of Acres Sold Dollars per Number of Acres Sold Dollars per<br />
transactions<br />
acre transactions<br />
acre transactions<br />
acre<br />
All 45 3,080 1,395 27 889 1,613 72 3,969 1,444<br />
Without<br />
Buildings 22 1,236 1,062 19 525 1,244 41 1,761 1,116<br />
2000 Number of Acres Sold Dollars per Number of Acres Sold Dollars per Number of Acres Sold Dollars per<br />
transactions<br />
acre transactions<br />
acre transactions<br />
acre<br />
All 68 3,618 1,140 31 1,199 1,417 99 4,817 1,209<br />
Without<br />
Buildings 45 2,112 1,077 17 492 1,076 62 2,6049 1,077<br />
1999 Number of Acres Sold Dollars per Number of Acres Sold Dollars per Number of Acres Sold Dollars per<br />
transactions<br />
acre transactions<br />
acre transactions<br />
acre<br />
All 81 4,836 1,093 38 1,413 1,349 119 6,249 1,150<br />
Without<br />
Buildings 41 1,975 797 20 583 1,123 61 2,558 872<br />
1998 Number of Acres Sold Dollars per Number of Acres Sold Dollars per Number of Acres Sold Dollars per<br />
transactions<br />
acre transactions<br />
acre transactions<br />
acre<br />
All 86 6,306 847 34 1,452 1,016 120 7,758 879<br />
Without<br />
Buildings 49 2,656 625 13 514 882 62 3,170 667<br />
source: USDA<br />
Barron County Conditions and Trends Report 263
Table 7.12<br />
Forested Land Sales • 1998, 2001, 2005, and 2007<br />
Barron County<br />
Forested land continuing in forest<br />
Forested land being diverted to Total of all forested land<br />
land<br />
other uses<br />
Number of Acres Sold Dollars per Number of Acres Sold Dollars per Number of Acres Sold Dollars per<br />
Year transactions<br />
acre transactions<br />
acre transactions<br />
acre<br />
2007 26 853 1,822 7 227 2,549 33 1,080 1,975<br />
2005 31 1,041 1,938 5 134 2,186 36 1,175 1,967<br />
2001 49 1,865 1,215 23 497 1,217 72 2,362 1,215<br />
1998 82 2,440 663 31 944 672 113 3,384 665<br />
source: USDA<br />
Table 7.13<br />
Land Assessed Value per Acre by Town (dollars) • 2007*<br />
Barron County<br />
Town<br />
Residential<br />
Commercial<br />
Manufacturing<br />
Almena 39,040 2,405 0 151 363 849 1,668<br />
Arland 2,063 2,034 0 124 527 601 1,195<br />
Barron 4,535 4,923 + 149 278 551 1,168<br />
Bear Lake 19,406 7,751 0 143 471 751 1,562<br />
Cedar Lake 85,378 20,556 0 140 651 631 1,391<br />
Chetek 30,136 19,209 4,569 132 573 1,004 2,238<br />
Clinton 16,042 26,163 2,720 160 383 797 1,469<br />
Crystal Lake 15,936 6,403 2,173 125 222 657 1,399<br />
Cumberland 24,664 4,036 1,460 157 391 994 2,166<br />
Dallas 4,019 2,556 0 170 587 921 1,855<br />
Dovre 6,336 3,757 0 132 489 878 1,764<br />
Doyle 5,358 3,675 2,917 164 709 913 1,803<br />
Lakeland 27,930 8,668 3,673 126 335 732 1,614<br />
Maple Grove 3,901 3,523 0 151 326 620 1,170<br />
Maple Plain 45,925 18,970 0 127 271 615 1,314<br />
Oak Grove 10,152 2,476 1,442 157 407 800 1,600<br />
Prairie Farm 1,688 900 0 113 321 563 1,136<br />
Prairie Lake 26,765 11,746 3,667 147 590 792 1,615<br />
Rice Lake 14,552 7,024 1,279 147 454 800 1,530<br />
Sioux Creek 3,077 1,021 0 150 524 786 1,617<br />
Stanfold 3,432 2,906 2,120 126 331 621 1,222<br />
Stanley 15,188 15,736 2,877 144 448 846 1,703<br />
Sumner 2,780 1,731 0 100 485 571 1,152<br />
Turtle Lake 6,793 6,497 782 100 255 570 1,157<br />
Vance Creek 2,059 1,750 0 170 207 863 1,725<br />
TOTAL 417,155 186,416 29,679 3,505 10,598 18,726 38,233<br />
source: WI DOR * Based on assessment records. +Publicly owned, non-taxable industrial land.<br />
Agricultural<br />
Undeveloped<br />
Ag Forest<br />
Forest<br />
264 Land Use Information
Table 7.14<br />
Land Assessed Value per Acre by Village or City (dollars) • 2007*<br />
Barron County<br />
Village or<br />
City<br />
Residential<br />
Commercial<br />
Manufacturing<br />
Villages<br />
Almena 18,381 14,710 5,406 184 610 813 1,614<br />
Cameron 55,441 53,297 12,294 187 1,278 0 1,555<br />
Dallas 16,765 11,017 4,800 131 590 900 1,700<br />
Haugen 25,388 37,700 1,457 190 200 0 1,807<br />
New Auburn 16,500 0 0 0 0 0 0<br />
Prairie Farm 32,312 32,133 3,005 217 650 381 1,733<br />
Turtle Lake 28,356 31,081 15,439 152 374 900 1,950<br />
TOTAL 193,143 179,938 42,401 1,061 3,702 2,994 10,359<br />
Cities<br />
Barron 84,168 34,830 6,416 109 940 0 2,196<br />
Chetek 68,693 74,849 9,696 140 537 0 0<br />
Cumberland 45,657 27,935 12,964 122 255 462 1,511<br />
Rice Lake 40,930 56,524 18,339 193 1,217 0 1,214<br />
TOTAL 239,448 194,138 47,415 564 2,949 462 4,921<br />
source: WI DOR * Based on assessment records. +Publicly owned, non-taxable industrial land.<br />
Agricultural<br />
Undeveloped<br />
Ag Forest<br />
Forest<br />
Barron County Conditions and Trends Report 265
Municipality Land Use Maps<br />
The final component of the land use element includes a series of maps that show current<br />
land uses, productive agricultural soils, natural limitations for building site development,<br />
floodplains, and wetlands. Resource and development limitations maps are described in<br />
the Agricultural, Natural and Cultural Resources section and previously within this<br />
section. The city, village, and town maps themselves are found in Adobe Acrobat .pdf<br />
format in the Barron County Resource and Land Use Atlas DVD-ROM.<br />
Limitations to Development Maps<br />
The existence of some natural features in the physical environment, such as water,<br />
topography, and soil conditions, can act as constraints on development. Understanding<br />
the physical characteristics of the County can help identify areas that are more conducive<br />
to development activities and areas that may be better suited for non-development<br />
activities such as agriculture and natural resource management. The Barron County<br />
Resource and Land Use Atlas DVD-ROM contains maps of the resources, development<br />
limitations, and other environmentally sensitive lands within each community. County<br />
level maps are in Appendix A and in the Atlas DVD-ROM.<br />
In a number of instances, some of these development limitations may be overcome by<br />
more extensive and costly development methods; however, development should be<br />
encouraged in areas in which it can be most accommodated and have the least impact on<br />
environmentally sensitive and valued resource areas<br />
Existing Land Use Maps<br />
The existing land use maps are derived from a windshield survey done in 2000. The<br />
subsequent land use maps at the end of this section depict the general land uses in each<br />
community by approximate location. The Barron County Resource and Land Use Atlas<br />
DVD-ROM contains the existing land use maps in Adobe Acrobat .pdf format for each<br />
local jurisdiction in Barron County.<br />
266 Land Use Information