clark county - West Central Wisconsin Regional Planning Commission
clark county - West Central Wisconsin Regional Planning Commission
clark county - West Central Wisconsin Regional Planning Commission

Create successful ePaper yourself
Turn your PDF publications into a flip-book with our unique Google optimized e-Paper software.
CLARK COUNTY<br />
CONDITIONS AND TRENDS REPORT<br />
BACKGROUND INFORMATION FOR COMPREHENSIVE PLANNING<br />
JANUARY 2009<br />
PREPARED BY WEST CENTRAL WISCONSIN REGIONAL PLANNING COMMISSION
Clark County<br />
Conditions and Trends Report<br />
Presented to:<br />
Clark County and its Communities<br />
By:<br />
<strong>West</strong> <strong>Central</strong> <strong>Wisconsin</strong> <strong>Regional</strong> <strong>Planning</strong> <strong>Commission</strong><br />
Mail Box 9<br />
800 <strong>Wisconsin</strong> Street, Bldg D2-401<br />
Clark, WI 54703-3606<br />
715.836.2918<br />
With financial assistance from:<br />
<strong>Wisconsin</strong> Department of Administration<br />
Division of Intergovernmental Relations<br />
January 2009
Forward<br />
The Clark County Conditions and Trends Report, in conjunction with the Inventory and<br />
Trends Report for the Development of Local Comprehensive Plans and the Clark County<br />
Comprehensive Plan prepared by Foth & Van Dyke in November 2003, provides the majority<br />
of background information and existing resource maps as required for comprehensive<br />
planning efforts under the <strong>Wisconsin</strong> Comprehensive <strong>Planning</strong> Law (Wis. Act 9).<br />
There are two companion documents to this report:<br />
Clark County Resource and Land Use Map Atlas DVD-ROM: This is a compilation<br />
of existing resource and land use maps for the County and its municipalities in digital<br />
form. Land use data in these maps may need to be updated at the local level. <strong>West</strong><br />
<strong>Central</strong> <strong>Wisconsin</strong> <strong>Regional</strong> <strong>Planning</strong> <strong>Commission</strong> will provide the geographic<br />
information system files for these maps upon request.<br />
Inventory of Existing Plans, Programs, and Land Use Policies in <strong>West</strong> <strong>Central</strong><br />
<strong>Wisconsin</strong>: As its title relates, this special addendum provides a summary of the<br />
primary programs, plans, and land use policies being implemented within the seven<br />
counties of west central <strong>Wisconsin</strong>.<br />
This report was also intended to supplement, and in some cases update, the inventory report<br />
prepared in 2003 by Foth & Van Dyke, so readers should also refer to this original report<br />
available through the Clark County <strong>Planning</strong> & Zoning Department for information not found<br />
here.<br />
This report, combined with the 2003 inventory, should be considered a starting point for local<br />
planning efforts. Certain data and maps will need to be provided at a local level (e.g., maps<br />
and details on municipal utilities, special or regulatory districts, park systems, mining<br />
interests). Communities may also identify special issues or unique circumstances for which<br />
additional data may be collected locally. For the most part, this report merely presents the<br />
data; the <strong>county</strong> and each community will need to analyze the data to determine local needs,<br />
issues, and important trends.<br />
<strong>West</strong> <strong>Central</strong> <strong>Wisconsin</strong> <strong>Regional</strong> <strong>Planning</strong> <strong>Commission</strong> (WCWRPC) compiled this report in<br />
2008 as part of its regional comprehensive planning effort. Data sources used represent the<br />
best available data as of the summer and fall of 2008. A similar report was compiled for each<br />
of the other six counties in our region. Once complete, a regional level analysis will be<br />
undertaken based on the data in the individual <strong>county</strong> reports. The regional analysis may<br />
incorporate additional or updated information not available during the preparation of this<br />
report.<br />
WCWRPC would like to thank everyone who provided input and data for this document,<br />
including: various Clark County departments, Clark County Economic Development<br />
Corporation, the regional comprehensive planning effort’s Technical Advisory Group, and<br />
various State agencies.
CLARK COUNTY<br />
CONDITIONS & TRENDS REPORT<br />
TABLE OF CONTENTS<br />
Forward<br />
1. Issues and Opportunities Information........................................................................ 1<br />
Element Context.................................................................................................................. 2<br />
Socio-Economic Profile...................................................................................................... 3<br />
Population .................................................................................................................. 3<br />
Educational Attainment ............................................................................................. 8<br />
Employment............................................................................................................... 9<br />
Income...................................................................................................................... 10<br />
Population Projections ............................................................................................. 11<br />
Household Projections ............................................................................................. 13<br />
Employment Projections.......................................................................................... 13<br />
Summary ......................................................................................................................... 14<br />
Data Tables ....................................................................................................................... 15<br />
2. Housing Information .................................................................................................. 61<br />
Element Context................................................................................................................ 61<br />
Seasonal Units................................................................................................................... 62<br />
Occupancy and Structural Characteristics ........................................................................ 62<br />
Housing Affordability....................................................................................................... 62<br />
Housing Unit and Household Projections......................................................................... 63<br />
Housing Programs............................................................................................................. 63<br />
Summary ......................................................................................................................... 65<br />
Tables and Map................................................................................................................. 66<br />
3. Transportation Information ...................................................................................... 85<br />
Element Context................................................................................................................ 85<br />
Background Data/Existing Conditions ............................................................................. 86<br />
Highways ................................................................................................................. 86<br />
Highway Projections in the County ......................................................................... 87<br />
Bridges ..................................................................................................................... 89<br />
Access Management ................................................................................................ 90<br />
Bicycles.................................................................................................................... 92<br />
Safety ....................................................................................................................... 94<br />
Commuting Patterns.......................................................................................................... 96<br />
Summary........................................................................................................................... 98<br />
4. Utilities and Community Facilities Information ...................................................... 99<br />
Element Context................................................................................................................ 99<br />
Inventory of Utilities....................................................................................................... 100<br />
Inventory of Other Educational Facilities....................................................................... 100<br />
Clark County Conditions and Trends Report<br />
i
Cooperative Educational Service Agencies (CESA) ............................................. 100<br />
Vocational, Technical, and Adult Education ......................................................... 100<br />
University of <strong>Wisconsin</strong> System............................................................................ 101<br />
Other Colleges and Universities ............................................................................ 102<br />
Inventory of Other Community Facilities and Services ................................................. 102<br />
Hazardous Materials Response.............................................................................. 102<br />
Child Care Services................................................................................................ 103<br />
Assisted Living Facilities, Nursing Homes, and Senior Programs........................ 104<br />
Cemeteries.............................................................................................................. 106<br />
Dams ...................................................................................................................... 109<br />
Summary......................................................................................................................... 109<br />
5. Agricultural, Natural, and Cultural Resources Information................................ 115<br />
Element Context.............................................................................................................. 115<br />
Agricultural Resources.................................................................................................... 116<br />
Local Agricultural Industry Trends .................................................................... 116<br />
Natural Resources – Sensitive Lands.............................................................................. 121<br />
Shorelands.............................................................................................................. 122<br />
Floodplains............................................................................................................. 123<br />
Wetlands ................................................................................................................ 125<br />
Steep Slopes........................................................................................................... 125<br />
Forests and Woodlands.......................................................................................... 126<br />
Grasslands and Prairie............................................................................................ 127<br />
Summary......................................................................................................................... 128<br />
Clark County Natural Resource Maps ............................................................................ 130<br />
6. Economic Development Information ...................................................................... 131<br />
Element Context.............................................................................................................. 131<br />
The <strong>Wisconsin</strong> Economy ................................................................................................ 131<br />
Recent Economic Trends ....................................................................................... 132<br />
The Current Economic Slowdown......................................................................... 133<br />
<strong>Wisconsin</strong>’s Economic Outlook ............................................................................ 134<br />
Clark County Economic Profile...................................................................................... 135<br />
Economic Data....................................................................................................... 135<br />
Demographic Overview ............................................................................... 137<br />
Population and Labor Force ......................................................................... 137<br />
Housing Market............................................................................................ 138<br />
Income and Wages ....................................................................................... 139<br />
Employment Trends ..................................................................................... 140<br />
Commuting Patterns..................................................................................... 143<br />
Economic Base....................................................................................................... 144<br />
Industry Composition................................................................................... 144<br />
Employment by Industry.............................................................................. 145<br />
Employment by Occupation......................................................................... 146<br />
Employment Projections .............................................................................. 150<br />
Tourism.................................................................................................................. 154<br />
Environmentally Contaminated Sites ............................................................................. 156<br />
Summary......................................................................................................................... 157<br />
ii<br />
Table of Contents
7. Land Use Information .............................................................................................. 165<br />
Element Context.............................................................................................................. 165<br />
Existing Land Use and Land Use Trends ....................................................................... 165<br />
Agricultural Land Use............................................................................................ 166<br />
Forest Land Use ..................................................................................................... 168<br />
Public Natural Resources Lands ............................................................................ 168<br />
Residential Land Use ............................................................................................. 169<br />
Commercial Land Use ........................................................................................... 169<br />
Industrial Land Use................................................................................................ 170<br />
Land Demand and Prices ....................................................................................... 171<br />
Summary ....................................................................................................................... 172<br />
Land Use Tables ............................................................................................................. 174<br />
Municipality Land Use Maps.......................................................................................... 185<br />
Limitations to Development Maps......................................................................... 185<br />
Existing Land Use Maps........................................................................................ 185<br />
List of Figures<br />
Figure 1.1 - Clark County Historical Population.................................................................3<br />
Figure 1.2 – County Population Distribution by Incorporated & Rural Residents..............6<br />
Figure 1.3 – County Components of Population Change ....................................................7<br />
Figure 1.4 – County Racial Population Characteristics.......................................................8<br />
Figure 3.1 – Crashes by Highway Type ............................................................................94<br />
Figure 5.1 – Number and Average Size of Farms ...........................................................117<br />
Figure 5.2 – Number of Farms and Dairy Farms.............................................................120<br />
Figure 6.1 – Composite Index of Leading Indicators for <strong>Wisconsin</strong>...............................132<br />
Figure 6.2 – Gasoline & Medical Costs Compared to Consumer Price Index ................133<br />
Figure 6.3 – Clark County Age/Labor Force Projection..................................................138<br />
Figure 6.4 – Clark County vs. State Per Capita Personal Income ...................................139<br />
Figure 6.5 – Clark County & <strong>Wisconsin</strong> Monthly Unemployment Rate .............................141<br />
Figure 6.6 – Clark County Monthly Total Potential Labor Force ...................................142<br />
Figure 6.7 – Clark County Travel Time to Work ............................................................143<br />
Figure 6.8 – Clark County Employment by Industry ......................................................146<br />
Figure 6.9 – <strong>West</strong> <strong>Central</strong> <strong>Wisconsin</strong> Workforce Development Area.............................148<br />
Figure 6.10 – Traveler Expenditures in Clark County.....................................................155<br />
Figure 6.11 – Seasonality of Traveler Expenditures in Clark County.............................156<br />
List of Tables<br />
Table 1.1 – County Population Distribution by Incorporated & Rural Communities.........6<br />
Table 1.2 – County Historical Population..........................................................................15<br />
Table 1.3 – County Historical Population Change by Municpality...................................16<br />
Table 1.4 – County Historical Population by Age and Sex ...............................................17<br />
Table 1.5 – County Components of Population Change ...................................................17<br />
Table 1.6 – County Change in Age-Sex Structure.............................................................18<br />
Table 1.7 – Population by Age and Sex by Municipality (2000) ......................................19<br />
Table 1.8 – Population by Age by Municipality (1990) ....................................................23<br />
Table 1.9 – Percent Change in Age Structure by Municipality .........................................27<br />
Table 1.10 – Population Projections, County and Municpality.........................................31<br />
Table 1.11 – Household Projections, County and Municpality.........................................32<br />
Clark County Conditions and Trends Report<br />
iii
Table 1.12 –<strong>West</strong> <strong>Central</strong> <strong>Wisconsin</strong> Region Occupation Projections..............................33<br />
Table 1.13 – <strong>West</strong> <strong>Central</strong> <strong>Wisconsin</strong> Region Industry Projections..................................33<br />
Table 1.14 – Race Characteristics, County and Municipality ...........................................34<br />
Table 1.15 – Educational Attainment Levels, County and Municipality ..........................35<br />
Table 1.16 – Labor Force (2000), County and Municipality.............................................45<br />
Table 1.17 – Labor Force (1990), County and Municipality.............................................47<br />
Table 1.18 – County Non-Farm Wage and Salary Employment .......................................49<br />
Table 1.19 – Employment by Industry (2000), County and Municipality.........................50<br />
Table 1.20 – Employment by Industry (1990), County and Municipality.........................52<br />
Table 1.21 – Employment by Occupation (2000), County and Municipality ...................54<br />
Table 1.22 – Employment by Occupation (1990), County and Municipality ...................56<br />
Table 1.23 – Travel Time to Work by Municipality..........................................................58<br />
Table 1.24 – Place of Work, County and Municipality .....................................................58<br />
Table 1.25 – Households by Household Income by Municipality.....................................59<br />
Table 1.26 – Median Household Income (comparison of counties)..................................59<br />
Table 1.27 – Median Household Income (municipalities).................................................60<br />
Table 2.1 – Seasonal Units, County and Municipality ......................................................65<br />
Table 2.2 – Units in Structure, County and Municipality..................................................66<br />
Table 2.3 – Contract Rent (Renter-Occupied Units), County and Municipality ...............67<br />
Table 2.4 – Owner-Occupied Housing Costs as Percentage of Household Income<br />
County and Municipality.................................................................................68<br />
Table 2.5 – Renter-Occupied Housing Costs as a Percentage of Household Income<br />
County and Municipality.................................................................................69<br />
Table 2.6 – Housing Unit Projections, County and Municipality......................................70<br />
Table 2.7 – Housing Characteristics by Municipality .......................................................71<br />
Table 3.1 – Road Mileage by Jurisdiction .........................................................................86<br />
Table 3.2 – WisDOT 6-year Plan project for Clark County..............................................87<br />
Table 3.3 – Ownership of Bridges in Clark County ..........................................................89<br />
Table 3.4 – Functionally Obsolete/Structurally Deficient Bridges, Clark County............90<br />
Table 3.5 – Clark County Crash History ...........................................................................93<br />
Table 3.6 – Highway Crashes by Municipality .................................................................95<br />
Table 3.7 – Commuting Patterns of Clark County Residents by Municipality .................97<br />
Table 4.1 – Enrollment of UW-Campuses in <strong>West</strong> <strong>Central</strong> <strong>Wisconsin</strong>...........................101<br />
Table 4.2 – Licensed Child Care Facilities in Clark County ...........................................103<br />
Table 4.3 – Assisted Living Facilities in Clark County...................................................105<br />
Table 4.4 – Clark County Cemeteries..............................................................................107<br />
Table 5.1 – Acres in Farmland.........................................................................................117<br />
Table 5.2 – Number of Farms by Ownership ..................................................................117<br />
Table 5.3 – Assessed Agricultural Parcels & Acreage by Municipality..........................118<br />
Table 5.4 – Potential 100-Year Floodplain Improvements by Town ..............................124<br />
Table 5.5 – Assessed Forest & Ag Forest Parcels & Acreage by Town .........................127<br />
Table 6.1 – Clark County Educational Attainment..........................................................139<br />
Table 6.2 – Clark County Average Annual Wages by Industry ......................................140<br />
Table 6.3 – Clark County Number of Establishments by Industry..................................144<br />
Table 6.4 – Clark County Employment by Industry........................................................145<br />
Table 6.5 – Clark County Top Employers as of March 2007..........................................147<br />
Table 6.6 – <strong>West</strong> <strong>Central</strong> Wis. Estimated Employment and Salary by Occup................149<br />
Table 6.7 – <strong>West</strong> <strong>Central</strong> Wis. Industry Projections........................................................151<br />
iv<br />
Table of Contents
Table 6.8 – <strong>West</strong> <strong>Central</strong> Wis. Occupation Projections and Est. Wages.........................152<br />
Table 6.9 – <strong>West</strong> <strong>Central</strong> Wis. Occupation Projections...................................................153<br />
Table 6.10 – Contaminated Sites in Clark County ..........................................................160<br />
Table 7.1 – County Land Use ..........................................................................................166<br />
Table 7.2 – Acreage Loss of Land Assessed Agricultural by Municipality ....................166<br />
Table 7.3 – Percentage Loss of Land Assessed Agricultural by Municipality................167<br />
Table 7.4 – Most Agricultural Acres by Municipality.....................................................167<br />
Table 7.5 – Public Natural Resource Lands.....................................................................169<br />
Table 7.6 – Assessed Residential Acres, County and Municipality ................................174<br />
Table 7.7 – Assessed Commercial Acres, County and Municipality ..............................175<br />
Table 7.8 – Assessed Industrial Acres, County and Municipality...................................176<br />
Table 7.9 – Assessed Agricultural Parcels and Acreage, County and Municipality .......177<br />
Table 7.10 – Assessed Forest Parcels and Acreage by Town..........................................178<br />
Table 7.11 – Land Use Acreage, County and Municipality, 1987 ..................................179<br />
Table 7.12 – Land Use Acreage, County and Municipality, 1997 ..................................180<br />
Table 7.13 – Land Use Acreage, County and Municipality, 2007 ..................................181<br />
Table 7.14 – Agricultural Land Sales ..............................................................................182<br />
Table 7.15 – Forested Land Sales....................................................................................183<br />
Table 7.16 – Land Value Per Acre by Town ...................................................................183<br />
Table 7.17 – Land Value Per Acre by City or Village.....................................................184<br />
List of Maps<br />
1.1 – Clark County Locational Map ....................................................................................1<br />
1.2 – Clark County Population Change ...............................................................................5<br />
1.3 – Clark County Population Projections........................................................................12<br />
2.1 – Clark County Housing Unit Change.........................................................................83<br />
3.1 – Clark County Rural Functional Classification..........................................................88<br />
3.2 – Clark County Bicycling Conditions Assessment .....................................................92<br />
4.1 – Vocational Districts in the Region .........................................................................100<br />
4.2 – Electric Service in <strong>West</strong> <strong>Central</strong> <strong>Wisconsin</strong> ...........................................................111<br />
4.3 – Natural Gas Service in <strong>West</strong> <strong>Central</strong> <strong>Wisconsin</strong> ....................................................112<br />
4.4 – Clark County School Districts ................................................................................113<br />
Clark County Conditions and Trends Report<br />
v
Appendix A: Clark County Resource and Development Limitations Maps<br />
5.1 – Agricultural Lands (Cultivated Fields)<br />
5.2 – Soil Capability for Agricultural Crops (Prime Farmland)<br />
5.3 - Elevation<br />
5.4 – Potential Sand & Gravel Deposits<br />
5.5 – Flooding (Frequently Flooded Soils)<br />
5.6 – Wetlands and Water Resources<br />
5.7 – Steep Slopes<br />
5.8 – Forested Areas<br />
5.9 – Grasslands<br />
5.10 – Endangered Species & Natural Communities<br />
7.1 – Shallow Depth to Bedrock<br />
7.2 – Shallow Depth to Groundwater<br />
7.3 – Limitations for Septic Systems<br />
7.4 – Limitations for Residential Basements<br />
7.5 – Limitations for Small Commercial Buildings<br />
Clark County Resource and Land Use Atlas DVD<br />
Base Maps........................................................... for cities, villages, and towns in the Atlas<br />
Agricultural Lands (cultivated fields)............................. for County and towns in the Atlas<br />
Prime Farmland............................................................... for County and towns in the Atlas<br />
Elevation .............................................................................for all communities in the Atlas<br />
General Soil Associations............................................... for County and towns in the Atlas<br />
Potential Sand & Gravel Deposits .................................. for County and towns in the Atlas<br />
Surface Water Resources ....................................................for all communities in the Atlas<br />
Watersheds........................................................................................for County in the Atlas<br />
Floodplains (100-year) & Frequently Flooded Soils ..........for all communities in the Atlas<br />
Wetlands .............................................................................for all communities in the Atlas<br />
Steep Slopes........................................................................for all communities in the Atlas<br />
Forested Areas ................................................................ for County and towns in the Atlas<br />
Shallow Depth to Bedrock..................................................for all communities in the Atlas<br />
Shallow Depth to Groundwater ..........................................for all communities in the Atlas<br />
Limitations for Septic Systems ...........................................for all communities in the Atlas<br />
Limitations for Residential Basements ...............................for all communities in the Atlas<br />
Limitations for Small Commercial Buildings.....................for all communities in the Atlas<br />
Endangered Species and Natural Communities................................for County in the Atlas<br />
Town Land Use & Land Cover (2000) ..............................................for towns in the Atlas<br />
Village & City Land Use (2000)......................................for villages and cities in the Atlas<br />
vi<br />
Table of Contents
1. ISSUES AND OPPORTUNITIES INFORMATION<br />
Introduction<br />
The County Setting<br />
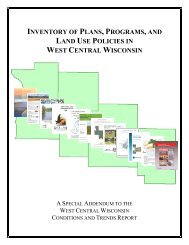
Clark County is located in central <strong>Wisconsin</strong> (see Map 1.1 below). With 1,215 square<br />
miles of surface area, Clark County is the seventh largest <strong>county</strong> in the State of<br />
<strong>Wisconsin</strong>. The County is bordered to the west by Chippewa and Eau Claire counties, to<br />
the south and west by Jackson County, to the east by Wood and Marathon counties, and<br />
to the north by Taylor County.<br />
Clark County had a 2008 population estimate of 34,589 which is a 3.1 percent increase<br />
since 2000. Clark County is comprised of all or parts of 46 civil divisions, consisting of<br />
33 towns, five villages and eight cities. The City of Neillsville, with an estimated<br />
population of 2,648, is the<br />
Map 1.1 - Clark County Locational Map<br />
largest community is Clark<br />
County and also the <strong>county</strong><br />
seat. Three villages<br />
(Dorchester, Granton and<br />
Unity) and three cities<br />
(Abbotsford, Colby, and<br />
Stanley) have portions of<br />
their municipality within<br />
an adjacent <strong>county</strong>.<br />
Generally, the topography<br />
of Clark County is gently<br />
rolling, becoming<br />
increasingly more rugged<br />
and hilly in the<br />
southwestern portion of the<br />
County where the most<br />
recent glacial activity had<br />
not eroded away the<br />
sandstone. Prime farm<br />
soils dominate the<br />
northeast and east central<br />
portions of Clark County,<br />
while forest, wetlands, and<br />
other undeveloped uses<br />
dominate the more poorly<br />
drained soils in the western<br />
and southern parts of the<br />
County.<br />
Clark County Conditions and Trends Report 1
While Clark County has a total surface water area of 1,865 acres in 19 lakes, none of<br />
these lakes are natural. In most cases, water levels on these man-made flowages are<br />
controlled, which reduces the potential of flooding. The County also has numerous<br />
streams which flow into one of three major waterways—Eau Claire River to north and<br />
west, Yellow River to the east, and Black River which runs directly through the center of<br />
the County. Clark County is comprised of all or parts of sixteen watersheds which drain<br />
into one of three river basins in the County—the Upper <strong>Wisconsin</strong> River Basin in the<br />
east, the Black River Basin in the central portion, and the Lower Chippewa River Basin<br />
in the west.<br />
Approximately 34 percent of the County’s land base in 2000 was in agricultural<br />
croplands (excluding pasture). Large portions of the County, especially to the west and<br />
south, are forested, including over 130,000 acres of County forest lands. While the<br />
County has few lakes, almost 13% of the total acreage of Clark County is wetlands.<br />
The climate of Clark County is classified as mid-latitude continental. Warm, humid<br />
summers and cold, snowy winters are the main characteristics. The average monthly<br />
temperature ranges from 11 degrees Fahrenheit in January to 68.6 degrees Fahrenheit in<br />
July, though a low of –48 degrees was recorded for January 30, 1951, and a high of 99<br />
degrees recorded for June 6, 1968. Annual precipitation averages 31 inches, with<br />
approximately 74% of this precipitation occurring as rain during the months of April<br />
through September. Seasonal snowfall averages 40.6 inches, but can vary dramatically<br />
from year to year, with a 44-inch snow depth being the deepest ever recorded. On<br />
average, at least one inch of snow is on the ground for 66 days of the year. The<br />
prevailing winds are from the west or northwest, with the average highest wind speed of<br />
11 miles per hour occurring in the spring months.<br />
An interstate highway does not intersect Clark County. Only 202 miles of federal and<br />
state highways existing in the County, including U.S. Highway 10 and State Highways<br />
13, 29, 73, 95, and 98. The rural nature and low development density of Clark County<br />
have had two unique impacts on local road systems: (1) there are approximately 1,457<br />
miles of unpaved local roads, compared to only 148 miles of paved roads; and (2) there is<br />
great dependence on the <strong>county</strong> highway system and Clark County maintains over 300<br />
miles of <strong>county</strong> trunk highways.<br />
Element Context<br />
This section is a primary source for the necessary background information for the Issues<br />
and Opportunities Element of a comprehensive plan for communities in Clark County. A<br />
socio-economic profile for all of Clark County is provided, which provides the<br />
demographic context for communities developing their individual plans.<br />
Overall comprehensive planning goals and objectives for the County are not provided in<br />
this section; instead, each community’s comprehensive plan will contain its own<br />
individual vision, goals, and objectives. Existing governmental programs and policies are<br />
also not provided here, but are reviewed in the Special Addendum: Inventory of Existing<br />
Plans, Programs, & Land Use Policies in <strong>West</strong> <strong>Central</strong> <strong>Wisconsin</strong>.<br />
2 Issues & Opportunities Information
Socio-Economic Profile<br />
Population<br />
Analyzing population size, growth, density, characteristics and distribution trends reveals<br />
important facts about the most important component of growth and development in Clark<br />
County ⎯ its residents. Reviewing population characteristics will reveal important<br />
indicators of change that must be recognized to effectively prepare for change.<br />
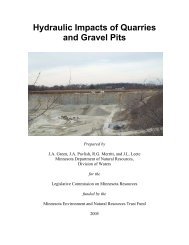
After two decades of significant growth in the early part of the 20 th Century, Clark<br />
County’s population decreased steadily until 1970 when it began to rise once again.<br />
Even with population growth in recent years, the 2008 population estimate of 34,589 is<br />
still below the County’s 1920 population of 35,120. Between 2000 and 2008, the<br />
County’s population increased by 1,032 people, or 3.1 percent. If such a rate of growth<br />
were continued throughout the decade it would result in a decennial rate of about 3.8<br />
percent, below the six percent growth rate of the 1990s. See Figure 1.1 below, and<br />
Tables 1.2 and 1.3 at the end of this section.<br />
Figure 1.1 - Clark County Historical Population (1900 to 2008)<br />
Population<br />
40,000<br />
38,000<br />
36,000<br />
34,000<br />
32,000<br />
30,000<br />
28,000<br />
26,000<br />
24,000<br />
22,000<br />
20,000<br />
1900 1910 1920 1930 1940 1950 1960 1970 1980 1990 2000 2008<br />
Year<br />
source: U.S. Census Bureau; <strong>Wisconsin</strong> Department of Administration 2008 estimate<br />
From 1990 to 2000, the towns of Dewhurst, Sherwood, Fremont, and Beaver had the<br />
highest rates of growth as a percentage of its population in Clark County (see Table 1.3 at<br />
end of section). The following communities had the most significant population growth<br />
in Clark County between 1990 to 2000:<br />
Town of Dewhurst 62.9%<br />
Town of Sherwood 29.2%<br />
Town of Fremont 23.6%<br />
Town of Beaver 21.5%<br />
Town of Lynn 18.6%<br />
Clark County Conditions and Trends Report 3
Village of Dorchester (part) 18.1%<br />
Town of Mead 16.5%<br />
In terms of actual population increases, the Town of Fremont had the largest number of<br />
new residents (+227) between 1990 and 2000. The following communities all increased<br />
in population by over 100 residents during the 1990s: towns of Beaver, Dewhurst, Lynn,<br />
and Withee, Village of Dorchester (part), and cities of Greenwood, and Loyal. Numerous<br />
communities decreased in population during this timeframe: towns of Butler, Hendren,<br />
Mayville, <strong>West</strong>on, and York, Village of Unity (part), and City of Thorp.<br />
Map 1.2 shows the population change for Clark County communities between 1970 and<br />
2000. Overall, the villages of Clark County have had the highest rates of population<br />
growth since the 1970s, though the towns grew slightly faster during the 1990s. Many of<br />
the fastest growing communities from 1970 to 2000 were areas which offered attractive<br />
natural amenities (e.g., forests, lakes/rivers, hunting lands), such as the towns of Foster,<br />
Hewett, Dewhurst.<br />
4 Issues & Opportunities Information
Map 1.2 - Clark County Population Change (1970 to 2000)<br />
Clark County Conditions and Trends Report 5
Like most of west central <strong>Wisconsin</strong>, with the exception of Eau Claire County to the<br />
west, the percentage of Clark County’s population in unincorporated areas has been<br />
increasing in recent years (see Table 1.1 and Figure 1.2).<br />
Table 1.1<br />
Clark County Population Distribution by Incorporated and Unincorporated Communities<br />
(1950 to 2008)<br />
Area 1950 1960 1970 1980 1990 2000 2008<br />
Incorporated 10,251 10,794 10,953 12,155 11,879 12,256 12,188<br />
Unincorporated 22,208 20,733 19,408 20,755 19,768 21,301 22,401<br />
% Incorporated 31.6 34.2 36.1 36.9 37.5 36.5 35.2<br />
source: U.S. Census Bureau, WisDOA Demographic Services 2008<br />
The most significant change since 1950 is the large reduction in the rural farm population<br />
from 19,791 in 1950 to 5,519 in 2000. Yet, even with this decrease, 16.5 percent of the<br />
County’s population in 2000 was rural-farm. This is the highest percentage of rural-farm<br />
population in the seven-<strong>county</strong> west central <strong>Wisconsin</strong> region, with Dunn County at 7.3<br />
percent having the next highest percentage.<br />
Figure 1.2<br />
Clark County Population Distribution by Incorporated & Rural Residents (1950 to 2000)<br />
Percent of Total Population<br />
70<br />
60<br />
50<br />
40<br />
30<br />
20<br />
10<br />
0<br />
1950 1960 1970 1980 1990 2000<br />
Year<br />
source: U.S. Census Bureau<br />
City or Village Rural Farm Rural Non-Farm<br />
From 1950 to 2000, population increases in Clark County has been largely from natural<br />
increases (births) rather than the in-migration of new residents (see Table 1.5 and Figure<br />
1.3). In fact, only during the 1970s and 1990s has the County had a positive net<br />
migration, with more residents leaving the County than entering it during the 1950s,<br />
1960s, and 1980s.<br />
6 Issues & Opportunities Information
Figure 1.3<br />
Clark County Components of Population Change (1950 to 2000)<br />
6,000<br />
4,000<br />
2,000<br />
People<br />
0<br />
-2,000<br />
1950-60 1960-70 1970-80 1980-90 1990-00<br />
-4,000<br />
-6,000<br />
Year<br />
Natural Increase<br />
Net Migration<br />
Source: U.S. Census Bureau<br />
The average age of Clark County residents increased 5.5 years from 1980 to 2000 to a<br />
median age of 35.9 years in 2000 (see Table 1.6), which just below the State of<br />
<strong>Wisconsin</strong> 2000 median age of 36.0. Population increased only in the 35-44, 45-54, and<br />
75+ age groups between 1990 and 2000, reflecting the County’s large baby boom of the<br />
1950s and 1960s shown in Figure 1.3.<br />
The 1990 and 2000 age-by-sex breakdowns and percentage change for each municipality<br />
in Clark County are included at the end of this section in Tables 1.7, 1.8., and 1.9, at the<br />
end of this section.<br />
Overall, Clark County’s population is relatively homogenous, with 97.5 percent of the<br />
population in the white, non-Hispanic racial group as of 2000. Figure 1.4 shows the<br />
distribution of the population by race for much of the remaining population 1 (representing<br />
about 612 persons in 2000) for 1990 and 2000. During the past decade, the population in<br />
all racial groups increased. The “other race” category grew most and more residents in<br />
Clark County reported their race as “other” in 2000 than any of the other racial groups<br />
shown in Figure 1.4.<br />
Table 1.14 shows the race characteristics of Clark County by municipality in 2000.<br />
Hispanic/Latino is not shown in Table 1.14 since this is considered an ethnicity by<br />
Census standards and not a race; individuals of Hispanic or Latino ethnicity are included<br />
as part of the other race categories shown. In 2000, a total of 301 persons in Clark<br />
1 Due to differences between the 1990 and 2000 Censuses in the collection of data by race and ethnicity,<br />
Figure 1.4 does not include persons of two or more races and Pacific Islanders in the 2000 figures.<br />
Clark County Conditions and Trends Report 7
County were identified as being of Hispanic or Latino ethnicity, an increase of 242<br />
persons from 1990.<br />
Figure 1.4<br />
Clark County Racial/Ethnic Population Characteristics (1990 and 2000)<br />
180<br />
160<br />
140<br />
120<br />
People<br />
100<br />
80<br />
60<br />
40<br />
20<br />
0<br />
Source: U.S. Census Bureau<br />
Black American Indian Asian White Hispanic Other<br />
Year<br />
Educational Attainment<br />
1990 2000<br />
The Decennial Census provides information on educational attainment levels, which are<br />
listed in Table 1.15. All but eight Clark County communities saw a greater percentage of<br />
residents, 25 years or older, with high school or higher education levels in 2000 than in<br />
1990.<br />
It should be no surprise with the large investments in education and the increasing<br />
requirement for technical or post-secondary degrees for job placement that larger<br />
numbers of people are pursuing higher education. Clark County communities have had a<br />
significant percentage of people who have attained high school or higher educational<br />
levels (75.4 percent in 2000), though these attainment numbers are the lowest of the<br />
seven-<strong>county</strong> west central <strong>Wisconsin</strong> region. Since 1990, more Clark County residents<br />
have pursued post-secondary education. In 2000, 32.7 percent of Clark County residents<br />
25 years or older had attended a post-secondary institution, with 16.5 percent achieving a<br />
degree.<br />
8 Issues & Opportunities Information
Employment<br />
The area’s current economic growth is a major contributor to the employment<br />
opportunities available to Clark County residents. The principal economic factors that<br />
influence an individual's quality of life and provide a choice of residential options are<br />
employment opportunities and income. A comparison of labor force and employment<br />
statistics for 1990 and 2000 provides some insight into the economic well-being of Clark<br />
County community residents.<br />
Personal income is derived primarily from employment wages. An individual's<br />
occupation determines the range of that wage scale and influences the personal standard<br />
of living. A comparison of the occupations of those employed in the labor force helps to<br />
determine the economic affect of the employment opportunities available to area<br />
residents, and the ability to increase their standard of living.<br />
While the segment of the population eligible for the labor force in Clark County grew by<br />
7.9 percent between 1990 and 2000 (see Table 1.16 and Table 1.17), the actual number in<br />
the labor force increased by 12.3 percent. The employed residents in the labor force<br />
increased by 13.7 percent over the same period, while the number of unemployed<br />
residents decreased by 11.3 percent. Based on these statistics, it appears that a growing<br />
number of County residents had been finding employment opportunities in the 1990s.<br />
Table 1.18 shows the employment trends between 1990 and 2006 for employers in Clark<br />
County based on tax and employee information. However, the Census Bureau collects<br />
place-of-residence employment data. This means these data can tell us in what industries<br />
or occupations the residents of Clark County communities work, but not where they<br />
work. Tables 1.20 and 1.21 at the end of this section compare the industries in which<br />
Clark County residents worked between 1990 and 2000. During this timeframe, the<br />
largest increases occurred in the manufacturing, education and health services, and arts,<br />
entertainment, accommodation, and food service industries. Perhaps surprising is the<br />
decrease in employment in the retail trade industry.<br />
Tables 1.22 and 1.23 show in what occupations Clark County residents were employed as<br />
opposed to the industries in which they work. The number of residents in managerial,<br />
professional, and technician occupations increased most, while the most significant<br />
decreases occurred in the farming, forestry, and fishing occupations. Production,<br />
transportation, and material moving occupations saw a very small decrease. No 1990<br />
data for construction occupations was available for comparison.<br />
The economic downturn early in the decade starting in 2000 makes it uncertain how the<br />
labor force and employment has been affected in Clark County. Tables 1.18 and 1.19<br />
may provide indicators in employment for Clark County that reflect the recent economic<br />
slowdown. Table 1.18 shows Clark County non-farm employment for 1990 through<br />
2006. Although one cannot see what is happening in each municipality, one could infer<br />
that the trend defined for Clark County is likely to show changes in employment<br />
opportunities for the residents of most Clark County communities. Table 1.18 shows that<br />
employment in the County has increased overall since 1990, with a slowdown in the early<br />
Clark County Conditions and Trends Report 9
part of this decade reflecting the larger national economic slowdown at that time.<br />
Between 2002 and 2006, employment has been growing more slowly in Clark County<br />
compared to the growth rate of the 1990s.<br />
Although the Decennial Census’s standard available information limits employment<br />
information to place of residence, it also provides information that can indicate Clark<br />
County’s commuting characteristics. Table 1.23 shows how long it took Clark County<br />
residents to get to work in 1990 and 2000. During this period, the number of residents<br />
who worked at home or commuted less than 20 minutes to work increased by less than<br />
one percent between 1990 and 2000, while the number of residents who commuted 20<br />
minutes or more to work increased by 44.9 percent. In 1990, 28.4 percent of employed<br />
residents commuted 20 minutes or longer, which increased to 36.2 percent by 2000. In<br />
general, Clark County residents are travelling longer distances to work.<br />
Studying the distribution of workers and employment centers is helpful with economic<br />
development efforts and transportation infrastructure management. The Census<br />
information that reveals actual commuting patterns is called Place of Residence/Place of<br />
Work which is shown in Table 1.24. In 2000, about 66.6 percent of the workers living in<br />
the County worked within Clark County and 12.5 percent commuted to nearby Wood<br />
County.<br />
Income<br />
The combined effect of advanced education and increased employment opportunities, and<br />
evidence of well-paying occupations, is also reflected in the earning capability and<br />
increasing incomes of Clark County residents. Table 1.25 shows household income<br />
distribution for Clark County households in 1989 and 1999. Table 1.26 shows the<br />
changes in income of Clark County and surrounding <strong>county</strong> residents between 1990 and<br />
2000. Finally, Table 1.27 shows the median household income for all Clark County<br />
communities.<br />
Household income is the sum of money income received in the calendar year before the<br />
decennial census and is collected for all household members 15 years old and over,<br />
including household members not related to the householder, people living alone, and<br />
other non-family household members. Included in the total are amounts reported<br />
separately for wage or salary income; net self-employment income; interest, dividends, or<br />
net rental or royalty income or income from estates and trusts; Social Security or Railroad<br />
Retirement income; Supplemental Security Income (SSI); public assistance or welfare<br />
payments; retirement, survivor, or disability pensions; and all other income. The median<br />
is the mathematically derived middle value with 50 percent of households above and 50<br />
percent below that number.<br />
It can be seen from Table 1.26 that Clark County has a significantly lower median<br />
household income compared to the surrounding counties. Certainly counties with, or<br />
closer to, larger urban centers have a greater “economic engine” that provides<br />
employment opportunities and resultant higher income levels. Those counties with lower<br />
10 Issues & Opportunities Information
incomes all have smaller urban centers or are further away from significant employment<br />
centers.<br />
The data indicates that incomes for Clark County community residents increased faster<br />
than the State of <strong>Wisconsin</strong> average between 1990 and 2000, but remains well below the<br />
state median household income. It can also be seen that the median household income in<br />
many of the unincorporated towns are above the County median household income.<br />
Population Projections<br />
Population projections have long been used to assess development prospects and<br />
community facility needs created by population growth. Small area population forecasts<br />
can be used to evaluate potential residential development and economic conditions, and<br />
the level of demand for public facilities and services. Businesses, schools and<br />
government frequently use these forecasts to determine the future needs or design of<br />
public facilities or services. This estimate of future growth is also valuable information<br />
for establishing management techniques to guide orderly growth and development.<br />
Projecting population is not a science in which absolutes can be placed. Consequently,<br />
there are limitations that should be remembered when reviewing and evaluating these<br />
forecasts. These limitations include:<br />
<br />
<br />
<br />
<br />
Population projections are based on historical trends of population growth that are<br />
extended into the future, and the assumption that those trends, and the factors behind<br />
them, will continue to some point in time.<br />
Forecasts of large area populations (e.g., states or counties) are more reliable. The<br />
smaller the area for which a projection is produced, like an individual community, the<br />
greater the possibility for error.<br />
The closer the projection year is to the base year; the more likely the population for<br />
that projection will be close to the true population.<br />
Population projections are, at best, guides and their limitations must be considered.<br />
Intimate knowledge of local conditions can help build local variables into population<br />
projections to enhance their validity.<br />
The <strong>Wisconsin</strong> Department of Administration (WisDOA) population projections are, by<br />
state statute, the official population projections for <strong>Wisconsin</strong>. As shown in Table 1.10<br />
and Map 1.3, between 2000 and 2030, the WisDOA projections predict a 21.7 percent<br />
increase in the Clark County population (about 7,276 more residents). Like recent trends,<br />
the percentage increases are projected to be highest in many of the towns, with the<br />
villages and cities generally growing at a slower pace.<br />
Clark County Conditions and Trends Report 11
Map 1.3 - Clark County Population Projections (2000 to 2030)<br />
12 Issues & Opportunities Information
Household Projections<br />
A household forecast is used to help develop housing and land-use forecasts. The<br />
<strong>Wisconsin</strong> Department of Administration, Demographic Services has prepared household<br />
projections for year 2000 to 2030 in five-year increments found in Table 1.11.<br />
Employment Projections<br />
In May 2008, the <strong>Wisconsin</strong> Department of Workforce Development (WDWD) Office of<br />
Economic Advisors (OEA) released a series of publications entitled OEA 2006-2016<br />
Statewide Long-term Projections. In addition, a WDWD-OEA report entitled<br />
Occupation Projections for <strong>West</strong> <strong>Central</strong> <strong>Wisconsin</strong> Workforce Development Area, 2004-<br />
2014 was also released in August of 2006. These reports make economic projections<br />
regarding the state’s labor force, industries and occupations.<br />
Municipal units within Clark County have employment patterns that are similar to the<br />
state. It is expected that during the next several years, <strong>Wisconsin</strong>’s population is<br />
projected to grow slower and older than the nation as a whole, therefore leading to lower<br />
workforce participation rates. <strong>Wisconsin</strong> is also having difficulty attracting domestic<br />
migrants and retaining its own citizens. However, the number of international<br />
immigrants is increasing significantly. <strong>Wisconsin</strong> will continue to face the challenge of<br />
filling job openings. The industries that are projected to add the most jobs from 2006-<br />
2016 are ambulatory health care services, administrative and support services, eating and<br />
drinking establishments, hospitals, social assistance, and professional, scientific and<br />
technical services. The top six occupations in <strong>Wisconsin</strong> with the greatest expected job<br />
growth for 2006-2016 are retail salespersons (32,400); cashiers (31,400);<br />
waiters/waitresses (30,900); registered nurses (21,800); customer service representatives<br />
(21,000); and combined food preparation/serving workers (20,800). For further labor<br />
force and economic base indicators refer to Section 6: Economic Development<br />
Information section.<br />
Table 1.12 presents employment and wage projections by the top 10 occupations for the<br />
<strong>Wisconsin</strong> Department of Workforce Development-<strong>West</strong> <strong>Central</strong> <strong>Wisconsin</strong> Region.<br />
This represents the occupation opportunities available for Clark County residents. The<br />
greatest demand for workers is in the occupations on the ‘Most Openings’ list. This list<br />
includes many occupations considered as first-time, or temporary, jobs that workers often<br />
leave as other opportunities open up. Turnover is high and wages are low. There is one<br />
exception on the list: registered nurses which requires a greater degree of education or<br />
training and reflects a higher wage scale.<br />
The ‘Fastest Growth’ occupations are often referred to as hot jobs, with more training<br />
requirements and better wages. There are often fewer openings in these jobs since the list<br />
is based on the greatest percent change in employment; for example, an occupation that<br />
increases from 5 to 10 jobs increased 100 percent, whereas an occupation that increases<br />
from 2,000 to 2,200 jobs increased only 10 percent.<br />
Clark County Conditions and Trends Report 13
Table 1.13 shows employment projections by industry for the <strong>West</strong> <strong>Central</strong> <strong>Wisconsin</strong><br />
Region. The greatest potential growth for employment appears to be in health and<br />
education related fields, while computer and electronic product manufacturing appears to<br />
be at risk of losing employment. Information and professional services, and the leisure<br />
and hospitality industry have the potential to add significant employment by 2014.<br />
Summary<br />
Certain trends become apparent after reviewing the <strong>county</strong>wide demographic and<br />
economic information. Studying these trends and their implications on local quality of<br />
life will be useful in guiding public decision making.<br />
Clark County continues to slowly increase in population with the sixteenth slowest rate of<br />
growth in the State of <strong>Wisconsin</strong> from 2000 to 2008. While its growth rate was below<br />
the other six counties of west central <strong>Wisconsin</strong>, Clark County did grow at a rate above<br />
that of neighboring Wood and Taylor counties. Clark County’s population increase has<br />
been more from births, rather than the in-migration of new residents, over the past 50<br />
years.<br />
In 2000, 16.4 percent of the population was classified as “rural farm”, which is the<br />
highest percentage in west central <strong>Wisconsin</strong>. However, this was a tremendous decrease<br />
from 61 percent in 1950. The rural, non-farm population continues to climb while the<br />
percentage of the County’s population residing in the cities and villages has declined<br />
slightly in recent decades.<br />
It is clear that the national trend of an aging population is reflected in Clark County with<br />
the County’s median age about equal to the <strong>Wisconsin</strong> average. While the Clark County<br />
population will continue to age, it will also be changing its racial and ethnic<br />
characteristics. The County’s minority population can be expected to continue to<br />
increase.<br />
Clark County residents have become more educated over the past several decades, though<br />
educational attainment levels have lagged behind the other six west central <strong>Wisconsin</strong><br />
counties. Without adequate employment opportunities, this can lead to the loss of<br />
increasingly well-qualified individuals moving to other areas offering those opportunities.<br />
Overall, residents have been increasingly willing to travel longer to places of<br />
employment though 67 percent of working residents still worked within Clark County in<br />
2000.<br />
Overall, the previously analyzed trends reveal that Clark County will continue to<br />
experience growth in population and employment and its communities will face several<br />
challenges as a result. Clark County is also more rural than many of the counties in the<br />
area, with a low population density. It also does not have a large commercial center like<br />
Eau Claire or Rice Lake within the County, and it is the farthest west central <strong>Wisconsin</strong><br />
<strong>county</strong> from the Twin Cities metropolitan area. Based on place of work, Clark County<br />
likely has stronger economic ties to Wood County (Marshfield) and Marathon County<br />
(Wausau). Given the unique geography and circumstances of Clark County, the issues,<br />
14 Issues & Opportunities Information
goals, and policies of Clark County and its municipalities may be quite different than<br />
counties experiencing higher rates of growth and development.<br />
Over the next several sections of this Conditions and Trends Report, other factors that<br />
affect Clark County communities will be explored. With further analysis of these<br />
following sections it is hoped that a clear picture of where Clark County has been, and is<br />
now, will emerge. This will help communities frame the issues that face them, the<br />
changes that are likely to impact them and the ways they can address those changes to<br />
achieve the community character they desire.<br />
Data Tables<br />
Table 1.2<br />
Clark County Historical Population (1900 to 2008)<br />
Year<br />
Population<br />
Numerical<br />
Change<br />
Percent<br />
Change<br />
1900 25,848 -- --<br />
1910 30,174 4,326 16.7<br />
1920 35,120 4,946 16.4<br />
1930 34,165 -955 -2.7<br />
1940 33,972 -193 -0.6<br />
1950 32,459 -1,513 -4.5<br />
1960 31,527 -932 -2.9<br />
1970 30,361 -1,166 -3.7<br />
1980 32,910 2,549 8.4<br />
1990 31,647 -1,263 -3.8<br />
2000 33,557 1,910 6.0<br />
2008 34,589 1,032 3.1<br />
source: U.S. Census Bureau, WisDOA 2008 preliminary estimate<br />
Clark County Conditions and Trends Report 15
Table 1.3<br />
Clark County Historical Population and Population Change by MCD (1970 to 2008)<br />
1970 1980 1990 2000 2008 '70-'80 '80-'90 '90-'00 '00-'08<br />
Towns<br />
Beaver 718 777 703 854 915 8.2% -9.5% 21.5% 7.1%<br />
Butler 83 81 91 88 91 -2.4% 12.3% -3.3% 3.4%<br />
Colby 812 800 846 908 937 -1.5% 5.8% 7.3% 3.2%<br />
Dewhurst 99 132 197 321 386 33.3% 49.2% 62.9% 20.2%<br />
Eaton 572 663 640 665 697 15.9% -3.5% 3.9% 4.8%<br />
Foster 51 111 85 95 99 117.6% -23.4% 11.8% 4.2%<br />
Fremont 905 982 963 1,190 1,301 8.5% -1.9% 23.6% 9.3%<br />
Grant 736 882 890 920 977 19.8% 0.9% 3.4% 6.2%<br />
Green Grove 663 678 628 675 685 2.3% -7.4% 7.5% 1.5%<br />
Hendren 526 570 542 513 520 8.4% -4.9% -5.4% 1.4%<br />
Hewett 170 301 314 314 314 77.1% 4.3% 0.0% 0.0%<br />
Hixon 791 810 673 740 767 2.4% -16.9% 10.0% 3.6%<br />
Hoard 919 881 805 821 855 -4.1% -8.6% 2.0% 4.1%<br />
Levis 337 433 492 504 544 28.5% 13.6% 2.4% 7.9%<br />
Longwood 728 673 661 698 746 -7.6% -1.8% 5.6% 6.9%<br />
Loyal 819 882 757 787 801 7.7% -14.2% 4.0% 1.8%<br />
Lynn 555 587 703 834 841 5.8% 19.8% 18.6% 0.8%<br />
Mayville 957 962 932 919 951 0.5% -3.1% -1.4% 3.5%<br />
Mead 237 303 249 290 311 27.8% -17.8% 16.5% 7.2%<br />
Mentor 584 596 521 570 608 2.1% -12.6% 9.4% 6.7%<br />
Pine Valley 923 1,137 1,032 1,121 1,265 23.2% -9.2% 8.6% 12.8%<br />
Reseburg 742 761 687 740 742 2.6% -9.7% 7.7% 0.3%<br />
Seif 162 254 211 212 201 56.8% -16.9% 0.5% -5.2%<br />
Sherman 674 766 736 831 881 13.6% -3.9% 12.9% 6.0%<br />
Sherwood 199 173 195 252 262 -13.1% 12.7% 29.2% 4.0%<br />
Thorp 873 743 710 730 751 -14.9% -4.4% 2.8% 2.9%<br />
Unity 796 815 735 745 778 2.4% -9.8% 1.4% 4.4%<br />
Warner 607 668 599 627 668 10.0% -10.3% 4.7% 6.5%<br />
Washburn 325 276 310 304 301 -15.1% 12.3% -1.9% -1.0%<br />
<strong>West</strong>on 602 646 662 638 674 7.3% 2.5% -3.6% 5.6%<br />
Withee 801 859 767 885 929 7.2% -10.7% 15.4% 5.0%<br />
Worden 595 650 575 657 718 9.2% -11.5% 14.3% 9.3%<br />
York 847 903 857 853 885 6.6% -5.1% -0.5% 3.8%<br />
sub-total 19,408 20,755 19,768 21,301 22,401 6.9% -4.8% 7.8% 5.2%<br />
Villages<br />
Curtiss 135 127 173 198 207 -5.9% 36.2% 14.5% 4.5%<br />
Dorchester* 491 613 697 823 854 24.8% 13.7% 18.1% 3.8%<br />
Granton* 288 399 379 406 396 38.5% -5.0% 7.1% -2.5%<br />
Unity* 154 166 196 163 161 7.8% 18.1% -16.8% -1.2%<br />
Withee 480 509 503 508 492 6.0% -1.2% 1.0% -3.1%<br />
sub-total 1,548 1,814 1,948 2,098 2,110 17.2% 7.4% 7.7% 0.6%<br />
Cities<br />
Year<br />
Percent Change<br />
Abbotsford* 1,108 1,401 1,409 1,412 1,377 26.4% 0.6% 0.2% -2.5%<br />
Colby* 885 1,151 1,116 1,156 1,238 30.1% -3.0% 3.6% 7.1%<br />
Greenwood 1,036 1,124 969 1,079 1,077 8.5% -13.8% 11.4% -0.2%<br />
Loyal 1,126 1,252 1,205 1,308 1,276 11.2% -3.8% 8.5% -2.4%<br />
Neillsville 2,750 2,780 2,680 2,731 2,648 1.1% -3.6% 1.9% -3.0%<br />
Owen 1,031 998 895 936 920 -3.2% -10.3% 4.6% -1.7%<br />
Stanley* 0 0 0 0 7 n.a. n.a. n.a. n.a.<br />
Thorp 1,469 1,635 1,657 1,536 1,535 11.3% 1.3% -7.3% -0.1%<br />
sub-total 9,405 10,341 9,931 10,158 10,078 10.0% -4.0% 2.3% -0.8%<br />
Total 30,361 32,910 31,647 33,557 34,589 8.4% -3.8% 6.0% 3.1%<br />
source: U.S. Census Bureau; <strong>Wisconsin</strong> Department of Administration Estimate, 2008<br />
*Portion of these communities located in Clark County only.<br />
16 Issues & Opportunities Information
Table 1.4<br />
Clark County Historical Population by Age and Sex (1980 to 2000)<br />
Male Female Total<br />
Age 1980 2000 1980 2000 1980 2000<br />
0-4 1,426 1,293 1,279 1,262 2,705 2,555<br />
5-9 1,431 1,294 1,277 1,295 2,708 2,589<br />
10-14 1,592 1,525 1,458 1,424 3,050 2,949<br />
15-19 1,691 1,531 1,507 1,381 3,198 2,912<br />
20-24 1,229 894 1,098 718 2,327 1,612<br />
25-34 2,207 1,915 2,064 1,864 4,271 3,779<br />
35-44 1,559 2,605 1,634 2,412 3,193 5,017<br />
45-54 1,518 2,081 1,589 1,931 3,107 4,012<br />
55-64 1,640 1,334 1,587 1,425 3,227 2,759<br />
65-74 1,377 1,203 1,570 1,359 2,947 2,562<br />
75+ 921 1,144 1,256 1,667 2,177 2,811<br />
Median Age 30.4 35.9<br />
source:<br />
U.S. Census Bureau<br />
Table 1.5<br />
Clark County Components of Population Change (1950 to 2000)<br />
1950 to<br />
1960<br />
1960 to<br />
1970<br />
1970 to<br />
1980<br />
1980 to<br />
1990<br />
1990 to<br />
2000<br />
Births 7,321 6,023 5,002 5,340 4,599<br />
Deaths 3,075 3,231 3,309 3,367 3,275<br />
Total Natural Increase 4,246 2,792 1,693 1,973 1,324<br />
Natural Increase Rate 13.5% 9.2% 5.1% 6.2% 3.9%<br />
Net Migration -5,178 -3,958 856 -3,236 586<br />
Net Migration Rate -16.4% -13.0% 2.6% -10.2% 1.7%<br />
Total Population Change -932 -1,166 2549 -1,263 1,910<br />
Percent Population Change -2.9% -3.7% 8.4% -3.8% 6.0%<br />
*NOTE: Calculated as a percent of the County’s total population.<br />
Source: U.S. Census Bureau; <strong>Wisconsin</strong> Department of Health and Family Services<br />
Clark County Conditions and Trends Report 17
Table 1.6<br />
Clark County Change in Age-Sex Structure (1980 to 2000)<br />
1980 to 2000 Total<br />
Age Male Female # Change Pct Change<br />
0-4 -133 -31 -150 -5.5<br />
5-9 -137 1 -119 -4.4<br />
10-14 -67 -101 -101 -3.3<br />
15-19 -160 -150 -286 -8.9<br />
20-24 -335 -176 -715 -30.7<br />
25-34 -292 -51 -492 -11.5<br />
35-44 1,046 -193 1,824 57.1<br />
45-54 563 -150 905 29.1<br />
55-64 -306 91 -468 -14.5<br />
65-74 -174 156 -385 -13.1<br />
75+ 223 523 634 29.1<br />
source:<br />
U.S. Census Bureau<br />
18 Issues & Opportunities Information
Table 1.7<br />
Population by Age and Sex by Municipality – 2000 Clark County<br />
Beaver (T)<br />
Butler (T)<br />
Colby (T)<br />
Dewhurst (T)<br />
Eaton (T)<br />
Foster (T)<br />
Total 854 88 908 321 665 95 1190 920 902 513 314 740 594 504<br />
Median Age 25.7 42.3 31.3 50 32.1 49.6 30.1 34.8 41.3 40.6 40.1 32.4 31.8 36.8<br />
Male 473 43 465 168 353 49 618 472 442 271 159 380 302 280<br />
Fremont (T)<br />
Female 381 45 443 153 312 46 572 448 460 242 155 360 292 224<br />
Male<br />
Under 5 years 59 1 42 1 29 1 57 37 31 21 8 38 24 14<br />
5 to 9 years 53 0 35 9 37 0 54 34 27 17 8 49 25 21<br />
10 to 14 years 48 3 57 12 41 2 65 43 42 26 8 34 36 28<br />
15 to 17 years 35 2 32 3 32 2 43 31 20 18 10 24 19 19<br />
18 and 19 years 14 3 14 7 9 1 14 17 7 7 4 9 12 10<br />
20 years 8 4 5 1 2 0 11 3 2 1 0 4 4 4<br />
21 years 4 0 11 0 3 0 8 2 5 1 3 3 3 2<br />
22 to 24 years 19 0 8 5 11 0 27 17 11 2 3 6 11 14<br />
25 to 29 years 27 2 19 4 11 3 33 31 21 11 6 15 11 12<br />
30 to 34 years 27 4 26 5 15 4 37 25 22 6 16 21 23 14<br />
35 to 39 years 35 3 40 7 27 2 52 29 33 23 14 27 28 20<br />
40 to 44 years 39 4 46 15 28 3 46 46 28 28 18 28 24 20<br />
45 to 49 years 29 2 25 15 32 8 43 42 23 24 10 35 18 17<br />
50 to 54 years 19 5 26 14 20 4 30 23 24 21 18 17 11 23<br />
55 to 59 years 16 2 18 21 13 6 21 18 21 14 6 8 7 18<br />
60 and 61 years 4 1 7 6 4 0 9 4 9 4 0 4 5 8<br />
62 to 64 years 4 1 9 6 4 1 14 11 13 6 5 5 9 8<br />
65 to 69 years 6 2 16 17 7 1 16 24 17 7 9 15 6 6<br />
70 to 74 years 12 3 5 6 10 4 14 12 24 8 7 16 9 11<br />
75 to 79 years 11 1 15 9 9 5 15 13 19 13 4 8 8 4<br />
80 to 84 years 3 0 7 4 8 1 5 6 20 11 0 10 5 2<br />
85 years and over 1 0 2 1 1 1 4 4 23 2 2 4 4 5<br />
Female<br />
Under 5 years 51 4 43 4 33 1 52 35 35 15 7 27 25 12<br />
5 to 9 years 36 4 41 3 27 2 38 35 41 17 10 40 42 11<br />
10 to 14 years 43 1 42 8 30 0 59 43 35 21 11 34 36 24<br />
15 to 17 years 23 3 38 9 28 0 29 31 16 10 8 19 21 13<br />
18 and 19 years 11 0 15 0 7 0 29 14 9 7 2 11 4 8<br />
20 years 4 1 2 2 1 1 11 1 2 2 0 4 4 3<br />
21 years 5 0 3 1 1 2 7 5 4 0 1 3 1 2<br />
22 to 24 years 10 1 7 1 7 2 20 10 16 4 3 5 3 2<br />
25 to 29 years 22 2 22 4 10 1 37 25 19 9 10 21 8 10<br />
30 to 34 years 38 2 27 6 18 2 43 23 20 13 9 30 22 13<br />
35 to 39 years 29 2 40 13 33 3 44 33 23 18 15 26 28 18<br />
40 to 44 years 24 6 28 12 30 4 50 33 30 20 13 24 12 15<br />
45 to 49 years 21 5 29 13 19 5 40 37 21 15 8 29 19 15<br />
50 to 54 years 18 5 25 15 20 3 24 23 27 17 18 15 7 16<br />
55 to 59 years 12 0 14 18 6 5 24 18 14 8 9 12 11 16<br />
60 and 61 years 2 0 10 1 5 2 7 4 8 8 2 1 5 5<br />
62 to 64 years 6 2 9 6 5 2 10 12 9 5 5 11 6 6<br />
65 to 69 years 5 2 11 16 6 1 15 29 18 9 12 11 4 8<br />
70 to 74 years 14 0 11 8 14 2 15 16 21 13 6 17 13 10<br />
75 to 79 years 5 3 13 9 7 4 9 9 25 10 3 11 12 2<br />
80 to 84 years 2 1 5 3 4 3 5 8 25 12 2 6 5 8<br />
85 years and over 0 1 8 1 1 1 4 4 42 9 1 3 4 7<br />
Table 1.7 continued on next page<br />
Grant (T)<br />
Green Grove (T)<br />
Hendren (T)<br />
Hewett (T)<br />
Hixon (T)<br />
Hoard (T)<br />
Levis (T)<br />
Clark County Conditions and Trends Report 19
Table 1.7 continued<br />
Population by Age and Sex by Municipality – 2000 Clark County<br />
Longwood (T)<br />
Loyal (T)<br />
Lynn (T)<br />
Mayville (T)<br />
Mead (T)<br />
Mentor (T)<br />
Total 698 787 834 919 290 570 1121 740 212 831 252 730 745 627<br />
Median Age 34.4 26.6 29.2 33.2 39.3 39.1 39 25.2 43.8 29.9 39.8 34.8 32.1 34.6<br />
Male 361 408 415 469 156 293 564 367 110 423 127 396 391 316<br />
Female 337 379 419 450 134 277 557 373 102 408 125 334 354 311<br />
Male<br />
Under 5 years 27 36 38 33 16 23 19 31 11 40 10 34 34 26<br />
5 to 9 years 37 29 39 43 10 17 42 34 7 46 5 22 43 26<br />
10 to 14 years 35 46 42 40 11 19 40 34 5 41 10 46 33 30<br />
15 to 17 years 20 35 38 27 4 17 38 36 0 28 6 24 18 24<br />
18 and 19 years 15 17 9 22 4 11 15 12 1 9 3 12 11 5<br />
20 years 7 8 5 7 3 1 3 4 0 4 1 6 4 4<br />
21 years 4 5 7 10 0 3 8 6 1 5 2 3 3 3<br />
22 to 24 years 7 19 17 18 4 7 13 14 6 13 3 12 13 8<br />
25 to 29 years 15 28 17 22 14 15 26 21 4 28 4 16 21 13<br />
30 to 34 years 15 26 28 26 7 12 42 18 10 32 7 21 32 19<br />
35 to 39 years 27 23 28 31 10 26 43 17 6 37 12 29 39 15<br />
40 to 44 years 25 30 35 42 6 30 53 34 5 35 10 39 29 34<br />
45 to 49 years 29 21 23 36 11 20 50 24 10 25 12 32 24 18<br />
50 to 54 years 15 21 23 24 13 20 30 29 11 25 7 22 26 28<br />
55 to 59 years 22 19 20 15 11 11 34 10 6 14 5 14 13 19<br />
60 and 61 years 10 7 6 7 5 5 12 3 3 11 0 8 6 6<br />
62 to 64 years 8 7 7 11 5 11 18 0 6 3 2 7 6 7<br />
65 to 69 years 12 11 11 22 7 15 27 18 2 11 9 19 13 10<br />
70 to 74 years 14 9 11 10 5 10 21 8 6 4 8 11 10 9<br />
75 to 79 years 12 8 6 12 5 9 17 8 6 4 8 6 5 4<br />
80 to 84 years 3 2 4 4 2 9 7 2 2 1 0 7 4 3<br />
85 years and over 2 1 1 7 3 2 6 4 2 7 3 6 4 5<br />
Female<br />
Under 5 years 34 42 44 37 9 16 36 44 6 44 12 30 31 27<br />
5 to 9 years 38 35 40 34 14 23 50 36 7 42 7 22 35 33<br />
10 to 14 years 33 45 40 43 9 23 47 53 5 45 8 35 35 27<br />
15 to 17 years 14 31 27 32 6 12 32 27 5 19 7 22 12 27<br />
18 and 19 years 9 14 15 15 2 8 19 13 2 10 2 12 9 7<br />
20 years 2 4 5 5 0 1 3 5 1 3 0 1 2 2<br />
21 years 2 1 3 7 1 4 2 2 3 3 0 3 3 2<br />
22 to 24 years 10 12 16 12 0 10 9 17 0 8 3 9 17 5<br />
25 to 29 years 9 28 20 24 10 13 25 19 6 30 6 24 26 14<br />
30 to 34 years 21 18 20 24 6 14 29 14 6 34 5 12 20 14<br />
35 to 39 years 17 24 32 28 8 21 45 22 4 35 14 27 25 32<br />
40 to 44 years 18 23 34 46 6 24 43 25 11 29 11 31 30 24<br />
45 to 49 years 34 22 24 28 15 20 44 25 9 23 7 27 27 17<br />
50 to 54 years 16 20 23 28 5 21 39 22 6 19 6 13 14 20<br />
55 to 59 years 24 19 17 19 14 12 34 10 3 25 4 22 21 15<br />
60 and 61 years 4 1 5 7 3 7 9 7 3 5 2 6 7 5<br />
62 to 64 years 5 10 8 11 5 12 15 1 1 7 3 4 12 4<br />
65 to 69 years 14 9 20 16 3 10 29 8 4 7 10 12 7 12<br />
70 to 74 years 15 11 7 11 7 7 17 11 7 7 11 13 6 5<br />
75 to 79 years 9 5 5 12 3 7 10 7 5 6 4 3 8 10<br />
80 to 84 years 3 2 9 8 5 9 13 4 5 7 2 4 5 5<br />
85 years and over 6 3 5 3 3 3 7 1 3 0 1 2 2 4<br />
Table 1.7 continued on next page<br />
Pine Valley (T)<br />
Reseburg (T)<br />
Seif (T)<br />
Sherman (T)<br />
Sherwood (T)<br />
Thorp (T)<br />
Unity (T)<br />
Warner (T)<br />
20 Issues & Opportunities Information
Table 1.7 continued<br />
Population by Age and Sex by Municipality – 2000 Clark County<br />
Washburn (T)<br />
<strong>West</strong>on (T)<br />
Withee (T)<br />
Worden (T)<br />
Total 304 638 885 657 853 198 823 406 163 508<br />
Median Age 38 37.7 27.5 29.4 34.3 29.1 35.3 33 32.8 39.6<br />
York (T)<br />
Male 161 336 448 339 440 103 408 210 87 247<br />
Female 143 302 437 318 413 95 415 196 76 261<br />
Male<br />
Under 5 years 15 20 41 28 25 14 40 20 6 17<br />
5 to 9 years 8 29 44 38 36 7 25 17 6 26<br />
10 to 14 years 12 26 46 32 39 10 30 21 7 16<br />
15 to 17 years 12 22 29 18 41 4 20 14 6 10<br />
18 and 19 years 3 9 16 16 17 3 14 6 2 5<br />
20 years 1 7 3 5 8 2 6 3 3 0<br />
21 years 0 3 5 3 8 2 5 5 1 2<br />
22 to 24 years 4 8 19 6 19 0 9 6 2 7<br />
25 to 29 years 8 16 24 16 14 11 33 11 8 25<br />
30 to 34 years 10 21 18 18 16 12 27 16 2 12<br />
35 to 39 years 16 23 29 30 34 3 35 12 12 14<br />
40 to 44 years 13 32 34 27 41 4 42 17 7 23<br />
45 to 49 years 12 28 36 29 35 7 20 12 9 14<br />
50 to 54 years 10 24 23 16 28 4 14 10 3 14<br />
55 to 59 years 3 10 16 13 21 2 15 4 3 6<br />
60 and 61 years 5 6 13 4 7 2 5 5 0 3<br />
62 to 64 years 0 6 8 6 10 2 6 7 2 10<br />
65 to 69 years 12 19 7 15 17 6 16 4 1 9<br />
70 to 74 years 8 12 17 6 9 3 19 9 2 11<br />
75 to 79 years 5 4 4 6 6 2 7 4 3 10<br />
80 to 84 years 2 6 11 5 7 2 12 6 2 8<br />
85 years and over 2 5 5 2 2 1 8 1 0 5<br />
Female<br />
Under 5 years 7 13 39 34 31 10 39 19 4 18<br />
5 to 9 years 12 22 43 37 34 13 24 13 5 11<br />
10 to 14 years 13 24 55 33 33 9 27 14 8 14<br />
15 to 17 years 11 20 32 22 31 3 12 6 5 10<br />
18 and 19 years 2 8 18 13 17 2 13 7 2 6<br />
20 years 0 2 6 1 9 0 3 3 1 0<br />
21 years 0 2 3 4 3 1 9 2 1 1<br />
22 to 24 years 3 7 18 6 8 3 16 7 2 9<br />
25 to 29 years 7 16 21 21 22 12 36 10 6 24<br />
30 to 34 years 4 16 19 26 24 8 21 17 8 15<br />
35 to 39 years 17 29 26 24 33 5 31 13 5 15<br />
40 to 44 years 11 30 28 22 32 6 32 13 4 17<br />
45 to 49 years 14 23 33 20 39 3 25 10 6 18<br />
50 to 54 years 7 16 20 15 17 0 9 11 7 15<br />
55 to 59 years 6 16 18 9 25 2 16 10 1 16<br />
60 and 61 years 1 7 4 2 4 0 8 2 1 4<br />
62 to 64 years 3 10 10 4 8 2 12 5 3 7<br />
65 to 69 years 13 12 14 14 19 5 15 6 0 11<br />
70 to 74 years 6 9 12 3 9 4 17 6 0 14<br />
75 to 79 years 3 8 8 4 7 4 16 12 4 15<br />
80 to 84 years 3 6 7 3 5 1 12 6 1 13<br />
85 years and over 0 6 3 1 3 2 22 4 2 8<br />
Table 1.7 continued on next page<br />
Curtiss (V)<br />
Dorchester (V)*<br />
Granton (V)<br />
Unity (V)*<br />
Withee (V)<br />
Clark County Conditions and Trends Report 21
Table 1.7 continued<br />
Population by Age and Sex by Municipality – 2000 Clark County<br />
Abbotsford (C)*<br />
Colby (C)*<br />
Greenwood (C)<br />
Loyal (C)<br />
Total 1412 1156 1079 1308 2731 936 0 1536 33557<br />
Median Age 40.2 40.4 37.9 37.4 40.3 41.1 n.a 42 35.9<br />
Male 701 528 522 619 1264 444 0 691 16819<br />
Female 711 628 557 689 1467 492 0 845 16738<br />
Male<br />
Under 5 years 51 33 34 55 69 36 0 48 1293<br />
5 to 9 years 41 33 26 47 83 22 0 37 1294<br />
10 to 14 years 54 58 38 51 122 31 0 55 1525<br />
15 to 17 years 34 28 25 18 88 22 0 29 1025<br />
18 and 19 years 15 17 21 13 39 16 0 20 506<br />
20 years 8 3 5 9 12 4 0 6 191<br />
21 years 10 4 7 5 17 6 0 14 202<br />
22 to 24 years 22 10 14 14 35 18 0 20 501<br />
25 to 29 years 45 24 35 49 64 23 0 46 902<br />
30 to 34 years 49 40 37 47 85 25 0 38 1013<br />
35 to 39 years 55 44 48 39 89 29 0 49 1244<br />
40 to 44 years 50 39 27 44 94 43 0 44 1361<br />
45 to 49 years 43 32 35 32 75 32 0 47 1156<br />
50 to 54 years 26 30 25 30 66 13 0 40 925<br />
55 to 59 years 33 24 29 21 42 19 0 22 685<br />
60 and 61 years 15 2 9 16 22 3 0 14 285<br />
62 to 64 years 21 13 8 18 29 13 0 11 364<br />
65 to 69 years 28 17 28 34 54 19 0 24 646<br />
70 to 74 years 27 20 26 24 42 17 0 28 557<br />
75 to 79 years 44 22 20 30 51 18 0 43 523<br />
80 to 84 years 18 17 15 15 40 18 0 32 348<br />
85 years and over 12 18 10 8 46 17 0 24 273<br />
Female<br />
Under 5 years 32 28 30 44 89 20 0 49 1262<br />
5 to 9 years 40 29 38 46 82 31 0 52 1295<br />
10 to 14 years 51 50 39 48 90 32 0 49 1424<br />
15 to 17 years 30 34 25 31 68 24 0 35 920<br />
18 and 19 years 10 16 13 16 34 13 0 17 461<br />
20 years 4 9 5 7 10 9 0 8 149<br />
21 years 8 6 3 6 8 5 0 6 139<br />
22 to 24 years 18 12 13 17 36 14 0 22 430<br />
25 to 29 years 41 26 39 40 69 20 0 42 906<br />
30 to 34 years 42 35 39 47 73 22 0 39 958<br />
35 to 39 years 42 32 46 45 95 33 0 51 1201<br />
40 to 44 years 59 50 36 43 91 29 0 52 1211<br />
45 to 49 years 42 35 24 30 85 29 0 54 1088<br />
50 to 54 years 26 25 25 27 71 35 0 32 843<br />
55 to 59 years 43 31 24 39 54 28 0 35 779<br />
60 and 61 years 11 9 8 14 30 7 0 10 253<br />
62 to 64 years 20 14 14 21 38 14 0 16 393<br />
65 to 69 years 45 24 33 39 73 26 0 40 697<br />
70 to 74 years 34 34 29 43 68 26 0 53 662<br />
75 to 79 years 43 29 22 27 79 30 0 66 593<br />
80 to 84 years 34 44 28 27 81 23 0 54 518<br />
85 years and over 36 56 24 32 143 22 0 63 556<br />
source: U.S. Census, 2000 *Data for portions of these municipalities in Clark County only<br />
Neillsville (C)<br />
Owen (C)<br />
Stanley (C)*<br />
Thorp (C)<br />
Clark County<br />
22 Issues & Opportunities Information
Table 1.8<br />
Population by Age by Municipality – 1990 Clark County<br />
Beaver (T)<br />
Butler (T)<br />
Colby (T)<br />
Dewhurst (T)<br />
Eaton (T)<br />
Foster (T)<br />
Fremont (T)<br />
Grant (T)<br />
Green Grove (T)<br />
Hendren (T)<br />
Hewett (T)<br />
Hixon (T)<br />
Hoard (T)<br />
Levis (T)<br />
Total 713 87 827 208 660 69 963 907 650 537 321 695 802 499<br />
Median Age 25.8 33.2 28.3 53.2 28.6 49.4 30.9 32.2 31.2 35.1 37.2 34.7 42.2 32.9<br />
Under 5 years 101 2 76 8 57 6 101 84 75 49 20 39 48 37<br />
5 to 9 years 72 5 74 6 85 3 63 83 50 43 20 65 76 54<br />
10 to 14 years 77 11 97 11 67 3 107 95 78 53 24 72 60 50<br />
15 to 17 years 52 7 36 5 49 0 42 40 23 30 25 35 31 30<br />
18 and 19 years 16 4 38 2 16 0 24 33 21 3 1 21 6 15<br />
20 years 15 0 10 0 9 0 8 4 4 11 2 7 0 0<br />
21 years 1 0 8 0 2 1 10 10 7 2 0 8 7 5<br />
22 to 24 years 33 0 20 2 20 0 27 28 16 2 11 12 28 17<br />
25 to 29 years 65 2 50 8 27 6 76 58 48 38 17 46 48 37<br />
30 to 34 years 51 3 67 13 58 5 94 81 61 38 31 47 37 37<br />
35 to 39 years 44 4 80 10 55 0 89 71 35 33 17 55 47 42<br />
40 to 44 years 36 14 57 12 44 2 58 72 53 60 33 42 24 28<br />
45 to 49 years 33 4 35 17 16 5 29 47 29 13 16 33 36 38<br />
50 to 54 years 19 4 35 12 24 10 40 32 22 15 17 38 49 30<br />
55 to 59 years 17 5 43 22 26 3 45 45 20 22 19 34 18 7<br />
60 and 61 years 22 1 9 15 13 0 16 11 11 4 12 22 8 7<br />
62 to 64 years 7 2 16 7 22 4 30 18 15 16 17 20 31 9<br />
65 to 69 years 21 6 35 28 28 11 31 31 34 31 15 35 43 13<br />
70 to 74 years 9 5 12 16 21 2 35 22 30 36 8 25 47 13<br />
75 to 79 years 14 4 21 9 20 8 16 14 9 24 7 20 82 16<br />
80 to 84 years 6 2 8 5 1 0 12 20 7 12 7 10 37 7<br />
85 years and over 2 2 0 0 0 0 10 8 2 2 2 9 39 7<br />
Table 1.8 continued on next page<br />
Clark County Conditions and Trends Report 23
Table 1.8 continued<br />
Population by Age by Municipality – 1990 Clark County<br />
Longwood (T)<br />
Loyal (T)<br />
Lynn (T)<br />
Mayville (T)<br />
Mead (T)<br />
Mentor (T)<br />
Pine Valley (T)<br />
Reseburg (T)<br />
Seif (T)<br />
Sherman (T)<br />
Sherwood (T)<br />
Thorp (T)<br />
Unity (T)<br />
Warner (T)<br />
Total 639 708 716 938 238 510 1010 703 197 746 192 735 725 595<br />
Median Age 33.4 28.2 30.3 30.5 39.1 34.9 36.2 27.7 37 26.6 34.9 31.8 30.4 29.1<br />
Under 5 years 44 71 64 89 10 28 48 66 12 61 9 55 52 43<br />
5 to 9 years 63 74 90 92 11 49 98 100 14 75 15 82 53 76<br />
10 to 14 years 67 60 73 91 16 33 85 77 30 97 19 78 67 45<br />
15 to 17 years 38 42 46 44 8 24 49 32 10 59 5 44 37 35<br />
18 and 19 years 7 27 19 29 12 17 25 25 2 25 0 21 31 23<br />
20 years 8 9 3 8 0 0 0 5 0 6 2 9 7 5<br />
21 years 11 8 8 20 5 6 6 5 0 4 0 6 13 1<br />
22 to 24 years 10 31 22 23 2 24 30 24 0 33 5 19 24 26<br />
25 to 29 years 39 41 38 66 15 44 41 40 0 62 18 43 54 47<br />
30 to 34 years 46 59 58 87 17 29 87 58 15 36 23 62 65 32<br />
35 to 39 years 47 44 56 68 16 26 85 60 14 59 20 52 68 41<br />
40 to 44 years 30 38 45 70 15 32 73 47 17 43 9 48 40 53<br />
45 to 49 years 40 48 48 30 9 31 68 22 4 33 4 57 51 44<br />
50 to 54 years 35 40 20 42 14 36 60 22 0 47 2 31 33 17<br />
55 to 59 years 43 39 38 44 11 24 56 39 10 24 16 40 31 16<br />
60 and 61 years 9 5 7 8 6 12 27 12 9 10 4 3 11 9<br />
62 to 64 years 28 18 14 25 8 18 29 16 6 17 7 13 22 13<br />
65 to 69 years 28 21 28 43 9 18 52 23 20 21 12 18 24 20<br />
70 to 74 years 17 20 21 27 28 18 36 12 19 10 10 27 29 15<br />
75 to 79 years 21 8 15 10 14 12 26 13 12 11 6 16 5 20<br />
80 to 84 years 6 3 3 17 9 7 22 5 3 2 4 11 8 11<br />
85 years and over 2 2 0 5 3 22 7 0 0 11 2 0 0 3<br />
Table 1.8 continued on next page<br />
24 Issues & Opportunities Information
Table 1.8 continued<br />
Population by Age by Municipality – 1990 Clark County<br />
Washburn (T)<br />
<strong>West</strong>on (T)<br />
Withee (T)<br />
Worden (T)<br />
York (T)<br />
Curtiss (V)<br />
Dorchester (V)*<br />
Granton (V)<br />
Unity (V)*<br />
Withee (V)<br />
Total 300 684 731 590 857 169 691 362 212 478<br />
Median Age 36.1 31.4 31.4 29.1 30 31.5 31.5 35.6 25.9 40.1<br />
Under 5 years 19 54 69 42 71 21 50 17 29 39<br />
5 to 9 years 22 47 92 84 104 17 81 32 26 44<br />
10 to 14 years 27 75 69 56 92 7 57 24 7 19<br />
15 to 17 years 15 50 30 42 42 8 20 15 18 12<br />
18 and 19 years 9 21 13 9 21 2 16 1 4 6<br />
20 years 0 9 4 3 9 0 9 7 0 2<br />
21 years 2 7 6 8 14 0 7 3 8 0<br />
22 to 24 years 5 29 23 8 21 6 29 15 8 21<br />
25 to 29 years 12 48 43 39 45 5 56 27 16 25<br />
30 to 34 years 22 48 60 55 85 16 77 20 19 49<br />
35 to 39 years 29 63 61 48 53 14 49 25 18 28<br />
40 to 44 years 15 42 27 28 62 5 31 24 13 20<br />
45 to 49 years 19 34 39 24 46 6 28 10 0 18<br />
50 to 54 years 7 23 40 24 33 8 12 17 11 17<br />
55 to 59 years 31 39 22 40 37 13 23 19 4 15<br />
60 and 61 years 7 11 16 8 11 0 6 4 2 10<br />
62 to 64 years 10 8 25 20 23 5 24 7 0 13<br />
65 to 69 years 15 26 26 21 28 13 15 23 12 33<br />
70 to 74 years 8 26 28 13 21 10 32 24 4 40<br />
75 to 79 years 13 13 22 12 20 11 40 20 6 21<br />
80 to 84 years 6 9 11 6 8 0 12 15 0 29<br />
85 years and over 7 2 5 0 11 2 17 13 7 17<br />
Table 1.8 continued on next page<br />
Clark County Conditions and Trends Report 25
Table 1.8 continued<br />
Population by Age by Municipality – 1990 Clark County<br />
Abbotsford (C)*<br />
Colby (C)*<br />
Greenwood (C)<br />
Loyal (C)<br />
Neillsville (C)<br />
Owen (C)<br />
Stanley (C)*<br />
Thorp (C)<br />
Clark County<br />
Total 1409 1116 969 1228 2680 924 0 1657 31647<br />
Median Age 35.9 37.8 40.8 37.2 39.6 43.6 n.a. 38.9 33.9<br />
Under 5 years 111 74 59 83 179 25 0 132 2429<br />
5 to 9 years 101 98 73 104 221 58 0 124 2919<br />
10 to 14 years 91 85 62 90 158 78 0 93 2733<br />
15 to 17 years 47 40 28 46 81 32 0 53 1457<br />
18 and 19 years 34 21 20 24 75 23 0 42 804<br />
20 years 16 13 11 30 38 8 0 15 306<br />
21 years 16 6 8 6 37 11 0 6 299<br />
22 to 24 years 58 42 41 38 68 35 0 62 998<br />
25 to 29 years 76 61 67 80 169 37 0 137 2017<br />
30 to 34 years 140 80 49 82 152 58 0 91 2400<br />
35 to 39 years 71 57 71 80 155 66 0 88 2214<br />
40 to 44 years 68 68 43 55 123 48 0 89 1856<br />
45 to 49 years 80 58 57 61 106 51 0 53 1530<br />
50 to 54 years 81 42 33 65 146 52 0 55 1412<br />
55 to 59 years 86 34 62 55 103 33 0 38 1411<br />
60 and 61 years 22 21 23 27 37 17 0 16 521<br />
62 to 64 years 25 39 26 41 81 30 0 56 881<br />
65 to 69 years 83 54 38 54 133 53 0 135 1461<br />
70 to 74 years 66 57 65 74 122 68 0 108 1336<br />
75 to 79 years 62 52 63 53 166 76 0 108 1211<br />
80 to 84 years 43 55 35 56 172 41 0 65 808<br />
85 years and over 32 59 35 24 158 24 0 91 644<br />
source: U.S. Census, 2000 *Data for portions of these municipalities in Clark County only<br />
26 Issues & Opportunities Information
Table 1.9<br />
Percent Change in Age by Municipality – 1990 to 2000 – Clark County<br />
Beaver (T)<br />
Butler (T)<br />
Colby (T)<br />
Dewhurst (T)<br />
Eaton (T)<br />
Foster (T)<br />
Fremont (T)<br />
Grant (T)<br />
Green Grove (T)<br />
Hendren (T)<br />
Hewett (T)<br />
Hixon (T)<br />
Hoard (T)<br />
Levis (T)<br />
Under 5 years 8.9 150.0 11.8 -37.5 8.8 -66.7 7.9 -14.3 -12.0 -26.5 -25.0 66.7 2.1 -29.7<br />
5 to 9 years 23.6 -20.0 2.7 100.0 -24.7 -33.3 46.0 -16.9 36.0 -20.9 -10.0 36.9 -11.8 -40.7<br />
10 to 14 years 18.2 -63.6 2.1 81.8 6.0 -33.3 15.9 -9.5 -1.3 -11.3 -20.8 -5.6 20.0 4.0<br />
15 to 17 years 11.5 -28.6 94.4 140.0 22.4 n.a. 71.4 55.0 56.5 -6.7 -28.0 22.9 29.0 6.7<br />
18 and 19 years 56.3 -25.0 -23.7 250.0 0.0 n.a. 79.2 -6.1 -23.8 366.7 500.0 -4.8 166.7 20.0<br />
20 years -20.0 n.a. -30.0 n.a. -66.7 n.a. 175.0 0.0 0.0 -72.7 -100.0 14.3 n.a. n.a.<br />
21 years 800.0 n.a. 75.0 n.a. 100.0 100.0 50.0 -30.0 28.6 -50.0 n.a. -25.0 -42.9 -20.0<br />
22 to 24 years -12.1 n.a. -25.0 200.0 -10.0 n.a. 74.1 -3.6 68.8 200.0 -45.5 -8.3 -50.0 -5.9<br />
25 to 29 years -24.6 100.0 -18.0 0.0 -22.2 -33.3 -7.9 -3.4 -16.7 -47.4 -5.9 -21.7 -60.4 -40.5<br />
30 to 34 years 27.5 100.0 -20.9 -15.4 -43.1 20.0 -14.9 -40.7 -31.1 -50.0 -19.4 8.5 21.6 -27.0<br />
35 to 39 years 45.5 25.0 0.0 100.0 9.1 n.a. 7.9 -12.7 60.0 24.2 70.6 -3.6 19.1 -9.5<br />
40 to 44 years 75.0 -28.6 29.8 125.0 31.8 250.0 65.5 9.7 9.4 -20.0 -6.1 23.8 50.0 25.0<br />
45 to 49 years 51.5 75.0 54.3 64.7 218.8 160.0 186.2 68.1 51.7 200.0 12.5 93.9 2.8 -15.8<br />
50 to 54 years 94.7 150.0 45.7 141.7 66.7 -30.0 35.0 43.8 131.8 153.3 111.8 -15.8 -63.3 30.0<br />
55 to 59 years 64.7 -60.0 -25.6 77.3 -26.9 266.7 0.0 -20.0 75.0 0.0 -21.1 -41.2 0.0 385.7<br />
60 and 61 years -72.7 0.0 88.9 -53.3 -30.8 n.a. 0.0 -27.3 54.5 200.0 -83.3 -77.3 25.0 85.7<br />
62 to 64 years 42.9 50.0 12.5 71.4 -59.1 -25.0 -20.0 27.8 46.7 -31.3 -41.2 -20.0 -51.6 55.6<br />
65 to 69 years -47.6 -33.3 -22.9 17.9 -53.6 -81.8 0.0 71.0 2.9 -48.4 40.0 -25.7 -76.7 7.7<br />
70 to 74 years 188.9 -40.0 33.3 -12.5 14.3 200.0 -17.1 27.3 50.0 -41.7 62.5 32.0 -53.2 61.5<br />
75 to 79 years 14.3 0.0 33.3 100.0 -20.0 12.5 50.0 57.1 388.9 -4.2 0.0 -5.0 -75.6 -62.5<br />
80 to 84 years -16.7 -50.0 50.0 40.0 1100.0 n.a. -16.7 -30.0 542.9 91.7 -71.4 60.0 -73.0 42.9<br />
85 years and over -50.0 -50.0 n.a. n.a. n.a. n.a. -20.0 0.0 3150.0 450.0 50.0 -22.2 -79.5 71.4<br />
Table 1.9 continued on next page<br />
Clark County Conditions and Trends Report 27
Table 1.9 continued<br />
Percent Change in Age by Municipality – 1990 to 2000 – Clark County<br />
Longwood (T)<br />
Loyal (T)<br />
Lynn (T)<br />
Mayville (T)<br />
Mead (T)<br />
Mentor (T)<br />
Pine Valley (T)<br />
Reseburg (T)<br />
Seif (T)<br />
Sherman (T)<br />
Sherwood (T)<br />
Thorp (T)<br />
Unity (T)<br />
Warner (T)<br />
Under 5 years 38.6 9.9 28.1 -21.3 150.0 39.3 14.6 13.6 41.7 37.7 144.4 16.4 25.0 23.3<br />
5 to 9 years 19.0 -13.5 -12.2 -16.3 118.2 -18.4 -6.1 -30.0 0.0 17.3 -20.0 -46.3 47.2 -22.4<br />
10 to 14 years 1.5 51.7 12.3 -8.8 25.0 27.3 2.4 13.0 -66.7 -11.3 -5.3 3.8 1.5 26.7<br />
15 to 17 years -10.5 57.1 41.3 34.1 25.0 20.8 42.9 96.9 -50.0 -20.3 160.0 4.5 -18.9 45.7<br />
18 and 19 years 242.9 14.8 26.3 27.6 -50.0 11.8 36.0 0.0 50.0 -24.0 n.a. 14.3 -35.5 -47.8<br />
20 years 12.5 33.3 233.3 50.0 n.a. n.a. n.a. 80.0 n.a. 16.7 -50.0 -22.2 -14.3 20.0<br />
21 years -45.5 -25.0 25.0 -15.0 -80.0 16.7 66.7 60.0 n.a. 100.0 n.a. 0.0 -53.8 400.0<br />
22 to 24 years 70.0 0.0 50.0 30.4 100.0 -29.2 -26.7 29.2 n.a. -36.4 20.0 10.5 25.0 -50.0<br />
25 to 29 years -38.5 36.6 -2.6 -30.3 60.0 -36.4 24.4 0.0 n.a. -6.5 -44.4 -7.0 -13.0 -42.6<br />
30 to 34 years -21.7 -25.4 -17.2 -42.5 -23.5 -10.3 -18.4 -44.8 6.7 83.3 -47.8 -46.8 -20.0 3.1<br />
35 to 39 years -6.4 6.8 7.1 -13.2 12.5 80.8 3.5 -35.0 -28.6 22.0 30.0 7.7 -5.9 14.6<br />
40 to 44 years 43.3 39.5 53.3 25.7 -20.0 68.8 31.5 25.5 -5.9 48.8 133.3 45.8 47.5 9.4<br />
45 to 49 years 57.5 -10.4 -2.1 113.3 188.9 29.0 38.2 122.7 375.0 45.5 375.0 3.5 0.0 -20.5<br />
50 to 54 years -11.4 2.5 130.0 23.8 28.6 13.9 15.0 131.8 n.a. -6.4 550.0 12.9 21.2 182.4<br />
55 to 59 years 7.0 -2.6 -2.6 -22.7 127.3 -4.2 21.4 -48.7 -10.0 62.5 -43.8 -10.0 9.7 112.5<br />
60 and 61 years 55.6 60.0 57.1 75.0 33.3 0.0 -22.2 -16.7 -33.3 60.0 -50.0 366.7 18.2 22.2<br />
62 to 64 years -53.6 -5.6 7.1 -12.0 25.0 27.8 13.8 -93.8 16.7 -41.2 -28.6 -15.4 -18.2 -15.4<br />
65 to 69 years -7.1 -4.8 10.7 -11.6 11.1 38.9 7.7 13.0 -70.0 -14.3 58.3 72.2 -16.7 10.0<br />
70 to 74 years 70.6 0.0 -14.3 -22.2 -57.1 -5.6 5.6 58.3 -31.6 10.0 90.0 -11.1 -44.8 -6.7<br />
75 to 79 years 0.0 62.5 -26.7 140.0 -42.9 33.3 3.8 15.4 -8.3 -9.1 100.0 -43.8 160.0 -30.0<br />
80 to 84 years 0.0 33.3 333.3 -29.4 -22.2 157.1 -9.1 20.0 133.3 300.0 -50.0 0.0 12.5 -27.3<br />
85 years and over 300.0 100.0 n.a. 100.0 100.0 -77.3 85.7 n.a. n.a. -36.4 100.0 n.a. n.a. 200.0<br />
Table 1.9 continued on next page<br />
28 Issues & Opportunities Information
Table 1.9 continued<br />
Percent Change in Age by Municipality – 1990 to 2000 – Clark County<br />
Washburn (T)<br />
<strong>West</strong>on (T)<br />
Withee (T)<br />
Worden (T)<br />
Under 5 years 15.8 -38.9 15.9 47.6 -21.1 14.3 58.0 129.4 -65.5 -10.3<br />
5 to 9 years -9.1 8.5 -5.4 -10.7 -32.7 17.6 -39.5 -6.3 -57.7 -15.9<br />
10 to 14 years -7.4 -33.3 46.4 16.1 -21.7 171.4 0.0 45.8 114.3 57.9<br />
15 to 17 years 53.3 -16.0 103.3 -4.8 71.4 -12.5 60.0 33.3 -38.9 66.7<br />
18 and 19 years -44.4 -19.0 161.5 222.2 61.9 150.0 68.8 1200.0 0.0 83.3<br />
20 years n.a. 0.0 125.0 100.0 88.9 n.a. 0.0 -14.3 n.a. -100.0<br />
21 years -100.0 -28.6 33.3 -12.5 -21.4 n.a. 100.0 133.3 -75.0 n.a.<br />
22 to 24 years 40.0 -48.3 60.9 50.0 28.6 -50.0 -13.8 -13.3 -50.0 -23.8<br />
25 to 29 years 25.0 -33.3 4.7 -5.1 -20.0 360.0 23.2 -22.2 -12.5 96.0<br />
30 to 34 years -36.4 -22.9 -38.3 -20.0 -52.9 25.0 -37.7 65.0 -47.4 -44.9<br />
35 to 39 years 13.8 -17.5 -9.8 12.5 26.4 -42.9 34.7 0.0 -5.6 3.6<br />
40 to 44 years 60.0 47.6 129.6 75.0 17.7 100.0 138.7 25.0 -15.4 100.0<br />
45 to 49 years 36.8 50.0 76.9 104.2 60.9 66.7 60.7 120.0 n.a. 77.8<br />
50 to 54 years 142.9 73.9 7.5 29.2 36.4 -50.0 91.7 23.5 -9.1 70.6<br />
55 to 59 years -71.0 -33.3 54.5 -45.0 24.3 -69.2 34.8 -26.3 0.0 46.7<br />
60 and 61 years -14.3 18.2 6.3 -25.0 0.0 n.a. 116.7 75.0 -50.0 -30.0<br />
62 to 64 years -70.0 100.0 -28.0 -50.0 -21.7 -20.0 -25.0 71.4 n.a. n.a.<br />
65 to 69 years 66.7 19.2 -19.2 38.1 28.6 -15.4 106.7 -56.5 -91.7 -39.4<br />
70 to 74 years 75.0 -19.2 3.6 -30.8 -14.3 -30.0 12.5 -37.5 -50.0 -37.5<br />
75 to 79 years -38.5 -7.7 -45.5 -16.7 -35.0 -45.5 -42.5 -20.0 16.7 19.0<br />
80 to 84 years -16.7 33.3 63.6 33.3 50.0 n.a. 100.0 -20.0 n.a. -27.6<br />
85 years and over -71.4 450.0 60.0 n.a. -54.5 50.0 76.5 -61.5 -71.4 -23.5<br />
Table 1.9 continued on next page<br />
York (T)<br />
Curtiss (V)<br />
Dorchester (V)*<br />
Granton (V)<br />
Unity (V)*<br />
Withee (V)<br />
Clark County Conditions and Trends Report 29
Table 1.9 continued<br />
Percent Change in Age by Municipality – 1990 to 2000 – Clark County<br />
Abbotsford (C)*<br />
Colby (C)*<br />
Greenwood (C)<br />
Loyal (C)<br />
Neillsville (C)<br />
Owen (C)<br />
Stanley (C)*<br />
Thorp (C)<br />
Clark County<br />
Under 5 years -25.2 -17.6 8.5 19.3 -11.7 124.0 n.a. -26.5 5.2<br />
5 to 9 years -19.8 -36.7 -12.3 -10.6 -25.3 -8.6 n.a. -28.2 -11.3<br />
10 to 14 years 15.4 27.1 24.2 10.0 34.2 -19.2 n.a. 11.8 7.9<br />
15 to 17 years 36.2 55.0 78.6 6.5 92.6 43.8 n.a. 20.8 33.5<br />
18 and 19 years -26.5 57.1 70.0 20.8 -2.7 26.1 n.a. -11.9 20.3<br />
20 years -25.0 -7.7 -9.1 -46.7 -42.1 62.5 n.a. -6.7 11.1<br />
21 years 12.5 66.7 25.0 83.3 -32.4 0.0 n.a. 233.3 14.0<br />
22 to 24 years -31.0 -47.6 -34.1 -18.4 4.4 -8.6 n.a. -32.3 -6.7<br />
25 to 29 years 13.2 -18.0 10.4 11.3 -21.3 16.2 n.a. -35.8 -10.4<br />
30 to 34 years -35.0 -6.3 55.1 14.6 3.9 -19.0 n.a. -15.4 -17.9<br />
35 to 39 years 36.6 33.3 32.4 5.0 18.7 -6.1 n.a. 13.6 10.4<br />
40 to 44 years 60.3 30.9 46.5 58.2 50.4 50.0 n.a. 7.9 38.6<br />
45 to 49 years 6.3 15.5 3.5 1.6 50.9 19.6 n.a. 90.6 46.7<br />
50 to 54 years -35.8 31.0 51.5 -12.3 -6.2 -7.7 n.a. 30.9 25.2<br />
55 to 59 years -11.6 61.8 -14.5 9.1 -6.8 42.4 n.a. 50.0 3.8<br />
60 and 61 years 18.2 -47.6 -26.1 11.1 40.5 -41.2 n.a. 50.0 3.3<br />
62 to 64 years 64.0 -30.8 -15.4 -4.9 -17.3 -10.0 n.a. -51.8 -14.1<br />
65 to 69 years -12.0 -24.1 60.5 35.2 -4.5 -15.1 n.a. -52.6 -8.1<br />
70 to 74 years -7.6 -5.3 -15.4 -9.5 -9.8 -36.8 n.a. -25.0 -8.8<br />
75 to 79 years 40.3 -1.9 -33.3 7.5 -21.7 -36.8 n.a. 0.9 -7.8<br />
80 to 84 years 20.9 10.9 22.9 -25.0 -29.7 0.0 n.a. 32.3 7.2<br />
85 years and over 50.0 25.4 -2.9 66.7 19.6 62.5 n.a. -4.4 28.7<br />
source: U.S. Census, 2000 *Data for portions of these municipalities in Clark County only<br />
30 Issues & Opportunities Information
Table 1.10<br />
Population Projections (2000 to 2030) Clark County by Minor Civil Division<br />
Census Estimate Proj. Proj. Proj. Proj. Proj. % Change<br />
Municipality 2000 2005 2010 2015 2020 2025 2030 2000-2030<br />
Towns<br />
Beaver 854 910 972 1,040 1,114 1,186 1,257 47.2<br />
Butler 88 88 89 91 92 95 96 9.1<br />
Colby 908 925 959 999 1,043 1,086 1,125 23.9<br />
Dewhurst 321 364 390 418 448 478 507 57.9<br />
Eaton 665 678 696 717 741 764 785 18.0<br />
Foster 95 98 101 104 108 111 115 21.1<br />
Fremont 1,190 1,302 1,393 1,495 1,602 1,711 1,814 52.4<br />
Grant 920 966 1,005 1,051 1,099 1,148 1,192 29.6<br />
Green Grove 675 676 690 707 727 745 761 12.7<br />
Hendren 513 510 509 509 512 512 511 -0.4<br />
Hewett 314 315 320 327 335 342 348 10.8<br />
Hixon 740 773 802 836 873 909 941 27.2<br />
Hoard 821 843 862 886 912 938 960 16.9<br />
Levis 504 531 558 588 620 651 681 35.1<br />
Longwood 698 719 743 772 802 832 859 23.1<br />
Loyal 787 800 813 828 847 864 879 11.7<br />
Lynn 834 837 880 928 981 1,032 1,081 29.6<br />
Mayville 919 936 946 962 979 996 1,008 9.7<br />
Mead 290 300 313 327 342 357 372 28.3<br />
Mentor 570 589 609 634 660 686 709 24.4<br />
Pine Valley 1,121 1,235 1,318 1,409 1,506 1,603 1,697 51.4<br />
Reseburg 740 755 776 802 830 858 882 19.2<br />
Seif 212 208 207 208 209 209 209 -1.4<br />
Sherman 831 882 934 992 1,054 1,116 1,175 41.4<br />
Sherwood 252 273 292 314 336 358 380 50.8<br />
Thorp 730 758 782 812 843 874 902 23.6<br />
Unity 745 768 785 807 832 854 874 17.3<br />
Warner 627 647 665 687 711 735 755 20.4<br />
Washburn 304 302 306 311 318 323 327 7.6<br />
<strong>West</strong>on 638 658 673 692 712 732 749 17.4<br />
Withee 885 930 979 1,034 1,093 1,152 1,207 36.4<br />
Worden 657 696 735 777 823 868 912 38.8<br />
York 853 887 912 941 973 1,004 1,032 21.0<br />
Subtotal: 21,301 22,159 23,014 24,005 25,077 26,129 27,102 27.2<br />
Villages<br />
Curtiss 198 212 227 244 261 278 295 49.0<br />
Dorchester* 823 846 901 961 1,026 1,089 1,151 39.9<br />
Granton* 406 395 400 406 413 420 426 4.9<br />
Unity* 163 162 162 162 163 163 162 -0.6<br />
Withee 508 506 513 522 533 543 551 8.5<br />
Subtotal: 2,098 2,121 2,203 2,295 2,396 2,493 2,585 23.2<br />
Cities<br />
Abbotsford* 1,412 1,397 1,407 1,424 1,444 1,463 1,474 4.4<br />
Colby* 1,156 1,241 1,304 1,376 1,451 1,528 1,599 38.3<br />
Greenwood 1,079 1,080 1,103 1,132 1,164 1,195 1,221 13.2<br />
Loyal 1,308 1,300 1,328 1,363 1,401 1,439 1,471 12.5<br />
Neillsville 2,731 2,676 2,681 2,700 2,724 2,745 2,752 0.8<br />
Owen 936 926 932 944 956 968 976 4.3<br />
Stanley* 0 2 2 2 2 2 2 n.a.<br />
Thorp 1,536 1,561 1,573 1,593 1,616 1,638 1,651 7.5<br />
Subtotal: 10,158 10,183 10,330 10,534 10,758 10,978 11,146 9.7<br />
Clark County 33,557 34,463 35,547 36,834 38,231 39,600 40,833 21.7<br />
source: U.S. Census Bureau & <strong>Wisconsin</strong> Department of Administration, Demographic Services Center, October 2008.<br />
*Portion of these communities located in Clark County only.<br />
Clark County Conditions and Trends Report 31
Table 1.11<br />
Household Projections (2000 to 2030) Clark County by Minor Civil Division<br />
Census Estimate Proj. Proj. Proj. Proj. Proj. % change<br />
Municipality 2000 2005 2010 2015 2020 2025 2030 2000-2030<br />
Towns<br />
Beaver 238 251 269 289 309 332 356 49.6<br />
Butler 32 32 32 33 33 34 35 9.4<br />
Colby 276 278 289 302 316 332 348 26.1<br />
Dewhurst 156 174 188 202 216 233 250 60.3<br />
Eaton 201 202 209 215 223 232 241 19.9<br />
Foster 50 51 53 54 56 58 62 24.0<br />
Fremont 374 404 435 466 501 539 581 55.3<br />
Grant 317 329 343 360 378 397 418 31.9<br />
Green Grove 216 213 219 225 232 239 247 14.4<br />
Hendren 197 193 194 194 195 198 200 1.5<br />
Hewett 125 124 126 130 133 137 141 12.8<br />
Hixon 232 240 250 260 273 286 300 29.3<br />
Hoard 179 184 190 195 201 209 216 20.7<br />
Levis 191 198 210 221 234 248 263 37.7<br />
Longwood 226 230 239 248 259 270 283 25.2<br />
Loyal 215 215 221 225 231 237 244 13.5<br />
Lynn 251 249 263 277 294 312 331 31.9<br />
Mayville 295 297 301 307 313 321 329 11.5<br />
Mead 115 117 123 129 135 142 150 30.4<br />
Mentor 223 228 237 246 257 269 283 26.9<br />
Pine Valley 421 458 491 526 563 604 648 53.9<br />
Reseburg 206 207 215 222 231 240 249 20.9<br />
Seif 89 86 86 86 88 88 89 0.0<br />
Sherman 247 259 275 293 312 333 355 43.7<br />
Sherwood 90 96 103 112 120 128 138 53.3<br />
Thorp 245 252 260 270 282 294 308 25.7<br />
Unity 239 244 250 257 266 275 286 19.7<br />
Warner 195 198 206 212 220 230 239 22.6<br />
Washburn 116 114 115 118 121 124 127 9.5<br />
<strong>West</strong>on 230 235 241 248 256 265 275 19.6<br />
Withee 262 272 288 305 322 343 363 38.5<br />
Worden 198 207 220 232 247 262 280 41.4<br />
York 266 274 282 292 302 315 327 22.9<br />
Subtotal: 6,913 7,111 7,423 7,751 8,119 8,526 8,962 29.6<br />
Villages<br />
Curtiss 68 72 77 83 90 96 103 51.5<br />
Dorchester* 335 340 364 389 416 445 477 42.4<br />
Granton* 156 149 153 155 158 161 167 7.1<br />
Unity* 65 64 64 64 64 66 66 1.5<br />
Withee 213 209 214 217 222 229 235 10.3<br />
Subtotal: 837 834 872 908 950 997 1,048 25.2<br />
Cities<br />
Abbotsford* 609 595 602 610 620 633 646 6.1<br />
Colby* 424 452 478 505 533 566 600 41.5<br />
Greenwood 468 463 475 488 503 520 539 15.2<br />
Loyal 548 538 552 568 585 605 627 14.4<br />
Neillsville 1,130 1,105 1,110 1,123 1,132 1,150 1,173 3.8<br />
Owen 412 403 407 413 419 427 437 6.1<br />
Stanley* 0 0 2 2 2 2 2 n.a.<br />
Thorp 706 708 716 727 739 755 771 9.2<br />
Subtotal: 4,297 4,264 4,342 4,436 4,533 4,658 4,795 11.6<br />
Clark County 12,047 12,209 12,637 13,095 13,602 14,181 14,805 22.9<br />
source: <strong>Wisconsin</strong> Department of Administration, Demographic Services Center, October 2008.<br />
*Portion of these communities located in Clark County only.<br />
32 Issues & Opportunities Information
Table 1.12<br />
<strong>West</strong> <strong>Central</strong> <strong>Wisconsin</strong> Region Occupation Projections (2014)<br />
Fastest Growth<br />
Most Openings<br />
Top 10 Occupations<br />
Typically Required<br />
Education/Training<br />
Average Wage<br />
Home Health Aides 1-month on-the-job training $9.29<br />
Medical Assistants 1-12 mo. on-the-job training $12.63<br />
Network and Data Analysts Bachelor’s degree $22.19<br />
Computer Software Engrs, Applications Bachelor’s degree $37.08<br />
Personal and Home Care Aides 1-month on-the-job training $8.82<br />
Dental Assistants 1-12 mo. on-the-job training $12.50<br />
Dental Hygienists Associate degree $23.34<br />
Employment, Recruitment & Placement Bachelor’s degree $19.67<br />
Medical Records & Health Information Associate degree $12.71<br />
Occupational Therapists Master’s degree $25.53<br />
Cashiers 1-month on-the-job training $7.64<br />
Retail Salespersons 1-month on-the-job training $11.06<br />
Comb Food Prep/Serv Wrk/Incl Fast 1-month on-the-job training $7.04<br />
Waiters/Waitresses 1-month on-the-job training $7.34<br />
Registered Nurses Associate’s or Bachelor’s degree $25.83<br />
Labrs/Frght/Stock/Matrl Movers/Handlers 1-month on-the-job training $10.09<br />
Janitors/Cleaners, except Maids/Housekpg 1-month on-the-job training $10.67<br />
Team Assemblers 1-12 mo. on-the-job training $12.94<br />
Stock Clerks/Order Fillers 1-month on-the-job training $9.47<br />
Bartenders 1-month on-the-job training $8.16<br />
<strong>West</strong> <strong>Central</strong> WDA includes Barron, Chippewa Clark, Dunn, Eau Claire, Pepin, Pierce, Polk and St. Croix Counties.<br />
source: <strong>Wisconsin</strong> Dept. of Workforce Development, Bureau of Workforce Information, 2006<br />
Table 1.13<br />
<strong>West</strong> <strong>Central</strong> <strong>Wisconsin</strong> Region Industry Projections (2004-2014)<br />
Industry Title<br />
2004<br />
Estimated<br />
Employment<br />
2014<br />
Projected<br />
Employment<br />
2004-2014<br />
Employment<br />
Change<br />
2004-2014<br />
Percentage<br />
Change<br />
Total Non-Farm Employment 173,880 194,330 20,450 11.8%<br />
Construction/Mining/Natural Resources 8,380 9,880 1,500 17.9%<br />
Manufacturing 31,990 32,030 40 0.1%<br />
Paper Manufacturing 1,720 1,720 0 0.0%<br />
Plastics and Rubber Products 3,400 3,670 270 7.9%<br />
Computer and Electronic Product 3,220 3,020 -200 -6.2%<br />
Trade 28,800 30,900 2,100 7.3%<br />
Food and Beverage Stores 5,040 5,250 210 4.2%<br />
Transportation and Utilities (Including US<br />
Postal) 8,270 9,520 1,250 15.1%<br />
Financial Activities 7,010 7,710 700 10.0%<br />
Education and Health Services (Including<br />
State and Local Gov Educ and Hosp) 37,330 45,540 8,210 22.0%<br />
Ambulatory Health Care Services 5,540 7,570 2,030 36.6%<br />
Hospitals (Including State and Local<br />
Government) 7,050 8,640 1,590 22.6%<br />
Leisure and Hospitality 17,300 19,930 2,630 15.2%<br />
Information/Prof Services/Other Services 21,470 24,920 3,450 16.1%<br />
Government (Excluding US Postal, State<br />
and Local Educ and Hosp) 13,310 13,930 620 4.7%<br />
<strong>West</strong> <strong>Central</strong> WDA includes Barron, Chippewa Clark, Dunn, Eau Claire, Pepin, Pierce, Polk and St. Croix Counties.<br />
source: <strong>Wisconsin</strong> Dept. of Workforce Development, Bureau of Workforce Information, 2006<br />
Clark County Conditions and Trends Report 33
Table 1.14<br />
Clark County Race Characteristics (2000)<br />
Municipality<br />
Total Population<br />
White<br />
% White<br />
Towns<br />
Beaver 854 845 99.1% 0 0 1 0 2 6 1.1%<br />
Butler 88 88 98.1% 0 0 0 0 0 0 0.0%<br />
Colby 908 882 97.7% 4 5 5 0 7 5 2.9%<br />
Dewhurst 321 284 100.0% 3 33 0 0 0 1 11.5%<br />
Eaton 665 655 98.6% 3 1 1 0 2 3 1.5%<br />
Foster 95 94 98.1% 0 0 0 0 0 1 1.1%<br />
Fremont 1,190 1,167 97.5% 0 1 11 0 5 6 1.9%<br />
Grant 920 911 99.5% 0 0 0 0 8 1 1.0%<br />
Green Grove 902 892 97.1% 0 2 2 0 0 6 1.1%<br />
Hendren 513 506 97.2% 0 0 0 2 5 0 1.4%<br />
Hewett 314 314 96.5% 0 0 0 0 0 0 0.0%<br />
Hixon 740 735 98.6% 0 0 1 0 1 3 0.7%<br />
Hoard 594 580 90.7% 0 7 0 0 5 2 2.4%<br />
Levis 504 475 94.2% 0 29 0 0 0 0 5.8%<br />
Longwood 698 695 99.6% 1 0 0 0 0 2 0.4%<br />
Loyal 787 783 99.5% 1 3 0 0 0 0 0.5%<br />
Lynn 834 818 98.1% 0 0 6 0 0 10 1.9%<br />
Mayville 919 902 98.2% 0 3 0 0 5 9 1.8%<br />
Mead 290 278 95.9% 0 5 0 0 0 7 4.1%<br />
Mentor 570 561 98.4% 1 6 0 0 0 2 1.6%<br />
Pine Valley 1,121 1,105 98.6% 1 10 0 0 0 5 1.4%<br />
Reseburg 740 733 99.1% 0 0 0 0 0 7 0.9%<br />
Seif 212 212 100.0% 0 0 0 0 0 0 0.0%<br />
Sherman 831 814 98.0% 1 0 0 0 6 10 2.0%<br />
Sherwood 252 243 78.8% 2 1 0 0 1 5 3.6%<br />
Thorp 730 723 96.9% 0 4 1 0 0 2 1.0%<br />
Unity 745 731 98.6% 0 0 10 0 1 3 1.9%<br />
Warner 627 617 95.1% 0 0 8 0 0 2 1.6%<br />
Washburn 304 303 98.1% 0 0 0 0 0 1 0.3%<br />
<strong>West</strong>on 638 634 99.4% 1 2 1 0 0 0 0.6%<br />
Withee 885 882 98.7% 0 1 1 0 0 1 0.3%<br />
Worden 657 648 99.4% 1 0 0 0 5 3 1.4%<br />
York 853 842 98.6% 0 1 1 0 5 4 1.3%<br />
sub-total 21,301 20,952 98.4% 19 114 49 2 58 107 1.6%<br />
Villages<br />
Curtiss 198 128 94.7% 0 1 2 0 67 0 35.4%<br />
Dorchester* 823 798 97.8% 0 2 0 0 16 7 3.0%<br />
Granton* 406 398 98.3% 3 1 2 0 0 2 2.0%<br />
Unity* 163 162 96.6% 0 0 0 0 1 0 0.6%<br />
Withee 508 500 99.7% 0 2 1 0 1 4 1.6%<br />
sub-total 2,098 1,986 94.7% 3 6 5 0 85 13 5.3%<br />
Cities<br />
Abbotsford* 1,412 1,394 97.9% 1 1 1 0 11 4 1.3%<br />
Colby* 1,156 1,115 96.5% 3 3 7 0 22 6 3.5%<br />
Greenwood 1,079 1,070 99.2% 0 2 1 0 1 5 0.8%<br />
Loyal 1,308 1,294 98.9% 6 0 1 0 3 4 1.1%<br />
Neillsville 2,731 2,643 96.8% 4 30 34 1 7 12 3.2%<br />
Owen 936 923 98.6% 6 4 1 0 0 2 1.4%<br />
Stanley*<br />
Thorp 1,536 1,527 99.4% 1<br />
no data<br />
1 2 0 1 4 0.6%<br />
sub-total 10,158 9,966 97.9% 21 41 47 1 45 37 1.9%<br />
Clark County 33,557 32,904 98.1% 43 161 101 3 188 157 1.9%<br />
Source: U.S. Census<br />
*Portion of these communities located in Clark County only.<br />
Black/African American<br />
American Indian & Alaska<br />
Native<br />
Asian<br />
Native Hawaiian & Other<br />
Pacific Islander<br />
Other Race<br />
Two or More Races<br />
% Other Race<br />
34 Issues & Opportunities Information
Table 1.15<br />
Educational Attainment Levels – 1990 and 2000 – Clark County Municipal Units<br />
Educational Level 1990 2000<br />
Number Percent Number Percent<br />
Persons 25 Years and Over 346 100.0 436 100.0<br />
Town of Beaver<br />
Less than high school diploma 93 26.9 91 20.9<br />
High school graduate 187 54.0 207 47.5<br />
Some college, no degree 28 8.1 77 17.7<br />
Associate degree 23 6.6 15 3.4<br />
Bachelor’s degree or higher 15 4.3 46 10.6<br />
High school graduate or higher 253 73.1 345 79.1<br />
Persons 25 Years and Over 58 100.0 46 100.0<br />
Town of Butler<br />
Less than high school diploma 24 41.4 20 43.5<br />
High school graduate 24 41.4 13 28.3<br />
Some college, no degree 4 6.9 9 19.6<br />
Associate degree 0 0.0 4 8.7<br />
Bachelor’s degree or higher 6 10.3 0 0.0<br />
High school graduate or higher 34 58.6 26 56.5<br />
Persons 25 Years and Over 468 100.0 502 100.0<br />
Town of Colby<br />
Less than high school diploma 135 28.8 111 22.1<br />
High school graduate 241 51.5 238 47.4<br />
Some college, no degree 42 9.0 65 12.9<br />
Associate degree 19 4.1 29 5.8<br />
Bachelor’s degree or higher 31 6.6 59 11.8<br />
High school graduate or higher 333 71.2 391 77.9<br />
Persons 25 Years and Over 174 100.0 250 100.0<br />
Town of Dewhurst<br />
Less than high school diploma 55 31.6 56 22.4<br />
High school graduate 66 37.9 106 42.4<br />
Some college, no degree 24 13.8 42 16.8<br />
Associate degree 7 4.0 10 4.0<br />
Bachelor’s degree or higher 22 12.6 36 14.4<br />
High school graduate or higher 119 68.4 194 77.6<br />
Persons 25 Years and Over 355 100.0 408 100.0<br />
Town of Eaton<br />
Less than high school diploma 76 21.4 79 19.4<br />
High school graduate 163 45.9 172 42.2<br />
Some college, no degree 62 17.5 90 22.1<br />
Associate degree 25 7.0 33 8.1<br />
Bachelor’s degree or higher 29 8.2 34 8.3<br />
High school graduate or higher 279 78.6 329 80.6<br />
Clark County Conditions and Trends Report 35
Table 1.15 continued<br />
Educational Attainment Levels – 1990 and 2000 – Clark County Municipal Units<br />
Educational Level 1990 2000<br />
Number Percent Number Percent<br />
Persons 25 Years and Over 56 100.0 77 100.0<br />
Town of Foster<br />
Less than high school diploma 16 28.6 13 16.9<br />
High school graduate 32 57.1 40 51.9<br />
Some college, no degree 2 3.6 14 18.2<br />
Associate degree 2 3.6 3 3.9<br />
Bachelor’s degree or higher 4 7.1 7 9.1<br />
High school graduate or higher 40 71.4 64 83.1<br />
Persons 25 Years and Over 581 100.0 656 100.0<br />
Town of Fremont<br />
Less than high school diploma 176 30.3 207 31.6<br />
High school graduate 284 48.9 272 41.5<br />
Some college, no degree 60 10.3 116 17.7<br />
Associate degree 35 6.0 31 4.7<br />
Bachelor’s degree or higher 26 4.5 30 4.6<br />
High school graduate or higher 405 69.7 449 68.4<br />
Persons 25 Years and Over 530 100.0 563 100.0<br />
Town of Grant<br />
Less than high school diploma 139 26.2 133 23.6<br />
High school graduate 254 47.9 272 48.3<br />
Some college, no degree 57 10.8 84 14.9<br />
Associate degree 35 6.6 19 3.4<br />
Bachelor’s degree or higher 45 8.5 55 9.8<br />
High school graduate or higher 391 73.8 430 76.4<br />
Town of Green Grove<br />
Persons 25 Years and Over 376 100.0 617 100.0<br />
Less than high school diploma 100 26.6 185 30.0<br />
High school graduate 196 52.1 256 41.5<br />
Some college, no degree 34 9.0 87 14.1<br />
Associate degree 15 4.0 55 8.9<br />
Bachelor’s degree or higher 31 8.2 34 5.5<br />
High school graduate or higher 276 73.4 432 70.0<br />
Persons 25 Years and Over 344 100.0 328 100.0<br />
Town of Hendren<br />
Less than high school diploma 133 38.7 79 24.1<br />
High school graduate 134 39.0 145 44.2<br />
Some college, no degree 34 9.9 43 13.1<br />
Associate degree 25 7.3 39 11.9<br />
Bachelor’s degree or higher 18 5.2 22 6.7<br />
High school graduate or higher 211 61.3 249 75.9<br />
36 Issues & Opportunities Information
Table 1.15 continued<br />
Educational Attainment Levels – 1990 and 2000 – Clark County Municipal Units<br />
Educational Level 1990 2000<br />
Number Percent Number Percent<br />
Persons 25 Years and Over 218 100.0 225 100.0<br />
Town of Hewett<br />
Less than high school diploma 58 26.6 46 20.4<br />
High school graduate 73 33.5 71 31.6<br />
Some college, no degree 35 16.1 44 19.6<br />
Associate degree 8 3.7 24 10.7<br />
Bachelor’s degree or higher 44 20.2 40 17.8<br />
High school graduate or higher 160 73.4 179 79.6<br />
Persons 25 Years and Over 436 100.0 407 100.0<br />
Town of Hixon<br />
Less than high school diploma 131 30.0 133 32.7<br />
High school graduate 219 50.2 147 36.1<br />
Some college, no degree 37 8.5 79 19.4<br />
Associate degree 13 3.0 18 4.4<br />
Bachelor’s degree or higher 36 8.3 30 7.4<br />
High school graduate or higher 305 70.0 274 67.3<br />
Persons 25 Years and Over 546 100.0 328 100.0<br />
Town of Hoard<br />
Less than high school diploma 349 63.9 87 26.5<br />
High school graduate 137 25.1 146 44.5<br />
Some college, no degree 32 5.9 61 18.6<br />
Associate degree 12 2.2 16 4.9<br />
Bachelor’s degree or higher 16 2.9 18 5.5<br />
High school graduate or higher 197 36.1 241 73.5<br />
Persons 25 Years and Over 291 100.0 325 100.0<br />
Town of Levis<br />
Less than high school diploma 96 33.0 83 25.5<br />
High school graduate 134 46.0 160 49.2<br />
Some college, no degree 24 8.2 39 12.0<br />
Associate degree 29 10.0 22 6.8<br />
Bachelor’s degree or higher 8 2.7 21 6.5<br />
High school graduate or higher 195 67.0 242 74.5<br />
Persons 25 Years and Over 391 100.0 437 100.0<br />
Town of Longwood<br />
Less than high school diploma 118 30.2 113 25.9<br />
High school graduate 166 42.5 165 37.8<br />
Some college, no degree 68 17.4 92 21.1<br />
Associate degree 21 5.4 21 4.8<br />
Bachelor’s degree or higher 18 4.6 46 10.5<br />
High school graduate or higher 273 69.8 324 74.1<br />
Clark County Conditions and Trends Report 37
Table 1.15 continued<br />
Educational Attainment Levels – 1990 and 2000 – Clark County Municipal Units<br />
Education Level 1990 2000<br />
Number Percent Number Percent<br />
Persons 25 Years and Over 386 100.0 393 100.0<br />
Town of Loyal<br />
Less than high school diploma 89 23.1 109 27.7<br />
High school graduate 216 56.0 159 40.5<br />
Some college, no degree 41 10.6 60 15.3<br />
Associate degree 19 4.9 31 7.9<br />
Bachelor’s degree or higher 21 5.4 34 8.7<br />
High school graduate or higher 297 76.9 284 72.3<br />
Persons 25 Years and Over 391 100.0 465 100.0<br />
Town of Lynn<br />
Less than high school diploma 131 33.5 161 34.6<br />
High school graduate 165 42.2 156 33.5<br />
Some college, no degree 47 12.0 82 17.6<br />
Associate degree 16 4.1 23 4.9<br />
Bachelor’s degree or higher 32 8.2 43 9.2<br />
High school graduate or higher 260 66.5 304 65.4<br />
Persons 25 Years and Over 542 100.0 520 100.0<br />
Town of Mayville<br />
Less than high school diploma 193 35.6 126 24.2<br />
High school graduate 258 47.6 257 49.4<br />
Some college, no degree 46 8.5 51 9.8<br />
Associate degree 23 4.2 39 7.5<br />
Bachelor’s degree or higher 22 4.1 47 9.0<br />
High school graduate or higher 349 64.4 394 75.8<br />
Persons 25 Years and Over 174 100.0 212 100.0<br />
Town of Mead<br />
Less than high school diploma 62 35.6 53 25.0<br />
High school graduate 64 36.8 72 34.0<br />
Some college, no degree 29 16.7 54 25.5<br />
Associate degree 12 6.9 18 8.5<br />
Bachelor’s degree or higher 7 4.0 15 7.1<br />
High school graduate or higher 112 64.4 159 75.0<br />
Persons 25 Years and Over 329 100.0 376 100.0<br />
Town of Mentor<br />
Less than high school diploma 132 40.1 67 17.8<br />
High school graduate 132 40.1 195 51.9<br />
Some college, no degree 34 10.3 53 14.1<br />
Associate degree 4 1.2 29 7.7<br />
Bachelor’s degree or higher 27 8.2 32 8.5<br />
High school graduate or higher 197 59.9 309 82.2<br />
38 Issues & Opportunities Information
Table 1.15 continued<br />
Educational Attainment Levels – 1990 and 2000 – Clark County Municipal Units<br />
Education Level 1990 2000<br />
Number Percent Number Percent<br />
Persons 25 Years and Over 669 100.0 744 100.0<br />
Town of Pine Valley<br />
Less than high school diploma 169 25.3 136 18.3<br />
High school graduate 344 51.4 373 50.1<br />
Some college, no degree 63 9.4 117 15.7<br />
Associate degree 28 4.2 49 6.6<br />
Bachelor’s degree or higher 65 9.7 69 9.3<br />
High school graduate or higher 500 74.7 608 81.7<br />
Persons 25 Years and Over 369 100.0 384 100.0<br />
Town of Reseberg<br />
Less than high school diploma 135 36.6 127 33.1<br />
High school graduate 167 45.3 144 37.5<br />
Some college, no degree 27 7.3 76 19.8<br />
Associate degree 18 4.9 17 4.4<br />
Bachelor’s degree or higher 22 6.0 20 5.2<br />
High school graduate or higher 234 63.4 257 66.9<br />
Persons 25 Years and Over 129 100.0 163 100.0<br />
Less than high school diploma 47 36.4 34 20.9<br />
Town of Seif<br />
High school graduate 50 38.8 69 42.3<br />
Some college, no degree 21 16.3 38 23.3<br />
Associate degree 0 0.0 5 3.1<br />
Bachelor’s degree or higher 11 8.5 17 10.4<br />
High school graduate or higher 82 63.6 129 79.1<br />
Persons 25 Years and Over 386 100.0 492 100.0<br />
Town of Sherman<br />
Less than high school diploma 164 42.5 127 25.8<br />
High school graduate 160 41.5 195 39.6<br />
Some college, no degree 23 6.0 76 15.4<br />
Associate degree 20 5.2 38 7.7<br />
Bachelor’s degree or higher 19 4.9 56 11.4<br />
High school graduate or higher 222 57.5 365 74.2<br />
Persons 25 Years and Over 137 100.0 159 100.0<br />
Town of Sherwood<br />
Less than high school diploma 30 21.9 40 25.2<br />
High school graduate 84 61.3 68 42.8<br />
Some college, no degree 9 6.6 25 15.7<br />
Associate degree 4 2.9 13 8.2<br />
Bachelor’s degree or higher 10 7.3 13 8.2<br />
High school graduate or higher 107 78.1 119 74.8<br />
Clark County Conditions and Trends Report 39
Table 1.15 continued<br />
Educational Attainment Levels – 1990 and 2000 – Clark County Municipal Units<br />
Education Level 1990 2000<br />
Number Percent Number Percent<br />
Persons 25 Years and Over 421 100.0 469 100.0<br />
Town of Thorp<br />
Less than high school diploma 114 27.1 115 24.5<br />
High school graduate 204 48.5 181 38.6<br />
Some college, no degree 53 12.6 86 18.3<br />
Associate degree 27 6.4 45 9.6<br />
Bachelor’s degree or higher 23 5.5 42 9.0<br />
High school graduate or higher 307 72.9 354 75.5<br />
Persons 25 Years and Over 441 100.0 455 100.0<br />
Town of Unity<br />
Less than high school diploma 123 27.9 98 21.5<br />
High school graduate 207 46.9 215 47.3<br />
Some college, no degree 47 10.7 80 17.6<br />
Associate degree 47 10.7 28 6.2<br />
Bachelor’s degree or higher 17 3.9 34 7.5<br />
High school graduate or higher 318 72.1 357 78.5<br />
Persons 25 Years and Over 341 100.0 374 100.0<br />
Town of Warner<br />
Less than high school diploma 82 24.0 86 23.0<br />
High school graduate 150 44.0 160 42.8<br />
Some college, no degree 44 12.9 66 17.6<br />
Associate degree 34 10.0 27 7.2<br />
Bachelor’s degree or higher 31 9.1 35 9.4<br />
High school graduate or higher 259 76.0 288 77.0<br />
Persons 25 Years and Over 201 100.0 208 100.0<br />
Town of Washburn<br />
Less than high school diploma 81 40.3 51 24.5<br />
High school graduate 81 40.3 103 49.5<br />
Some college, no degree 18 9.0 27 13.0<br />
Associate degree 11 5.5 17 8.2<br />
Bachelor’s degree or higher 10 5.0 10 4.8<br />
High school graduate or higher 120 59.7 157 75.5<br />
Persons 25 Years and Over 392 100.0 391 100.0<br />
Town of <strong>West</strong>on<br />
Less than high school diploma 102 26.0 86 22.0<br />
High school graduate 199 50.8 177 45.3<br />
Some college, no degree 31 7.9 61 15.6<br />
Associate degree 24 6.1 31 7.9<br />
Bachelor’s degree or higher 36 9.2 36 9.2<br />
High school graduate or higher 290 74.0 305 78.0<br />
40 Issues & Opportunities Information
Table 1.15 continued<br />
Educational Attainment Levels – 1990 and 2000 – Clark County Municipal Units<br />
Education Level 1990 2000<br />
Number Percent Number Percent<br />
Persons 25 Years and Over 425 100.0 477 100.0<br />
Town of Withee<br />
Less than high school diploma 145 34.1 161 33.8<br />
High school graduate 216 50.8 181 37.9<br />
Some college, no degree 22 5.2 65 13.6<br />
Associate degree 21 4.9 36 7.5<br />
Bachelor’s degree or higher 21 4.9 34 7.1<br />
High school graduate or higher 280 65.9 316 66.2<br />
Persons 25 Years and Over 338 100.0 344 100.0<br />
Town of Worden<br />
Less than high school diploma 107 31.7 72 20.9<br />
High school graduate 150 44.4 183 53.2<br />
Some college, no degree 41 12.1 39 11.3<br />
Associate degree 19 5.6 28 8.1<br />
Bachelor’s degree or higher 21 6.2 22 6.4<br />
High school graduate or higher 231 68.3 272 79.1<br />
Persons 25 Years and Over 483 100.0 495 100.0<br />
Town of York<br />
Less than high school diploma 136 28.2 119 24.0<br />
High school graduate 232 48.0 244 49.3<br />
Some college, no degree 44 9.1 81 16.4<br />
Associate degree 38 7.9 26 5.3<br />
Bachelor’s degree or higher 33 6.8 25 5.1<br />
High school graduate or higher 347 71.8 376 76.0<br />
Persons 25 Years and Over 108 100.0 115 100.0<br />
Village of Curtiss<br />
Less than high school diploma 45 41.7 42 36.5<br />
High school graduate 48 44.4 40 34.8<br />
Some college, no degree 13 12.0 21 18.3<br />
Associate degree 0 0.0 7 6.1<br />
Bachelor’s degree or higher 2 1.9 5 4.3<br />
High school graduate or higher 63 58.3 73 63.5<br />
Village of Dorchester<br />
Persons 25 Years and Over 422 100.0 551 100.0<br />
Less than high school diploma 122 28.9 151 27.4<br />
High school graduate 194 46.0 237 43.0<br />
Some college, no degree 61 14.5 87 15.8<br />
Associate degree 15 3.6 27 4.9<br />
Bachelor’s degree or higher 30 7.1 49 8.9<br />
High school graduate or higher 300 71.1 400 72.6<br />
Clark County Conditions and Trends Report 41
Table 1.15 continued<br />
Educational Attainment Levels – 1990 and 2000 – Clark County Municipal Units<br />
Educational Level 1990 2000<br />
Number Percent Number Percent<br />
Persons 25 Years and Over 248 100.0 252 100.0<br />
Village of Granton<br />
Less than high school diploma 88 35.5 48 19.0<br />
High school graduate 119 48.0 127 50.4<br />
Some college, no degree 18 7.3 50 19.8<br />
Associate degree 7 2.8 7 2.8<br />
Bachelor’s degree or higher 16 6.5 20 7.9<br />
High school graduate or higher 160 64.5 204 81.0<br />
Persons 25 Years and Over 112 100.0 94 100.0<br />
Village of Unity<br />
Less than high school diploma 38 33.9 32 34.0<br />
High school graduate 56 50.0 43 45.7<br />
Some college, no degree 5 4.5 10 10.6<br />
Associate degree 4 3.6 7 7.4<br />
Bachelor’s degree or higher 9 8.0 2 2.1<br />
High school graduate or higher 74 66.1 62 66.0<br />
Persons 25 Years and Over 335 100.0 327 100.0<br />
Village of Withee<br />
Less than high school diploma 116 34.6 51 15.6<br />
High school graduate 161 48.1 160 48.9<br />
Some college, no degree 32 9.6 74 22.6<br />
Associate degree 11 3.3 5 1.5<br />
Bachelor’s degree or higher 15 4.5 37 11.3<br />
High school graduate or higher 219 65.4 276 84.4<br />
Persons 25 Years and Over 935 100.0 974 100.0<br />
City of Abbotsford<br />
Less than high school diploma 274 29.3 229 23.5<br />
High school graduate 384 41.1 365 37.5<br />
Some college, no degree 95 10.2 146 15.0<br />
Associate degree 64 6.8 41 4.2<br />
Bachelor’s degree or higher 118 12.6 193 19.8<br />
High school graduate or higher 661 70.7 745 76.5<br />
Persons 25 Years and Over 737 100.0 785 100.0<br />
Less than high school diploma 273 37.0 193 24.6<br />
City of Colby<br />
High school graduate 267 36.2 350 44.6<br />
Some college, no degree 72 9.8 118 15.0<br />
Associate degree 41 5.6 49 6.2<br />
Bachelor’s degree or higher 84 11.4 75 9.6<br />
High school graduate or higher 464 63.0 592 75.4<br />
42 Issues & Opportunities Information
Table 1.15 continued<br />
Educational Attainment Levels – 1990 and 2000 – Clark County Municipal Units<br />
Educational Level 1990 2000<br />
Number Percent Number Percent<br />
Persons 25 Years and Over 667 100.0 709 100.0<br />
City of Greenwood<br />
Less than high school diploma 242 36.3 166 23.4<br />
High school graduate 227 34.0 257 36.2<br />
Some college, no degree 82 12.3 107 15.1<br />
Associate degree 32 4.8 83 11.7<br />
Bachelor’s degree or higher 84 12.6 96 13.5<br />
High school graduate or higher 425 63.7 543 76.6<br />
Persons 25 Years and Over 807 100.0 873 100.0<br />
Less than high school diploma 209 25.9 193 22.1<br />
City of Loyal<br />
High school graduate 387 48.0 433 49.6<br />
Some college, no degree 79 9.8 122 14.0<br />
Associate degree 40 5.0 51 5.8<br />
Bachelor’s degree or higher 92 11.4 74 8.5<br />
High school graduate or higher 598 74.1 680 77.9<br />
Persons 25 Years and Over 1,823 100.0 1,876 100.0<br />
City of Neillsville<br />
Less than high school diploma 610 33.5 435 23.2<br />
High school graduate 632 34.7 741 39.5<br />
Some college, no degree 192 10.5 259 13.8<br />
Associate degree 105 5.8 98 5.2<br />
Bachelor’s degree or higher 284 15.6 343 18.3<br />
High school graduate or higher 1,213 66.5 1,441 76.8<br />
Persons 25 Years and Over 654 100.0 645 100.0<br />
City of Owen<br />
Less than high school diploma 223 34.1 156 24.2<br />
High school graduate 277 42.4 265 41.1<br />
Some college, no degree 74 11.3 136 21.1<br />
Associate degree 21 3.2 29 4.5<br />
Bachelor’s degree or higher 59 9.0 59 9.1<br />
High school graduate or higher 431 65.9 489 75.8<br />
Persons 25 Years and Over 1,130 100.0 1,064 100.0<br />
City of Thorp<br />
Less than high school diploma 415 36.7 269 25.3<br />
High school graduate 377 33.4 391 36.7<br />
Some college, no degree 154 13.6 187 17.6<br />
Associate degree 52 4.6 65 6.1<br />
Bachelor’s degree or higher 132 11.7 152 14.3<br />
High school graduate or higher 715 63.3 795 74.7<br />
Clark County Conditions and Trends Report 43
Table 1.15 continued<br />
Educational Attainment Levels – 1990 and 2000 – Clark County Municipal Units<br />
Persons 25 Years and Over 19,702 100.0 20,991 100.0<br />
Clark County<br />
Less than high school diploma 6,396 32.5 5,169 24.6<br />
High school graduate 8,518 43.2 8,951 42.6<br />
Some college, no degree 2,060 10.5 3,396 16.2<br />
Associate degree 1,026 5.2 1,308 6.2<br />
Bachelor’s degree or higher 1,702 8.6 2,167 10.3<br />
High school graduate or higher 13,306 67.5 15,822 75.4<br />
Source: U.S. Census<br />
*Portion of these communities located in Clark County only.<br />
44 Issues & Opportunities Information
Table 1.16<br />
Labor Force – 2000 – Clark County Municipal Units<br />
Municipality<br />
Persons 16<br />
and over<br />
# in Labor<br />
Force<br />
% in Labor<br />
Force<br />
Employed Unemployed % Unemployed<br />
Towns<br />
Beaver 556 407 73.2 395 12 2.9<br />
Butler 52 29 55.8 27 2 6.9<br />
Colby 625 471 75.4 459 12 2.5<br />
Dewhurst 278 148 53.2 142 6 4.1<br />
Eaton 506 376 74.3 361 11 2.9<br />
Foster 83 49 59.0 47 2 4.1<br />
Fremont 843 599 71.1 584 15 2.5<br />
Grant 677 447 66.0 429 18 4.0<br />
Green Grove 707 351 49.6 338 13 3.7<br />
Hendren 376 255 67.8 249 6 2.4<br />
Hewett 261 181 69.3 179 2 1.1<br />
Hixon 492 323 65.7 306 17 5.3<br />
Hoard 386 276 71.5 261 15 5.4<br />
Levis 390 257 65.9 237 20 7.8<br />
Longwood 503 310 61.6 294 16 5.2<br />
Loyal 508 379 74.6 373 6 1.6<br />
Lynn 563 342 60.7 324 18 5.3<br />
Mayville 653 492 75.3 467 23 4.7<br />
Mead 235 155 66.0 152 3 1.9<br />
Mentor 428 308 72.0 284 22 7.1<br />
Pine Valley 850 612 72.0 576 36 5.9<br />
Reseburg 526 385 73.2 370 15 3.9<br />
Seif 188 135 71.8 122 13 9.6<br />
Sherman 578 422 73.0 407 15 3.6<br />
Sherwood 178 111 62.4 103 8 7.2<br />
Thorp 549 419 76.3 401 18 4.3<br />
Unity 544 397 73.0 388 9 2.3<br />
Warner 434 284 65.4 274 10 3.5<br />
Washburn 251 173 68.9 158 15 8.7<br />
<strong>West</strong>on 458 363 79.3 340 21 5.8<br />
Withee 593 395 66.6 378 15 3.8<br />
Worden 420 312 74.3 301 11 3.5<br />
York 625 477 76.3 457 20 4.2<br />
Clark County Conditions and Trends Report 45
Table 1.16 continued<br />
Labor Force – 2000 – Clark County Municipal Units<br />
Municipality<br />
Persons 16<br />
and over<br />
# in Labor<br />
Force<br />
% in Labor<br />
Force<br />
Employed Unemployed % Unemployed<br />
Villages<br />
Curtiss 141 93 66.0 86 7 7.5<br />
Dorchester* 659 468 71.0 446 22 4.7<br />
Granton* 315 197 62.5 183 14 7.1<br />
Unity* 109 69 63.3 66 3 4.3<br />
Withee 359 214 59.6 209 5 2.3<br />
Cities<br />
Abbotsford* 1,105 698 63.2 687 11 1.6<br />
Colby* 897 573 63.9 559 14 2.4<br />
Greenwood 822 545 66.3 529 16 2.9<br />
Loyal 999 657 65.8 631 26 4.0<br />
Neillsville 2,151 1,235 57.4 1183 52 4.2<br />
Owen 764 464 60.7 435 29 6.3<br />
Thorp 1,216 713 58.6 672 41 5.8<br />
Clark County 24,853 16,566 66.7 15869 685 4.1<br />
Source: U.S. Census<br />
*Portion of these communities located in Clark County only.<br />
46 Issues & Opportunities Information
Table 1.17<br />
Labor Force – 1990 – Clark County Municipal Units<br />
Municipality<br />
Persons 16<br />
and over<br />
# in Labor<br />
Force<br />
% in Labor<br />
Force<br />
Employed Unemployed % Unemployed<br />
Towns<br />
Beaver 448 314 70.1 302 12 3.8<br />
Butler 65 41 63.1 40 1 2.4<br />
Colby 572 422 73.8 409 13 3.1<br />
Dewhurst 181 93 51.4 85 6 6.5<br />
Eaton 426 323 75.8 295 28 8.7<br />
Foster 57 25 43.9 23 2 8.0<br />
Fremont 685 488 71.2 471 17 3.5<br />
Grant 629 440 70.0 434 6 1.4<br />
Green Grove 441 305 69.2 292 13 4.3<br />
Hendren 377 221 58.6 213 8 3.6<br />
Hewett 242 155 64.0 145 10 6.5<br />
Hixon 504 341 67.7 318 23 6.7<br />
Hoard 602 246 40.9 235 11 4.5<br />
Levis 347 239 68.9 217 20 8.4<br />
Longwood 448 314 70.1 303 11 3.5<br />
Loyal 486 384 79.0 382 2 0.5<br />
Lynn 470 334 71.1 316 18 5.4<br />
Mayville 653 474 72.6 441 33 7.0<br />
Mead 195 105 53.8 96 9 8.6<br />
Mentor 389 225 57.8 208 15 6.7<br />
Pine Valley 770 523 67.9 477 44 8.4<br />
Reseburg 435 324 74.5 308 16 4.9<br />
Seif 140 72 51.4 70 2 2.8<br />
Sherman 494 330 66.8 310 18 5.5<br />
Sherwood 147 87 59.2 71 16 18.4<br />
Thorp 506 389 76.9 365 24 6.2<br />
Unity 540 404 74.8 391 13 3.2<br />
Warner 416 291 70.0 281 10 3.4<br />
Washburn 228 143 62.7 124 17 11.9<br />
<strong>West</strong>on 492 374 76.0 352 20 5.3<br />
Withee 491 328 66.8 311 17 5.2<br />
Worden 397 272 68.5 253 19 7.0<br />
York 581 443 76.2 427 16 3.6<br />
Clark County Conditions and Trends Report 47
Table 1.17 continued<br />
Labor Force – 1990 – Clark County Municipal Units<br />
Municipality<br />
Persons 16<br />
and over<br />
# in Labor<br />
Force<br />
% in Labor<br />
Force<br />
Employed Unemployed % Unemployed<br />
Villages<br />
Curtiss 120 68 56.7 62 6 8.8<br />
Dorchester* 497 345 69.4 326 19 5.5<br />
Granton* 281 161 57.3 144 17 10.6<br />
Unity* 140 92 65.7 90 2 2.2<br />
Withee 370 203 54.9 199 4 2.0<br />
Cities<br />
Abbotsford* 1,083 723 66.8 691 32 4.4<br />
Colby* 849 493 58.1 477 16 3.2<br />
Greenwood 770 437 56.8 413 24 5.5<br />
Loyal 933 592 63.5 565 27 4.6<br />
Neillsville 2,098 1,109 52.9 1,037 63 5.7<br />
Owen 749 393 52.5 359 34 8.7<br />
Thorp 1,289 666 51.7 628 38 5.7<br />
Clark County 23,033 14,751 64.0 13,956 772 5.2<br />
Source: U.S. Census<br />
*Portion of these communities located in Clark County only.<br />
48 Issues & Opportunities Information
Table 1.18<br />
Clark County Non-Farm Wage & Salary Employment– 1990 to 2006<br />
Industry Category<br />
1990 1992 1994 1996 1998 2000 2002 2004 2006<br />
% Chg<br />
‘90- ‘06<br />
Ag Forestry Fishing & Hunting 81 114 121 S S S S S S n.a.<br />
Mining Quarrying & Oil & Gas<br />
Extraction<br />
29 27 28 S S S S S S n.a.<br />
Utilities S S S S S S S S S n.a.<br />
Construction 255 248 305 298 377 443 514 528 561 120<br />
Manufacturing 2027 2102 2342 2631 2753 3053 2710 2809 2969 46.5<br />
Wholesale Trade 429 441 476 556 528 441 351 387 381 -11.2<br />
Retail Trade 1242 1285 1326 1504 1530 1450 1416 1476 1512 21.7<br />
Transportation & Warehousing 206 224 233 241 267 298 360 402 513 149.1<br />
Information S S S S S 80 84 88 94 n.a.<br />
Finance & Insurance 306 292 305 258 214 182 235 235 233 -23.9<br />
Real Estate & Rental &<br />
Leasing<br />
Professional & Technical<br />
Services<br />
Management Of Companies &<br />
Enterprises<br />
16 22 41 38 43 30 39 29 30 87.5<br />
120 120 115 108 99 101 112 110 118 -1.7<br />
0 0 0 0 0 0 0 0 S n.a.<br />
Admin & Waste Services 16 17 13 12 11 10 28 34 S n.a.<br />
Educational Services 800 793 848 841 863 871 857 859 818 2.3<br />
Health Care & Social<br />
Assistance<br />
Arts Entertainment &<br />
Recreation<br />
Accommodation & Food<br />
Services<br />
Other Services, except Public<br />
Admin<br />
678 805 899 932 923 967 842 796 968 42.8<br />
71 67 56 46 58 64 70 93 76 7.1<br />
479 435 490 485 480 474 564 610 571 19.2<br />
127 128 144 172 138 139 146 176 171 34.6<br />
Public Administration 978 1035 1001 1045 1044 1068 1011 977 974 -0.4<br />
Total 10,700 11,101 11,935 12,746 13,083 13,733 13,114 13,507 14,089 31.7<br />
note: Only includes employers participating in the State unemployment insurance program. Some estimates are suppressed “S” if<br />
variability is too high or to protect the confidentiality of individual employers.<br />
source: <strong>Wisconsin</strong> Department of Workforce Development, WORKnet<br />
Clark County Conditions and Trends Report 49
Table 1.19<br />
Employment By Industry – 2000 – Clark County Municipal Units<br />
Towns<br />
Municipality<br />
Agriculture, forestry, fishing, hunting, & mining<br />
Construction<br />
Manufacturing<br />
Wholesale trade<br />
Retail trade<br />
Transportation, warehousing, & utilities<br />
Beaver 112 27 81 24 30 24 0 14 6 49 8 18 2 395<br />
Butler 2 6 9 0 4 0 0 2 0 2 0 0 2 27<br />
Colby 118 17 100 17 52 14 3 11 23 53 24 21 6 459<br />
Dewhurst 3 11 23 9 15 7 0 3 10 19 11 9 22 142<br />
Eaton 109 27 76 17 26 10 6 13 12 39 14 6 6 361<br />
Foster 2 5 12 0 3 0 2 0 0 9 8 2 4 47<br />
Fremont 144 60 133 15 43 12 2 8 13 115 14 21 4 584<br />
Grant 62 22 115 11 42 31 4 20 5 63 31 13 10 429<br />
Green Grove 84 11 81 10 22 32 4 3 4 51 4 15 17 338<br />
Hendren 53 15 54 7 13 12 4 9 7 43 12 4 16 249<br />
Hewett 19 6 48 3 20 8 3 6 4 48 2 3 9 179<br />
Hixon 66 8 93 20 18 15 5 5 5 52 6 10 3 306<br />
Hoard 83 10 69 9 16 6 2 3 1 43 11 6 2 261<br />
Levis 33 13 55 5 25 17 0 4 11 38 18 10 8 237<br />
Longwood 80 23 61 13 20 11 8 3 17 35 13 9 1 294<br />
Loyal 140 35 78 10 28 5 2 2 9 49 9 4 2 373<br />
Lynn 77 14 65 14 23 19 0 8 7 73 14 6 4 324<br />
Mayville 101 10 133 15 47 21 0 19 12 63 28 15 3 467<br />
Mead 24 9 39 14 10 4 2 3 0 32 7 5 3 152<br />
Mentor 31 25 88 2 24 15 0 7 5 55 19 0 13 284<br />
Pine Valley 30 33 141 16 82 27 4 27 29 109 34 30 14 576<br />
Reseburg 150 19 43 9 25 26 4 7 5 49 23 10 0 370<br />
Seif 38 4 30 1 12 4 0 2 7 17 2 3 2 122<br />
Sherman 103 38 98 4 37 8 0 3 20 78 6 7 5 407<br />
Sherwood 24 5 36 0 8 6 2 0 0 17 2 0 3 103<br />
Thorp 117 23 68 16 23 13 2 9 6 93 10 13 8 401<br />
Unity 101 15 99 8 32 18 0 17 12 59 11 13 3 388<br />
Warner 80 8 73 3 19 14 0 6 5 47 10 0 9 274<br />
Washburn 29 8 39 10 16 9 5 5 4 24 4 3 2 158<br />
<strong>West</strong>on 76 25 78 6 35 2 3 0 14 65 8 12 16 340<br />
Withee 121 47 52 11 26 13 6 11 5 65 8 10 3 378<br />
Worden 76 24 65 13 23 13 4 14 1 40 16 12 0 301<br />
York 118 28 98 9 23 24 2 9 12 87 13 25 9 457<br />
Information<br />
Finance, insurance, real estate, rental, & leasing<br />
Professional, scientific, mgmt, administrative, and<br />
waste mgmt services<br />
Educational, health and social services<br />
Arts, entertainment, recreation, accommodation<br />
and food services<br />
Other Services (except public admin.)<br />
Public Administration<br />
Total<br />
50 Issues & Opportunities Information
Table 1.19 continued<br />
Employment By Industry – 2000 – Clark County Municipal Units<br />
Municipality<br />
Agriculture, forestry, fishing, hunting, &<br />
mining<br />
Construction<br />
Manufacturing<br />
Wholesale trade<br />
Retail trade<br />
Transportation, warehousing, & utilities<br />
Information<br />
Finance, insurance, real estate, rental, &<br />
leasing<br />
Professional, scientific, mgmt,<br />
administrative, and waste mgmt services<br />
Educational, health and social services<br />
Arts, entertainment, recreation,<br />
accommodation and food services<br />
Other Services (except public admin.)<br />
Public Administration<br />
Total<br />
Villages<br />
Curtiss 5 2 33 6 8 2 2 0 0 7 13 8 0 86<br />
Dorchester* 24 22 171 1 31 27 3 21 18 84 15 23 6 446<br />
Granton* 17 16 65 8 18 7 2 0 5 36 3 2 4 183<br />
Unity* 0 9 22 4 6 7 0 2 0 9 1 3 3 66<br />
Withee 5 29 33 6 19 13 4 15 9 44 14 15 3 209<br />
Cities<br />
Abbotsford* 9 24 179 35 81 33 14 48 31 154 26 28 25 687<br />
Colby* 8 23 171 28 63 22 3 30 10 131 43 22 5 559<br />
Greenwood 19 29 153 24 43 45 0 8 24 126 21 6 31 529<br />
Loyal 23 44 156 39 73 23 11 37 7 146 35 28 9 631<br />
Neillsville 7 48 304 4 113 48 17 40 34 339 102 74 53 1,183<br />
Owen 14 23 94 10 36 23 8 18 5 119 53 23 9 435<br />
Thorp 24 42 142 22 70 36 6 20 11 202 34 48 15 672<br />
Clark County<br />
2,561 942 3,856 508 1,403 726 149 492 425 3,078 760 595 374 15,869<br />
Source: U.S. Census<br />
*Portion of these communities located in Clark County only.<br />
Clark County Conditions and Trends Report 51
Table 1.20<br />
Employment By Industry – 1990 – Clark County Municipal Units<br />
Municipality<br />
Agriculture, forestry, fishing, hunting, & mining<br />
Construction<br />
Manufacturing<br />
Wholesale trade<br />
Retail trade<br />
Transportation, warehousing, & utilities<br />
Finance, insurance, real estate, rental, & leasing<br />
Professional, scientific, mgmt, administrative, &<br />
waste mgmt services<br />
Educational, health & social services<br />
Entertainment & Recreation Services<br />
Other Professional & Related Services<br />
Public Administration<br />
Total<br />
Towns<br />
Beaver 118 10 56 2 31 23 11 7 32 0 12 0 302<br />
Butler 12 0 10 0 8 3 0 0 7 0 0 0 40<br />
Colby 164 10 91 15 37 31 6 15 38 0 2 0 409<br />
Dewhurst 0 2 21 2 21 8 5 2 14 4 1 5 85<br />
Eaton 119 23 37 5 28 10 2 7 47 0 16 1 295<br />
Foster 2 5 7 0 5 2 0 2 0 0 0 0 23<br />
Fremont 126 29 111 10 59 9 11 17 78 0 16 5 471<br />
Grant 143 27 85 12 57 12 6 8 51 0 29 4 434<br />
Green Grove 115 13 43 6 28 22 2 14 35 0 12 2 292<br />
Hendren 75 13 20 11 13 11 2 10 39 0 12 7 213<br />
Hewett 12 2 27 2 20 8 0 14 38 3 7 12 145<br />
Hixon 105 8 47 10 39 29 5 12 59 2 2 0 318<br />
Hoard 83 14 60 10 24 9 6 11 18 0 0 0 235<br />
Levis 46 24 38 2 30 27 2 14 13 0 10 11 217<br />
Longwood 101 13 63 14 23 10 9 11 46 0 5 8 303<br />
Loyal 186 20 54 6 30 17 16 9 31 0 13 0 382<br />
Lynn 93 16 65 3 25 24 6 13 57 3 11 0 316<br />
Mayville 157 14 86 15 69 30 15 10 40 0 2 3 441<br />
Mead 35 6 20 2 9 2 0 2 9 0 3 8 96<br />
Mentor 51 6 49 2 23 10 15 6 29 3 10 4 208<br />
Pine Valley 69 24 80 14 68 27 33 29 74 5 36 18 477<br />
Reseburg 168 15 38 8 30 9 2 3 30 0 3 2 308<br />
Seif 10 3 16 0 7 5 0 3 14 0 9 3 70<br />
Sherman 111 20 63 7 40 11 2 14 36 0 6 0 310<br />
Sherwood 23 0 21 4 4 2 0 2 8 0 4 3 71<br />
Thorp 152 20 50 13 39 14 11 18 40 0 6 2 365<br />
Unity 136 16 76 9 58 15 11 6 50 0 9 5 391<br />
Warner 131 5 38 3 13 24 19 3 30 0 15 0 281<br />
Washburn 33 10 28 2 10 9 3 7 10 3 4 5 124<br />
<strong>West</strong>on 104 8 71 19 45 11 6 16 41 3 15 13 352<br />
Withee 125 12 63 5 26 13 8 10 38 2 7 2 311<br />
Worden 103 9 40 1 27 8 4 7 49 0 3 2 253<br />
York 157 10 79 15 56 22 2 21 43 0 18 4 427<br />
52 Issues & Opportunities Information
Table 1.20 continued<br />
Employment By Industry – 1990 – Clark County Municipal Units<br />
Municipality<br />
Agriculture, forestry, fishing, hunting, &<br />
mining<br />
Construction<br />
Manufacturing<br />
Wholesale trade<br />
Retail trade<br />
Transportation, warehousing, & utilities<br />
Finance, insurance, real estate, rental, &<br />
leasing<br />
Professional, scientific, mgmt,<br />
administrative, and waste mgmt services<br />
Educational, health and social services<br />
Arts, entertainment, recreation,<br />
accommodation and food services<br />
Other Services (except public admin.)<br />
Public Administration<br />
Total<br />
Villages<br />
Curtiss 2 4 15 2 17 7 0 4 6 0 5 0 62<br />
Dorchester* 19 18 126 13 29 23 10 21 39 5 21 2 326<br />
Granton* 2 8 34 2 23 5 8 11 40 0 5 6 144<br />
Unity* 7 4 26 5 19 9 2 2 14 0 2 0 90<br />
Withee 4 15 45 7 42 15 14 4 27 3 18 5 199<br />
Cities<br />
Abbotsford* 16 31 184 28 163 29 39 34 113 9 31 14 691<br />
Colby* 13 6 149 13 86 25 20 9 118 4 29 5 477<br />
Greenwood 19 8 78 11 59 31 26 17 98 2 38 26 413<br />
Loyal 32 30 111 31 110 39 24 25 110 4 37 12 565<br />
Neillsville 26 63 127 4 195 38 31 47 327 6 87 86 1,037<br />
Owen 17 12 95 17 43 11 11 21 100 0 28 4 359<br />
Thorp 27 28 137 18 94 50 38 25 148 5 47 11 628<br />
Clark County<br />
3,249 634 2,780 380 1,882 749 443 543 2,284 66 646 300 13,956<br />
Source: U.S. Census<br />
*Portion of these communities located in Clark County only.<br />
Clark County Conditions and Trends Report 53
Table 1.21<br />
Employment By Occupation – 2000 – Clark County Municipal Units<br />
Municipality<br />
Management, Professional & Related<br />
Service<br />
Sales & Office<br />
Farming, Forestry, Fishing<br />
Construction, Extraction, & Maintenance<br />
Production, Transportation, & Material Moving<br />
Total<br />
Towns<br />
Beaver 153 31 49 26 47 89 395<br />
Butler 4 0 6 0 6 11 27<br />
Colby 140 68 61 33 32 125 459<br />
Dewhurst 27 26 32 0 21 36 142<br />
Eaton 103 49 53 29 46 81 361<br />
Foster 9 8 15 0 3 12 47<br />
Fremont 172 62 89 52 77 132 584<br />
Grant 105 58 66 14 42 144 429<br />
Green Grove 102 32 65 25 25 89 338<br />
Hendren 86 43 43 10 15 52 249<br />
Hewett 46 26 34 10 11 52 179<br />
Hixon 79 39 49 7 33 99 306<br />
Hoard 98 27 19 10 24 83 261<br />
Levis 55 47 36 7 31 61 237<br />
Longwood 99 31 48 14 29 73 294<br />
Loyal 132 32 60 39 37 73 373<br />
Lynn 131 48 43 17 22 63 324<br />
Mayville 131 70 99 28 37 102 467<br />
Mead 40 24 21 10 10 47 152<br />
Mentor 75 40 34 11 30 94 284<br />
Pine Valley 101 101 129 13 63 169 576<br />
Reseburg 145 44 26 45 33 77 370<br />
Seif 68 18 0 4 0 32 122<br />
Sherman 150 41 65 33 34 84 407<br />
Sherwood 31 12 11 11 12 26 103<br />
Thorp 151 48 59 30 29 84 401<br />
Unity 133 37 53 23 40 102 388<br />
Warner 80 34 39 27 22 72 274<br />
Washburn 31 18 31 12 13 53 158<br />
<strong>West</strong>on 103 53 55 24 31 74 340<br />
Withee 142 54 46 20 45 71 378<br />
Worden 91 36 43 21 48 62 301<br />
York 127 61 86 25 54 104 457<br />
54 Issues & Opportunities Information
Table 1.21 continued<br />
Employment By Occupation – 2000 – Clark County Municipal Units<br />
Municipality<br />
Villages<br />
Management, Professional & Related<br />
Service<br />
Sales & Office<br />
Farming, Forestry, Fishing<br />
Construction, Extraction, & Maintenance<br />
Production, Transportation, & Material<br />
Moving<br />
Curtiss 9 22 8 3 5 39 86<br />
Dorchester* 96 56 76 18 43 157 446<br />
Granton* 25 18 33 14 20 73 183<br />
Unity* 11 5 9 0 19 22 66<br />
Withee 39 51 39 0 26 54 209<br />
Cities<br />
Abbotsford* 185 95 145 4 46 212 687<br />
Colby* 117 86 124 10 48 174 559<br />
Greenwood 114 92 92 10 69 152 529<br />
Loyal 131 105 148 5 74 168 631<br />
Neillsville 360 231 214 2 104 272 1,183<br />
Owen 94 123 71 6 43 98 435<br />
Thorp 171 114 127 17 64 179 672<br />
Total<br />
Clark County<br />
4,463 2,318 2,657 726 1,574 4,131 15,869<br />
source: U.S. Census<br />
*Portion of these communities located in Clark County only.<br />
Clark County Conditions and Trends Report 55
Table 1.22<br />
Employment By Occupation – 1990 – Clark County Municipal Units<br />
Municipality<br />
Exucutive, Administrative, & Managerial<br />
Professional<br />
Technician<br />
Sales<br />
Administrative support & Clerical<br />
Service<br />
Farming, Forestry, Fishing<br />
Production, Transportation, & Material<br />
Moving<br />
Total<br />
Towns<br />
Beaver 10 16 5 17 23 26 118 87 302<br />
Butler 0 2 0 4 4 5 12 13 40<br />
Colby 18 15 2 22 27 34 156 135 409<br />
Dewhurst 7 6 2 10 9 18 2 31 85<br />
Eaton 20 16 12 14 35 27 95 76 295<br />
Foster 4 3 0 0 0 7 2 7 23<br />
Fremont 22 19 26 25 60 43 127 149 471<br />
Grant 24 26 9 28 35 43 144 125 434<br />
Green Grove 10 14 4 11 29 31 115 78 292<br />
Hendren 17 15 3 9 17 26 75 51 213<br />
Hewett 13 21 4 12 24 26 7 38 145<br />
Hixon 22 27 8 14 16 48 89 94 318<br />
Hoard 4 16 0 16 12 21 83 83 235<br />
Levis 7 12 0 10 18 38 42 90 217<br />
Longwood 17 24 4 19 22 33 99 85 303<br />
Loyal 10 18 2 30 33 30 172 87 382<br />
Lynn 12 25 14 13 31 37 91 93 316<br />
Mayville 13 22 2 20 33 59 150 142 441<br />
Mead 13 10 5 3 4 5 35 21 96<br />
Mentor 11 14 6 8 24 31 49 65 208<br />
Pine Valley 41 48 14 37 59 74 64 140 477<br />
Reseburg 4 15 0 10 8 37 165 69 308<br />
Seif 12 2 4 2 2 13 13 22 70<br />
Sherman 9 15 4 25 25 32 109 91 310<br />
Sherwood 4 4 4 0 7 7 22 23 71<br />
Thorp 10 9 16 9 29 36 150 106 365<br />
Unity 10 20 8 19 43 34 133 124 391<br />
Warner 7 26 4 18 10 22 129 65 281<br />
Washburn 2 7 2 7 16 16 31 43 124<br />
<strong>West</strong>on 13 17 7 28 58 34 95 100 352<br />
Withee 16 18 6 12 22 31 121 85 311<br />
Worden 11 19 2 12 12 41 105 51 253<br />
York 6 30 3 26 53 47 158 104 427<br />
56 Issues & Opportunities Information
Table 1.22 continued<br />
Employment By Occupation – 1990 – Clark County Municipal Units<br />
Municipality<br />
Exucutive, Administrative, & Managerial<br />
Professional<br />
Technician<br />
Sales<br />
Administrative support & Clerical<br />
Service<br />
Farming, Forestry, Fishing<br />
Production, Transportation, & Material<br />
Moving<br />
Total<br />
Villages<br />
Curtiss 2 4 0 2 2 17 2 33 62<br />
Dorchester* 31 27 3 13 24 44 17 167 326<br />
Granton* 11 10 2 7 21 32 0 61 144<br />
Unity* 6 11 4 14 53 31 4 76 199<br />
Withee 4 3 0 5 13 16 7 42 90<br />
Cities<br />
Abbotsford* 49 71 10 82 109 100 8 262 691<br />
Colby* 24 66 11 45 68 71 9 183 477<br />
Greenwood 41 78 6 29 43 66 15 135 413<br />
Loyal 52 72 7 46 77 70 19 222 565<br />
Neillsville 79 279 16 82 140 152 22 267 1,037<br />
Owen 40 41 16 21 43 63 14 121 359<br />
Thorp 70 81 17 41 83 119 23 194 628<br />
Clark County<br />
808 1,294 274 877 1,476 1,793 3,098 4,336 13,956<br />
source: U.S. Census<br />
*Portion of these communities located in Clark County only.<br />
Clark County Conditions and Trends Report 57
Table 1.23<br />
Travel Time to Work – 1990 and 2000 – Clark County<br />
1990 2000<br />
Number Percent Number Percent<br />
Worked at home 2,632 19.0 2,150 13.7<br />
Less than 5 minutes 1,455 10.5 1,574 10.0<br />
5 to 9 minutes 2,491 18.0 2,482 15.8<br />
10 to 19 minutes 3,333 24.1 3,799 24.2<br />
20 to 29 minutes 1,589 11.5 2,364 15.1<br />
30 to 44 minutes 1,377 10.0 1,935 12.3<br />
45 to 59 minutes 457 3.3 693 4.4<br />
60 minutes or longer 496 3.6 686 4.4<br />
TOTAL 13,830 100.0 15,683 100.0<br />
source: U.S. Census<br />
Table 1.24<br />
Place of Work – 2000 – Clark County Residents<br />
Number<br />
2000<br />
Percent<br />
within their own community 5,288 33.7<br />
within Clark County, but<br />
outside their own community 5,155 32.9<br />
Clark County 10,443 66.6<br />
Chippewa County 335 2.1<br />
Eau Claire County 221 1.4<br />
Jackson County 302 1.9<br />
Marathon County 1,407 9.0<br />
Taylor County 600 3.8<br />
Wood County 1,956 12.5<br />
Elsewhere 419 2.7<br />
TOTAL 15,683 100.0<br />
source: U.S. Census<br />
58 Issues & Opportunities Information
Table 1.25<br />
Households by Household Income – 1989 and 1999 – Clark County<br />
Household<br />
Income<br />
Number of<br />
Households<br />
1989 1999<br />
% of Total<br />
Households<br />
Number of<br />
Households<br />
% of Total<br />
Households<br />
Number<br />
Change<br />
Percent<br />
Change<br />
Less than $10,000 2,225 19.8 1,222 10.1 -1,003 -45.1<br />
$10,000 to $14,999 1,399 12.5 998 8.2 -401 -28.7<br />
$15,000 to $24,999 2,660 23.7 1,990 16.4 -670 -25.2<br />
$25,000 to $34,999 2,080 18.5 1,917 15.8 -163 -7.8<br />
$35,000 to $49,999 1,682 15.0 2,377 19.6 695 41.3<br />
$50,000 to $74,999 766 6.8 2,409 19.9 1,643 214.5<br />
$75,000 or greater 405 3.6 1,196 9.9 791 195.3<br />
TOTAL 11,217 100 12,109 100 892 8.0<br />
source: U.S. Census<br />
Table 1.26<br />
Median Household Income – 1989 and 1999 – Clark and Surrounding Counties<br />
Change<br />
County 1989 1999 Number Percent<br />
Clark County 22,177 34,577 12,400 55.9<br />
Chippewa County 25,858 39,596 13,738 53.1<br />
Eau Claire County 25,886 39,219 13,333 51.5<br />
Jackson County 21,409 37,015 15,606 72.9<br />
Marathon County 30,143 45,165 15,022 49.8<br />
Taylor County 24,304 38,502 14,198 58.4<br />
Wood County 29,735 41,595 11,860 39.9<br />
source: U.S. Census<br />
Clark County Conditions and Trends Report 59
Table 1.27<br />
Median Household Income – 1989 and 1999 – Clark County<br />
Dollars<br />
Towns<br />
Change<br />
1989 1999 Dollars Percent<br />
Beaver 23,636 41,458 17,822 75.4<br />
Butler 16,964 21,250 4,286 25.3<br />
Colby 25,000 41,310 16,310 65.2<br />
Dewhurst 15,000 31,250 16,250 108.3<br />
Eaton 25,625 37,000 11,375 44.4<br />
Foster 19,444 28,750 9,306 47.9<br />
Fremont 26,346 35,167 8,821 33.5<br />
Grant 23,125 36,518 13,393 57.9<br />
Green Grove 20,167 37,667 17,500 86.8<br />
Hendren 18,750 27,353 8,603 45.9<br />
Hewett 22,045 46,111 24,066 109.2<br />
Hixon 21,750 36,375 14,625 67.2<br />
Hoard 22,167 35,250 13,083 59.0<br />
Levis 20,234 30,521 10,287 50.8<br />
Longwood 23,068 30,000 6,932 30.1<br />
Loyal 31,406 45,417 14,011 44.6<br />
Lynn 26,618 32,396 5,778 21.7<br />
Mayville 24,125 42,813 18,688 77.5<br />
Mead 19,375 31,875 12,500 64.5<br />
Mentor 18,594 36,125 17,531 94.3<br />
Pine Valley 28,571 37,813 9,242 32.3<br />
Reseburg 22,813 34,750 11,937 52.3<br />
Seif 21,875 28,333 6,458 29.5<br />
Sherman 23,958 42,344 18,386 76.7<br />
Sherwood 15,714 36,250 20,536 130.7<br />
Thorp 24,250 39,063 14,813 61.1<br />
Unity 26,125 41,154 15,029 57.5<br />
Warner 27,917 37,273 9,356 33.5<br />
Washburn 20,833 36,250 15,417 74.0<br />
<strong>West</strong>on 25,234 40,833 15,599 61.8<br />
Withee 18,207 29,625 11,418 62.7<br />
Worden 24,615 37,321 12,706 51.6<br />
York 25,750 38,500 12,750 49.5<br />
Villages<br />
Curtiss 19,063 29,250 10,187 53.4<br />
Dorchester* 23,088 34,583 11,495 49.8<br />
Granton* 18,661 30,288 11,627 62.3<br />
Unity* 18,875 31,964 13,089 69.3<br />
Withee 15,759 33,839 18,080 114.7<br />
Cities<br />
Abbotsford* 24,706 37,744 13,038 52.8<br />
Colby* 23,261 34,853 11,592 49.8<br />
Greenwood 21,202 32,917 11,715 55.3<br />
Loyal 21,638 30,647 9,009 41.6<br />
Neillsville 20,743 29,969 9,226 44.5<br />
Owen 17,386 27,368 9,982 57.4<br />
Stanley* 24,706 37,744 13,038 52.8<br />
Thorp 17,896 29,102 11,206 62.6<br />
Clark County 22,177 34,577 12,400 55.9<br />
State of <strong>Wisconsin</strong> 29,442 43,791 14,349 48.7<br />
source: U.S. Census.<br />
*Portions of these communities located in Clark County only.<br />
60 Issues & Opportunities Information
2. HOUSING INFORMATION<br />
Element Context<br />
This section contains an inventory and analysis of housing characteristics in Clark<br />
County. Quality housing is an essential component to healthy and vibrant communities,<br />
and striving to provide safe and cost-effective housing is an important community<br />
development goal. An analysis of housing conditions will help Clark County municipal<br />
units gain a better understanding of the changes that have occurred over the past 20 to 25<br />
years. It will also provide insight into future changes that can be anticipated. This<br />
information will create a foundation upon which decisions regarding future housing<br />
development can be based.<br />
In its 2000 Consolidated Plan, the State of <strong>Wisconsin</strong> lists the following as housing<br />
priorities that serve as guiding principles for the housing component of local<br />
comprehensive plans:<br />
<br />
<br />
<br />
<br />
<br />
<br />
<br />
Provide affordable housing to all consumers, especially those with severe cost<br />
burdens.<br />
Maintain an adequate production of new units, including the provision of large family<br />
and elderly housing.<br />
Preserve and increase the availability of safe, sanitary housing for low and moderateincome<br />
owners and renters.<br />
Make lead-based paint hazard reduction training and resources available.<br />
Provide housing assistance for special needs groups, including the homeless.<br />
Continue to ensure fairness and accessibility for all housing consumers.<br />
Continue to assist with housing disaster relief.<br />
These are items that local units of government should take into consideration as they<br />
develop housing goals and policies for their individual comprehensive plans.<br />
The information contained herein differentiates between the dwelling unit used for a<br />
home and the people that occupy the home. A household refers to the people living in any<br />
particular housing unit such as a single-family home. The U.S. Census indicates that a<br />
household includes all the persons who occupy a housing unit. A housing unit is a house,<br />
an apartment, a mobile home, a group of rooms, or a single room that is occupied (or if<br />
vacant, is intended for occupancy) as separate living quarters. Separate living quarters are<br />
those in which the occupants live and eat separately from any other persons in the<br />
building and that have direct access from the outside of the building or through a<br />
common hall. The occupants may be a single family, one person living alone, two or<br />
more families living together, or any other group of related or unrelated persons who<br />
share living arrangements. (People not living in households are classified as living in<br />
group quarters.)<br />
Clark County Conditions and Trends Report 61
Seasonal Units<br />
Seasonal units are used or intended for use only in certain seasons (e.g., beach cottages<br />
and hunting cabins) or for weekend or occasional use throughout the year. Seasonal units<br />
may also include quarters used for seasonal workers such as loggers. They typically<br />
demand less of public services than housing units that are occupied throughout the year.<br />
Clark County contained 833 seasonal units in 2000 as shown in Table 2.1.<br />
The majority of the seasonal housing in Clark County (97 percent) is located in the<br />
County’s towns. Seasonal units comprise a significant amount of the housing stock in<br />
some areas of the County. Areas with a large percentage of seasonal units include the<br />
following:<br />
Town of Foster 62 percent Town of Dewhurst 40 percent<br />
Town of Mead 48 percent Town of Sherwood 38 percent<br />
Occupancy and Structural Characteristics<br />
Table 2.2 displays the number of units per structure for Clark County for 2000. The<br />
majority of the housing units (90 percent) are one-unit detached structures, commonly<br />
referred to as single-family homes. Detached housing units are one-unit structures<br />
detached from any other house, with open space on four sides. Structures are considered<br />
detached even if they have an attached garage or contain a business unit. Attached<br />
housing units are one-unit structures that have one or more walls extending from ground<br />
to roof separating them from adjoining structures. Detailed housing occupancy and tenure<br />
data for individual municipalities is found at the end of this section in Table 2.2.<br />
Housing Affordability<br />
The U.S. Department of Housing and Urban Development (HUD) defines affordable<br />
housing as housing that does not cost a household more than 30 percent of its household<br />
income. This affordability benchmark is not an underwriting standard; it does not address<br />
the ability to pay for housing. Households may choose to pay more to get the housing<br />
they need or want; however, according to HUD standards, people should have the choice<br />
of having decent and safe housing for no more than 30 percent of their household income.<br />
As shown in Table 2.3, the majority of rental households in Clark County (44 percent)<br />
pay between $300 and $499 for rental costs. A little less than a third of renters pay<br />
slightly more, between $500 and $749.<br />
As shown in Table 2.4, a majority (46 percent) of owner-occupied households in Clark<br />
County pay less than 15 percent of their household income towards housing costs. A<br />
majority (26%) of rental households also pay less than 15% of their income for housing<br />
costs. However, 15% of owner occupied households, and 24% of rental households, are<br />
contributing more than 30% of their incomes towards housing costs.<br />
62 Housing Information
Housing Unit and Household Projections<br />
Housing projections are helpful to estimate the amount of land that may be consumed by<br />
future housing development. As the number of households and housing units in a <strong>county</strong><br />
continues to grow, there is a resulting need for local units of government to provide<br />
additional public facilities and services such as roads, sewer and water extensions, fire<br />
and police protection, schools, etc. It may also create a need to develop and enforce<br />
additional regulations and ordinances. These are important planning issues for<br />
consideration.<br />
The housing unit projections used for this plan are intended to provide an estimate of<br />
housing units that will be developed through the year 2030 based on observed changes in<br />
population and housing preferences. Household projections characterize changes in<br />
housing preferences and habitation patterns. The projections are based on several<br />
assumptions that create limitations that should be remembered when reviewing and<br />
evaluating the projections. The assumptions include the following:<br />
<br />
<br />
<br />
<br />
The population projections developed as part of this plan are reasonable and will<br />
continue to be reasonable during the planning period (see Table 1.10).<br />
The persons per housing unit will remain constant during the planning period.<br />
The vacancy rate will remain constant during the planning period.<br />
Past trends regarding seasonal housing, as previously described, will continue in the<br />
future.<br />
Based on the housing projections shown in Table 2.6, it is estimated that Clark County<br />
will have 16,666 housing units by the year 2030. This is an increase of 3,135 housing<br />
units, or 23 percent, from the 2000 census. It is projected that housing units will average<br />
an annual increase of approximately 105 housing units per year during the 30-year<br />
period. Some of the new housing will be clustered in those areas that have traditionally<br />
had a higher percentage of seasonal homes and there remains available land.<br />
The <strong>Wisconsin</strong> Department of Administration Demographic Services office has prepared<br />
household projections for year 2000 to 2030 in five-year increments that are found in<br />
Table 1.11. A household forecast is used to help develop housing and land-use forecasts.<br />
The persons-per-household figure is obtained by dividing the number of persons in<br />
households by the number of households (or householders). In Table 1.11, households<br />
with individuals under 18 years include both families with related children and all other<br />
households in which a person under 18 is present.<br />
Housing Programs<br />
There are a number and variety of housing programs instituted in Clark County. These<br />
are listed in the Inventory of Existing Plans, Programs, & Land-Use Policies in <strong>West</strong><br />
<strong>Central</strong> <strong>Wisconsin</strong> report that will be distributed with the Clark County Conditions and<br />
Trends Report.<br />
Clark County Conditions and Trends Report 63
Summary<br />
<br />
<br />
<br />
<br />
<br />
Clark County contains a significant number of seasonal homes, 97 percent of which<br />
are located in the towns. Areas with a large number of seasonal homes include the<br />
towns of Foster, Mead, Dewhurst, and Sherwood.<br />
The majority of housing units in the County (90%) are one-unit detached structures,<br />
commonly referred to as single family homes.<br />
The majority of households in the County are not experiencing housing affordability<br />
problems. However, 15 percent of owner occupied households, and 24 percent of<br />
rental households, are contributing over 30 percent of their incomes towards housing<br />
costs. According to the U.S. Department of Housing and Urban Development, this<br />
would signify an unaffordable housing situation for these households.<br />
It is projected that by the year 2030 Clark County will contain 16,666 housing units.<br />
This represents an increase of 23 percent from 2000. This is an average of 105<br />
additional housing units per year for the period.<br />
There are a wide variety of programs and organizations are available to help Clark<br />
County communities ensure they have an adequate supply of housing to meet a<br />
diverse array of current and future demands.<br />
64 Housing Information
Data Tables and Map<br />
Table 2.1<br />
Seasonal Units – 2000 – Clark County Municipalities<br />
Seasonal Housing Units<br />
Municipality Total Housing Units Units % of Total<br />
Towns<br />
Town of Beaver 249 4 1.6<br />
Town of Butler 49 14 28.6<br />
Town of Colby 281 0 0<br />
Town of Dewhurst 267 107 40.1<br />
Town of Eaton 221 3 1.4<br />
Town of Foster 145 90 62.1<br />
Town of Fremont 393 5 1.3<br />
Town of Grant 361 17 4.7<br />
Town of Green Grove 236 4 1.7<br />
Town of Hendren 247 33 13.4<br />
Town of Hewett 200 68 34.0<br />
Town of Hixon 252 3 1.2<br />
Town of Hoard 182 5 2.7<br />
Town of Levis 233 29 12.4<br />
Town of Longwood 241 3 1.2<br />
Town of Loyal 225 1 0.4<br />
Town of Lynn 292 33 11.3<br />
Town of Mayville 301 2 0.7<br />
Town of Mead 239 115 48.1<br />
Town of Mentor 286 54 18.9<br />
Town of Pine Valley 464 14 3.0<br />
Town of Reseburg 221 7 3.2<br />
Town of Seif 122 24 19.7<br />
Town of Sherman 263 1 0.4<br />
Town of Sherwood 152 58 38.2<br />
Town of Thorp 255 3 1.2<br />
Town of Unity 253 5 2.0<br />
Town of Warner 208 7 3.4<br />
Town of Washburn 189 61 32.3<br />
Town of <strong>West</strong>on 267 23 8.6<br />
Town of Withee 277 3 1.1<br />
Town of Worden 210 5 2.4<br />
Town of York 279 3 1.1<br />
Villages<br />
Village of Curtiss 70 0 0<br />
Village of Dorchester* 359 4 1.1<br />
Village of Granton 164 0 0<br />
Village of Unity* 62 0 0<br />
Village of Withee 228 1 0.4<br />
Cities<br />
City of Abbotsford* 656 1 0.2<br />
City of Colby* 440 2 0.5<br />
City of Greenwood 502 4 0.8<br />
City of Loyal 576 1 0.2<br />
City of Neillsville 1,200 6 0.5<br />
City of Owen 455 5 1.1<br />
City of Stanley* 0 0 0<br />
City of Thorp 759 5 0.7<br />
CLARK COUNTY 13,531 833 6.2<br />
source: U.S. Census..<br />
*Portion of community located in Clark County only.<br />
Clark County Conditions and Trends Report 65
Table 2.2<br />
Units in Structure – 2000 – Clark County Municipalities<br />
Municipality<br />
1-Unit<br />
Detached<br />
1-Unit<br />
Attached 2 Units 3-4 Units<br />
5 or more<br />
Units<br />
Towns<br />
Town of Beaver 221 0 0 0 0<br />
Town of Butler 37 0 0 0 0<br />
Town of Colby 252 2 8 0 0<br />
Town of Dewhurst 220 2 2 0 0<br />
Town of Eaton 228 2 0 0 0<br />
Town of Foster 134 2 0 0 0<br />
Town of Fremont 320 6 6 0 0<br />
Town of Grant 288 0 8 0 0<br />
Town of Green Grove 217 3 3 0 0<br />
Town of Hendren 220 0 2 0 0<br />
Town of Hewett 145 0 0 0 0<br />
Town of Hixon 205 3 6 0 0<br />
Town of Hoard 174 0 0 0 0<br />
Town of Levis 176 2 0 0 7<br />
Town of Longwood 239 4 3 0 0<br />
Town of Loyal 199 0 6 0 0<br />
Town of Lynn 239 13 5 0 0<br />
Town of Mayville 259 0 0 2 4<br />
Town of Mead 219 0 0 0 0<br />
Town of Mentor 225 0 0 0 2<br />
Town of Pine Valley 397 2 4 4 0<br />
Town of Reseburg 214 0 0 0 0<br />
Town of Seif 113 0 0 0 0<br />
Town of Sherman 238 4 0 2 0<br />
Town of Sherwood 118 0 0 0 0<br />
Town of Thorp 221 2 0 0 0<br />
Town of Unity 223 2 2 0 0<br />
Town of Warner 179 0 0 0 0<br />
Town of Washburn 125 3 0 0 0<br />
Town of <strong>West</strong>on 221 0 0 0 0<br />
Town of Withee 259 2 0 0 0<br />
Town of Worden 182 0 0 0 0<br />
Town of York 250 3 0 0 0<br />
Villages<br />
Village of Curtiss 44 2 2 3 0<br />
Village of Dorchester* 238 6 37 10 31<br />
Village of Granton 121 0 7 0 11<br />
Village of Unity* 35 0 2 0 0<br />
Village of Withee 180 3 1 3 5<br />
Cities<br />
City of Abbotsford* 446 5 56 61 70<br />
City of Colby* 357 4 22 11 44<br />
City of Greenwood 369 9 15 10 61<br />
City of Loyal 436 12 37 10 41<br />
City of Neillsville 873 15 84 38 165<br />
City of Owen 332 6 15 5 71<br />
City of Stanley* 0 0 0 0 0<br />
City of Thorp 565 13 30 18 88<br />
CLARK COUNTY 10,953 132 363 177 600<br />
source: U.S. Census.<br />
*Portion of community located in Clark County only.<br />
66 Housing Information
Table 2.3<br />
Contract Rent (Renter-Occupied Units) – 2000 – Clark County Municipalities<br />
Municipality<br />
Less than<br />
$200<br />
$200 to<br />
$299<br />
$300 to<br />
$499<br />
Rents<br />
$500 to<br />
$749<br />
$750 to<br />
$999<br />
$1,000 or<br />
more<br />
Towns<br />
Town of Beaver 4 2 2 0 0 0<br />
Town of Butler 0 0 0 0 0 0<br />
Town of Colby 0 7 2 2 0 0<br />
Town of Dewhurst 2 0 4 2 2 0<br />
Town of Eaton 0 0 7 0 0 0<br />
Town of Foster 2 0 2 0 0 0<br />
Town of Fremont 2 13 15 0 0 0<br />
Town of Grant 2 7 12 0 0 0<br />
Town of Green Grove 0 5 3 0 0 0<br />
Town of Hendren 0 3 0 0 0 0<br />
Town of Hewett 3 4 0 0 0 0<br />
Town of Hixon 2 3 8 0 3 0<br />
Town of Hoard 0 0 2 0 0 0<br />
Town of Levis 0 12 7 0 0 0<br />
Town of Longwood 0 7 0 0 0 0<br />
Town of Loyal 4 1 4 2 0 0<br />
Town of Lynn 2 1 6 2 0 0<br />
Town of Mayville 2 5 8 0 0 0<br />
Town of Mead 0 0 0 0 0 0<br />
Town of Mentor 0 2 9 5 0 0<br />
Town of Pine Valley 6 8 11 0 0 0<br />
Town of Reseburg 0 0 2 2 0 0<br />
Town of Seif 0 0 2 0 0 0<br />
Town of Sherman 2 1 1 0 0 0<br />
Town of Sherwood 0 0 0 0 0 0<br />
Town of Thorp 2 1 2 0 0 0<br />
Town of Unity 0 2 6 2 0 0<br />
Town of Warner 2 0 4 0 0 0<br />
Town of Washburn 0 0 5 0 0 0<br />
Town of <strong>West</strong>on 8 3 8 0 0 0<br />
Town of Withee 7 2 5 0 0 0<br />
Town of Worden 1 2 0 0 0 0<br />
Town of York 0 2 4 0 0 0<br />
Villages<br />
Village of Curtiss 0 4 3 0 0 0<br />
Village of Dorchester* 16 22 46 4 0 0<br />
Village of Granton 10 9 20 0 0 0<br />
Village of Unity* 0 6 2 0 0 0<br />
Village of Withee 4 12 8 0 0 0<br />
Cities<br />
City of Abbotsford* 49 35 82 23 0 0<br />
City of Colby* 38 11 38 5 0 0<br />
City of Greenwood 29 31 68 2 0 0<br />
City of Loyal 31 56 32 0 0 0<br />
City of Neillsville 86 110 155 4 0 0<br />
City of Owen 37 37 41 3 0 0<br />
City of Stanley* 0 0 0 0 0 0<br />
City of Thorp 45 30 88 6 5 0<br />
CLARK COUNTY 398 456 724 64 10 0<br />
source: U.S. Census.<br />
*Portion of community located in Clark County only.<br />
Clark County Conditions and Trends Report 67
Table 2.4<br />
Owner-Occupied Housing Costs as a Percentage of Household Income – 1999<br />
Clark County Municipalities<br />
Monthly Housing Costs as a Percentage of Household Income<br />
Municipality<br />
Less<br />
than 15%<br />
15.0% to<br />
19.9%<br />
20.0% to<br />
24.9%<br />
25.0% to<br />
29.9%<br />
30.0% to<br />
34.9%<br />
35.0%<br />
or more<br />
Total Units**<br />
Towns<br />
Town of Beaver 48 14 6 4 2 8 82<br />
Town of Butler 0 4 2 0 2 0 8<br />
Town of Colby 51 21 9 18 2 8 109<br />
Town of Dewhurst 21 25 8 10 4 25 96<br />
Town of Eaton 37 15 13 8 2 4 79<br />
Town of Foster 7 2 6 6 2 10 33<br />
Town of Fremont 64 34 17 12 11 7 147<br />
Town of Grant 53 28 4 4 3 3 95<br />
Town of Green Grove 26 5 11 5 4 6 57<br />
Town of Hendren 29 13 6 9 2 6 67<br />
Town of Hewett 24 6 10 3 0 2 45<br />
Town of Hixon 39 11 2 8 0 10 70<br />
Town of Hoard 37 6 9 0 6 9 67<br />
Town of Levis 14 12 2 2 2 12 44<br />
Town of Longwood 37 13 6 3 0 10 69<br />
Town of Loyal 46 21 11 4 4 2 92<br />
Town of Lynn 33 14 10 4 2 7 76<br />
Town of Mayville 59 23 13 13 2 7 117<br />
Town of Mead 22 11 2 1 0 4 40<br />
Town of Mentor 53 24 6 9 2 7 101<br />
Town of Pine Valley 99 18 18 12 11 11 169<br />
Town of Reseburg 18 6 7 11 0 8 50<br />
Town of Seif 5 6 4 0 2 2 19<br />
Town of Sherman 47 23 6 12 2 15 105<br />
Town of Sherwood 4 0 3 0 2 0 9<br />
Town of Thorp 36 17 4 4 0 7 68<br />
Town of Unity 38 19 20 2 0 16 97<br />
Town of Warner 25 9 4 2 4 4 48<br />
Town of Washburn 20 4 1 0 0 3 28<br />
Town of <strong>West</strong>on 26 14 15 4 2 9 70<br />
Town of Withee 47 14 15 4 0 18 98<br />
Town of Worden 20 15 4 14 2 11 66<br />
Town of York 41 18 15 12 5 13 104<br />
Villages<br />
Village of Curtiss 22 5 4 2 0 5 38<br />
Village of Dorchester* 88 28 42 17 9 19 205<br />
Village of Granton 36 27 8 5 8 9 95<br />
Village of Unity* 18 3 5 2 0 1 29<br />
Village of Withee 97 19 16 8 3 9 152<br />
Cities<br />
City of Abbotsford* 186 58 43 39 14 24 364<br />
City of Colby* 113 56 46 30 17 40 302<br />
City of Greenwood 131 38 36 39 16 23 283<br />
City of Loyal 156 63 45 35 18 54 373<br />
City of Neillsville 284 134 98 65 21 98 700<br />
City of Owen 115 51 27 15 8 22 244<br />
City of Stanley* 0 0 0 0 0 0 0<br />
City of Thorp 192 89 53 21 20 61 442<br />
CLARK COUNTY 2,564 1,036 692 478 216 629 5,652<br />
source: U.S. Census<br />
*Portion of community located in Clark County only.<br />
** Monthly costs not available for all units in the County.<br />
68 Housing Information
Table 2.5<br />
Renter-Occupied Housing Costs as a Percentage of Household Income – 1999<br />
Clark County Municipalities<br />
Monthly Housing Costs as a Percentage of Household Income<br />
Municipality<br />
Less<br />
than 15%<br />
15.0% to<br />
19.9%<br />
20.0% to<br />
24.9%<br />
25.0% to<br />
29.9%<br />
30.0% to<br />
34.9%<br />
35.0%<br />
or more<br />
Total Units**<br />
Towns<br />
Town of Beaver 2 2 0 0 2 2 12<br />
Town of Butler 0 0 0 0 0 0 2<br />
Town of Colby 6 5 0 0 0 0 23<br />
Town of Dewhurst 6 2 0 0 2 0 19<br />
Town of Eaton 0 1 3 0 0 3 12<br />
Town of Foster 2 0 2 0 0 0 4<br />
Town of Fremont 13 4 8 2 3 0 39<br />
Town of Grant 13 2 0 3 1 2 26<br />
Town of Green Grove 5 0 0 3 0 0 14<br />
Town of Hendren 3 0 0 0 0 0 9<br />
Town of Hewett 2 2 3 0 0 0 7<br />
Town of Hixon 5 6 2 0 0 3 20<br />
Town of Hoard 0 2 0 0 0 0 2<br />
Town of Levis 7 6 0 3 0 3 23<br />
Town of Longwood 5 0 0 2 0 0 10<br />
Town of Loyal 9 0 2 0 0 0 25<br />
Town of Lynn 2 0 1 4 0 4 11<br />
Town of Mayville 7 4 0 0 0 4 21<br />
Town of Mead 0 0 0 0 0 0 6<br />
Town of Mentor 3 0 7 0 0 4 19<br />
Town of Pine Valley 4 8 2 3 0 8 30<br />
Town of Reseburg 2 0 0 0 0 2 4<br />
Town of Seif 0 0 0 0 2 0 4<br />
Town of Sherman 3 1 0 0 0 0 18<br />
Town of Sherwood 0 0 0 0 0 0 3<br />
Town of Thorp 4 1 0 0 0 0 5<br />
Town of Unity 6 4 0 0 0 0 12<br />
Town of Warner 2 0 0 0 2 2 8<br />
Town of Washburn 2 3 0 0 0 0 7<br />
Town of <strong>West</strong>on 8 2 2 7 0 0 23<br />
Town of Withee 2 3 2 0 0 7 17<br />
Town of Worden 3 0 0 0 0 0 3<br />
Town of York 3 0 1 0 0 2 11<br />
Villages<br />
Village of Curtiss 0 1 0 2 0 4 7<br />
Village of Dorchester* 27 10 12 15 9 15 92<br />
Village of Granton 9 10 4 4 6 4 41<br />
Village of Unity* 0 2 4 2 0 0 0<br />
Village of Withee 8 8 0 0 0 8 27<br />
Cities<br />
City of Abbotsford* 30 28 25 39 21 44 200<br />
City of Colby* 11 32 14 17 4 12 99<br />
City of Greenwood 47 22 13 18 2 28 134<br />
City of Loyal 35 26 16 10 4 28 125<br />
City of Neillsville 69 88 51 66 22 55 383<br />
City of Owen 24 14 18 27 5 30 123<br />
City of Stanley* 0 0 0 0 0 0 8<br />
City of Thorp 34 44 20 29 12 30 191<br />
CLARK COUNTY 423 343 212 256 97 304 1,879<br />
source: U.S. Census.<br />
*Portion of community located in Clark County only.<br />
** Monthly costs not available for all units in the County.<br />
Clark County Conditions and Trends Report 69
Table 2.6<br />
Housing Unit Projections – 2000 to 2030 – Clark County Municipalities<br />
2000<br />
Projection<br />
2005<br />
Projection<br />
2010<br />
Projection<br />
2015<br />
Projection<br />
2020<br />
Projection<br />
2025<br />
Projection<br />
2030<br />
Towns<br />
Town of Beaver 249 263 281 302 323 347 372<br />
Town of Butler 49 49 49 51 51 52 54<br />
Town of Colby 281 283 294 307 322 338 354<br />
Town of Dewhurst 267 291 322 346 370 399 428<br />
Town of Eaton 221 222 230 236 245 255 265<br />
Town of Foster 145 148 154 157 162 168 180<br />
Town of Fremont 393 425 457 490 526 566 610<br />
Town of Grant 361 375 391 410 430 452 476<br />
Town of Green Grove 236 223 230 236 243 251 259<br />
Town of Hendren 247 242 243 243 244 248 251<br />
Town of Hewett 200 198 202 208 213 219 226<br />
Town of Hixon 252 261 272 283 297 311 326<br />
Town of Hoard 182 197 203 209 215 224 231<br />
Town of Levis 233 242 256 270 285 303 321<br />
Town of Longwood 241 245 255 264 276 288 302<br />
Town of Loyal 225 225 231 235 242 248 255<br />
Town of Lynn 292 290 306 322 342 363 385<br />
Town of Mayville 301 303 307 313 319 328 336<br />
Town of Mead 239 243 256 268 281 295 312<br />
Town of Mentor 286 292 304 316 330 345 363<br />
Town of Pine Valley 464 505 541 580 621 666 714<br />
Town of Reseburg 221 222 231 238 248 257 267<br />
Town of Seif 122 118 118 118 121 121 122<br />
Town of Sherman 263 286 293 312 332 355 378<br />
Town of Sherwood 152 162 174 189 203 216 233<br />
Town of Thorp 255 262 271 281 294 306 321<br />
Town of Unity 253 258 265 272 282 291 303<br />
Town of Warner 208 211 220 226 235 245 255<br />
Town of Washburn 189 186 187 192 197 202 207<br />
Town of <strong>West</strong>on 267 273 279 288 297 308 319<br />
Town of Withee 277 288 305 322 340 363 384<br />
Town of Worden 210 220 233 246 262 278 297<br />
Town of York 279 287 296 306 317 330 343<br />
Villages<br />
Village of Curtiss 70 74 79 85 93 99 106<br />
Village of Dorchester* 359 356 381 497 435 466 499<br />
Village of Granton 164 157 161 163 166 169 176<br />
Village of Unity* 62 66 66 66 66 68 68<br />
Village of Withee 228 224 229 232 238 245 252<br />
Cities<br />
City of Abbotsford* 656 638 645 654 665 679 692<br />
City of Colby* 440 472 500 528 557 592 627<br />
City of Greenwood 502 497 509 523 540 558 578<br />
City of Loyal 576 565 580 597 615 636 659<br />
City of Neillsville 1,200 1,173 1,179 1,193 1,202 1,221 1,246<br />
City of Owen 455 445 449 456 463 472 483<br />
City of Stanley* 0 2 2 2 2 2 2<br />
City of Thorp 759 761 770 782 794 812 829<br />
CLARK COUNTY 13,531 13,725 14,206 14,814 15,301 15,957 16,666<br />
source: U.S. Census.<br />
*Portion of community located in Clark County only.<br />
70 Housing Information
Table 2.7<br />
Housing Characteristics – 1980 to 2000<br />
Clark County Municipalities<br />
Municipal Unit 1980 1990 2000<br />
Town of Beaver 1980 1990 2000<br />
Total Housing Units 215 221 249<br />
Total Seasonal 0 4 4<br />
Total Vacant 14 18 11<br />
Total Occupied Units 201 203 238<br />
Owner Occupied Units 182 171 211<br />
Renter Occupied Units 19 32 27<br />
Single Family Units 197 199 221<br />
Multi-Family Units 6 0 0<br />
Mobile Homes 12 22 31<br />
Town of Butler 1980 1990 2000<br />
Total Housing Units 34 44 49<br />
Total Seasonal 0 8 14<br />
Total Vacant 0 12 17<br />
Total Occupied Units 34 32 32<br />
Owner Occupied Units 31 30 30<br />
Renter Occupied Units 3 2 2<br />
Single Family Units 34 34 37<br />
Multi-Family Units 0 0 0<br />
Mobile Homes 0 10 10<br />
Town of Colby 1980 1990 2000<br />
Total Housing Units 236 256 281<br />
Total Seasonal 0 0 0<br />
Total Vacant 10 10 5<br />
Total Occupied Units 226 246 276<br />
Owner Occupied Units 194 207 237<br />
Renter Occupied Units 32 39 39<br />
Single Family Units 217 223 254<br />
Multi-Family Units 9 11 8<br />
Mobile Homes 10 22 15<br />
Town of Dewhurst 1980 1990 2000<br />
Total Housing Units 242 317 267<br />
Total Seasonal 154 205 107<br />
Total Vacant 17 220 111<br />
Total Occupied Units 71 97 156<br />
Owner Occupied Units 66 83 134<br />
Renter Occupied Units 5 14 22<br />
Single Family Units 82 251 222<br />
Multi-Family Units 0 0 2<br />
Mobile Homes 4 66 13<br />
Note: In 1990 and 2000, total vacant units include seasonal units in Table 2.7.<br />
Clark County Conditions and Trends Report 71
Table 2.7 continued<br />
Housing Characteristics – 1980 to 2000<br />
Clark County Municipalities<br />
Municipal Unit 1980 1990 2000<br />
Town of Eaton 1980 1990 2000<br />
Total Housing Units 201 199 221<br />
Total Seasonal 0 2 3<br />
Total Vacant 10 12 20<br />
Total Occupied Units 191 187 201<br />
Owner Occupied Units 162 156 176<br />
Renter Occupied Units 29 31 25<br />
Single Family Units 181 183 230<br />
Multi-Family Units 4 0 0<br />
Mobile Homes 16 16 9<br />
Town of Foster 1980 1990 2000<br />
Total Housing Units 163 165 145<br />
Total Seasonal 102 126 90<br />
Total Vacant 13 126 95<br />
Total Occupied Units 48 39 50<br />
Owner Occupied Units 44 36 46<br />
Renter Occupied Units 4 3 4<br />
Single Family Units 52 132 136<br />
Multi-Family Units 7 2 0<br />
Mobile Homes 2 31 22<br />
Town of Fremont 1980 1990 2000<br />
Total Housing Units 320 339 393<br />
Total Seasonal 5 4 5<br />
Total Vacant 6 18 19<br />
Total Occupied Units 309 321 374<br />
Owner Occupied Units 263 273 323<br />
Renter Occupied Units 46 48 51<br />
Single Family Units 272 287 326<br />
Multi-Family Units 13 4 6<br />
Mobile Homes 30 48 59<br />
Town of Grant 1980 1990 2000<br />
Total Housing Units 330 329 361<br />
Total Seasonal 18 9 17<br />
Total Vacant 26 28 44<br />
Total Occupied Units 286 301 317<br />
Owner Occupied Units 237 253 281<br />
Renter Occupied Units 49 48 36<br />
Single Family Units 266 272 288<br />
Multi-Family Units 14 3 8<br />
Mobile Homes 32 54 73<br />
72 Housing Information
Table 2.7 continued<br />
Housing Characteristics – 1980 to 2000<br />
Clark County Municipalities<br />
Municipal Unit 1980 1990 2000<br />
Town of Green Grove 1980 1990 2000<br />
Total Housing Units 216 217 236<br />
Total Seasonal 0 4 4<br />
Total Vacant 21 12 11<br />
Total Occupied Units 195 205 225<br />
Owner Occupied Units 171 167 193<br />
Renter Occupied Units 24 38 32<br />
Single Family Units 198 192 220<br />
Multi-Family Units 3 0 3<br />
Mobile Homes 15 25 17<br />
Town of Hendren 1980 1990 2000<br />
Total Housing Units 217 232 247<br />
Total Seasonal 15 25 33<br />
Total Vacant 13 44 50<br />
Total Occupied Units 189 188 197<br />
Owner Occupied Units 175 171 179<br />
Renter Occupied Units 14 17 18<br />
Single Family Units 188 198 220<br />
Multi-Family Units 4 0 2<br />
Mobile Homes 10 34 39<br />
Town of Hewett 1980 1990 2000<br />
Total Housing Units 159 181 200<br />
Total Seasonal 8 62 68<br />
Total Vacant 47 69 75<br />
Total Occupied Units 104 112 125<br />
Owner Occupied Units 89 100 117<br />
Renter Occupied Units 15 12 8<br />
Single Family Units 121 141 145<br />
Multi-Family Units 4 0 0<br />
Mobile Homes 26 40 47<br />
Town of Hixon 1980 1990 2000<br />
Total Housing Units 271 249 252<br />
Total Seasonal 6 2 3<br />
Total Vacant 12 16 20<br />
Total Occupied Units 253 233 232<br />
Owner Occupied Units 219 196 199<br />
Renter Occupied Units 34 37 33<br />
Single Family Units 245 226 208<br />
Multi-Family Units 5 2 6<br />
Mobile Homes 15 21 32<br />
Clark County Conditions and Trends Report 73
Table 2.7 continued<br />
Housing Characteristics – 1980 to 2000<br />
Clark County Municipalities<br />
Municipal Unit 1980 1990 2000<br />
Town of Hoard 1980 1990 2000<br />
Total Housing Units 192 187 182<br />
Total Seasonal 0 3 5<br />
Total Vacant 18 13 12<br />
Total Occupied Units 174 174 170<br />
Owner Occupied Units 148 143 161<br />
Renter Occupied Units 26 31 9<br />
Single Family Units 175 165 174<br />
Multi-Family Units 2 0 0<br />
Mobile Homes 15 22 13<br />
Town of Levis 1980 1990 2000<br />
Total Housing Units 229 271 233<br />
Total Seasonal 4 82 29<br />
Total Vacant 83 101 42<br />
Total Occupied Units 142 170 191<br />
Owner Occupied Units 123 144 159<br />
Renter Occupied Units 19 26 32<br />
Single Family Units 176 175 178<br />
Multi-Family Units 10 8 7<br />
Mobile Homes 39 88 40<br />
Town of Longwood 1980 1990 2000<br />
Total Housing Units 234 244 241<br />
Total Seasonal 2 5 3<br />
Total Vacant 20 23 15<br />
Total Occupied Units 212 221 226<br />
Owner Occupied Units 186 186 200<br />
Renter Occupied Units 26 36 26<br />
Single Family Units 212 219 243<br />
Multi-Family Units 6 1 3<br />
Mobile Homes 14 24 6<br />
Town of Loyal 1980 1990 2000<br />
Total Housing Units 223 215 225<br />
Total Seasonal 0 0 1<br />
Total Vacant 8 14 10<br />
Total Occupied Units 215 201 215<br />
Owner Occupied Units 189 165 180<br />
Renter Occupied Units 26 36 35<br />
Single Family Units 213 187 199<br />
Multi-Family Units 0 4 6<br />
Mobile Homes 10 24 18<br />
74 Housing Information
Table 2.7 continued<br />
Housing Characteristics – 1980 to 2000<br />
Clark County Municipalities<br />
Municipal Unit 1980 1990 2000<br />
Town of Lynn 1980 1990 2000<br />
Total Housing Units 212 251 292<br />
Total Seasonal 22 28 33<br />
Total Vacant 5 41 41<br />
Total Occupied Units 185 210 251<br />
Owner Occupied Units 162 188 223<br />
Renter Occupied Units 23 22 28<br />
Single Family Units 173 211 252<br />
Multi-Family Units 3 4 5<br />
Mobile Homes 14 36 26<br />
Town of Mayville 1980 1990 2000<br />
Total Housing Units 284 295 301<br />
Total Seasonal 0 0 2<br />
Total Vacant 13 5 6<br />
Total Occupied Units 271 290 295<br />
Owner Occupied Units 227 240 260<br />
Renter Occupied Units 44 50 35<br />
Single Family Units 251 251 259<br />
Multi-Family Units 12 11 6<br />
Mobile Homes 21 33 27<br />
Town of Mead 1980 1990 2000<br />
Total Housing Units 238 237 239<br />
Total Seasonal 4 134 115<br />
Total Vacant 130 141 124<br />
Total Occupied Units 104 96 115<br />
Owner Occupied Units 94 85 100<br />
Renter Occupied Units 10 11 15<br />
Single Family Units 219 199 219<br />
Multi-Family Units 0 0 0<br />
Mobile Homes 15 38 13<br />
Town of Mentor 1980 1990 2000<br />
Total Housing Units 239 252 286<br />
Total Seasonal 6 42 54<br />
Total Vacant 20 59 63<br />
Total Occupied Units 213 193 223<br />
Owner Occupied Units 164 162 190<br />
Renter Occupied Units 49 31 33<br />
Single Family Units 202 204 225<br />
Multi-Family Units 9 5 2<br />
Mobile Homes 22 43 55<br />
Clark County Conditions and Trends Report 75
Table 2.7 continued<br />
Housing Characteristics – 1980 to 2000<br />
Clark County Municipalities<br />
Municipal Unit 1980 1990 2000<br />
Town of Pine Valley 1980 1990 2000<br />
Total Housing Units 393 435 464<br />
Total Seasonal 0 29 14<br />
Total Vacant 32 63 43<br />
Total Occupied Units 361 372 421<br />
Owner Occupied Units 212 333 381<br />
Renter Occupied Units 49 39 40<br />
Single Family Units 322 350 399<br />
Multi-Family Units 20 8 8<br />
Mobile Homes 51 77 62<br />
Town of Reseburg 1980 1990 2000<br />
Total Housing Units 227 220 221<br />
Total Seasonal 0 2 7<br />
Total Vacant 15 15 15<br />
Total Occupied Units 212 205 206<br />
Owner Occupied Units 191 170 184<br />
Renter Occupied Units 21 35 22<br />
Single Family Units 211 200 214<br />
Multi-Family Units 10 0 0<br />
Mobile Homes 6 20 16<br />
Town of Seif 1980 1990 2000<br />
Total Housing Units 98 93 122<br />
Total Seasonal 0 14 24<br />
Total Vacant 11 22 33<br />
Total Occupied Units 87 71 89<br />
Owner Occupied Units 75 59 79<br />
Renter Occupied Units 12 12 10<br />
Single Family Units 91 83 113<br />
Multi-Family Units 4 1 0<br />
Mobile Homes 3 9 21<br />
Town of Sherman 1980 1990 2000<br />
Total Housing Units 217 224 263<br />
Total Seasonal 2 1 1<br />
Total Vacant 8 15 16<br />
Total Occupied Units 207 209 247<br />
Owner Occupied Units 183 186 216<br />
Renter Occupied Units 24 23 31<br />
Single Family Units 185 193 242<br />
Multi-Family Units 6 2 2<br />
Mobile Homes 24 29 20<br />
76 Housing Information
Table 2.7 continued<br />
Housing Characteristics – 1980 to 2000<br />
Clark County Municipalities<br />
Municipal Unit 1980 1990 2000<br />
Town of Sherwood 1980 1990 2000<br />
Total Housing Units 103 142 152<br />
Total Seasonal 41 63 58<br />
Total Vacant 9 71 62<br />
Total Occupied Units 53 71 90<br />
Owner Occupied Units 45 63 87<br />
Renter Occupied Units 8 8 3<br />
Single Family Units 56 102 118<br />
Multi-Family Units 6 0 0<br />
Mobile Homes 0 40 34<br />
Town of Thorp 1980 1990 2000<br />
Total Housing Units 246 250 255<br />
Total Seasonal 0 5 3<br />
Total Vacant 15 19 10<br />
Total Occupied Units 231 231 245<br />
Owner Occupied Units 189 193 217<br />
Renter Occupied Units 42 38 28<br />
Single Family Units 233 231 223<br />
Multi-Family Units 5 1 0<br />
Mobile Homes 8 18 34<br />
N<br />
Town of Unity 1980 1990 2000<br />
Total Housing Units 221 234 253<br />
Total Seasonal 1 2 5<br />
Total Vacant 8 13 14<br />
Total Occupied Units 212 221 239<br />
Owner Occupied Units 195 196 222<br />
Renter Occupied Units 17 25 17<br />
Single Family Units 206 199 225<br />
Multi-Family Units 5 3 2<br />
Mobile Homes 9 32 32<br />
Town of Warner 1980 1990 2000<br />
Total Housing Units 201 200 208<br />
Total Seasonal 1 5 7<br />
Total Vacant 11 18 13<br />
Total Occupied Units 189 182 195<br />
Owner Occupied Units 168 146 172<br />
Renter Occupied Units 21 36 23<br />
Single Family Units 187 176 179<br />
Multi-Family Units 3 1 0<br />
Mobile Homes 10 23 15<br />
Clark County Conditions and Trends Report 77
Table 2.7 continued<br />
Housing Characteristics – 1980 to 2000<br />
Clark County Municipalities<br />
Municipal Unit 1980 1990 2000<br />
Town of Washburn 1980 1990 2000<br />
Total Housing Units 159 193 189<br />
Total Seasonal 52 74 61<br />
Total Vacant 11 83 73<br />
Total Occupied Units 96 110 116<br />
Owner Occupied Units 89 88 106<br />
Renter Occupied Units 7 22 10<br />
Single Family Units 99 146 128<br />
Multi-Family Units 4 0 0<br />
Mobile Homes 4 47 69<br />
Town of <strong>West</strong>on 1980 1990 2000<br />
Total Housing Units 226 258 267<br />
Total Seasonal 5 23 23<br />
Total Vacant 8 41 37<br />
Total Occupied Units 213 217 230<br />
Owner Occupied Units 184 176 199<br />
Renter Occupied Units 29 41 31<br />
Single Family Units 189 208 221<br />
Multi-Family Units 8 0 0<br />
Mobile Homes 24 50 38<br />
Town of Withee 1980 1990 2000<br />
Total Housing Units 286 265 277<br />
Total Seasonal 1 3 3<br />
Total Vacant 25 20 15<br />
Total Occupied Units 260 245 262<br />
Owner Occupied Units 225 206 229<br />
Renter Occupied Units 35 39 33<br />
Single Family Units 269 242 259<br />
Multi-Family Units 5 1 2<br />
Mobile Homes 11 22 18<br />
Town of Worden 1980 1990 2000<br />
Total Housing Units 193 189 210<br />
Total Seasonal 3 9 5<br />
Total Vacant 10 16 12<br />
Total Occupied Units 180 173 198<br />
Owner Occupied Units 157 149 178<br />
Renter Occupied Units 23 24 20<br />
Single Family Units 180 168 182<br />
Multi-Family Units 3 0 0<br />
Mobile Homes 7 21 27<br />
78 Housing Information
Table 2.7 continued<br />
Housing Characteristics – 1980 to 2000<br />
Clark County Municipalities<br />
Municipal Unit 1980 1990 2000<br />
Town of York 1980 1990 2000<br />
Total Housing Units 257 267 279<br />
Total Seasonal 0 2 3<br />
Total Vacant 14 13 13<br />
Total Occupied Units 243 254 266<br />
Owner Occupied Units 218 221 240<br />
Renter Occupied Units 25 33 26<br />
Single Family Units 242 238 253<br />
Multi-Family Units 4 2 0<br />
Mobile Homes 11 27 24<br />
Village of Curtiss 1980 1990 2000<br />
Total Housing Units 60 77 70<br />
Total Seasonal 0 1 0<br />
Total Vacant 8 9 2<br />
Total Occupied Units 52 68 68<br />
Owner Occupied Units 39 52 55<br />
Renter Occupied Units 13 16 13<br />
Single Family Units 53 52 46<br />
Multi-Family Units 6 6 5<br />
Mobile Homes 1 19 16<br />
Village of Dorchester* 1980 1990 2000<br />
Total Housing Units 241 283 359<br />
Total Seasonal 0 1 343<br />
Total Vacant 4 12 16<br />
Total Occupied Units 237 271 343<br />
Owner Occupied Units 182 203 249<br />
Renter Occupied Units 55 68 94<br />
Single Family Units 194 208 244<br />
Multi-Family Units 41 49 78<br />
Mobile Homes 6 26 37<br />
Village of Granton 1980 1990 2000<br />
Total Housing Units 163 164 164<br />
Total Seasonal 0 1 0<br />
Total Vacant 7 14 8<br />
Total Occupied Units 156 150 156<br />
Owner Occupied Units 121 118 119<br />
Renter Occupied Units 35 32 37<br />
Single Family Units 124 130 121<br />
Multi-Family Units 20 11 18<br />
Mobile Homes 19 23 24<br />
*Portion of community located in Clark County only.<br />
Clark County Conditions and Trends Report 79
Table 2.7 continued<br />
Housing Characteristics – 1980 to 2000<br />
Clark County Municipalities<br />
Municipal Unit 1980 1990 2000<br />
Village of Unity* 1980 1990 2000<br />
Total Housing Units 74 71 62<br />
Total Seasonal 0 0 0<br />
Total Vacant 8 3 2<br />
Total Occupied Units 66 68 60<br />
Owner Occupied Units 55 53 52<br />
Renter Occupied Units 11 15 8<br />
Single Family Units 62 47 35<br />
Multi-Family Units 3 3 2<br />
Mobile Homes 9 21 25<br />
Village of Withee 1980 1990 2000<br />
Total Housing Units 224 235 228<br />
Total Seasonal 0 0 1<br />
Total Vacant 13 18 15<br />
Total Occupied Units 211 217 213<br />
Owner Occupied Units 180 168 173<br />
Renter Occupied Units 31 49 40<br />
Single Family Units 181 180 183<br />
Multi-Family Units 11 23 9<br />
Mobile Homes 32 32 12<br />
City of Abbotsford* 1980 1990 2000<br />
Total Housing Units 581 602 656<br />
Total Seasonal 0 3 612<br />
Total Vacant 27 20 44<br />
Total Occupied Units 554 582 612<br />
Owner Occupied Units 381 393 412<br />
Renter Occupied Units 173 189 200<br />
Single Family Units 390 419 451<br />
Multi-Family Units 177 153 187<br />
Mobile Homes 14 30 18<br />
City of Colby* 1980 1990 2000<br />
Total Housing Units 415 421 440<br />
Total Seasonal 0 0 421<br />
Total Vacant 17 15 19<br />
Total Occupied Units 398 406 421<br />
Owner Occupied Units 298 307 322<br />
Renter Occupied Units 100 99 99<br />
Single Family Units 320 333 361<br />
Multi-Family Units 94 78 77<br />
Mobile Homes 1 10 2<br />
*Portion of community located in Clark County only.<br />
80 Housing Information
Table 2.7 continued<br />
Housing Characteristics – 1980 to 2000<br />
Clark County Municipalities<br />
Municipal Unit 1980 1990 2000<br />
City of Greenwood 1980 1990 2000<br />
Total Housing Units 476 440 502<br />
Total Seasonal 0 9 4<br />
Total Vacant 23 30 34<br />
Total Occupied Units 453 410 468<br />
Owner Occupied Units 317 289 331<br />
Renter Occupied Units 136 121 137<br />
Single Family Units 344 329 378<br />
Multi-Family Units 90 82 86<br />
Mobile Homes 42 29 32<br />
City of Loyal 1980 1990 2000<br />
Total Housing Units 528 550 576<br />
Total Seasonal 0 1 1<br />
Total Vacant 28 27 28<br />
Total Occupied Units 500 523 548<br />
Owner Occupied Units 387 375 420<br />
Renter Occupied Units 113 148 128<br />
Single Family Units 404 411 448<br />
Multi-Family Units 72 78 88<br />
Mobile Homes 52 61 40<br />
City of Neillsville 1980 1990 2000<br />
Total Housing Units 1,153 1,199 1,200<br />
Total Seasonal 0 7 6<br />
Total Vacant 55 89 70<br />
Total Occupied Units 1,098 1,110 1,130<br />
Owner Occupied Units 768 724 739<br />
Renter Occupied Units 330 386 391<br />
Single Family Units 860 853 888<br />
Multi-Family Units 283 315 287<br />
Mobile Homes 10 31 20<br />
City of Owen 1980 1990 2000<br />
Total Housing Units 448 437 455<br />
Total Seasonal 1 1 5<br />
Total Vacant 19 27 43<br />
Total Occupied Units 428 410 412<br />
Owner Occupied Units 310 309 299<br />
Renter Occupied Units 118 101 113<br />
Single Family Units 335 328 338<br />
Multi-Family Units 88 74 91<br />
Mobile Homes 24 35 41<br />
Clark County Conditions and Trends Report 81
Table 2.7 continued<br />
Housing Characteristics – 1980 to 2000<br />
Clark County Municipalities<br />
Municipal Unit 1980 1990 2000<br />
City of Thorp 1980 1990 2000<br />
Total Housing Units 739 754 759<br />
Total Seasonal 11 7 5<br />
Total Vacant 21 40 53<br />
Total Occupied Units 707 714 706<br />
Owner Occupied Units 503 494 513<br />
Renter Occupied Units 205 220 193<br />
Single Family Units 540 555 578<br />
Multi-Family Units 149 136 136<br />
Mobile Homes 39 63 42<br />
82 Housing Information
Map 2.1<br />
Housing Unit Change – 1980-2000 – Chippewa County Municipalities<br />
Clark County Conditions and Trends Report 83
84 Housing Information
3. TRANSPORTATION INFORMATION<br />
Element Context<br />
Transportation facilities have a significant influence on land use, development and<br />
quality of life for County residents. This section includes a review of transportation<br />
facilities found in Clark County, including highways, rail, airports, bicycle facilities,<br />
pedestrian facilities, and transit. Transportation types primarily recreational in nature,<br />
such as snowmobile, ATV, and hiking trails, are not discussed in this section, but can be<br />
found in the community facilities and natural resources sections.<br />
Clark County provides much of the roadway<br />
infrastructure to support inter-<strong>county</strong><br />
movements, intra-city movements and the<br />
demands of new growth. This road system<br />
also allows the movement of buggies,<br />
bicycles, and pedestrians. A wellmaintained<br />
and planned transportation<br />
system can aid in economic development,<br />
support a variety of land uses, provide links<br />
among community facilities, and facilitate<br />
the provision of various public and<br />
emergency services.<br />
State Highway 29 east of Thorp<br />
This section was drafted in the context of regional, state and national transportation<br />
planning guidelines and principles. Numerous existing State and local transportation<br />
plans of regional significance are noted in Special Addendum: Inventory of Existing<br />
Plans, Programs, & Land Use Policies in <strong>West</strong> <strong>Central</strong> <strong>Wisconsin</strong> and are considered in<br />
the development of this plan. Transportation issues, needs, and strategies specific to<br />
individual communities will be addressed in their respective plans.<br />
Clark County Conditions and Trends Report 85
Background Data/Existing Conditions<br />
Highways<br />
Clark County is served by over 2,100 miles of roads under state, <strong>county</strong> and local<br />
jurisdiction (see Table 3.1). Major east/west highways include WIS 29, and USH 10.<br />
WIS 73 is the main north/south highway in the County. Interstate Highway 94 is just<br />
beyond the County borders to the west.<br />
Table 3.1 - Road Mileage by Jurisdiction - 2008<br />
Jurisdiction Miles Percent of Total<br />
State 157.4 7.4<br />
County 300.9 14.1<br />
Towns 1566.4 73.2<br />
Villages 23.3 1.1<br />
Cities 91.4 4.3<br />
TOTAL 2139.3 100.0<br />
source: WisDOT, <strong>Wisconsin</strong> Information System for Local Roads,<br />
January 1, 2008.<br />
In Clark County, two highways are labeled as backbone or connector routes in the<br />
<strong>Wisconsin</strong> Department of Transportation (WisDOT) Corridors 2020 Plan. WIS 29 is<br />
identified as a backbone route and WIS 13 is identified as connector route. As a<br />
connector route, WIS 13 links significant economic and tourism centers into the<br />
backbone system. The backbone system is a collection of multilane highways such as the<br />
interstate system and much of the state trunk highway system (including WIS 29) that<br />
serve longer interregional trips within the State<br />
and between <strong>Wisconsin</strong> and the nation.<br />
Roads can be generally classified into three<br />
categories - arterials, collectors and local roads.<br />
The type of service it provides determines a<br />
road’s classification. Typically, arterials provide<br />
the least amount of access to adjacent land uses<br />
and highest level of mobility, while local streets<br />
provide the most access and lowest level of<br />
mobility. Collector roads provide a combination<br />
of access and mobility. The functional<br />
classification of the highways in the County is<br />
shown on Map 3.1.<br />
The backbone and connector routes, which link<br />
<strong>Wisconsin</strong>’s economic and tourism centers, are all classified as arterials since they are<br />
designed to provide a high level of mobility between communities. Typically, arterials<br />
accommodate higher levels of traffic at higher speeds than collectors. The actual number<br />
of vehicles that a road can accommodate is determined by a number of factors, including<br />
86 Transportation Information
the number of travel lanes, posted speed limit, and the level of access the road provides.<br />
Generally, a two-lane road can accommodate up to 13,500 vehicles per day. A four-lane<br />
road with a median can accommodate between 13,500 and 30,000 vehicles per day.<br />
Of the state and federal highways located in Clark County, the State Highway Plan 2020<br />
identifies WIS 13, along the northern third of the County’s eastern boundary, as a facility<br />
that will experience moderate congestion by the year 2020 if no capacity expansion<br />
improvements are made. The segment to the north of WIS 29 is noted as a potential<br />
major project site. WIS 73, near its intersection with USH 10 in Neillsville, is also<br />
projected to experience moderate congestion by 2020. There was no recommendation for<br />
a major project in this location. No other highways in the County were identified as<br />
having future capacity issues.<br />
Highway Projects in the County<br />
Various construction and repair projects are programmed for the State highways in Clark<br />
County between 2008 and 2013. A total of 130 miles are scheduled for improvement over<br />
this six-year period (See Table 3.2).<br />
Table 3.2 - WisDOT 6-year Plan Projects for Clark County<br />
Length Estimated Year<br />
Hwy Project Title<br />
(in miles) Project Cost (SFY)<br />
13 Abbotsford - Medford 0.22<br />
29 Thorp - Abbotsford Road 0.01<br />
73 Pittsville - Neillsville Road 16.57<br />
29 Chippewa Falls - Abbotsford 41.58<br />
73 C. Neillsville, Hewett Street 0.24<br />
29 Cadott - Abbotsford 41.39<br />
$250,000 -<br />
$499,999<br />
$1,000,000 -<br />
$1,999,999<br />
$1,000,000 -<br />
$1,999,999<br />
$1,000,000 -<br />
$1,999,999<br />
$100,000 -<br />
$249,999<br />
$3,000,000 -<br />
$3,999,999<br />
2008<br />
2008<br />
2008<br />
2009<br />
2009<br />
2012<br />
Project Description<br />
Reconstruction project on WIS 13 from 0.5 miles north of Willow<br />
Road to 0.28 miles south of Pine Road<br />
Replacement of failed asphaltic pavement section on CHT E<br />
segment of the interchange with concrete pavement<br />
Pavement maintenance to sealcoat roadway from the east <strong>county</strong><br />
line to WIS 95<br />
Pavement maintenance to do spot patches on WIS 29 with<br />
concrete and repair wing walls on the westbound North Fork of<br />
the Eau Claire River bridge<br />
Roadway maintenance to grind off 1 inch of existing concrete<br />
pavement, patch joints, and overlay with 2-3 inches of new<br />
asphaltic pavement<br />
Pavement maintenance on WIS 29 and the interchange ramps on<br />
the eastbound lanes from WIS 27 to Dill Creek<br />
73 Neillsville - Withee Road 0.05 $100,000 or less 2012 Bridge deck overlay<br />
10 Fairchild - Neillsville Road 7.82<br />
12 Fairchild - Black River Falls Road 10.45<br />
13 Abbotsford - Medford Road 8.45<br />
73 Pittsville - Neillsville Road 2.93<br />
source: WisDOT 6-Year Plan, 2008.<br />
$2,000,000 -<br />
$2,999,999<br />
$4,000,000 -<br />
$4,999,999<br />
$2,000,000 -<br />
$2,999,999<br />
$500,000 -<br />
$749,999<br />
2013<br />
Mill off 2¼ inches of existing surface and repave with 4 inches of<br />
HMA warranted pavement; upgrade beambuard and replace<br />
culverts as necessary<br />
2013 Mill and overlay with new asphaltic pavement<br />
2013 Unknown<br />
2013<br />
Pavement maintenance to mill the existing surface and repave;<br />
replace beam guard and permanent signing as necessary.<br />
Clark County Conditions and Trends Report 87
Map 3.1 - Clark County Rural Functional Classification<br />
88 Transportation Information
Bridges<br />
There are a total of 298 bridges in Clark County.<br />
WisDOT generally defines a bridge as any structure<br />
spanning 20 feet or more that carries motor vehicle<br />
traffic. Of these bridges, 43 are under State<br />
ownership and maintenance, 52 are owned by the<br />
County, 202 are under local ownership, and one is<br />
owned by a railroad. (See Table 3.3).<br />
State and local bridges are inspected at least once<br />
every two years. WisDOT is responsible for<br />
inspections of all bridges along the State highway<br />
system. Municipalities handle inspections for bridges<br />
along the local roadway system. WisDOT and local<br />
governments follow federal guidelines in their bridge<br />
inspection and maintenance procedures. Bridges are<br />
rated and categorized in terms of their functional and<br />
structural situation. Functionally obsolete is an<br />
engineering term frequently used to describe older<br />
bridges that no longer meet modern geometric<br />
standards. For example, it could refer to a bridge<br />
with narrow lanes or shoulders. A bridge classified as<br />
functionally obsolete does not mean the bridge is<br />
unsafe for public travel. Structurally deficient is an<br />
engineering term used to describe a bridge with one<br />
or more elements that will require attention. The<br />
classification does not mean the bridge is unsafe for<br />
travel. For example, it could refer to a combination<br />
of elements on a bridge such as potholes on a bridge<br />
deck or rust on metal trusses. These may have little<br />
to no impact on a bridge’s overall safe function.<br />
Depending on the extent of the structural deficiency,<br />
the bridge may be load-posted until improvements are<br />
completed.<br />
All bridges under State ownership in Clark County<br />
meet all structural and functional standards. There<br />
are 14 bridges under County or local ownership that<br />
are classified as either structurally deficient or<br />
functionally obsolete, or both (See Table 3.4).<br />
Table 3.3 - Ownership of Bridges<br />
Owner<br />
No. of Bridges<br />
State of <strong>Wisconsin</strong> 43<br />
Chippewa County 52<br />
WC Ltd. R.R. 1<br />
T. Beaver 11<br />
T. Butler 2<br />
T. Colby 10<br />
T. Dewhurst 1<br />
T. Eaton 3<br />
T. Foster 1<br />
T. Fremont 6<br />
T. Grant 24<br />
T. Green Grove 4<br />
T. Hendren 4<br />
T. Hewett 8<br />
T. Hixon 2<br />
T. Hoard 5<br />
T. Levis 5<br />
T. Longwood 3<br />
T. Loyal 7<br />
T. Lynn 9<br />
T. Mayville 10<br />
T. Mead 7<br />
T. Mentor 2<br />
T. Pine Valley 6<br />
T. Reseburg 5<br />
T. Seif 3<br />
T. Sherman 7<br />
T. Sherwood 2<br />
T. Thorp 8<br />
T. Unity 3<br />
T. Warner 2<br />
T. Washburn 7<br />
T. <strong>West</strong>on 3<br />
T. Withee 4<br />
T. Worden 8<br />
T. York 13<br />
V. Curtiss 0<br />
V. Dorchester 1<br />
V. Granton 1<br />
V. Unity 0<br />
V. Withee 0<br />
C. Abbotsford 0<br />
C. Colby 0<br />
C. Greenwood 1<br />
C. Loyal 1<br />
C. Neillsville 3<br />
C. Owen 0<br />
C. Thorp 0<br />
TOTAL 298<br />
source:WisDOT, 2008.<br />
Clark County Conditions and Trends Report 89
Table 3.4 - Functionally Obsolete and Structurally Deficient Bridges in Clark County<br />
State<br />
Bridge I.D. Owner Location Bridge On Bridge Over<br />
Year<br />
Built<br />
Deficiency<br />
P100112 Town T. Green Grove Robin Avenue Soo Line Railroad 1940 F.O.<br />
B100379 Town T. Reseburg Gorman Avenue Br. S. Fork Eau Claire River 2006 F.O.<br />
B100683 City T. Neillsville WIS 73/Hewett Street O'Neill Creek 1940 F.O.<br />
B100380 Town T. Hoard Willow Road Br. N. Fork Popple River 2006 F.O.<br />
P100903 Town T. Beaver Owen Avenue Rock Creek 1940 F.O.<br />
B100378 County C. Greenwood CTH G Begley Street Black River 1938 F.O.<br />
P100069 Town T. Mayville Catlin Avenue Popple River 1950 F.O.<br />
P100080 City C. Owen Fairground Avenue <strong>Wisconsin</strong> <strong>Central</strong> Ltd R.R. 1946 F.O.<br />
P100930 County T. Dewhurst CTH J Arnold Creek 1963 S.D. AND F.O.<br />
B100976 County T. Eaton CTH OO Black River 1948 S.D. AND F.O.<br />
P100053 County T. Washburn CTH K Hay Meadow Creek 1949 S.D. AND F.O.<br />
P100267 Town T. Dewhurst Riviera Avenue Br. Black River 1928 S.D. AND F.O.<br />
P100120 Town T. Unity Riplinger Road S. Fork Popple River 1959 S.D. AND F.O.<br />
P100150 Town T. Eaton Twenty-six Road East Branch 1915 S.D. AND F.O.<br />
B100059 County T. Mead CTH MM Black Creek 1936 S.D. AND F.O.<br />
source: WisDOT, 2008.<br />
Access Management<br />
Access management includes planning the number and location of driveways on<br />
roadways. This practice helps maintain safe and efficient traffic movement on roadways,<br />
and access to and from property, particularly in more urban areas. Road function and<br />
safety increase as the number of access points decrease.<br />
WisDOT employs three types of access control authorized by State statutes. They are<br />
referred to as <strong>Wisconsin</strong> Statutes (Wis. Stats.) 84.09, 84.25 and 84.295. A short summary<br />
of the State statutes follows, but it should be noted that the actual content of the statutes is<br />
significantly more detailed, and many special conditions and provisions are not included<br />
in this text. The type of access control that is imposed on various highway road segments<br />
influences how that segment is managed.<br />
• Wis. Stats. 84.09 (purchase access control) – WisDOT acquires land by gift,<br />
devise, purchase or condemnation to establish, extend or improve transportation<br />
facilities.<br />
• Wis. Stats 84.25 (administrative access control) – WisDOT designates some rural<br />
portions of the State trunk highway system as controlled-access highways where<br />
studies show that the potential exists for traffic volumes to exceed 2,000 vehicles<br />
per 24-hour day.<br />
• Wis. Stats 84.295 (freeway and expressway access control) – WisDOT designates<br />
highways with greater than 4,000 vehicles per day as freeways or expressways<br />
when it is determined that the volume and character of traffic warrants the<br />
construction or acquisition of right-of-way to accommodate a four-lane highway.<br />
Access control is in effect on several segments of USH 10 and WIS 29 in Clark County.<br />
These highways include 84.09 purchased control on US 10 from Collier Road to Clay<br />
Street in Neillsville, and from the Neillsville east city limits, just west of Industrial<br />
Boulevard, to the east <strong>county</strong> line. WIS 29, from Bruce Mound Road to the east <strong>county</strong><br />
90 Transportation Information
line, is also under 84.09 access control, but 84.296 declared freeway controls are<br />
expected to be in place in the second half of 2009. WIS 29, from the west <strong>county</strong> line to<br />
Bruce Mound Road already falls under 84.295 controls.<br />
Bicycles<br />
There are no designated off-road bicycle facilities in Clark County, except for mountainbiking<br />
trails. However, many of the roadways are suitable for cycling. WisDOT has<br />
assessed the State and <strong>county</strong> highways based on their suitability for biking throughout<br />
Clark County (See Map 3.2). Many of the <strong>county</strong> highways in particular are well-suited<br />
to biking. While town roads were not explicitly evaluated in WisDOT’s analysis, they<br />
are likely to provide a safe biking facility, as most rural roads have low traffic volumes<br />
and are well maintained.<br />
Clark County Conditions and Trends Report 91
Map 3.2 – Clark County Bicycling Conditions Assessment<br />
source: <strong>Wisconsin</strong> Department of Transportation. http://www.dot.wisconsin.gov/travel/bike-foot/<strong>county</strong>maps.htm<br />
92 Transportation Information
Safety<br />
The number of crashes on highways reported in Clark County declined significantly in<br />
the ten year period from 1998 to 2007 (See Table 3.5 and Figure 3.1). Total crashes<br />
declined by just over 40 percent, with crashes on County highways accounting for the<br />
most improvement at 53.8 percent. Crashes involving injuries have declined by nearly 30<br />
percent. The number of fatalities per year is a fairly small number and therefore difficult<br />
to trend, however there does appear to be some change toward fewer fatalities when<br />
comparing the average of the first five years to the last five years (11.2 and 7.2,<br />
respectively).<br />
Reported crashes involving bicycles or pedestrians have declined, but the numbers are<br />
small and easily skewed. The data shown here includes crashes of all types on public<br />
roads, and does not include those occurring in parking lots or on private roads. The<br />
annual count of crashes for Clark County municipalities (2003-2007) is shown in Table<br />
3.6.<br />
Table 3.5 – Clark County Crash History (1998-2007)<br />
Data Item 1998 1999 2000<br />
2001 2002 2003 2004<br />
2005 2006 2007<br />
All Crashes 914 943 883 877 910 591 590 603 572 545<br />
On State Hwys 440 382 388 375 377 247 288 286 253 254<br />
On County Hwys 234 251 197 219 245 130 120 108 114 108<br />
On Local Roads 240 310 298 283 288 214 182 209 205 183<br />
Total Injuries 295 288 324 246 267 260 242 213 250 208<br />
Total Fatalities 8 11 17 4 16 7 8 7 8 6<br />
Bicycle crashes 6 4 2 2 1 0 2 0 1 1<br />
Pedestrian crashes 7 7 5 0 8 1 3 1 3 4<br />
source: <strong>Wisconsin</strong> Traffic Operations and Safety Laboratory; WisTransPortal Crash Database; Crash Data Retrieval Facility,<br />
Version 1.1.3, July 16, 2008.<br />
Clark County Conditions and Trends Report 93
Figure 3.1 - Clark County Crashes by Highway Type (1998-2007)<br />
500<br />
Total Crashes by Highway Type (1998-2007)<br />
400<br />
number of crashes<br />
300<br />
200<br />
On State Hwys<br />
On County Hwys<br />
On Local Roads<br />
100<br />
0<br />
1998 1999 2000 2001 2002 2003 2004 2005 2006 2007<br />
years<br />
source: <strong>Wisconsin</strong> Traffic Operations and Safety Laboratory; WisTransPortal Crash Database; Crash Data Retrieval<br />
Facility, Version 1.1.3, July 16, 2008.<br />
94 Transportation Information
Table 3.6 - Highway Crashes by Municipality<br />
Municipality 2003 2004 2005 2006 2007<br />
T. Beaver 12 12 10 10 9<br />
T. Butler 4 3 2 2 5<br />
T. Colby 20 32 33 26 18<br />
T. Dewhurst 9 16 8 10 13<br />
T. Eaton 13 17 11 8 17<br />
T. Foster 11 2 8 3 4<br />
T. Fremont 21 12 10 18 8<br />
T. Grant 22 20 25 20 20<br />
T. Green Grove 12 29 21 26 25<br />
T. Hendren 7 6 11 4 8<br />
T. Hewett 9 15 8 12 13<br />
T. Hixon 18 12 18 16 5<br />
T. Hoard 33 14 15 21 11<br />
T. Levis 11 16 12 12 10<br />
T. Longwood 20 21 18 19 23<br />
T. Loyal 14 14 19 13 10<br />
T. Lynn 11 2 10 10 8<br />
T. Mayville 38 35 19 27 25<br />
T. Mead 8 5 5 1 4<br />
T. Mentor 14 16 12 17 17<br />
T. Pine Valley 30 28 44 26 22<br />
T. Reseburg 3 12 9 7 9<br />
T. Seif 1 2 2 4 5<br />
T. Sherman 12 21 14 21 15<br />
T. Sherwood 5 5 9 11 4<br />
T. Thorp 25 35 26 27 33<br />
T. Unity 9 10 11 11 12<br />
T. Warner 11 14 19 13 13<br />
T. Washburn 6 7 10 5 8<br />
T. <strong>West</strong>on 16 14 22 20 11<br />
T. Withee 23 26 15 14 19<br />
T. Worden 4 7 8 5 7<br />
T. York 16 12 15 17 16<br />
V. Curtiss 2 1 3 5 1<br />
V. Dorchester 4 3 7 5 6<br />
V. Granton 5 4 1 5 5<br />
V. Unity 2 0 3 1 0<br />
V. Withee 3 1 5 5 4<br />
C. Abbotsford 25 11 14 21 18<br />
C. Colby 14 15 20 7 18<br />
C. Greenwood 9 4 4 6 9<br />
C. Loyal 10 6 7 8 6<br />
C. Neillsville 28 29 40 30 35<br />
C. Owen 6 4 8 8 4<br />
C. Thorp 15 20 12 15 12<br />
Totals 591 590 603 572 545<br />
source: <strong>Wisconsin</strong> Traffic Operations and Safety Laboratory; WisTransPortal Crash Database;<br />
Crash Data Retrieval Facility, Version 1.1.3, July 16, 2008.<br />
Clark County Conditions and Trends Report 95
Commuting Patterns<br />
Residents of Clark County are employed in a wide array of locations, within their own<br />
community, elsewhere in the County, in other <strong>Wisconsin</strong> and Minnesota counties (See<br />
Table 3.7). Of the 15,683 employed residents reported, 33.72 percent work in the city,<br />
village, or town in which they reside. This would include those that work at home, and<br />
most of those working family farms. Another third of the workers reported that they<br />
work in a Clark County community other than the one in which they reside. Those<br />
working in other <strong>Wisconsin</strong> counties include 32.82 percent of employed Clark County<br />
residents, and about 0.25 percent work in Minnesota.<br />
96 Transportation Information
Table 3.7 - Commuting Patterns of Clark Residents by Municipality<br />
Cities Villages Towns<br />
Clark County Conditions and Trends Report 97<br />
Community of Work Trip Origin<br />
Abbotsford<br />
Colby<br />
Greenwood<br />
Loyal<br />
Neillsville<br />
Owen<br />
Thorp<br />
Curtiss<br />
Dorchester<br />
Granton<br />
Unity<br />
Withee<br />
Beaver<br />
Butler<br />
Colby<br />
Dewhurst<br />
Eaton<br />
Foster<br />
Fremont<br />
Grant<br />
Green Grove<br />
Destination w/in origin<br />
community<br />
211 159 262 225 663 141 315 18 109 29 2 42 139 8 153 13 147 12 171 75 125 70 20 98 88 64 111 178 102 118 36 33 129 173 46 120 19 141 122 89 26 94 173 80 139 5288<br />
Destination outside community;<br />
w/in Clark County<br />
Destination in<br />
other <strong>Wisconsin</strong><br />
Counties<br />
Destination in<br />
Minnesota counties<br />
Other<br />
Hendren<br />
165 115 154 133 306 183 163 27 77 72 8 131 126 15 117 43 165 19 57 233 92 123 123 153 113 110 134 90 73 165 97 50 317 126 60 56 13 108 58 135 73 176 159 92 150 5155<br />
Barron 2 2<br />
Brown 2 2 2 6<br />
Calumet 3 3<br />
Chippewa 6 3 5 12 65 2 2 1 3 5 5 4 2 21 103 2 20 74 335<br />
Columbia 3 1 4<br />
Dane 2 2 3 2 4 2 15<br />
Dodge 2 2<br />
Dunn 2 2 3 3 1 2 7 2 22<br />
Eau Claire 5 2 6 51 5 2 2 4 7 10 1 5 2 8 5 22 7 17 2 2 14 4 2 14 22 221<br />
Fond du Lac 3 2 2 7<br />
Forest 2 2 2 3 9<br />
Jackson 6 36 2 1 53 2 2 3 2 27 136 18 2 2 2 2 6 302<br />
Juneau 2 2<br />
La Crosse 3 2 2 7<br />
Langlade 5 5<br />
Lincoln 8 4 2 3 2 4 3 4 1 3 34<br />
Marathon 165 154 17 80 47 31 9 22 86 20 29 17 40 104 2 47 20 56 6 12 23 14 35 18 75 4 5 13 3 85 4 97 9 14 3 3 6 32 1407<br />
Menominee 3 3 6<br />
Milwaukee 2 2<br />
Monroe 5 2 5 2 2 4 20<br />
Oconto 1 1<br />
Oneida 4 2 4 2 12<br />
Outagamie 2 2<br />
Ozaukee 3 3<br />
Pepin 4 4<br />
Portage 3 2 4 6 2 2 3 4 1 3 3 2 2 2 39<br />
Price 2 4 3 3 2 3 17<br />
Racine 2 2 4<br />
Rock 2 2<br />
Rusk 1 1<br />
St. Croix 1 2 2 3 3 11<br />
Sauk 2 3 4 3 3 15<br />
Shawano 3 3<br />
Sheboygan 5 2 7<br />
Taylor 77 39 3 9 2 32 38 13 124 4 4 2 29 2 2 19 28 23 5 5 84 2 7 2 15 3 5 20 2 600<br />
Trempealeau 3 3 2 3 20 2 33<br />
Vilas 2 2 4<br />
Walworth 6 2 8<br />
Waukesha 2 2 2 6<br />
Waushara 2 2<br />
Winnebago 2 2 2 6<br />
Wood 40 67 58 168 93 14 7 6 23 58 15 3 69 37 4 33 2 274 77 24 34 20 10 1 23 10 60 117 14 4 5 55 2 4 138 67 2 96 29 29 46 118 1956<br />
Anoka 2 3 5<br />
Dakota 3 2 1 6<br />
Douglas 4 4 8<br />
Faribault 2 2<br />
Hennepin 2 2 2 6<br />
Jackson 2 2<br />
Kandiyohi 2 2<br />
McLeod 1 2 3<br />
Ramsey 2 2 4<br />
Scott 2 2 4<br />
Washington 2 2<br />
3 3 2 2 3 2 8 4 2 3 2 2 6 2 2 3 49<br />
Hewett<br />
Hixon<br />
Hoard<br />
Levis<br />
Longwood<br />
Loyal<br />
Lynn<br />
Mayville<br />
Mead<br />
Mentor<br />
Pine Valley<br />
Reseburg<br />
Seif<br />
Sherman<br />
Sherwood<br />
Thorp<br />
Unity<br />
Warner<br />
Washburn<br />
<strong>West</strong>on<br />
Withee<br />
Worden<br />
York<br />
Total by workplace<br />
Total by home community<br />
source: U.S. Bureau of the Census, Census Transportation <strong>Planning</strong> Package, 2000.<br />
682 551 521 625 1166 429 668 86 438 181 62 201 385 27 453 138 365 47 576 429 326 249 175 303 256 234 294 373 319 460 152 286 551 370 122 405 103 394 383 273 158 341 380 296 450 15683
Summary<br />
The following summarizes the existing conditions and trends of transportation in Clark<br />
County:<br />
• There are slightly more than 2,000 miles of public road in Clark County, under<br />
the jurisdiction of the State of <strong>Wisconsin</strong>, Clark County, or local governments.<br />
• WisDOT’s six year highway plan includes between $15,000,000 and $22,000,000<br />
in projects within Clark County (See Table 3.2).<br />
• There are 298 bridges in Clark County, fifteen of which (5.0 percent) are<br />
classified as either functionally obsolete or structurally deficient. This does not<br />
mean that they are unsafe for travel.<br />
• While many of the County and town roads in Clark County are rated as suitable<br />
for bicycling, there are no dedicated bicycling trails, or multi-use trails that are<br />
suitable for bicycling, in the County.<br />
• Just over one-third (33.72%) of employed persons in Clark County work in the<br />
same town, village, or city where they live; another third (32.87%) work in a<br />
different Clark County community; the other third (32.82%) work in other<br />
<strong>Wisconsin</strong> counties, primarily Wood (12.47%) and Marathon (8.97%). About<br />
one-half of a percent of workers reported working in other states.<br />
98 Transportation Information
4. UTILITIES AND COMMUNITY FACILITIES<br />
INFORMATION<br />
Element Context<br />
The State of <strong>Wisconsin</strong> Comprehensive <strong>Planning</strong> Law (§66.1001) requires that<br />
comprehensive plans include a “compilation of objectives, policies, goals, maps and<br />
programs to guide the future development of utilities and community facilities in the<br />
local governmental unit”.<br />
Utilities and community facilities provide the foundation on which a community is built<br />
and maintained. Utilities include sanitary sewer, storm sewer and water systems, and<br />
electricity, natural gas, telecommunications, and solid waste disposal systems.<br />
Community facilities include parks, schools, health and safety services, libraries, and<br />
more. Utilities and community facilities contribute to the quality of life in Clark County<br />
and affect the community’s ability to attract and retain residents, visitors, businesses, and<br />
industries.<br />
The Clark County Inventory and Trends Report completed by Foth & Van Dyke in<br />
November 2003 does an excellent job of inventorying the key utilities and communities<br />
facilities in the County. This section of the WCWRPC Clark County Conditions and<br />
Trends Report supplements the Foth & Van Dyke report with some additional community<br />
facilities information which may also be valuable to some local planning efforts.<br />
Since the availability, condition, and capacity of utilities and community facilities often<br />
change, and since much of this information is only available at a local level, the inventory<br />
may need to be further supplemented during County and local planning efforts.<br />
Communities will need to individually determine if their facilities meet the needs,<br />
demand, vision, and goals of their respective plans and residents.<br />
Even so, the Foth & Van Dyke report and this supplemental inventory together should<br />
provide the bulk of the community facility and utility background information needed for<br />
comprehensive planning in rural communities where public utilities and facilities are<br />
more limited.<br />
Facilities located in the City of Stanley are generally not included here given that the City<br />
is largely located in Chippewa County and included in the Chippewa County Conditions<br />
and Trends Report.<br />
Clark County Conditions and Trends Report 99
Inventory of Utilities<br />
Utilities in Clark County (e.g., sewer, water, stormwater, communication, power) are<br />
inventoried in the Clark County Inventory and Trends Report completed by Foth & Van<br />
Dyke. For supplemental reference, Maps 4.2 and 4.3 at the end of this section show the<br />
electric and natural gas service areas in west central <strong>Wisconsin</strong>.<br />
Inventory of Other Educational Facilities<br />
Clark County residents are served by a wide assortment of educational facilities at the<br />
elementary, primary, secondary, and post-secondary levels. The Clark County Inventory<br />
and Trends Report completed by Foth & Van Dyke inventories the public and private<br />
schools in Clark County. For reference, Map 4.4 at the end of this section shows the<br />
public school districts in Clark County. This sub-section also includes information on the<br />
CESAs and post-secondary institutions. Overall, municipalities in the County generally<br />
have a limited role in the planning and function of educational facilities, primarily relying<br />
on the educational institution itself for required planning and operations.<br />
Cooperative Educational Service Agencies (CESAs)<br />
CESA agencies were established in 1965 to replace <strong>county</strong> school supervisors. The<br />
state’s 12 regional CESAs offer a variety of leadership and program services that link the<br />
state’s 428 school districts with each other and with the Department of Public Instruction.<br />
CESA’s provide specific programs identified by school districts as priorities; often<br />
several schools jointly share CESA services. All public school districts in Clark County<br />
fall within CESA District #10, with offices located in Chippewa Falls<br />
(www.cesa10.k12.wi.us).<br />
Map 4.1 – Vocational Districts in the Region<br />
Vocational, Technical, and<br />
Adult Education<br />
source: <strong>Wisconsin</strong> Technical College System webpage.<br />
http://www.wtcsystem.edu/colleges.htm<br />
<strong>Wisconsin</strong> has a very strong technical<br />
college system that works closely with<br />
industry, businesses, and the public sector<br />
to provide practical workforce training in<br />
a wide variety of fields. The State is<br />
divided into sixteen vocational districts<br />
with a technical college serving each<br />
district offering a variety of classes,<br />
seminars, and vocational degree programs.<br />
Clark County is located within the<br />
Chippewa Valley, Mid-State,<br />
Northcentral, and a very small portion of<br />
the <strong>West</strong>ern vocational districts (see Map<br />
4.1).<br />
100 Utilities and Community Facilities Information
Northcentral Technical College (NTC) has a central campus in Wausau, with regional<br />
campuses in Antigo, Medford, Merrill, Phillips, Spencer, and Wittenberg. The northeast<br />
portion of Clark County falls within the NTC vocational district.<br />
Mid-State Technical College has campuses in Marshfield, Stevens Point, and <strong>Wisconsin</strong><br />
Rapids, with a learning center in Adams. The southeast portion of Clark County falls<br />
within the MSTC vocational district.<br />
The majority of Clark County falls within the Chippewa Valley Technical College<br />
(CTVC) vocational district. CTVC has campuses in Chippewa Falls, Eau Claire,<br />
Menomonie, River Falls, and an outreach center in the Neillsville Industrial Park.<br />
CVTC’s enrollment for credit courses was 8,855 in 2007-2008, while noncredit<br />
enrollment was 10,741.<br />
Technical college programs include apprenticeships, staff development, agriculture,<br />
marketing, driver education, health careers, law enforcement, home economics, trade and<br />
industrial, and adult education. Also, clinics and seminars are held throughout the year.<br />
University of <strong>Wisconsin</strong> System<br />
The University of <strong>Wisconsin</strong> system of public universities consists of two doctoral<br />
research universities (UW-Madison and UW-Milwaukee), eleven comprehensive<br />
universities, thirteen two-year colleges, and the Statewide UW-Extension system.<br />
<strong>West</strong> central <strong>Wisconsin</strong> is particularly blessed with three comprehensive universities,<br />
being home to UW-Eau Claire, UW-Stout (Menomonie), and UW-River Falls (see Table<br />
4.1). In addition, UW-Stevens Point is in relatively close proximity to many Clark<br />
Table 4.1 – Enrollment of UW Campuses in <strong>West</strong> <strong>Central</strong> <strong>Wisconsin</strong><br />
Campus<br />
1998-99 2007-08<br />
Enrollment Enrollment<br />
% change<br />
UW-Eau Claire 10852 10854 0.02%<br />
UW-River Falls 5617 6452 14.87%<br />
UW-Stout 7731 8477 9.65%<br />
UW-Barron County 491 606 23.42%<br />
source: University of <strong>Wisconsin</strong> system<br />
County communities.<br />
Of the thirteen University of <strong>Wisconsin</strong> colleges in the State offering associates degrees,<br />
UW-Barron County located in Rice Lake is the only one located in west central<br />
<strong>Wisconsin</strong>. But, again, some Clark County residents undoubtedly travel east to attend<br />
classes at UW-Marshfield/Wood County or UW-Marathon County. Residents may also<br />
access associates-degree programming via the Internet-based UW Colleges Online.<br />
University of <strong>Wisconsin</strong>-Extension partners closely with <strong>county</strong> governments to provide<br />
supportive services to all residents, businesses, and governments. This is a very active<br />
Clark County Conditions and Trends Report 101
expression of the “<strong>Wisconsin</strong> Idea”, which is a philosophy that the University of<br />
<strong>Wisconsin</strong> System is a partner in improving the quality of life of all <strong>Wisconsin</strong> residents<br />
through education.<br />
Other Colleges and Universities<br />
There are no independent colleges or universities located in west central <strong>Wisconsin</strong><br />
which are fully accredited, degree-granting, and a member of the <strong>Wisconsin</strong> Association<br />
of Independent Colleges and Universities.<br />
Inventory of Other Community Facilities and Services<br />
The Clark County Inventory and Trends Report completed by Foth & Van Dyke also<br />
provides an excellent inventory of many of the community facilities in Clark County,<br />
including libraries, emergency services, solid waste/recycling, health care facilities,<br />
parks, and municipal buildings. This sub-section supplements the Foth & Van Dyke<br />
report by providing information on hazardous materials response, assisted living<br />
facilities, cemeteries, dams, and additional child care services information.<br />
Hazardous Materials Response<br />
Clark County contracts with another <strong>county</strong> for County “Level B” Hazardous Materials<br />
Response Team service, though some local fire department personnel may have been<br />
trained to the operations level. County or "Level B" Teams respond to chemical<br />
incidents which require a lower level of protective gear, potentially with self-contained<br />
breathing apparatus, but still exceeds the capabilities of standard fire departments.<br />
As needed, the <strong>West</strong> <strong>Central</strong> <strong>Wisconsin</strong> <strong>Regional</strong> Response Team, based in the Chippewa<br />
Falls and Eau Claire Fire Departments, can be contacted for additional reconnaissance<br />
and research support. This “Level A” team can also be requested to respond to the most<br />
serious of spills and releases requiring<br />
the highest level of skin and respiratory<br />
protective gear. This includes all<br />
chemical, biological, or radiological<br />
emergencies requiring vapor-tight<br />
“Level A” gear with self-contained<br />
breathing apparatus.<br />
<strong>Planning</strong> and exercises regarding hazard<br />
materials is coordinated through the<br />
Clark County Emergency Management<br />
Office in conjunction with the Clark<br />
County Local Emergency Preparedness<br />
Committee.<br />
<strong>Regional</strong> Response Team Practice Drill<br />
102 Utilities and Community Facilities Information
Child Care Services<br />
<strong>Wisconsin</strong> State Law requires that anyone caring for four or more children under the age<br />
of seven years who are unrelated to the provider must obtain a license through the<br />
Department of Children and Families. Table 4.2 is a list of State-licensed child care<br />
facilities in Clark County for family child care (up to 8 children) and group child care (9<br />
or more children). Sixty-eight percent of the County’s 31 child care facilities are licensed<br />
for family child care. Communities may need to consider population and demographic<br />
trends compared to the capacity of available child care in their area to help determine if<br />
child care needs of the community are being met.<br />
Table 4.2 – Licensed Child Care Facilities in Clark County<br />
City Day Care Name Capacity<br />
ABBOTSFORD CLC CHRISTIAN DAY CARE 42<br />
COLBY JAY'S GENIUSES FAMILY DAY CARE 8<br />
ZION LUTHERAN EARLY CHILDHOOD CTR 65<br />
DORCHESTER FLOWER PATCH DAY CARE 8<br />
GRANTON THERESA'S TREEHOUSE 8<br />
GREENWOOD COUNTRY FRIENDS FAMILY CHILD CARE 8<br />
JENNY'S DAY CARE 8<br />
LEARN-A-LOT PRESCHOOL 15<br />
LOYAL APPLETREE PRESCH AND CC CTR 30<br />
CARMEN'S CARE 8<br />
COUNTRY CHILDREN DAY CARE 8<br />
HEART AND HOME DAY CARE 8<br />
LITTLE BITS DAY CARE 8<br />
ROBIN'S DAY CARE 8<br />
NEILLSVILLE CAREBEARS FAMILY DAY CARE 8<br />
CONNIE'S CIDS DAY CARE & PRESCH 55<br />
COUNTRY KIDS DAY CARE 8<br />
FAMILY HOME SERVICE 8<br />
ICAA NEILLSVILLE HEAD START 20<br />
NEILLSVILLE NURSERY SCHOOL 15<br />
PENNY'S DAY CARE 8<br />
WORLDS OF WONDER CHILDCARE 8<br />
OWEN LITTLE SUNSHINE'S CHILD CARE 8<br />
POOH BEAR'S DAY CARE 8<br />
STANLEY TINY TOTS CHILDCARE CTR LLC 61<br />
THORP HAND IN HAND DAY CARE 8<br />
JANE'S HUMPTY DUMPTY DAY CARE 8<br />
MELISSA'S MONKEY BUSINESS 8<br />
SHERRI'S LITTLE ZOO 8<br />
SMALL WONDERS CHILD CARE CENTER 45<br />
SMALL WONDERS TOO 21<br />
source: <strong>Wisconsin</strong> Department of Children & Families, July 2008.<br />
Clark County Conditions and Trends Report 103
Assisted Living Facilities, Nursing Homes, and Senior Programs<br />
Senior care facilities are becoming increasingly important regional assets to meet the<br />
changing needs of our aging population in a manner that permits residents to age with<br />
dignity. Since 1982, the State of <strong>Wisconsin</strong> has maintained a moratorium on the<br />
construction of new nursing home beds due to high vacancy rates. This has created a<br />
problem in some areas, meanwhile encouraging the use of alternative assisted-living<br />
approaches. In 2005, Clark County nursing homes were at 90.7 percent capacity, which<br />
is above the State overall average of 87.9 percent. The actual availability of beds at any<br />
given time in Clark County can vary.<br />
Clark County has a variety of assisted living facilities. The higher costs of many of these<br />
facilities, combined with decreased access to related governmental support, sometimes<br />
encourage residents to choose nursing care over assisted living. As the baby boomer<br />
generation ages, demand for such facilities is expected to increase. And with advances in<br />
medicines and technology, there has been an increasing trend in the provision of "inhome<br />
care” as an alternative to group homes or nursing care, which is also less costly<br />
overall.<br />
Table 4.3 lists the assisted living facilities and nursing homes in Clark County, along with<br />
their capacities. These facilities are organized by five types:<br />
Adult Day Care provides services for part of a day, primarily on weekdays, in a group<br />
setting to adults who need assistance with activities of daily living, supervision, or<br />
protection. Adult day care centers are not licensed by the State, but may be certified.<br />
Adult Family Homes provides residence and care for up to four adults of minimum age<br />
18 who are not related to the operator, with up to seven hour per week of nursing care per<br />
resident. Counties certify one- and two-bed adult family homes, while the State licenses<br />
homes with three or four adults.<br />
Community-Based Residential Facilities are a place where five or more adults reside<br />
who receive care, treatment, or services that are above the level of room and board, but<br />
includes not more than three hours of nursing care (at the intermediate level or below) per<br />
week per resident. These facilities often provide services to a particular group, such as<br />
persons with dementia, developmental disabilities, or mental health problems. CBRFs<br />
are licensed by the State.<br />
Residential Care Apartment Complexes are independent-living apartments where five<br />
or more adults reside which are provided up to 28 hours per week of supportive and/or<br />
nursing services. These complexes may be a distinct part of a nursing home or<br />
community-based residential facility and are certified by the State.<br />
Nursing Homes provide constant nursing care and supportive services to residents who<br />
have significant deficiencies with activities of daily living. Residents are typically the<br />
elderly, younger adults with physical disabilities, and those requiring rehabilitative<br />
therapies. Nursing homes are licensed by the State.<br />
104 Utilities and Community Facilities Information
Communities may need to consider population and demographic trends compared to the<br />
capacity of available assisted living facilities and nursing homes in their area to help<br />
determine if needs are being met. And with Clark County’s aging population, the<br />
availability of such facilities could be a potential issue for the future.<br />
There is a large variety of additional supportive services available to the elderly and those<br />
with disabilities, ranging from in-home support to transportation to financial services to<br />
social activities. Such services are provided through a mix of governmental and nonprofit<br />
institutions, often relying on volunteer support. Senior information and lunches are<br />
available at nine sites in Clark County through the County Aging Office:<br />
Abbotsford Colby Dorchester<br />
Greenwood Humbird Loyal<br />
Neillsville Owen Thorp<br />
For more information on aging and disability programs in Clark County, please contact<br />
the Clark County Aging Office (715-743-5144) or visit its webpage:<br />
(http://www.co.<strong>clark</strong>.wi.us/ClarkCounty/departments/agingoffice/)<br />
Table 4.3 – Assisted Living Facilities in Clark County<br />
City Facility Type Facility Name<br />
Capacity<br />
or # of<br />
Beds<br />
ABBOTSFORD Adult Family Home AURORA RES ALTERNATIVES INC 056 4<br />
CBRF INNCARE OF ABBOTSFORD 16<br />
COLBY Nursing Home COLONIAL CENTER 95<br />
CBRF COHO LLC 8<br />
Resid. Care Apt. Complex COLBY RETIREMENT COMMUNITY 24<br />
GREENWOOD Adult Family Home KOURTLAND HOUSE 4<br />
Adult Family Home ROCQUE ADULT FAMILY TREATMENT SERVICES INC 4<br />
Adult Family Home STERLING ADULT FAMILY HOME 3<br />
CBRF AURORA RES ALT CENTURY HOUSE 051 7<br />
CBRF PABICHS RESIDENTIAL FACILITY INC 8<br />
LOYAL Adult Family Home MALMHUS ADULT FAMILY LIVING LLC 4<br />
NEILLSVILLE Nursing Home NEILLSVILLE MEMORIAL HOME 99<br />
Adult Family Home WHISPERING PINES MANOR 4<br />
Resid. Care Apt. Complex NEILLSVILLE RETIREMENT COMMUNITY 24<br />
OWEN Nursing Home CLARK COUNTY HEALTH CARE CENTER 178<br />
Adult Day Care WILLOW RIDGE ADULT DAY CARE I 16<br />
Adult Day Care WILLOW RIDGE ADULT DAY CENTER II 6<br />
STANLEY Adult Family Home PINE ROAD COUNTRY ADULT HOME 4<br />
THORP Nursing Home OAKBROOK HEALTH AND REHABILITATION 58<br />
Adult Family Home AURORA RESIDENTIAL ALTERNATIVES INC #025 4<br />
Adult Family Home COHO - ELM 4<br />
Adult Family Home COUNTRY CORNER ADULT HOME 4<br />
Adult Family Home K&D COUNTRY LIVING HOME 4<br />
Adult Family Home LAVINWOOD HILLS ADULT FAMILY HOME 4<br />
Adult Family Home STERLING ADULT FAMILY HOME 4<br />
Adult Family Home TENDER CARE ADULT FAMILY HOME 4<br />
WITHEE Adult Family Home AURORA RES ALT INC WITHEE HOUSE 024 3<br />
source: <strong>Wisconsin</strong> Department of Health Services, July 2008.<br />
Clark County Conditions and Trends Report 105
Cemeteries<br />
Table 4.4 lists the cemeteries in Clark County as identified at the Clark County<br />
USGenWeb site (http://wigenweb.org/<strong>clark</strong>) and in the book Cemetery Locations in<br />
<strong>Wisconsin</strong> compiled by Linda Herrick and Wendy Uncapher. Cemeteries are arranged by<br />
general township area using the associated town name for ease of reference, though the<br />
actual cemetery location may be within a city or village located within a listed township.<br />
Because this list is compiled from multiple<br />
sources, some cemeteries may be listed twice,<br />
but under different names.<br />
Greenwood Cemetery<br />
This list does not necessarily include all<br />
smaller cemeteries, family plots, or Native<br />
American burial sites. Further, some of these<br />
cemeteries may be no longer in use. As<br />
needed, each individual community plan may<br />
identify any additional known cemeteries and<br />
any issues, needs, or policies related to those<br />
cemeteries in their community.<br />
106 Utilities and Community Facilities Information
Table 4.4 – Clark County Cemeteries<br />
Township Area<br />
Beaver<br />
Butler<br />
Colby<br />
includes C. of Colby<br />
Dewhurst<br />
Eaton<br />
includes C. of Greenwood<br />
Fremont<br />
Grant<br />
includes V. of Granton<br />
Hendren<br />
Hewett<br />
Hixon<br />
includes V. of Withee<br />
& C. of Owen<br />
Hoard<br />
Levis<br />
Longwood<br />
Loyal<br />
includes C. of Loyal<br />
Lynn<br />
Mayville<br />
includes V. of Dorchester<br />
& C. of Abbotsford<br />
Cemeteries<br />
Town of Beaver<br />
St. Lukas Lutheran<br />
Town of Butler<br />
Town of Colby<br />
St. Mary's Catholic<br />
St. Paul's Lutheran<br />
Lone Grave<br />
St. Mary's<br />
Greenwood<br />
St. Stephen's Catholic<br />
Pine Circle<br />
Yolo<br />
Grant<br />
Lynn<br />
Pine Circle<br />
Windfall<br />
Zion<br />
Holy Family<br />
<strong>West</strong>on<br />
Willard<br />
Columbia<br />
Nazareth<br />
Riverside<br />
St. Paul's Lutheran (Norwegian)<br />
Levis<br />
Dells Dam<br />
Ho-Chunk Indian<br />
Longwood<br />
Emanuel Lutheran<br />
Trinity Lutheran<br />
St. Balthazus - St. Anthony<br />
Pine Grove<br />
Loyal City<br />
East Side<br />
Salem<br />
York<br />
Lynn<br />
N. Memorial (Peace Lutheran)<br />
Old Norwegian<br />
Pine Hill<br />
Dorchester Memorial South<br />
Dorchester Catholic<br />
Abbotsford<br />
Clark County Conditions and Trends Report 107
Table 4.4 –Clark County Cemeteries continued<br />
Township Area<br />
Cemeteries<br />
Mead<br />
Forest Hill<br />
Immanuel Lutheran<br />
Mentor<br />
Mentor<br />
Pine Valley<br />
Poor Farm<br />
includes C. of Neillsville N. Pine Valley<br />
St. Mary's Catholic<br />
Neillsville City Cemetery<br />
Sylvan<br />
<strong>West</strong> Pine Valley<br />
South Pine Valley<br />
Reseburg<br />
Sylvan<br />
Seif<br />
Seif<br />
Sherman<br />
Presbyterian (Veefkind)<br />
Salem Evang. Lutheran<br />
Unknown (Sec. 27)<br />
Sherman (Coles)<br />
<strong>West</strong> Spencer<br />
Thorp<br />
East Thorp<br />
includes C. of Thorp (part) Eidsvold<br />
Germanian<br />
Norwegian<br />
St. Bernard<br />
St. Hedwig<br />
St. Mary's Reformed<br />
Unity<br />
Pine Grove<br />
St. John's Lutheran<br />
Trinity<br />
Warner<br />
Amish<br />
Braun Settlement<br />
Immanuel Unity<br />
Forest Hill<br />
<strong>West</strong>on<br />
Christliche Lutheran (Immanuel)<br />
East Side<br />
<strong>West</strong> Side (<strong>West</strong>on)<br />
Withee<br />
Trinity<br />
includes C. of Thorp (part) name unknown (sec. 27)<br />
St. Hedwig Catholic<br />
East Thorp<br />
Worden<br />
Brethren/Worden<br />
Germanian<br />
Norwegian (sec. 14)<br />
Norwegian (sec. 27)<br />
York<br />
York/Free Methodist<br />
108 Utilities and Community Facilities Information
Dams<br />
In total, Clark County has 72 existing or proposed dams, most being small earthen works<br />
for livestock or recreational ponds and flowages. In most cases, if one of the smaller<br />
dams failed, the runoff downstream would be hardly noticed. There may be the potential<br />
to remove some of the older, smaller dams which no longer serve a function, in order to<br />
improve water quality and lower the risk of failure.<br />
The following is a list of those governments which own dams, dikes, or levees in Clark<br />
County:<br />
Clark County (17)<br />
Washwood Flowage, Rock, Sherwood, Wedges<br />
Creek, Mead, Horse Creek, Spruce Lake, Iron Run,<br />
Web Center, Poplar/Sportsman Lake, and 7 others<br />
Town of Mentor<br />
Halls Creek/Humbird Dam<br />
V. of Dorchester Dorchester Dam<br />
C. of Loyal Bear Creek/American Legion Dam<br />
C. of Owen (2) Mill Dam, Owen Dam<br />
C. of Neillsville Neillsville Dam<br />
Only two existing dams in the County have a high hazard rating:<br />
• Sportsman Lake Dam, owned by Clark County<br />
• Bear Creek/American Legion Dam, owned by the City of Loyal<br />
The hazard rating does not reflect the attributes or strength of the dam, but is based on<br />
potential loss of life and property damage if the dam should break, and on the controls in<br />
place down river to limit such damage (e.g., floodplain zoning). All of these dams are<br />
highly regulated, inspected regularly, and have emergency action plans on file with the<br />
Clark County Emergency Management office.<br />
For additional details on the dams of Clark County, their hazard ratings, potential issues,<br />
and some key development trends in dam shadows, please see the Clark County Natural<br />
Hazards Mitigation Plan.<br />
Summary<br />
Utilities and community facilities in Clark County vary from small-scale facilities serving<br />
primarily local needs to regional facilities and networks serving large portions of the<br />
County’s population. As municipalities grow and change, the infrastructure, essential<br />
services, and related community facilities must evolve as well.<br />
This section, combined with the Foth & Van Dyke report, provides a basic inventory of<br />
the principal utilities and community facilities of Clark County. The following are some<br />
key findings from these reports:<br />
• There are 13 public sanitary sewer providers in Clark County, including two<br />
sanitary districts in Chili and Hatfield.<br />
Clark County Conditions and Trends Report 109
• The vast majority of private, onsite wastewater treatment systems in Clark<br />
County are holding tanks, though mound systems are increasing in popularity.<br />
• There are 10 public water utilities in Clark County.<br />
• The Duluth-to-Wausau high voltage electrical transmission line to be completed<br />
by 2010 travels through Clark County and has been a contentious issue.<br />
• <strong>Wisconsin</strong> Gas provides natural gas service for portions of northern and east<br />
central Clark County.<br />
• Gaps in telecommunications exist in the County with no part of Clark County<br />
having more than 95+% broadband availability, except for in the Stanley area.<br />
• Clark County is served by 15 school districts and 11 libraries. The County also<br />
has a large number of Amish and Mennonite schools.<br />
• Clark County residents also have access to a variety of post-secondary<br />
institutions, though facilities in the County are limited to the CVTC outreach<br />
center in Neillsville.<br />
• Emergency services are provided locally by the Sheriff’s Department, 7 local<br />
police departments, 18 fire departments, 12 ambulance providers, 6 first<br />
responder services, and the County Emergency Management Office.<br />
• Residents enjoy a wide variety of recreational opportunities, including parks,<br />
campgrounds, rod & gun clubs, surface waters, County forest lands, trails, and<br />
events conducted by civic organizations.<br />
• The Clark County Health Care Center and Memorial Medical Center in<br />
Neillsville are the primary health care facilities located within the County.<br />
• Sixty-eight percent of the County’s 31 licensed child care facilities are licensed<br />
for family child care of less than nine children.<br />
• There are 27 licensed assisted living and adult care facilities located in the<br />
County, in addition to a variety of other types of assistance for seniors. In 2005,<br />
nursing homes in Clark County were operating at a 90.7% capacity.<br />
• Twenty-three of the County’s 72 existing or proposed dams are owned by a<br />
governmental entity; 17 of these are owned by Clark County.<br />
During local planning efforts, this section may need to be supplemented to include<br />
additional facilities and details, and analyzed more closely to identify issues and<br />
community needs.<br />
110 Utilities and Community Facilities Information
Utilities and Community Facilities Maps<br />
Map 4.2 – Electric Service in <strong>West</strong> <strong>Central</strong> <strong>Wisconsin</strong><br />
source: <strong>Wisconsin</strong> Public Service <strong>Commission</strong><br />
Clark County Conditions and Trends Report 111
Map 4.3 – Natural Gas Service in <strong>West</strong> <strong>Central</strong> <strong>Wisconsin</strong><br />
source: <strong>Wisconsin</strong> Public Service <strong>Commission</strong><br />
112 Utilities and Community Facilities Information
Map 4.4 – Clark County School Districts<br />
source: U.S. Census TIGER Files, 2000<br />
Clark County Conditions and Trends Report 113
114 Utilities and Community Facilities Information
5. AGRICULTURAL, NATURAL, AND CULTURAL<br />
RESOURCES INFORMATION<br />
Element Context<br />
Clark County’s history and development is rooted in its natural resources. Prior to<br />
settlement by those of European heritage, Clark County was covered in a variety of<br />
different ecosystems. The early settlers included traders and farmers, which both made a<br />
living from the natural resources from the land. Soon after this period, the agricultural<br />
industry started prospering. During the early part of the 20 th Century, dairying became<br />
more and more prominent.<br />
During the 20 th century, agriculture, as a percentage of the economy, declined somewhat<br />
as more manufacturing, retail, and professional employment opportunities arose in<br />
communities throughout the County. Even though employment in the agricultural<br />
industry decreased, well over half of the County’s land base remains in agricultural<br />
production. The dairy industry plays an extremely important role in the County.<br />
During the first decade of the 21 st century, the agriculture and natural resource industries<br />
of Clark County have experienced a lift from both the increased interest and investment<br />
in local and organic food and renewable energy. The increase in demand for local and/or<br />
organic food has grown significantly since the turn of the century. This has helped<br />
existing family farms and has provided a catalyst for new farms to start in Clark County.<br />
In addition, the abundance of farmland and natural areas are providing Clark County an<br />
opportunity to take advantage of the growing renewable energy and bio-energy<br />
industries. Clark County is currently experiencing growth in a wide range of industries,<br />
public entities, farms, and individuals utilizing farmland and natural areas as a source to<br />
profit from and/or save resources by using renewable resources and bio-energy.<br />
Scattered throughout Clark County remain many unique historical structures and sites<br />
that are important vestiges of its past. Through these changes, it is the characteristics of<br />
Clark County’s natural and cultural resources that continue to define the local<br />
communities and provide the cornerstone for the quality of life for local residents. Clean<br />
and abundant water is needed for drinking, industry, and agriculture. Prime farmlands<br />
continue to provide the basis for the agricultural economy and for the preservation of the<br />
County’s rural character. A diversity of other natural habitats are protected and managed<br />
for aesthetic value, recreational purposes, economic importance, and a healthy ecosystem.<br />
Cultural and historic resources are identified and preserved for their social and economic<br />
value.<br />
The three subsections of this section describes the existing conditions of the agricultural,<br />
natural, and cultural resources of Clark County. These resources provide the foundation<br />
for most, if not all, of the other comprehensive plan elements, and they may be discussed<br />
in numerous other places within the comprehensive plan. To plan for the future, a firm<br />
understanding of the resource base of the community is needed.<br />
Clark County Conditions and Trends Report 115
This provides an important context for developing objectives, policies, goals, maps, and<br />
programs for the conservation and promotion of the effective management of the<br />
agricultural, natural, and cultural resources for each participating community, as required<br />
by <strong>Wisconsin</strong> comprehensive planning legislation (Wis. Stat. § 66.1001(2)(e)). It should<br />
also be noted that under <strong>Wisconsin</strong> Comprehensive <strong>Planning</strong> Law, the term “cultural<br />
resources” includes historic buildings and structures as well as ancient and historic<br />
archeological sites.<br />
Considerable portions of this element are adapted from the U.S. Census Bureau, U.S.<br />
Department of Agriculture, <strong>Wisconsin</strong> Department of Revenue, <strong>Wisconsin</strong> Department of<br />
Natural Resources, <strong>Wisconsin</strong> State Historical Society, and Soil Survey of Clark County,<br />
<strong>Wisconsin</strong>, among other sources. Data from the 2007 Census of Agriculture from the<br />
U.S. Department of Agriculture will be available later in 2009, but this information was<br />
not available at the time this report was compiled.<br />
The maps for this section will be located in Appendix A: Clark County Resource Maps.<br />
In addition, the maps will be located in the Clark County Resource and Land Use Atlas<br />
DVD-ROM.<br />
Agricultural Resources<br />
Adjusted 1997 Census of Agriculture numbers provided by the USDA National<br />
Agricultural Statistics Service were used in this report, offering comparability to<br />
2002 data. Caution should be taken when making comparisons with earlier agricultural<br />
census data, since the number of farms are undercounted for many areas.<br />
Local Agricultural Industry Trends<br />
Agriculture is an important element of the social and economic characteristics of Clark<br />
County, perhaps more so than any other <strong>county</strong> in <strong>Wisconsin</strong>. Changes in agriculture due<br />
to socio-economic conditions and the development pressures to convert agricultural land<br />
to other uses can have profound impacts in Clark County and its surrounding<br />
communities. Agricultural land and prime farmlands based on capability classification<br />
are located throughout Clark County as shown in Maps 5.1 and 5.2 in Appendix A.<br />
In 2002, there were five more farms in Clark County than in 1987. Between 1992 and<br />
2002, there was an increase of 190 farms in the County (See Figure 5.1). The average<br />
farm size increased from 203 acres in 1987 to 210 acres in 2002. Again analyzing<br />
between 1992 and 2002, average farm sizes dropped from 212 acres to 210 acres. From<br />
1987 to 2002, the number of farms stayed the same and average farm size increased three<br />
percent. Between 1992 and 2002, these numbers are a nine percent increase in total farms<br />
and a decrease of one percent for average farm size.<br />
This data shows that Clark County has experienced increases and decreases in the<br />
number of farms in the past decades, and farm size has stayed relatively constant. It needs<br />
to be noted that the U.S. Census Bureau defines “farm” as any place from which $1,000<br />
or more of agricultural products were produced and sold, or normally would have been<br />
116 Agricultural, Natural, and Cultural Resources Information
sold during the census year. Of the 2,200 farms in Clark County, 365 (16.5 percent) had<br />
sales under $1,000, and 673 (30.5 percent) had sales of under $5,000.<br />
Figure 5.1 - Number and Average Size of Farms - 1978 to 2002 – Clark County<br />
2,400<br />
300<br />
2,200<br />
250<br />
Number of Farms<br />
2,000<br />
1,800<br />
200<br />
150<br />
100<br />
Acres<br />
1,600<br />
50<br />
1,400<br />
1987 1992 1997 2002<br />
Year<br />
0<br />
Farms<br />
Acres/Farm<br />
Source: U.S. Department of Agriculture, Census of Agriculture<br />
According to USDA, farmland increased by 16,258 acres (25 square miles) or 3.7<br />
percent, between 1987 and 2002 (see Table 5.1). Farm acres accounted for 57.1 percent<br />
of the total land area in the County in 1987, and 59.1 percent in 2002. As shown in Table<br />
5.2, in 2002, approximately 98.5 percent of the farms in Clark County were noncorporation<br />
individual or family farms.<br />
Table 5.1 - Acres in Farmland – 1987 to 2002 – Clark County<br />
1987 1992 1997 2002<br />
Acres 445,095 426,884 458,600 461,353<br />
Percent of County Land Area 57.1 54.7 58.8 59.1<br />
Source: U.S. Department of Agriculture, National Agricultural Statistics Service<br />
Table 5.2 - Number of Farms by Ownership – 1987 to 2002 – Clark County<br />
Ownership 1987 1992 1997 2002<br />
Individual/Family Farms 2,018 1,830 2,111 2,070<br />
Partnership 137 130 115 97<br />
Corporation – Family 32 40 42 32<br />
Corporation – Other 1 5 0 0<br />
Other (Coop, Trust, etc...) 7 5 5 1<br />
Source: U.S. Department of Agriculture, National Agricultural Statistics Service<br />
Adjusted 1997 Census of Agriculture numbers provided by the USDA National<br />
Agricultural Statistics Service were used in this report, offering comparability to<br />
2002 data. Caution should be taken when making comparisons with earlier agricultural<br />
census data however, since the number of farms are undercounted for many areas.<br />
Clark County Conditions and Trends Report 117
Table 5.3 Assessed Agricultural Parcels and Acreage by Municipality – 1990 and 2007<br />
Total Parcels<br />
Total Acres<br />
1990 2007 # Change 1990 2007 # Change % Change<br />
TOWNS<br />
Beaver 620 650 30 18,023 17,776 -247 -1.4<br />
Butler 86 98 12 1,983 2,230 247 12.5<br />
Colby 567 600 33 17,279 16,209 -1,070 -6.2<br />
Dewhurst 32 16 -16 710 425 -285 -40.1<br />
Eaton 493 528 35 14,359 14,542 183 1.3<br />
Foster 28 17 -11 612 423 -189 -30.9<br />
Fremont 574 546 -28 16,228 14,695 -1,533 -9.4<br />
Grant 680 584 -96 16,820 14,370 -2,450 -14.6<br />
Green Grove 551 579 28 16,504 15,685 -819 -5.0<br />
Hendren 473 352 -121 11,838 9,093 -2,745 -23.2<br />
Hewett 94 57 -37 1,473 889 -584 -39.6<br />
Hixon 547 516 -31 14,399 13,105 -1,294 -9.0<br />
Hoard 462 479 17 13,066 12,258 -808 -6.2<br />
Levis 246 243 -3 5,071 4,646 -425 -8.4<br />
Longwood 544 577 33 15,811 14,234 -1,577 -10.0<br />
Loyal 650 655 5 19,185 18,459 -726 -3.8<br />
Lynn 448 388 -60 10,809 8,444 -2,365 -21.9<br />
Mayville 614 607 -7 18,079 16,593 -1,486 -8.2<br />
Mead 233 176 -57 6,004 5,003 -1,001 -16.7<br />
Mentor 250 245 -5 6,150 5,951 -199 -3.2<br />
Pine Valley 545 493 -52 11,130 8,769 -2,361 -21.2<br />
Reseburg 604 596 -8 19,113 18,088 -1,025 -5.4<br />
Seif 174 158 -16 4,088 3,231 -857 -21.0<br />
Sherman 614 593 -21 17,536 16,684 -852 -4.9<br />
Sherwood 131 102 -29 3,482 2,310 -1,172 -33.7<br />
Thorp 630 603 -27 17,497 14,580 -2,917 -16.7<br />
Unity 582 554 -28 17,475 13,150 -4,325 -24.7<br />
Warner 497 513 16 14,520 14,432 -88 -0.6<br />
Washburn 259 197 -62 7,073 4,479 -2,594 -36.7<br />
<strong>West</strong>on 485 537 52 12,070 13,183 1,113 9.2<br />
Withee 627 574 -53 18,256 16,344 -1,912 -10.5<br />
Worden 523 537 14 15,436 13,424 -2,012 -13.0<br />
York* 627 663 36 18,362 17,859 -503 -2.7<br />
Total 14,490 14,033 -457 400,441 361,563 -38,878 -9.7<br />
VILLAGES<br />
Curtiss 12 10 -2 217 135 -82 -37.8<br />
Dorchester 18 17 -1 297 205 -92 -31.0<br />
Granton 14 3 -11 132 27 -105 -79.5<br />
Unity 5 5 0 112 90 -22 -19.6<br />
Withee 14 11 -3 154 90 -64 -41.6<br />
Total 63 46 -17 912 547 -365 -40.0<br />
CITIES<br />
Abbotsford 6 4 -2 74 94 20 27.0<br />
Colby 9 0 -9 58 0 -58 -100.0<br />
Greenwood 23 19 -4 685 419 -266 -38.8<br />
Loyal 17 12 -5 322 227 -95 -29.5<br />
Neillsville 26 3 -23 408 76 -332 -81.4<br />
Owen 13 6 -7 285 67 -218 -76.5<br />
Stanley** n/a 0 0 n/a 0 0 n/a<br />
Thorp 5 48 43 47 134 87 185.1<br />
Total 99 92 -7 1879 1017 -862 -45.9<br />
COUNTY TOTAL 14,652 14,171 -481 403,232 363,127 -40,105 -9.9<br />
Source: <strong>Wisconsin</strong> Department of Revenue<br />
* Data were not available for 1990. 1989 data were used. ** Stanley was incorporated in 2002.<br />
118 Agricultural, Natural, and Cultural Resources Information
The towns of Loyal (18,459), Reseburg (18,088), York (17,859), and Beaver (17,776)<br />
have the greatest number of assessed agricultural acres (See Table 5.3). In comparison,<br />
the towns of Dewhurst, Foster, and Hewett all have less than 1,000 assessed acres in<br />
agricultural use.<br />
As shown in Table 5.3, the assessed agricultural acreage has declined by 40,105 acres<br />
from 1990 to 2007 in Clark County. The largest loss for a single community was 4,325<br />
acres occurred in Unity. Other substantial losses occurred in the towns of Thorp (-2,917),<br />
Hendren (-2,745), Grant (-2,450), Lynn (-2,365), and Pine Valley (-2,361). The<br />
cities and villages that experienced large agricultural land losses were Neillsville (-332),<br />
Greenwood (-266), and Owen (-218).<br />
In total, this amounted to a 9.9 percent reduction in assessed agricultural land in Clark<br />
County from 1990 to 2007. That is a loss of about 0.6 percent per year during that period.<br />
Of the towns, Dewhurst (-40.1 percent), Hewett (-39.6 percent), and Washburn (-36.7<br />
percent) had the largest percentage reductions in agricultural land. Of the cities and<br />
villages, the largest percentage losses of assessed agricultural lands occurred in the Colby<br />
(-100 percent), Neillsville (-81.4 percent), Granton (-79.5 percent), and Owen (-76.5<br />
percent). At the same time, the majority of the incorporated communities had percentage<br />
losses of over 30 percent.<br />
As shown in Figure 5.2 on the following page, the number of dairy farms in Clark County<br />
has continued to decrease over the past two decades, with 1,075 dairy farms comprising<br />
49 percent of the total farms in 2002. In 1987, Clark County was home to 1,508 dairy<br />
farms (69 percent of the total farms), which was 433 more dairy farms than existed in<br />
2002. This is a 29 percent decrease in the number of dairy farms in Clark County<br />
between 1987 and 2002.<br />
Hay and silage production was the most common crop in 2002, with 1,736 farms<br />
producing the crop on more than 133,000 acres. Corn production for grain and silage and<br />
soybeans represents the next most common use of these agricultural lands, with 978<br />
farms using approximately 31,000 acres for seed and grain production, and an additional<br />
505 farms cultivating 26,994 acres for soybeans.<br />
In 2002, the County ranked number two in the<br />
State for milk and other dairy products from<br />
cows, and 19 th nationally. Traditionally, the<br />
County has ranked first or second in milk and<br />
other dairy products. It also ranked 3 rd in the<br />
State for cattle and calves, 5 th for minks, and<br />
8 th for pheasants. The County ranked 2 nd for<br />
acres of forage, corn for silage, and 3 rd for<br />
acres in oats.<br />
Mauel’s Sunshine Ice Cream, Owen<br />
Clark County Conditions and Trends Report 119
Figure 5.2 - Number of Farms and Dairy Farms - 1987 to 2002 – Clark County<br />
Number of Farms<br />
2,400<br />
2,200<br />
2,000<br />
1,800<br />
1,600<br />
1,400<br />
1,200<br />
1,000<br />
800<br />
600<br />
400<br />
200<br />
0<br />
1987 1992 1997 2002<br />
Year<br />
2,400<br />
2,200<br />
2,000<br />
1,800<br />
1,600<br />
1,400<br />
1,200<br />
1,000<br />
800<br />
600<br />
400<br />
200<br />
0<br />
Number of Farms<br />
Total Farms<br />
Dairy Farms<br />
Source: U.S. Department of Agriculture, Census of Agriculture<br />
Over the past few years, Clark County has seen an increase in the number of farms that<br />
are supplying the growing number of consumers that want to purchase local food and/or<br />
organic food. Specifically for certified organic operations, Clark County had 17 certified<br />
organic farms in 2002. At this time, there are dozens of farms in Clark County that<br />
support the local and/or organic markets. These direct market farms are marketing<br />
themselves locally and regionally. In addition, Clark County currently has weekly<br />
farmers markets in Abbotsford, Greenwood, Loyal, Neillsville, Owen, and Thorp during<br />
the summer and fall months.<br />
Direct market farms have a variety of positive impacts on the environment and economy.<br />
Environmentally, farms that are organic pollute the land, ground water, or surface water,<br />
on-site and downstream, significantly less than farms that are not organic. These farms<br />
reduce the amount of energy used for the transportation aspect of agriculture.<br />
Economically, the money that is spent purchasing food from these local farms initially<br />
stays in the local/regional economy, as opposed to being sent to different regions of the<br />
country and/or outside the U.S. The money spent on direct market food is often circulated<br />
in the local economy several times, which is important in creating a sustainable local<br />
economy. Lastly, with purchasing local food, in most cases, the food is typically better<br />
quality (e.g. freshness, taste, nutrition) than food that is transported from outside the<br />
region.<br />
120 Agricultural, Natural, and Cultural Resources Information
A sample of Clark County direct market farms that cater to local and/or organic<br />
market:<br />
- Colby Cheese House - Engel’s Sugar Bush<br />
- Four Sprouts Veggies - Grassland Dairy Products<br />
- Maple Acres Sugar Bush - Maple Creek Farm and Greenhouses<br />
- RM Chicken and Ducks - Sternitzky’s Maple Syrup<br />
- Sunny Valley Farm<br />
At the same time that Clark County is experiencing an increase in the number of direct<br />
market farms, Clark County has also seen an increase in the interest and investment in<br />
renewable energy, primarily from the dairy and animal processing sectors. At this time,<br />
several farms, companies, and individuals are working on creating fuel from local<br />
sources. In addition, a variety of production operations (on-site bio-diesel and straight<br />
vegetable oil) can be found throughout the County. In regards to energy use, different<br />
units of government in Clark County are utilizing or looking into utilizing renewable<br />
energy for a variety of purposes. Lastly, Clark County has seen an increase in companies<br />
that are manufacturing goods to support this investment and entrepreneurship. As a<br />
whole, the local and organic agricultural market and renewable energy market are playing<br />
a significant role in the County’s economy.<br />
Natural Resources – Sensitive Lands<br />
In addition to the more distinct physical land features, there are other environmentally<br />
sensitive and valued land resources that should be considered for the potential impacts of<br />
growth and development activities. These areas, referred to as sensitive lands, should be<br />
identified and evaluated for their significance as a valued resource in the County. In<br />
addition, growth and development policies and management techniques will need to be<br />
established to affect the desired impacts on these resources.<br />
The following are the Sensitive Lands that are briefly reviewed and discussed in this<br />
section.<br />
Shorelands<br />
Floodplains<br />
Wetlands<br />
Steep Slopes<br />
Forests and Woodlands<br />
Grasslands and Prairie<br />
Detailed data on the encroachment and loss of many of these sensitive areas (e.g.,<br />
wetlands, steep slopes) was not readily available for inclusion in this report. WCWRPC<br />
may further supplement this information in the future as resources allow. In the interim,<br />
community-specific questions can be directed to the <strong>Wisconsin</strong> Department of Natural<br />
Resources (WisDNR). WisDNR contact information is available at their webpage,<br />
including the service centers in the region: http://dnr.wi.gov/org/caer/cs/servicecenter/.<br />
Clark County Conditions and Trends Report 121
Shorelands<br />
Shorelands provide valuable habitat for both aquatic and terrestrial animals and<br />
vegetation, and also act as buffers and thus serve to protect water quality. Shorelands are<br />
also considered prime residential building areas because of their scenic beauty.<br />
Recognizing this conflict, and to maintain the environmental, recreational, and<br />
economical quality of our water resources, the State of <strong>Wisconsin</strong> requires counties to<br />
adopt and enforce a shoreland ordinance.<br />
As required by the State, shorelands are defined as:<br />
all land within 1,000 feet of the ordinary high water mark of a lake, pond, or flowage;<br />
or<br />
all land within 300 feet of the ordinary high water mark of a river or stream or to the<br />
landward side of the floodplain, whichever is greater.<br />
Each <strong>county</strong> must meet or exceed the minimum State standards for shoreland protection.<br />
The identified shoreland areas are based on the standards as defined in the Clark County<br />
Shoreland Zoning Ordinance.<br />
Shoreland encroachment data is not readily available. However, Map 1.2 provided<br />
earlier in the report shows that many of the fastest growing municipalities in Clark<br />
County since 1970 have been those communities with significant surface water features.<br />
Likewise, these communities often have higher numbers of seasonal housing units, as<br />
shown for our region in the map below, though not all such units are in shoreland areas.<br />
There are signs that<br />
seasonal units in west<br />
central <strong>Wisconsin</strong> are<br />
increasingly becoming<br />
year-round or retirement<br />
homes. Further, with<br />
many of the prime<br />
lakefront properties<br />
already developed, there<br />
may be an increasing<br />
demand for shoreland<br />
properties on rivers.<br />
Seasonal Units in <strong>West</strong> <strong>Central</strong> <strong>Wisconsin</strong> - 2000<br />
In lieu of shoreland<br />
encroachment data, the<br />
following sub-section<br />
does include estimates of<br />
structures potentially<br />
located in the 100-year<br />
floodplain. There is a<br />
significant overlap between shorelands and 100-year floodplains, so this additional<br />
information does provide a sense of shoreland development trends in Clark County.<br />
122 Agricultural, Natural, and Cultural Resources Information
Floodplains<br />
One sensitive land feature that most residents are aware of is the floodplain, the floodprone<br />
land adjacent to water bodies. Floodplains can be desirable development areas due<br />
to the proximity to lakes, rivers, and streams, but pose problems by possibly putting<br />
residents and property at risk. Development in floodplains can also affect the<br />
environmental quality of the waterway.<br />
To better protect the residents throughout the State, and to minimize the loss of property,<br />
the State of <strong>Wisconsin</strong>, under <strong>Wisconsin</strong> Statute 87.30(1), requires counties, cities, and<br />
villages to adopt and enforce floodplain zoning. In addition, <strong>Wisconsin</strong> Administrative<br />
Code NR116, Floodplain Management Program, has been promulgated for the protection<br />
of property and public investments from the effects of flooding.<br />
Development within the floodplain is usually assessed through the use of the Flood<br />
Insurance Rate Maps (FIRM) developed by the Federal Emergency Management Agency<br />
(FEMA). Given that an update to the Clark County FIRMs should be completed within<br />
the next year, a map of the current, older FEMA 100-year floodplain boundary is not<br />
included with this report. Instead, as a possible proxy, Map 5.5 in Appendix A shows<br />
frequently flooded soils based on NRCS soils data. Regardless, it is important to<br />
remember that any such map is no substitute for site-specific analysis. Natural and human<br />
changes in the landscape and the age and accuracy of the flood insurance maps has, in<br />
some cases, limited their reliability for identifying and designating floodplains.<br />
Overall, Clark County has had a very few<br />
riverine flooding problems in recent decades<br />
with damages primarily limited to road,<br />
shoulder, and culvert washouts. Flooding<br />
problems in recent years have been more the<br />
result of stormwater runoff, rather than river<br />
or lake flooding.<br />
There have been 24 National Flooding<br />
River Flooding on Co. Highway “M”<br />
Insurance Program (NFIP) claims for Clark<br />
County from 14 different owners. Ten of<br />
these claims, representing five owners, were in unincorporated areas of the County; none<br />
of these properties appear to be located in close proximity to one another.<br />
As part of the Clark County Natural Hazards Mitigation Plan, an estimate of the number<br />
of potential structures in the 100-year floodplains within the unincorporated towns was<br />
produced. This estimate was developed using a combination of orthophotography, parcel<br />
data, and existing FEMA Flood Insurance Rate Maps (FIRMs). However, this analysis<br />
should only be used to identify general trends, since elevation data for these structures<br />
was not available and the accuracy of the FIRMs can be questionable; site specific<br />
analysis is often needed to definitively determine if a structure is located within a<br />
floodplain.<br />
Clark County Conditions and Trends Report 123
The table below identifies the numbers and types of potentially floodprone properties<br />
with structures which may be located within the 100-year floodplain for the towns of<br />
Clark County. For all improvements in rural Clark County near or potentially within<br />
floodplains, the four towns of Dewhurst, Hewett, Levis, and Pine Valley together<br />
constituted 47.4% of all assessed improvements and 51.8% of the value of all assessed<br />
improvements. As stated previously, the FIRMs which delineate the FEMA 100-year<br />
floodplain for Clark County are being updated and should become available in 2009,<br />
which will likely result in some changes to these numbers.<br />
This information can also serve as a proxy for identifying areas of shoreline<br />
encroachment. For more information on flood risks and vulnerabilities in Clark County,<br />
please refer to the Clark County Natural Hazards Mitigation Plan.<br />
Table 5.4 - Potential 100-Year Floodplain Improvements by Town – 2003 – Clark County<br />
Resi- Comm- Indu- Other Total Est. Value of<br />
Town dential ercial strial Improvements<br />
Beaver 9 9 $421,038<br />
Butler 2 2 $62,146<br />
Colby 6 1 7 $419,676<br />
Dewhurst 101 101 $6,679,130<br />
Eaton 5 5 $362,730<br />
Foster 16 1 17 $890,303<br />
Fremont 8 1 9 $571,639<br />
Grant 14 14 $879,186<br />
Green Grove 15 15 $903,645<br />
Hendren 1 1 2 $56,816<br />
Hewett 36 36 $1,508,796<br />
Hixon 19 4 23 $1,060,925<br />
Hoard 4 1 5 $252,612<br />
Levis 38 6 3 47 $2,981,253<br />
Longwood 11 11 $560,725<br />
Loyal 1 1 $61,000<br />
Lynn 6 4 1 11 $1,075,280<br />
Mayville 8 1 9 $568,706<br />
Mead 27 27 $1,244,052<br />
Mentor 19 1 20 $691,235<br />
Pine Valley 54 54 $4,002,588<br />
Reseburg 1 1 $48,976<br />
Seif 4 4 $218,848<br />
Sherman 6 2 8 $867,006<br />
Sherwood 10 10 $433,560<br />
Thorp 0 $0<br />
Unity 3 3 $179,742<br />
Warner 3 1 1 5 $322,763<br />
Washburn 17 17 $508,861<br />
<strong>West</strong>on 17 17 $712,096<br />
Withee 4 1 2 7 $464,734<br />
Worden 1 1 $50,811<br />
York 4 4 $226,592<br />
Total: 469 5 17 11 502 $29,287,470<br />
note: The above analysis did not include incorporated cities & villages in Clark County<br />
124 Agricultural, Natural, and Cultural Resources Information
Wetlands<br />
There are a number of wetland areas within the watersheds that can affect water levels of<br />
rivers and creeks flowing through Clark County (see Map 5.6 in Appendix A). Wetlands<br />
are defined by the State Statute as “an area where water is at, near, or above the land<br />
surface long enough to be capable of supporting aquatic or hydrophytic (water-loving)<br />
vegetation and which has soils indicative of wet conditions.” Wetlands may be seasonal<br />
or permanent and are commonly referred to as swamps, marshes, or bogs. Wetland plants<br />
and soils have the capacity to store and filter pollutants, replenish groundwater supplies,<br />
store floodwaters, and maintain stream flows.<br />
According to the <strong>Wisconsin</strong> Department of Natural Resources based on 1978-1979 aerial<br />
photography, Clark County has 100,338 acres of wetlands which are individually five<br />
acres or larger. This constitutes approximately 12.9 percent of the County’s total surface<br />
area. Detailed data on wetland losses in Clark County was not readily available for<br />
inclusion in this report. It has been estimated that approximately 47% of <strong>Wisconsin</strong>’s<br />
original pre-settlement wetland acreage had been lost by 1979.<br />
Steep Slopes<br />
It is generally desirable, both environmentally and economically, to avoid steep slopes<br />
and disrupting natural drainageways with construction and land development. Problems<br />
with erosion and runoff pollution can occur with development on steep slopes, and<br />
flooding and wet basements can occur with drainageway disruptions.<br />
Steep slopes are any area where the gradient of the land is 13 percent or greater (each<br />
percent of slope is measured as one unit in elevation for every 100 horizontal units).<br />
Areas having steep slopes can be categorized into three levels, 13 percent to 20 percent<br />
slope, 21 percent to 24 percent, and 25 percent and greater. Development on slopes of 13<br />
percent to 20 percent should consider direct runoff into lakes, rivers, or streams, follow<br />
State-approved construction site erosion control standards, and institute best management<br />
practices to control on-site runoff and pollution. Land with slopes of 21 percent or greater<br />
represent a definite limiting environmental condition. Development on these slopes<br />
results in high construction costs and severe erosion with resultant negative impacts to<br />
surface and ground waters. Development on slopes of 21 percent or greater is highly<br />
discouraged.<br />
Based on the Soil Survey for Clark County, there are approximately 42,680 acres that<br />
potentially have a slope of 13 percent or greater, representing 5.5 percent of the total land<br />
base. Of this, 7,331 acres (.9 percent) have slopes of 20 percent or greater. The majority<br />
of these steep slopes are located in the southwestern quarter of the County as shown on<br />
Map 5.7 in Appendix A. Additional localized and site-specific variations in topography<br />
and slope may exist. Glacial activity created some scenic topography, but may also be<br />
very sensitive to development activities.<br />
Clark County Conditions and Trends Report 125
Forests and Woodlands<br />
Forests and woodlands are an important feature of Clark County. In fact, its forests are<br />
the second most extensive land use and land cover, after agriculture. The largest<br />
concentrations of woodlands occur in the western and southern portions of the County as<br />
shown on Map 5.8 in Appendix A.<br />
Assessed forest acreage decreased by roughly 38,600 acres, or over 60 square miles,<br />
between 1990 and 2007 (see Table 5.5). This was a 23 percent decrease. Between 1990<br />
and 2007 the towns of Mead (-50.5 percent), Warner (-40.9 percent), and York (-40.2<br />
percent) saw the largest percentage decreases in assessed forested acreage. In 2007, the<br />
towns of Pine Valley (6,982), Levis (6,193), <strong>West</strong>on (5,893), and Sherwood (5,804) had<br />
the greatest amount of assessed forested acreage, respectively. At the same time, Foster<br />
(1,170), Loyal (1,614), Mayville (1,844), Withee (2,095), and York (2,371) had the least<br />
amount of assessed forested acreage. The greatest percentage increases occurred in the<br />
towns of Colby (2.4 percent), Thorp (2.4 percent), and Mayville (2.2 percent).<br />
In Clark County, woodlands are an important part of the environment, aesthetics, and<br />
economy. Woodlands provide:<br />
<br />
<br />
<br />
<br />
<br />
Habitat for a variety of plants and animals;<br />
The basic resource for many wood-based industries, including the expanding bioenergy<br />
sector;<br />
Resources for the agricultural community;<br />
An environment for recreational activities; and<br />
Scenic beauty of the landscape and the rural character of the County.<br />
Woodlands managed according to approved forest management practices can support<br />
varying and sometimes complementary objectives, such as timber production and wildlife<br />
habitat. On the other hand, strict preservation of woodlands would be unusual and<br />
reserved for the most rare and unique stands in the County.<br />
Unmanaged development and the fragmentation of woodlands in residential lots can<br />
diminish or eliminate a woodlands capacity to provide wood products, habitat for plants<br />
and animals, and aesthetic quality. Clark County has experienced a loss of some<br />
woodland acres, in part due to the subdividing of woodlands into residential lots. Because<br />
woodlands are considered a valued resource for these reasons, significant woodlands are<br />
often protected from conversion to other uses or properly managed in order to retain their<br />
desirable characteristics. For example, residential development in woodland areas could<br />
use conservation design techniques in order to allow for development while preserving<br />
the environmental and aesthetic value.<br />
126 Agricultural, Natural, and Cultural Resources Information
Table 5.5 - Assessed Forest and AG Forest Parcels and Acreage by Town – 1990 to 2007 –<br />
Clark County<br />
Total Parcels<br />
Total Acres<br />
1990 -<br />
# 2007 %<br />
Change Change 1990 2007*<br />
1990 -<br />
2007 %<br />
Change<br />
#<br />
Town 1990 2007*<br />
Change<br />
Beaver 251 219 -32 -12.7 4,279 3,537 -742 -17.3<br />
Butler 182 127 -55 -30.2 4,716 2,996 -1,720 -36.5<br />
Colby 209 223 14 6.7 2,723 2,787 64 2.4<br />
Dewhurst 227 217 -10 -4.4 6,317 4,476 -1,841 -29.1<br />
Eaton 301 231 -70 -23.3 5,522 3,379 -2,143 -38.8<br />
Foster 52 59 7 13.5 1,644 1,170 -474 -28.8<br />
Fremont 281 210 -71 -25.3 4,859 3,323 -1,536 -31.6<br />
Grant 351 338 -13 -3.7 4,738 4,417 -321 -6.8<br />
Green Grove 246 249 3 1.2 4,248 3,766 -482 -11.3<br />
Hendren 392 281 -111 -28.3 7,873 4,743 -3,130 -39.8<br />
Hewett 210 214 4 1.9 3,756 3,279 -477 -12.7<br />
Hixon 293 292 -1 -0.3 4,541 4,273 -268 -5.9<br />
Hoard 269 311 42 15.6 5,768 5,287 -481 -8.3<br />
Levis 369 361 -8 -2.2 7,670 6,193 -1,477 -19.3<br />
Longwood 234 330 96 41.0 5,122 5,093 -29 -0.6<br />
Loyal 182 149 -33 -18.1 2,414 1,614 -800 -33.1<br />
Lynn 366 318 -48 -13.1 8,389 5,371 -3,018 -36.0<br />
Mayville 181 186 5 2.8 1,804 1,844 40 2.2<br />
Mead 329 219 -110 -33.4 8,097 4,011 -4,086 -50.5<br />
Mentor 283 227 -56 -19.8 5,624 4,015 -1,609 -28.6<br />
Pine Valley 426 490 64 15.0 8,040 6,982 -1,058 -13.2<br />
Reseburg 216 198 -18 -8.3 3,428 2,976 -452 -13.2<br />
Seif 213 178 -35 -16.4 5,398 3,342 -2,056 -38.1<br />
Sherman 220 201 -19 -8.6 3,685 3,142 -543 -14.7<br />
Sherwood 246 253 7 2.8 6,635 5,804 -831 -12.5<br />
Thorp 259 238 -21 -8.1 2,911 2,982 71 2.4<br />
Unity 226 237 11 4.9 3,032 2,715 -317 -10.5<br />
Warner 239 184 -55 -23.0 6,265 3,700 -2,565 -40.9<br />
Washburn 259 253 -6 -2.3 4,952 3,929 -1,023 -20.7<br />
<strong>West</strong>on 378 331 -47 -12.4 8,088 5,893 -2,195 -27.1<br />
Withee 168 185 17 10.1 2,510 2,095 -415 -16.5<br />
Worden 266 284 18 6.8 5,957 4,859 -1,098 -18.4<br />
York* 233 196 -37 -15.9 3,968 2,371 -1,597 -40.2<br />
TOTALS 8557 7989 -568 -6.6 164,973 126,364 -38,609 -23.4<br />
Source: <strong>Wisconsin</strong> Department of Revenue<br />
* Between 2003 and 2007, the Department of Revenue changed the classification system and included the category “AG Forest”. This<br />
alteration has in most cases influenced the comparison of 2007 data and the data from the previous three years.<br />
** Data were not available for 1990. 1989 data were used.<br />
Grasslands and Prairie<br />
Parts of Clark County were originally covered by prairie, most of which does not remain<br />
today. Existing grassland areas are scattered throughout the County (Map 5.9 in<br />
Appendix A).<br />
Prairie is the term used to describe the grassland type that predominated <strong>Wisconsin</strong> prior<br />
to Euro-American settlement. Prairies are dominated by grasses and sedges, lack trees<br />
and tall shrubs, and are home to a rich variety of plants and animals. Within the prairie<br />
Clark County Conditions and Trends Report 127
designation there are variations due to soils and climate. Prairies continue to be a<br />
threatened plant community in <strong>Wisconsin</strong>. The reduction of prairie in the State means<br />
that an estimated 20 percent of the original grassland plants are considered rare in the<br />
State. Consequently, many species of plants and animals associated with <strong>Wisconsin</strong><br />
prairies are endangered, threatened or of special concern.<br />
There are few high quality prairie remnants remaining. Research shows it will take more<br />
than the preservation of these remnants to recover or retain the biodiversity this<br />
ecosystem can offer. Degraded areas that were once prairie can often be restored with<br />
moderate effort to yield a habitat suitable for most of the associated plant and animal<br />
species. Even certain managed agricultural and livestock practices can accommodate the<br />
maintenance of the open habitats needed by many grassland species. Grasslands can be<br />
restored and maintained through preserving a certain amount of open space for this type<br />
of cover as development occurs. Hence, development can occur in such a way that it can<br />
maintain sufficient grasslands for its habitat value while preserving the rural character of<br />
the landscape.<br />
Summary<br />
Numerous programs at the State and County level are available to assist local<br />
communities in their planning efforts and in the protection of local agricultural, natural,<br />
and cultural resources. Protection of such resources needs to be balanced with, and can be<br />
complementary to, other community goals as discussed in the other existing conditions<br />
sections.<br />
Agricultural Resources Conditions Summary<br />
• Agriculture is the predominant use of the land in Clark County. The 2007 assessed<br />
agricultural acreage in the County was 363,127 or about 46 percent of the total land<br />
acreage.<br />
• From 1990 to 2007, the County experienced a 9.9 percent reduction in assessed<br />
agricultural land. That is a loss of about 0.6 percent per year during that period. Of the<br />
towns, Dewhurst (-40.1 percent), Hewett (-39.6 percent), and Washburn (-36.7<br />
percent) had the largest percentage reductions in agricultural land. Of the cities and<br />
villages, the largest percentage losses of assessed agricultural lands occurred in the<br />
Colby (-100 percent), Neillsville (-81.4 percent), Granton (-79.5 percent), and Owen (-<br />
76.5 percent).<br />
• The towns of Loyal (18,459), Reseburg (18,088), York (17,859), and Beaver (17,776)<br />
have the greatest number of assessed agricultural acres. In comparison, the towns of<br />
Dewhurst, Foster, and Hewett all have less than 1,000 assessed acres in agricultural<br />
use.<br />
• In 2002, there were five more farms in Clark County than in 1987, however, between<br />
1992 and 2002, there was an increase of 190 farms in the County. The average farm<br />
size increased from 203 acres in 1987 to 210 acres in 2002.<br />
128 Agricultural, Natural, and Cultural Resources Information
• The number of dairy farms in Clark County has continued to decrease over the past<br />
two decades, with 1,075 dairy farms comprising 49 percent of the total farms in 2002.<br />
In 1987, Clark County was home to 1,508 dairy farms (69 percent of the total farms),<br />
which was 433 more dairy farms than existed in 2002. This is a 29 percent decrease in<br />
the number of dairy farms in Clark County between 1987 and 2002.<br />
• Eighty-two (82) percent of the soils in Clark County are classified as Class II or III for<br />
crop capability as prime farmlands. There are no Class I soils in the County<br />
• Clark County has seen a dramatic increase in the number of direct market farms and<br />
interest and investment in renewable energy, primarily bio-energy, in the past decade.<br />
Natural Resources Conditions Summary<br />
• Generally, the topography of Clark County is lower in the western part of the County<br />
and rises in elevation to the northeast.<br />
• Based on general soil types, 92.1 percent of the County’s land area has severe soil<br />
limitations for septic tank absorption fields. The remaining 7.9 percent of the land area<br />
has moderate limitations.<br />
• Sand and gravel resources are available throughout the County, but are more abundant<br />
near rivers.<br />
• Clark County has a total surface water area of three square miles<br />
• Clark County is located in the Lower Chippewa River Basin, Upper <strong>Wisconsin</strong> River<br />
Basin, and the Black River Water Basin.<br />
• In general, the surface water quality in the basins need improvement due to<br />
agricultural runoff and sedimentation.<br />
• Approximately 5.5 percent of Clark County has steep slopes of 13 percent or greater,<br />
on which development should be limited or discouraged.<br />
• In 2007, the combined assessed forestland acres in the unincorporated areas (minimal<br />
acres existed in incorporated areas) amounted to 126,364 acres or about 16.2 percent<br />
of the total County acreage.<br />
• Combined, assessed agricultural and forest acres account for 63 percent of the<br />
assessed land in the County.<br />
• Assessed forest and AG forest acreage decreased by roughly 38,609 acres, or almost<br />
60 square miles, between 1990 and 2007. This was a 23.4 percent decrease.<br />
• Between 1990 and 2007 the towns of Mead (-50.5 percent), Warner (-40.9 percent),<br />
and York (-40.2 percent) saw the largest percentage decreases in assessed forested<br />
acreage. In 2007, the towns of Pine Valley (6,982), Levis (6,193), <strong>West</strong>on (5,893), and<br />
Sherwood (5,804) had the greatest amount of assessed forested acreage, respectively.<br />
At the same time, Foster (1,170), Loyal (1,614), Mayville (1,844), Withee (2,095), and<br />
York (2,371) had the least amount of assessed forested acreage. The greatest<br />
percentage increases occurred in the towns of Colby (2.4 percent), Thorp (2.4<br />
percent), and Mayville (2.2 percent).<br />
Clark County Conditions and Trends Report 129
Clark County Natural Resource Maps<br />
The Clark County Resource and Land Use Atlas DVD-ROM contains resource maps in<br />
Adobe Acrobat .pdf format for Clark County and each municipality. The <strong>county</strong>-wide<br />
maps are also included within Appendix A at the end of this report. Maps 5.1–5.10 in<br />
Appendix A correspond to the previous discussion within the Agricultural, Natural, and<br />
Cultural Resources Information section.<br />
130 Agricultural, Natural, and Cultural Resources Information
6. ECONOMIC DEVELOPMENT INFORMATION<br />
Element Context<br />
Economic development as part of comprehensive planning is the process by which the<br />
Clark County community initiates and generates solutions to local economic problems.<br />
The primary purpose of economic development initiatives is to promote the stabilization,<br />
retention, or expansion of the economic base and to provide quality employment<br />
opportunities in the local governmental unit. This includes assisting existing businesses,<br />
encouraging business expansion, recruiting new businesses, and strategically planning<br />
important capital improvements and related infrastructure expenditures. Such endeavors<br />
should be guided by the vision and goals in <strong>county</strong> and local comprehensive plans to<br />
encourage efficiency and ensure a positive impact on the community.<br />
These efforts collectively build long-term local economic capacity so the community is<br />
more self-sufficient and able to better weather economic downturns. As successful<br />
economic development endeavors strengthen and diversify local economies, local<br />
businesses may locate in close proximity to the primary industry that supports them.<br />
These secondary or support businesses take advantage of economic spillovers of the<br />
primary industry. A local example of this is the close relationship between the existing<br />
agriculture and food processing industries.<br />
This information should also be considered in the context of the economic development<br />
programs, plans, and tools at work in Clark County and its communities which are<br />
identified in the Addendum: Inventory of Programs, Plans, and Land Use Policies in<br />
<strong>West</strong> <strong>Central</strong> <strong>Wisconsin</strong> compiled by WCWRPC as part of the regional comprehensive<br />
planning effort.<br />
Please note that the layout, data, and description of the economy in this section was<br />
largely compiled during the Summer of 2008 with the input of a variety of economic<br />
development agencies in the region, including economic development corporations,<br />
universities, technical colleges, and <strong>Wisconsin</strong> Department of Workforce Development.<br />
Since economic changes can occur quickly at varying levels, much of the data in this<br />
section will often require updating prior to use for specific projects or purposes.<br />
The <strong>Wisconsin</strong> Economy 2<br />
Perhaps more than many comprehensive plan elements, the local economy and economic<br />
development are influenced by regional, State, national, and global factors. As such,<br />
great uncertainty exists when analyzing and forecasting the economy.<br />
2 Unless otherwise noted, the information in this section was largely extracted from the following two<br />
sources: (1) Winters, Dennis, Chief Economist. Department of Workforce Development-Office of<br />
Economic Advisors. Data Dashboard-Statewide Analysis.<br />
. May 1, 2008. (2) <strong>Wisconsin</strong> Department of Revenue-<br />
Division of Research & Policy. <strong>Wisconsin</strong> Economic Outlook. May 2008.<br />
Clark County Conditions and Trends Report 131
Recent Economic Trends<br />
The economy is always in flux, often occurring in cycles or periods of growth, prosperity,<br />
and expansion followed by periods of decline, contraction, or recession. There is no<br />
reliable methodology to predicting such cycles, and some economists argue that these<br />
fluctuations are the result of “shocks” to the economy in terms of productivity or demand<br />
changes, and the use of the term “cycle” is a misnomer.<br />
Gross domestic product is often used to measure economic cycles, though <strong>Wisconsin</strong>’s<br />
annual average GDP has been growing quite steadily over the last decade. Instead, in<br />
order to show these economic fluctuations, Figure 6.1 charts the composite index of<br />
leading indicators between 1990 and May 2008 for <strong>Wisconsin</strong>.<br />
Leading economic indicators are based on certain economic activities which foreshadow<br />
a forthcoming economic change. In the case of Figure 6.1, the composite indicator<br />
includes average work week, overtime, job openings, new business starts, and<br />
unemployment compensation claims.<br />
Figure 6.1 – Composite Index of Leading Indicators for <strong>Wisconsin</strong> (1990-May 2008)<br />
Composite Index of Leading Indicators<br />
(1994 avg. = 100)<br />
170<br />
160<br />
150<br />
140<br />
130<br />
120<br />
110<br />
100<br />
90<br />
80<br />
70<br />
1990<br />
1991<br />
1992<br />
1993<br />
1994<br />
1995<br />
1996<br />
1997<br />
1998<br />
1999<br />
2000<br />
2001<br />
2002<br />
2003<br />
2004<br />
2005<br />
2006<br />
2007<br />
2008<br />
source: <strong>Wisconsin</strong> Office of Economic Advisors<br />
Figure 6.1 reflects the fact that <strong>Wisconsin</strong> strongly felt the economic recession that hit<br />
much of the world in the early 1990s following the October 1987 Black Monday stock<br />
market collapse, the savings and loan crisis, and the 1990 spike in oil prices at the<br />
beginning of the Gulf War. This downturn lingered in <strong>Wisconsin</strong> until 1993-1994.<br />
The <strong>Wisconsin</strong> economy grew rapidly on the “dot-com bubble” of the mid-to-late 1990s,<br />
as an exuberant market and venture capitalists speculated on the stocks of dot-com<br />
companies during a period of low interest. But in March 2000, the bubble began to burst<br />
132 Economic Development Information
and by October 2002, $5 trillion in market value of technology companies had been lost.<br />
This sudden economic decline is very apparent in Figure 6.1. Also about this time,<br />
<strong>Wisconsin</strong> and much of the world entered a period of manufacturing recession which was<br />
particularly felt in our State.<br />
Between 2004 and 2007, job growth in <strong>Wisconsin</strong> was relatively strong and the economy<br />
rebounded, though there was a noticeable shift in the new jobs being created. Much of<br />
this growth was in the services sectors, while the manufacturing industry continued to<br />
struggle with job losses.<br />
The Current Economic Slowdown<br />
Economists are in disagreement over the current extent of the economic slowdown on a<br />
national level and forecasting the economy’s future. But as of May 1, 2008, it was<br />
generally agreed that the U.S. economy overall had not yet entered a period of less than<br />
positive growth.<br />
Two significant factors have largely contributed to our nation’s current economic<br />
situation—the downturn in the housing market and escalating oil prices. As of May<br />
2008, the single-family residential housing sector had not yet hit bottom; and the market<br />
continues to be plagued by high inventories, uncertain prices, and challenges for<br />
mortgage lenders, especially for those engaging in more risky sub-prime lending.<br />
According to the <strong>Wisconsin</strong> Realtors Association, home sales in the first quarter of 2008<br />
were down 24.9 percent from the first quarter of 2007. Home prices in <strong>Wisconsin</strong> held<br />
fairly steady in 2007, though the median home price statewide declined 3.8 percent in the<br />
first quarter of 2008. This decline was still less than half of the 7.7 percent decline<br />
nationwide. Housing permits in <strong>Wisconsin</strong> have had double-digit annual declines since<br />
2004. According to the Office of Economic Advisors’ May 2008 Statewide Analysis,<br />
“[w]hile foreclosures are up in the State, <strong>Wisconsin</strong>’s housing sector is not as exposed to<br />
the mortgage/price dilemma as much as other states such as Arizona, California, Florida,<br />
Nevada, and Ohio.” 3 In<br />
fact, <strong>Wisconsin</strong> ranked 27 th<br />
nationally in foreclosures<br />
during the first quarter of<br />
2008.<br />
As shown in Figure 6.2 to<br />
the right, gasoline prices<br />
have increased tremendously<br />
since the mid part of<br />
this decade. With the<br />
record-breaking increases<br />
in the cost of oil, retail<br />
prices in the U.S. increased<br />
Figure 6.2 - Gasoline & Medical Costs Compared to<br />
Consumer Price Index: All Items<br />
220<br />
190<br />
160<br />
130<br />
100<br />
2001 = 100<br />
All items<br />
Gasoline<br />
Medical<br />
70<br />
2001 2002 2003 2004 2005 2006 2007 2008<br />
source: <strong>Wisconsin</strong> Office of Economic Advisors, May 2008.<br />
3 Ibid.<br />
Clark County Conditions and Trends Report 133
y five percent between June 2007 and June 2008. 4 Gas prices jumped by nearly onethird<br />
during this same time period. This increase in gas and energy prices has caused<br />
corresponding increases in food and other commodities, thereby decreasing household<br />
purchasing power and decreasing spending by consumers and businesses. In particular,<br />
automotive sales have been hurt as consumers hold on to their existing vehicles longer or<br />
begin to use alternative modes of transportation. General Motors has announced its intent<br />
to close its Janesville plant, which primarily makes SUVs, resulting in the loss of 2,390<br />
jobs. Major restructuring and downsizing of airlines are also taking place due to<br />
increasing costs, thereby impacting routes, availability, and shipping.<br />
The May unemployment rate for <strong>Wisconsin</strong> increased from 4.2 percent in 2007 to 4.7<br />
percent in 2008. 5 Yet, the State rate was a full one percent below the national average in<br />
May 2008; and unemployment in <strong>Wisconsin</strong> has risen at a slower rate during the past<br />
year than the national average. Since mid 2007, employment numbers in <strong>Wisconsin</strong> have<br />
been relatively flat, while the employment growth rate has been diminishing since 2004.<br />
Even though unemployment has increased and the housing- and automotive-related<br />
industries have suffered, the previously referenced Office of Economic Advisors’<br />
analysis does state that other sectors in <strong>Wisconsin</strong> are doing relatively well. “The weak<br />
dollar is benefitting exports of machinery, equipment, and agricultural commodities.<br />
Milk and grain prices are at or near record highs, although high feed prices are cutting<br />
into dairy profits.” The report goes on to note that during the previous year, 9,600 new<br />
jobs were created in the service sector, particular in the health-care industry. Business<br />
and professional services showed an annual increase of 1,800 jobs.<br />
The combination of a slowing economy and inflating prices is an added challenge to<br />
address. Interest rate cuts, a primary tool for avoiding an economic recession, can add to<br />
economic pressure. Meanwhile, the reduction in tax revenues related to decreasing<br />
development and new housing starts, combined with quickly escalating gas and<br />
commodity prices, has created a budgetary conundrum for many state, <strong>county</strong>, and local<br />
governments.<br />
<strong>Wisconsin</strong>’s Economic Outlook<br />
Forecasting the economy is difficult at best and such projections are based on historical<br />
economic fluctuations, current trends, and a variety of economic indicators. The<br />
<strong>Wisconsin</strong> Economic Outlook report issued by the <strong>Wisconsin</strong> Department of Revenue-<br />
Division of Research and Policy in May 2008 states that the <strong>Wisconsin</strong> economy is<br />
expected to slow for 2009 with the number of jobs slightly decreasing in 2008 and being<br />
steady in 2009. The following is a brief summary of the report’s employment outlook by<br />
some key industry sectors based on the most likely forecast scenario:<br />
4 Isidore, Chris. CNN Money.com. Inflation: Price Jump Worst Since ’91. June 16,<br />
2008.<br />
5 <strong>Wisconsin</strong> Department of Workforce Development. May 2008 Local Unemployment Rates Announced.<br />
press release. June 25, 2008.<br />
134 Economic Development Information
Construction - continue to decline to reach bottom by the end of 2008 and<br />
recovering positive growth toward 2010.<br />
Education, Health, Professional, & Business Services - continued growth of 1.6%<br />
to 2.4% for 2008 and 2009.<br />
Trade Transportation & Utilities - mild decreases of 0.2% to 0.5%, then<br />
recovering positive growth in 2010.<br />
Manufacturing – loss of 2% of jobs in 2008 and 2009, 0.2% loss in 2010, then<br />
recovering job growth in 2011.<br />
Natural Resources & Mining – job losses in 2008 and 2009, with growth in 2010.<br />
Leisure & Hospitality – 1.1% decline in 2009, then healthy growth rate thereafter.<br />
Financial Sector – no growth in 2008, slight growth in 2009, then healthy growth<br />
thereafter.<br />
Information Sector – slight declines or no increases until 2011.<br />
Government – 0.6% decline in 2008, slight decrease in 2009, peak in 2010 as the<br />
2010 Census is carried out.<br />
While the economy adjusts, opportunities do arise. Consumers are turning more to fuelefficient<br />
vehicles, and the sale of hybrid vehicles is increasing. Research and<br />
development funding for alternative energy and energy-reducing technology is on the<br />
increase. Greater attention is being given to the planning and use of alternative means of<br />
passenger and commercial transportation. For instance, many public transit and Amtrak<br />
services are setting new records. And increased energy costs have increased attention on<br />
land-use patterns, alternative building materials, and other related sustainability concepts.<br />
In response to these trends, the <strong>West</strong> <strong>Central</strong> <strong>Wisconsin</strong> <strong>Regional</strong> Comprehensive Plan,<br />
under development by WCWRPC, will include an energy and sustainability section<br />
analyzing and providing advisory recommendations on how these concepts may be<br />
applied within our region.<br />
Clark County Economic Profile<br />
Economic Data<br />
There is a significant amount of background data and information that is available from<br />
various public and private sources that is integrated into this document, including<br />
information from the following sources:<br />
U.S. Census Bureau data<br />
o<br />
o<br />
o<br />
American Fact Finder Fact Sheets<br />
County Business Patterns<br />
Misc. demographic and other data<br />
State of <strong>Wisconsin</strong> Department of Administration<br />
o<br />
Demographics Services Center<br />
State of <strong>Wisconsin</strong> Department of Workforce Development<br />
o County Workforce Profiles<br />
Clark County Conditions and Trends Report 135
o<br />
o<br />
County Snapshots<br />
Office of Economic Advisors<br />
State of <strong>Wisconsin</strong> Department of Revenue<br />
o<br />
<strong>Wisconsin</strong> Economic Outlook<br />
State of <strong>Wisconsin</strong> Department of Commerce<br />
University of <strong>Wisconsin</strong>-Extension<br />
<strong>West</strong> <strong>Central</strong> <strong>Wisconsin</strong> <strong>Regional</strong> <strong>Planning</strong> <strong>Commission</strong> (WCWRPC)<br />
o<br />
o<br />
County summaries available at www.wcwrpc.org<br />
Comprehensive Economic Development Strategy<br />
Indiana Business Research Center USA County Profiles<br />
Clark County and other local agencies<br />
Given the wealth of economic data available at the State, regional, <strong>county</strong>, and local<br />
levels, the plethora of specialized business studies, and the wide variety of economic<br />
models, no such compilation can truly be comprehensive in scope. As such, a<br />
community may need to consider additional studies focusing on a specific and pertinent<br />
issue or topic as their planning efforts proceed.<br />
Further, there has been no clear consensus to date in the region on a single particular data<br />
source and those economic indicators which should be used to measure economic vitality,<br />
challenges, and progress, and to allow for comparison between communities and regions.<br />
The State of <strong>Wisconsin</strong>, through the Department of Workforce Development-Office of<br />
Economic Advisors, has developed <strong>Wisconsin</strong> <strong>Regional</strong> Metrics Benchmarks with a<br />
common set of core economic, demographic, and labor market indicators.<br />
Certain types of economic data and<br />
forecasts are only available at a <strong>county</strong><br />
or regional level, and inferences must be<br />
made as to how it may be applicable for<br />
individual communities. However,<br />
earlier in the issues and opportunities<br />
section of this report, a variety of<br />
demographic, education, and labor force<br />
data tables were provided for Clark<br />
County and its municipalities. This<br />
section does not restate the data tables<br />
and maps provided earlier, but, instead,<br />
builds upon this data to provide an<br />
economic “snapshot” of Clark County.<br />
Relationship to the<br />
Issues & Opportunities Section<br />
This section relies heavily on data provided<br />
previously in the Issues and Opportunities<br />
section (Section 1). The State Comprehensive<br />
<strong>Planning</strong> Law requires that the<br />
issues and opportunities element includes a<br />
variety of economic background<br />
information, including employment<br />
forecasts, educational levels, income levels,<br />
and employment characteristics. As<br />
appropriate, this section refers back to these<br />
data tables instead of repeating them here.<br />
136 Economic Development Information
Demographic Overview<br />
Current demographic trends, including population changes and educational attainment,<br />
are important foundational factors in many economic development initiatives. The<br />
population profile describes the existing and potential labor force that may fill the jobs<br />
located in the region. Educational attainment statistics are a proxy for the general skill<br />
level of the population. And household income allows inferences to be made about<br />
discretionary spending in Clark County as a whole.<br />
Population and Labor Force<br />
As of January 1, 2008, Clark County had an estimated population of 34,589. 6<br />
This was a 3.1 percent increase since 2000. As shown previously in Table 1.3 and<br />
Map 1.2, many incorporated communities experienced decreasing population<br />
from 2000 to 2007, while the highest rates of growth occurred in some<br />
unincorporated towns, most notably the towns of Dewhurst, Pine Valley,<br />
Fremont, and Sherwood.<br />
Between 2000 and 2030, the <strong>Wisconsin</strong> Department of Administration has<br />
projected that Clark County’s population will increase by 7,276 residents (or<br />
21.7%). 7 For additional population statistics by municipality, please see Tables<br />
1.3 to 1.15 in Section 1 of this report.<br />
Between 1990 and 2000, the County’s median age increased from 33.9 years to<br />
35.9 years. The aging population of the region and County is a significant<br />
concern for the future and will place a greater emphasis on job training in the<br />
region. 8 Figure 6.3 provides a visual representation of Clark County’s labor force<br />
using <strong>Wisconsin</strong> Department of Administration population projections.<br />
Currently, most of the Clark County labor force is between the ages of 20 and 44,<br />
with a very similar number of residents ages 19 and under. Figure 6.3 shows that<br />
Clark County is expected to have a relatively young population overall compared<br />
to most counties in the region, though the number of residents ages 65 and over<br />
are increasing at the fastest pace.<br />
In short, while the County’s overall population is expected to increase 18.5<br />
percent from 2005 to 2030, the size of the primary workforce (ages 20-64) to<br />
support the local economy will only increase by 14.1 percent. Meanwhile, the<br />
number of seniors age 65 and over increases significantly.<br />
For additional insight into the Clark County labor force, the Office of Economic<br />
Advisors’ County Workforce Profiles are an excellent source and are updated<br />
annually.<br />
6 <strong>Wisconsin</strong> Department of Administration. Final Population Estimates. October, 2008.<br />
7 <strong>Wisconsin</strong> Department of Administration. Pre-Release Population Projections. October 2008.<br />
8 Dane, Andrew and Gary Paul Green. Labor Market Conditions in Barron County. University of<br />
<strong>Wisconsin</strong>-Extension. January 12, 2005.<br />
Clark County Conditions and Trends Report 137
Figure 6.3 – Clark County Age/Labor Force Projection (2005-2030)<br />
Population by Age Group<br />
12,000<br />
10,000<br />
8,000<br />
6,000<br />
0-19<br />
20-44<br />
45-64<br />
65+<br />
Age Groups<br />
4,000<br />
2005 2010 2015 2020 2025 2030<br />
Year<br />
source: <strong>Wisconsin</strong> Department of Administration, January 2004<br />
Housing Market<br />
According to data provided by the U.S. Bureau of the Census, the estimated<br />
number of single-family residential building permits issued in 1998 was 110<br />
compared to 78 in 2007, a 29 percent decrease. Clark County has had very<br />
limited multi-family unit construction during this timeframe. Building permits<br />
numbers reflect larger economic trends and can vary significantly from year to<br />
year. For instance, the highest number of units issued permits during the past<br />
decade occurred in 2004 when 152 total units valued at $17.6 million were<br />
permitted. This was about $6.7 million more in estimated construction value<br />
compared to 2007.<br />
Education<br />
As shown in Table 6.1, of the 2000 Clark County population that is 25 years and<br />
over, 75.4 percent had a high school education or higher and 10.3 percent of<br />
residents had a bachelor’s degree or higher, both of which were significantly<br />
below State averages.<br />
The demand for labor in the region is shifting toward more skilled work, although<br />
not as quickly as some other regions in the State. This trend increases the need<br />
for worker training opportunities. A strong, traditional secondary educational<br />
system and a variety of worker training programs are important factors in<br />
economic development.<br />
For more detailed data on educational attainment by municipality in Clark<br />
County, please see Table 1.15 in Section 1 of this report. The utilities and<br />
community facilities section indentifies public schools and post-secondary<br />
institutions which play key roles in supporting the training needs of Clark County<br />
businesses.<br />
138 Economic Development Information
Table 6.1 – Clark County Educational Attainment (1990, 2000)<br />
Educational Attainment (residents<br />
Clark County<br />
<strong>Wisconsin</strong><br />
25 years or older)<br />
1990 2000 90 to '00 2000<br />
% % % Change %<br />
Less than high school diploma 32.5 24.6 -24.3 15.0<br />
High school graduate 43.2 42.6 -1.4 34.6<br />
Some college, no degree 10.5 16.2 54.3 20.6<br />
Associate degree 5.2 6.2 19.2 7.5<br />
Bachelor’s degree or higher 8.6 10.3 19.8 22.5<br />
High school graduate or higher 67.5 75.4 11.7 85.1<br />
source: U.S. Census Bureau, 1990, 2000.<br />
Income and Wages<br />
Summarizing income statistics yields insight on purchasing power. The 2005<br />
median household income for Clark County was $39,593 which was 55 th in the<br />
State of <strong>Wisconsin</strong> and 84 percent of the State average. Figure 6.4 compares<br />
Clark County’s per capita personal income 9 to State averages.<br />
Figure 6.4 – Clark County vs. State Per Capita Personal Income (1997-2006)<br />
$36,000<br />
$34,000<br />
$32,000<br />
$30,000<br />
$34,405<br />
$29,022<br />
$28,000<br />
$26,000<br />
$24,000<br />
$22,000<br />
$20,000<br />
$18,000<br />
$16,000<br />
$24,514<br />
$20,734<br />
$17,507<br />
source: U.S. Department of Commerce – Bureau of Economic Analysis.<br />
<strong>Wisconsin</strong> (all)<br />
Wisc. (non-metro)<br />
Clark County<br />
About 12.0 percent of individuals in the County were below the poverty level in<br />
2005, up from 10.9 percent in 2000. For household income data by municipality,<br />
please see Tables 1.25 and 1.27 in Section 1.<br />
$24,376<br />
1997 1998 1999 2000 2001 2002 2003 2004 2005 2006<br />
9 Personal income is the income received by persons from all sources.<br />
Clark County Conditions and Trends Report 139
Overall average annual wages for Clark County increased by 16.2 percent in the<br />
six years from 2001 to 2006 as shown in Table 6.2. The biggest percentage<br />
increase was in the professional and business services industry.<br />
Table 6.2 – Clark County Average Annual Wages by Industry (2001-2006)<br />
for covered employment and wages<br />
Industry 2001 2002 2003 2004 2005 2006<br />
% change<br />
'01-'06<br />
Natural Resources $18,755 $18,389 $19,395 $20,183 $21,484 $21,765 16.0%<br />
Construction 29,145 30,796 33,691 34,058 34,742 36,388 24.9%<br />
Manufacturing 29,010 30,179 29,923 32,374 33,181 33,267 14.7%<br />
Trade, Transportation, Utilities 21,057 21,652 21,979 22,642 23,625 24,367 15.7%<br />
Financial Activities 22,252 21,451 23,161 25,197 27,337 27,725 24.6%<br />
Education & Health 24,394 24,773 26,694 27,142 28,248 28,670 17.5%<br />
Information supressed 23,074 23,897 25,773 24,784 26,284 n.a.<br />
Leisure & Hospitality 6,806 7,023 7,128 7,136 7,313 7,437 9.3%<br />
Professional & Business Services 22,557 23,859 27,147 30,646 27,911 29,712 31.7%<br />
Other Services 14,574 15,281 15,123 14,280 14,734 16,487 13.1%<br />
Public Admininistration 21,692 23,594 24,656 25,553 26,172 26,771 23.4%<br />
All Industries $23,690 $24,229 $24,877 $26,008 $26,973 $27,533 16.2%<br />
source: <strong>Wisconsin</strong> Department of Workforce Development, Office of Economic Advisors<br />
The 2006 average annual wage in Clark County was $27,533 or about 75 percent<br />
of the average <strong>Wisconsin</strong> wage for all industries ($36,830). For 2004 estimated<br />
salary and wages by occupation, please see Table 6.8 later in this section.<br />
Employment Trends<br />
Of Clark County residents 16 years of age and over, 70.6 percent were in the<br />
labor force as of 2006, above the State average of 70 percent. As the monthly<br />
employment rates presented in Figure 6.5 show, Clark County experiences a<br />
significantly higher amount of employment seasonality compared to State<br />
averages, with increased unemployment during the winter months. For example,<br />
in February 2008, the Clark County unemployment rate was 7.2 percent, but this<br />
dropped to 4.8 percent by May 2008.<br />
Historically since 1990, unemployment in Clark County has been above the State<br />
average, with the County average dropping to a low of 2.9 percent in October<br />
1999 during this timeframe. The County’s annual average unemployment rate has<br />
been fairly unchanged since 2001, hovering between 5.7 percent to 6.1 percent,<br />
and has been much improved relative to the State averages.<br />
140 Economic Development Information
Figure 6.5 – Clark Co. & <strong>Wisconsin</strong> Monthly Unemployment Rate (1990-June 2008)<br />
not seasonally adjusted<br />
12.0<br />
11.0<br />
10.0<br />
Clark County<br />
<strong>Wisconsin</strong><br />
9.0<br />
Unemployment (%)<br />
8.0<br />
7.0<br />
6.0<br />
5.0<br />
4.0<br />
3.0<br />
2.0<br />
Lines are averaged<br />
trend lines (polynomial method)<br />
for relative comparison<br />
purposes only.<br />
1990<br />
1990<br />
1991<br />
1992<br />
1993<br />
1993<br />
1994<br />
1995<br />
1996<br />
1996<br />
1997<br />
1998<br />
1999<br />
1999<br />
2000<br />
2001<br />
2002<br />
2002<br />
2003<br />
2004<br />
2005<br />
2005<br />
2006<br />
2007<br />
2008<br />
source: <strong>Wisconsin</strong> Department of Workforce Development, Office of Economic Advisors<br />
Unemployment is not only a reflection of job availability, but total available labor<br />
force. Figure 6.6 shows that the Clark County average annual labor force grew by<br />
3,079 persons or 19.8 percent from 1900 to 2007. According to the UW-<br />
Extension 2005 labor market conditions report, the region’s labor market remains<br />
tight, with most employers having a difficult time attracting and retaining<br />
qualified workers. 10 Tables 1.16 and 1.17 in Section 1 provides unemployment<br />
statistics for the 1990 and 2000 labor force by municipality.<br />
10 Dane, Andrew and Gary Paul Green. Labor Market Conditions in Barron County. University<br />
of <strong>Wisconsin</strong>-Extension. January 12, 2005.<br />
Clark County Conditions and Trends Report 141
Figure 6.6 – Clark Co. Monthly Total Potential Labor Force (1990-June 2008)<br />
not seasonally adjusted<br />
19,500<br />
19,000<br />
18,500<br />
Monthly Labor Force<br />
Average Trend Line<br />
Total Potential Labor Force<br />
18,000<br />
17,500<br />
17,000<br />
16,500<br />
16,000<br />
15,500<br />
15,000<br />
14,500<br />
1990<br />
1990<br />
1991<br />
1992<br />
1993<br />
1993<br />
1994<br />
1995<br />
1996<br />
1996<br />
1997<br />
1998<br />
1999<br />
1999<br />
2000<br />
2001<br />
2002<br />
2002<br />
2003<br />
2004<br />
2005<br />
2005<br />
2006<br />
2007<br />
2008<br />
Red line is the<br />
averaged<br />
trend line<br />
(polynomial method).<br />
source: <strong>Wisconsin</strong> Department of Workforce Development, Office of Economic Advisors<br />
142 Economic Development Information
Commuting Patterns<br />
In 2000, Clark County workers 16 years of age and over had a mean travel time of<br />
20.8 minutes; and 68.7 percent of commuting workers drove to work alone.<br />
Figure 6.7 shows that commuting distances and travel time for Clark County<br />
resident workers have been increasing, especially for those travelling farther, with<br />
fewer persons working at home. In 2000, 32.8 percent of the Clark County<br />
workforce were employed outside of Clark County.<br />
Figure 6.7 – Clark County Travel Time to Work (1990, 2000)<br />
8,000<br />
7,000<br />
1990<br />
2000<br />
7,300<br />
6,000<br />
# of Commuters<br />
5,000<br />
4,000<br />
3,000<br />
3,669 3,803 3,761<br />
4,915<br />
3,002<br />
4,139<br />
2,000<br />
1,000<br />
1,733<br />
1,268<br />
1,905<br />
0<br />
Worked at home < 10 min. 10-19 min. 20-29 min. 30+ min.<br />
Travel Time to Work<br />
source: U.S. Census<br />
Tables 1.23 and 1.24 provide statistics on travel time to work and place of work<br />
for the County and by municipality. Commuting patterns are discussed in greater<br />
detail within the transportation discussion (See Section 3. Transportation).<br />
Clark County Conditions and Trends Report 143
Economic Base<br />
While the previous sub-section focused on general economic indicators for Clark County,<br />
the following information focuses more on the different industry sectors and occupations<br />
which constitute the County’s economic base.<br />
Industry Composition<br />
According to statistics from the U.S. Bureau of the Census and Bureau of<br />
Economic Analysis for Clark County:<br />
In 2000, about 70.6% of the employed workforce were private-sector wage<br />
and salary workers; about 11.0% were government workers. About 16.6%<br />
of the workers were self-employed in a non-incorporated business<br />
In 2006, the average income per job in sole proprietorships was about 58%<br />
of the County’s total average wages and salaries per job, including<br />
employer contributions.<br />
Annual average earnings per job in 2006 was $24,503. Annual average<br />
earnings per farm proprietor was $324.<br />
As shown in Table 6.3, the construction industry has the largest number of<br />
establishments, though this number has fluctuated since 2002.<br />
Table 6.3 – Clark County Number of Establishments by Industry (1998-2006)<br />
Industry Code 1998 1999 2000 2001 2002 2003 2004 2005 2006<br />
% change<br />
'98-'06<br />
Forestry, fishing, hunting, and agri. support 7 7 9 8 9 10 10 10 11 57.1%<br />
Mining 2 2 2 2 1 1 1 2 2 0.0%<br />
Utilities 4 4 4 4 4 4 4 4 4 0.0%<br />
Construction 100 99 109 107 124 122 115 124 119 19.0%<br />
Manufacturing 88 88 87 85 88 86 86 85 82 -6.8%<br />
Wholesale trade 51 47 48 50 51 44 45 47 49 -3.9%<br />
Retail trade 133 120 121 121 126 123 121 120 114 -14.3%<br />
Transportation & warehousing 62 66 64 61 66 65 71 76 69 11.3%<br />
Information 10 10 11 10 10 10 12 12 11 10.0%<br />
Finance & insurance 44 43 43 43 44 45 43 41 44 0.0%<br />
Real estate & rental & leasing 16 14 15 14 15 14 13 12 13 -18.8%<br />
Professional, scientific & technical services 31 33 37 35 34 34 32 31 35 12.9%<br />
Management of companies & enterprises 0 0 1 1 0 0 0 0 0 n.a.<br />
Admin, support, waste mgt, remediation 12 11 8 13 11 12 11 12 15 25.0%<br />
Educational services 3 3 3 3 4 3 3 4 4 33.3%<br />
Health care and social assistance 67 62 65 65 65 59 61 66 64 -4.5%<br />
Arts, entertainment & recreation 10 11 11 11 10 12 11 13 11 10.0%<br />
Accommodation & food services 63 62 57 52 62 61 62 69 64 1.6%<br />
Other services (except public administration) 90 90 89 92 102 99 98 100 94 4.4%<br />
Unclassified/Auxillary establishments 9 11 16 11 3 2 6 4 3 -66.7%<br />
Total 802 783 800 788 829 806 805 832 808 0.7%<br />
source: U.S. Census Bureau County Business Patterns<br />
144 Economic Development Information
The construction industry also had the largest number of new establishments<br />
between 1998 and 2006 with 19. Numerous industries experienced a loss in the<br />
number of establishments during the time period, including retail, real<br />
estate/leasing, and manufacturing.<br />
Employment by Industry<br />
As shown in Table 6.4 below, employment in the services sectors (e.g.,<br />
professional, leisure, financial, and education/health) has been growing at a faster<br />
rate than the goods-producing sectors in Clark County. Only public<br />
administration saw a decrease in employment from 2001 to 2006. Employment in<br />
the natural resources industry, which is dominated by forestry and logging in<br />
Clark County, grew at the second fastest pace during the timeframe.<br />
Table 6.4 – Clark County Employment by Industry (2001-2006)<br />
Industry 2001 2002 2003 2004 2005 2006<br />
% change<br />
'01-'06<br />
Natural Resources 274 300 304 318 341 347 26.6%<br />
Construction 519 514 531 528 552 561 8.1%<br />
Manufacturing 2,835 2,709 2,818 2,809 2,922 2,969 4.7%<br />
Trade, Transportation, Utilities 1,920 1,909 1,915 2,016 2,058 2,149 11.9%<br />
Financial Activities 220 274 278 264 273 263 19.5%<br />
Education & Health 1,743 1,698 1,627 1,655 1,810 1,787 2.5%<br />
Information supressed 84 91 88 94 94 n.a.<br />
Leisure & Hospitality 532 634 712 703 668 647 21.6%<br />
Professional & Business Services 120 141 145 144 150 235 95.8%<br />
Other Services 148 146 159 176 173 171 15.5%<br />
Public Admininistration 1,044 1,011 984 977 987 974 -6.7%<br />
All Industries 9,434 9,419 9,564 9,679 10,027 10,198 8.1%<br />
source: <strong>Wisconsin</strong> Department of Workforce Development-Office of Economic Advisors<br />
These trends are consistent with the historical employment data provided<br />
previously for Clark County and its municipalities in Tables 1.19 and 1.20.<br />
However, while the historical data is arranged by Standard Industrial<br />
Classification (SIC) code, most industry data available today is organized by the<br />
North American Industry Classification System (NAICS), often making<br />
comparisons between newer and older industry data challenging.<br />
Manufacturing remains the largest industry by employment as represented in<br />
Figure 6.8. If the trends in Table 6.4 continue, the second largest employment<br />
sector—trade, transportation, and utilities—may eventually become the top<br />
employment industry in the County. Retail trade employment constitutes the<br />
largest component of the trade, transportation, and utilities industry.<br />
Clark County Conditions and Trends Report 145
Figure 6.8 – Clark County Employment by Industry (2006)<br />
Manufacturing<br />
30%<br />
Trade,<br />
Transportation,<br />
& Utilities<br />
18%<br />
Construction &<br />
Nat. Resources<br />
6%<br />
Public<br />
Admininistration<br />
4%<br />
Information &<br />
Other Services<br />
4%<br />
Leisure &<br />
Hospitality<br />
Prof., Business, 10%<br />
& Financial Services<br />
8%<br />
Education & Health<br />
18%<br />
source data:: <strong>Wisconsin</strong> Department of Workforce Development-Office of Economic Advisors<br />
As of March 2007, Clark County had 21 employers with 100 or more employees<br />
(see Table 6.5). However, the top employer on that list, Fleet Guard, Inc. has<br />
since closed. The recently opened OEM Fabricating, Inc. plant in Neillsville has<br />
somewhat lessened the impact, and likely now has over 100 employees itself.<br />
Eleven of Clark County’s top employers in Table 6.5 were manufacturing or<br />
processing companies. Four of the top employers were school districts and<br />
hospitals were two of the top 21 employers on the list. Of note, Clark County<br />
government was the second largest employer in the County in 2007.<br />
All industry groups had annual average wages below State averages. The<br />
<strong>Wisconsin</strong> Department of Workforce Development in the 2007 Polk County<br />
Workforce Profile notes that rural jobs do tend to pay less than their urban<br />
counterparts, explaining the lower wages locally in the County. Somewhat<br />
unique to Clark County however is that jobs in the construction industry, and not<br />
manufacturing, had the highest annual wage in 2006.<br />
As of 2006, 15.5% percent of Clark County jobs were in farming, of which 74.4%<br />
were sole proprietors. Clark County ranked 5 th of <strong>Wisconsin</strong>’s 72 counties in the<br />
total value of agricultural products sold in 2002.<br />
146 Economic Development Information
Table 6.5– Clark County Top Employers as of March 2007<br />
(with 100+ employees)<br />
Rank Employer Name Industry Type<br />
Employee<br />
size range<br />
1 Fleet Guard Inc Miscellaneous general purpose machinery mfg. 500-999<br />
2 County of Clark Executive & legislative offices, combined 500-999<br />
3 Memorial Hospital Inc General medical & surgical hospitals 250-499<br />
4 Grassland Dairy Products Inc Creamery butter manufacturing 100-249<br />
5 Abbyland Pork Pack Inc Animal, except poultry, slaughtering 100-249<br />
6 Colby Public School Elementary & secondary schools 100-249<br />
7 School District of Neillsville Elementary & secondary schools 100-249<br />
8 Marathon Electric Mfg Corp Motor & generator manufacturing 100-249<br />
8 Our Lady of Victory Hospital Inc General medical & surgical hospitals 100-249<br />
10 Weather Shield Mfg Inc All other plastics product manufacturing 100-249<br />
11 Blume Farms Land & Cattle Co Inc General freight trucking, long-distance TL 100-249<br />
12 Kerry Inc Spice & extract manufacturing 100-249<br />
13 Weyerhaeuser Company Miscellaneous wood product manufacturing 100-249<br />
14 Abby Vans Inc Charter bus industry 100-249<br />
15 School District of Abbotsford Elementary & secondary schools 100-249<br />
16 Loyal Public School Elementary & secondary schools 100-249<br />
17 Packaging Corp of America Corrugated & solid fiber box manufacturing 100-249<br />
18 Colonial House Health Resort Nursing care facilities 100-249<br />
19 Liberty Homes Inc Manufactured home, mobile home, manufacturing 100-249<br />
19 Thorp Public School Elementary & secondary schools 100-249<br />
21 Lynn Dairy, Inc. Cheese manufacturing 100-249<br />
21 <strong>Wisconsin</strong> Bench Institutional furniture manufacturing 100-249<br />
source: <strong>Wisconsin</strong> Department of Workforce Development-Office of Economic Advisors<br />
As noted in the U.S. Department of Agriculture Censuses, and as discussed<br />
previously in Section 5, the number of farms in Clark County continues to<br />
decrease, while average farm size has been increasing. Even with these changes<br />
in agriculture, Clark County farmers sold nearly $174.5 million worth of<br />
agricultural products in 2002, which has a significant economic impact.<br />
Ninety-one percent of this value was in livestock, poultry, and related products,<br />
rather than crop and nursery products. Clark County ranked second in the State in<br />
the sale of milk and dairy products from cows in 2002 and 19 th in the United<br />
States. The County also ranked third among <strong>Wisconsin</strong> counties in the number of<br />
cattle and calves; and ninth in the value of cattle and calf sales. The County also<br />
rank fifth in the number of mink livestock; and eighth in pheasant livestock. The<br />
top crop item was forage for hay and grass silage, etc., ranking second in the State<br />
in the production. Clark County also ranked third in the State in the production of<br />
oats and 14 th in the nation.<br />
For a more detailed discussion of employment and wage trends in Clark County,<br />
please refer to the 2007 Clark County Workforce Profile compiled by the<br />
<strong>Wisconsin</strong> Department of Workforce Development.<br />
Clark County Conditions and Trends Report 147
Employment by Occupation<br />
Like employment by industry, employment by occupation is also difficult to<br />
compare across years due to changing definitions and data-gathering approaches.<br />
Employment by occupation for 1990 and 2000 for each Clark County<br />
municipality is included in Tables 1.21 and 1.22 in Section 1 of this report.<br />
According to the 2000 U.S. Census, of the Clark County employed civilian<br />
population 16 years of age and over (15,869):<br />
28.1% were employed in management, professional, and related<br />
occupations<br />
26% were employed in production, transportation, and material moving<br />
occupations<br />
16.7% were employed in sales and office occupations<br />
14.6% were employed in service occupations<br />
Together, these four general occupation categories constitute 85.4 percent of the<br />
County’s workforce.<br />
Table 6.6 provides additional insight into the occupations of our area, but this<br />
information is available at a regional scale. Even so, these numbers are similar to<br />
the 2000 U.S. Census Bureau occupation statistics for Clark County.<br />
In the <strong>West</strong> <strong>Central</strong><br />
<strong>Wisconsin</strong> Workforce<br />
Development Area (see<br />
Figure 6.9) which<br />
includes Clark County,<br />
office and administrative<br />
support and<br />
production are the most<br />
frequent occupations,<br />
though they are below<br />
the average annual<br />
salary for the region.<br />
Figure 6.9 – <strong>West</strong> <strong>Central</strong> <strong>Wisconsin</strong><br />
Workforce Development Area<br />
source: <strong>Wisconsin</strong> Department of Workforce Development-Office of Economic Advisors<br />
148 Economic Development Information
Table 6.6 – <strong>West</strong> <strong>Central</strong> <strong>Wisconsin</strong> WDA Region<br />
Estimated Employment and Salary by Occupation (2004)<br />
Occupation<br />
2004<br />
Employ-<br />
Average<br />
Annual<br />
% of Total<br />
Employ-<br />
ment ment Salary<br />
Office and Administrative Support 27,090 15.6% $27,099<br />
Production 21,580 12.4% $28,765<br />
Sales and Related 17,120 9.8% $27,743<br />
Food Preparation and Serving Related 16,870 9.7% $16,748<br />
Transportation and Material Moving 14,670 8.4% $26,349<br />
Education, Training, and Library 11,010 6.3% $39,300<br />
Healthcare Practitioners and Technical 8,580 4.9% $49,793<br />
Construction and Extraction 7,480 4.3% $39,111<br />
Installation, Maintenance, and Repair 6,700 3.9% $34,441<br />
Management 6,070 3.5% $74,714<br />
Healthcare Support 5,830 3.4% $23,325<br />
Business and Financial Operations 5,560 3.2% $48,430<br />
Building and Grounds Cleaning and Maintenance 5,380 3.1% $22,256<br />
Personal Care and Service 4,570 2.6% $19,567<br />
Protective Service 3,260 1.9% $33,184<br />
Architecture and Engineering 2,960 1.7% $55,024<br />
Community and Social Services 2,800 1.6% $38,992<br />
Computer and Mathematical 2,060 1.2% $54,277<br />
Arts, Design, Entertainment, Sports, and Media 1,930 1.1% $33,885<br />
Life, Physical, and Social Science 1,410 0.8% $49,461<br />
Legal 670 0.4% $63,731<br />
Farming, Fishing, and Forestry 270 0.2% $24,922<br />
Total 173,880 100.0% $32,266<br />
<strong>West</strong> <strong>Central</strong> WDA includes Barron, Chippewa, Clark, Dunn, Eau Claire, Pepin, Pierce, Polk and St. Croix Counties.<br />
source: <strong>Wisconsin</strong> Department of Workforce Development-Office of Economic Advisors<br />
Clark County Conditions and Trends Report 149
Employment Projections<br />
In November 2003, the <strong>Wisconsin</strong> Department of Workforce Development<br />
(WDWD) released a publication entitled <strong>Wisconsin</strong> Projections, 2000-2010. This<br />
publication makes economic projections for the State regarding the labor force,<br />
industries, and occupations. This information was further supplemented by tenyear<br />
projections (2004-2014) by regional workforce development area (WDA).<br />
This sub-section relies, in large part, on these WDWD documents.<br />
Municipal units within Clark County have employment patterns that are similar to<br />
the State. It is anticipated that for the near future, <strong>Wisconsin</strong>’s total population<br />
will grow more slowly while average age will increase more rapidly than the<br />
nation as a whole, leading to lower participation rates in the workforce.<br />
<strong>Wisconsin</strong> is also having difficulty attracting international immigrants and<br />
domestic migrants and retaining its own citizens. <strong>Wisconsin</strong> will continue to face<br />
the challenge of filling job openings.<br />
As shown in Table 6.7, the region’s WDA industries that are projected to add the<br />
most jobs from 2004-2014 are education and health services. Ambulatory health<br />
case services jobs alone will grow 36.6 percent, reflecting, in part, our region’s<br />
aging demographic. The number of total jobs in the manufacturing industry is<br />
estimated to remain fairly unchanged during this timeframe. These projections<br />
account for anticipated changes in <strong>Wisconsin</strong>’s economy within the timeframe,<br />
though unanticipated events may impact accuracy.<br />
Education and<br />
health services<br />
jobs in the region<br />
are projected to<br />
increase<br />
greatly…<br />
…while<br />
manufacturing<br />
employment is<br />
projected to<br />
change little<br />
overall.<br />
150 Economic Development Information
Table 6.7<br />
<strong>West</strong> <strong>Central</strong> <strong>Wisconsin</strong> WDA Region Industry Projections (2004-2014)<br />
Industry Title 2004<br />
Estimated<br />
Employment<br />
2014<br />
Projected<br />
Employment<br />
2004-2014<br />
Employment<br />
Change<br />
2004-2014<br />
Percentage<br />
Change<br />
Total Non-Farm Employment 173,880 194,330 20,450 11.8%<br />
Construction/Mining/Natural<br />
Resources<br />
8,380 9,880 1,500 17.9%<br />
Manufacturing 31,990 32,030 40 0.1%<br />
Paper Manufacturing 1,720 1,720 0 0.0%<br />
Plastics and Rubber Products<br />
Manufacturing<br />
Computer and Electronic<br />
Product Manufacturing<br />
3,400 3,670 270 7.9%<br />
3,220 3,020 -200 -6.2%<br />
Trade 28,800 30,900 2,100 7.3%<br />
Food and Beverage Stores 5,040 5,250 210 4.2%<br />
Transportation and Utilities<br />
(Including US Postal)<br />
8,270 9,520 1,250 15.1%<br />
Financial Activities 7,010 7,710 700 10.0%<br />
Education and Health Services<br />
(Including gov’t)<br />
37,330 45,540 8,210 22.0%<br />
Ambulatory Health Care 5,540 7,570 2,030 36.6%<br />
Hospitals (Including gov’t) 7,050 8,640 1,590 22.6%<br />
Leisure and Hospitality 17,300 19,930 2,630 15.2%<br />
Information/Professional<br />
Services/Other Services<br />
Government (Excluding US<br />
Postal, State and Local Educ and<br />
Hospitals)<br />
21,470 24,920 3,450 16.1%<br />
13,310 13,930 620 4.7%<br />
<strong>West</strong> <strong>Central</strong> WDA includes Barron, Chippewa, Clark, Dunn, Eau Claire, Pepin, Pierce, Polk and St. Croix Counties.<br />
source: <strong>Wisconsin</strong> Dept. of Workforce Development, Bureau of Workforce Information, 2006<br />
Clark County Conditions and Trends Report 151
Table 6.8 provides the estimated employment by occupation in 2004 and<br />
projected employment occupation for 2014 in the west central WDA. Overall,<br />
total employment is expected to increase by 11.8 percent in the region from 2004<br />
to 2014, with 2,050 new jobs created annually and 4,300 job replacements<br />
annually. The largest increase in the total number of jobs is expected in the food<br />
preparation- and serving-related occupations. Large employment growth (both<br />
total and percentage) is also expected in the health care practitioners and related<br />
technical occupations. Notably, these two occupation groups have very different<br />
salary and wage estimates.<br />
Table 6.8 – <strong>West</strong> <strong>Central</strong> <strong>Wisconsin</strong> WDA Region Occupation Projections and Estimated Wages<br />
(2004-2014)<br />
Estimated Employment (<br />
Estimated Average<br />
Annual Openings<br />
Average<br />
Annual<br />
Salary<br />
<strong>West</strong> <strong>Central</strong> WDA includes Barron, Chippewa, Clark, Dunn, Eau Claire, Pepin, Pierce, Polk and St. Croix Counties.<br />
source: <strong>Wisconsin</strong> Dept. of Workforce Development – Office of Economic Advisors<br />
Estimated Salary and Wages<br />
(2005)<br />
Entry<br />
Level Experienced<br />
Hourly Hourly<br />
Wage Wage<br />
Occupational Title<br />
2004 2014 Change<br />
%<br />
Change<br />
New<br />
Jobs<br />
Replacements<br />
Total<br />
Management 6,070 6,860 790 13.0% 80 110 190 $74,714 $18.55 $44.61<br />
Business and Financial Operations 5,560 6,530 970 17.4% 100 100 200 $48,430 $13.84 $28.01<br />
Computer and Mathematical 2,060 2,570 510 24.8% 50 30 80 $54,277 $16.17 $31.06<br />
Architecture and Engineering 2,960 3,230 270 9.1% 30 70 100 $55,024 $16.79 $31.29<br />
Life, Physical, and Social Science 1,410 1,640 230 16.3% 20 30 50 $49,461 $14.58 $28.38<br />
Community and Social Services 2,800 3,300 500 17.9% 50 50 100 $38,992 $12.79 $21.73<br />
Legal 670 780 110 16.4% 10 10 20 $63,731 $13.59 $39.17<br />
Education, Training, and Library 11,010 12,740 1,730 15.7% 170 240 410 $39,300 $10.82 $22.93<br />
Arts, Design, Entertainment, Sports, and Media 1,930 2,190 260 13.5% 30 40 70 $33,885 $8.74 $20.06<br />
Healthcare Practitioners and Technical 8,580 10,920 2,340 27.3% 230 160 390 $49,793 $11.44 $30.19<br />
Healthcare Support 5,830 7,510 1,680 28.8% 170 90 260 $23,325 $8.91 $12.37<br />
Protective Service 3,260 3,480 220 6.7% 20 100 120 $33,184 $9.02 $19.42<br />
Food Preparation and Serving Related 16,870 19,260 2,390 14.2% 240 670 910 $16,748 $5.91 $9.12<br />
Building and Grounds Cleaning and Maintenance 5,380 6,290 910 16.9% 90 110 200 $22,256 $7.26 $12.42<br />
Personal Care and Service 4,570 5,640 1,070 23.4% 110 110 220 $19,567 $6.80 $10.71<br />
Sales and Related 17,120 18,320 1,200 7.0% 120 610 730 $27,743 $6.74 $16.64<br />
Office and Administrative Support 27,090 28,170 1,080 4.0% 110 640 750 $27,099 $8.57 $15.26<br />
Farming, Fishing, and Forestry 270 300 30 11.1%
Table 6.9 - <strong>West</strong> <strong>Central</strong> <strong>Wisconsin</strong> WDA Region Occupation Projections (2014)<br />
Fastest Growth<br />
Most Openings<br />
Top 10 Occupations<br />
Typically Required<br />
Education/Training<br />
Average<br />
Wage<br />
Home Health Aides 1-month on-the-job training $9.29<br />
Medical Assistants 1-12 mo. on-the-job training $12.63<br />
Network and Data Analysts Bachelor’s degree $22.19<br />
Computer Software<br />
Engineers/Applications<br />
Bachelor’s degree $37.08<br />
Personal and Home Care Aides 1-month on-the-job training $8.82<br />
Dental Assistants 1-12 mo. on-the-job training $12.50<br />
Dental Hygienists Associate degree $23.34<br />
Employment, Recruitment &<br />
Placement<br />
Bachelor’s degree $19.67<br />
Medical Records & Health Information Associate degree $12.71<br />
Occupational Therapists Master’s degree $25.53<br />
Cashiers 1-month on-the-job training $7.64<br />
Retail Salespersons 1-month on-the-job training $11.06<br />
Comb Food Prep/Serv Wrk/Incl Fast 1-month on-the-job training $7.04<br />
Waiters/Waitresses 1-month on-the-job training $7.34<br />
Registered Nurses<br />
Laborers/Freight/Stock/Material<br />
Movers/Handlers<br />
Janitors/Cleaners, except<br />
Maids/Housekeeping<br />
Associate’s or Bachelor’s<br />
degree<br />
$25.83<br />
1-month on-the-job training $10.09<br />
1-month on-the-job training $10.67<br />
Team Assemblers 1-12 mo. on-the-job training $12.94<br />
Stock Clerks/Order Fillers 1-month on-the-job training $9.47<br />
Bartenders 1-month on-the-job training $8.16<br />
<strong>West</strong> <strong>Central</strong> WDA includes Barron, Chippewa, Clark, Dunn, Eau Claire, Pepin, Pierce, Polk and St. Croix Counties.<br />
source: <strong>Wisconsin</strong> Dept. of Workforce Development, Bureau of Workforce Information, 2006<br />
Clark County Conditions and Trends Report 153
Tourism<br />
The “Fastest Growth” occupations are often referred to as “hot jobs,” with more<br />
training requirements and better wages. There are often fewer openings in these<br />
jobs since the list is based on the greatest percent change in employment; for<br />
example, an occupation that increases from 5 to 10 jobs increased 100 percent<br />
whereas an occupation that increases from 2,000 to 2,200 jobs increased only 10<br />
percent. A 2005 University of <strong>Wisconsin</strong>-Extension study states that the largest<br />
demand in the region continues to be for assemblers, processors, and laborers. 11<br />
Clark County offers a wide variety of natural, historical, and entertainment amenities and<br />
attractions. Tourism and outdoor recreation in the County often revolve around the<br />
133,000-acre County forest and other natural features, as well as local artisans,<br />
community events, and farming.<br />
The Clark County Visitor’s Guide available from the Clark County Economic<br />
Development Corporation and Tourism Bureau provides an excellent overview of the<br />
tourism opportunities in the County. Hunting and fishing are very popular, along with a<br />
variety of trails. ATV use continues to increase in popularity and the Clark County<br />
Forest boasts more than 135 miles of ATV trails. Residents and visitors can also enjoy<br />
three golf courses in the County and downhill skiing, snowboarding, and tubing at the<br />
Bruce Mound Winter Sports area.<br />
In 2000, 6.2 percent of the County’s total housing supply were seasonal or recreational<br />
units, which ranks the County 39 th in the State in the number of seasonal units, but 47 th<br />
in the State in the total of all housing units. Concentrations of seasonal housing can be<br />
found along lakes in the western and southern portions of the County, such as near Mead<br />
Lake, Rock Dam, and Lake Arbutus.<br />
Travelers also can experience the area’s history through museums and historical sites,<br />
such as the Rural Arts Museum in Colby, Reed School in the Town of Grant, and the<br />
1897 Clark County Jail Museum in<br />
Neillsville. The Highgrounds Veterans<br />
Memorial along Highway 10 west of<br />
Neillsville draws visitors from across the<br />
nation and throughout the world. Visitors can<br />
also explore the County’s many antique stores<br />
and specialty shops, perhaps following the<br />
Yellowstone Trail across the northern portion<br />
of the County. Residents and visitors alike<br />
also enjoy local, fresh foods at a variety of<br />
different farmer’s markets, roadside stands,<br />
cheese shops, and numerous specialty farms<br />
The Highgrounds Korean War Memorial<br />
and outlets.<br />
11 Ibid.<br />
154 Economic Development Information
The Economic Impact of Expenditures by Travelers on <strong>Wisconsin</strong> 2007, compiled by<br />
Davidson-Peterson & Associates, provides insight into the positive economic impacts of<br />
tourism on the Clark County economy. As shown in Figure 6.10, traveler expenditures in<br />
Clark County increased by 77 percent in the ten years between 1998 and 2007, with large<br />
increases between 2004 to 2006.<br />
Figure 6.10 - Traveler Expenditures in Clark County (1998 to 2007)<br />
$45,000,000<br />
$40,000,000<br />
$40,756,939<br />
$40,447,925<br />
$35,000,000<br />
$36,106,383<br />
$30,000,000<br />
$25,240,721<br />
$29,689,178<br />
$29,806,662<br />
$31,513,531 $32,021,971 $31,734,748<br />
$25,000,000<br />
$22,846,534<br />
$20,000,000<br />
1998 1999 2000 2001 2002 2003 2004 2005 2006 2007<br />
source: Davidson-Peterson & Associates. Economic Impact of Expenditures by Travelers on <strong>Wisconsin</strong> 2007.<br />
In 2007, travelers spent an estimated $40.4 million in Clark County, ranking the County<br />
59 th in the State for traveler spending. This was a $17.6-million increase from the<br />
amount spent ten years earlier. The study goes on to estimate that employees in Clark<br />
County directly earned over $11.1 million in wages generated from traveler spending,<br />
supporting an estimated 506 full-time equivalent jobs in 2007. Additionally, an estimated<br />
$724,230 in local revenues (e.g., sales taxes, property taxes) were collected in 2007 as a<br />
direct result of travelers in Clark County.<br />
Clark County Conditions and Trends Report 155
As Figure 6.11 shows, travelers are an<br />
important year-round contributor to the<br />
Clark County economy with 17<br />
percent of traveler expenditures made<br />
during the winter, 18 percent during<br />
the spring, 41 percent during the<br />
summer, and 24 percent in the fall in<br />
2007.<br />
Figure 6.11 - Seasonality of Traveler Expenditures<br />
in Clark County (2007)<br />
41%<br />
In summary, tourism and travelers are<br />
a significant part of the Clark County Winter Spring<br />
18%<br />
Summer Fall<br />
economy, though it does not have the<br />
source: Davidson-Peterson & Associates. Economic Impact of<br />
large events or hospitality industry Expenditures by Travelers on <strong>Wisconsin</strong> 2007.<br />
found in some parts of the State. This<br />
part of the economy is built upon the County’s heritage, natural resources, large <strong>county</strong><br />
forest, and Highways 10 and 29. The Clark County Agribusiness Campus under<br />
development would provide a potential large event destination in the County significantly<br />
increasing local tourism dollars.<br />
Tourism in Clark County is promoted by the Clark County Economic Development<br />
Corporation and Tourism Bureau, along with the Chambers of Commerce or tourism<br />
entities of individual communities. For more information on tourism in Clark County,<br />
please contact the Clark County EDC & Tourism Bureau:<br />
Clark County Economic Development Corporation & Tourism Bureau<br />
212 South Main Street P.O. Box 236<br />
Greenwood, WI 54437<br />
1-715-267-3205<br />
http://www.<strong>clark</strong>-cty-wi.org/<br />
24%<br />
17%<br />
Environmentally Contaminated Sites<br />
The State Comprehensive <strong>Planning</strong> Law (§66.1001) states that the economic<br />
development element “shall also evaluate and promote the use of environmentally<br />
contaminated sites for commercial or industrial uses.”<br />
Clark County has no properties actively receiving long-term remedial action financed<br />
under the federal Superfund program. However, numerous smaller leaking underground<br />
storage tank, environmental repair, and spill sites are located throughout the County. The<br />
<strong>Wisconsin</strong> Bureau for Remediation and Redevelopment Tracking System (BRRTS)<br />
provides an inventory of the contaminated properties and other activities related to the<br />
investigation and cleanup of contaminated soil or groundwater in <strong>Wisconsin</strong>.<br />
156 Economic Development Information
Table 6.10 at the end of this section is a list of the 199 sites in Clark County where<br />
contamination has occurred requiring significant attention, 12 including closed sites where<br />
clean-up has been completed. Of these, 73.3 percent (or 146) are associated with leaking<br />
underground storage tanks (LUSTs). The remaining 53 records are environmental repair<br />
(ERP) sites which have contaminated soil or groundwater requiring long-term attention<br />
ranging from non-LUST activities, such as industrial spills, dumping, buried containers,<br />
and landfills. The largest concentration of the sites (37) in Table 6.10 was located within<br />
the Neillsville area. Of the 199 sites, 51 remain open with some type of monitoring,<br />
investigation, or clean-up yet underway.<br />
Many, if not most, of the sites identified in Table 6.10 are currently in active use and may<br />
not be available for redevelopment activities. Further, communities will need to consider<br />
the appropriateness and land use compatibility of the redevelopment of such sites for<br />
commercial or industrial use.<br />
Redevelopment opportunities are not limited to contaminated sites. Local comprehensive<br />
planning efforts may need to identify those deteriorating structures and under-utilized<br />
properties within their communities which have potential for re-use.<br />
Summary<br />
The data presented in this report should be kept in mind as communities develop their<br />
economic development strategies. This information can highlight certain weaknesses to<br />
be mitigated, as well as existing and potential opportunities to encourage economic<br />
growth and diversification.<br />
For convenience, here are some of the highlights of the economic development section:<br />
The Clark County economy is impacted by regional, State, national, and<br />
international decisions and fluctuations. At the State level, growth has slowed,<br />
while the price of gas and commodities has inflated. Home purchases and new<br />
home construction in <strong>Wisconsin</strong> have also decreased in recent years, though<br />
foreclosure rates remain well below national averages.<br />
Clark County’s population is projected to increase 21.7% between 2000 and 2030,<br />
with the primary labor force (ages 20-64) projected to increase by 15%. The<br />
aging population of the County and region poses both labor force concerns and<br />
economic opportunities for certain industries.<br />
There is increasing demand for skilled workers in the region. Post-secondary<br />
educational attainment of County residents is significantly below the State<br />
average.<br />
Average per capita personal income and wages both remain well below the State<br />
averages, though they have been improving. The 2006 average annual wage in<br />
Clark County ($27,533) was about 75% of the average <strong>Wisconsin</strong> wage for all<br />
industries.<br />
12 Table 6.10 excludes abandoned containers and spills for which no discharge to the environment has been<br />
identified or were cleaned up quickly.<br />
Clark County Conditions and Trends Report 157
Clark County’s unemployment has most often been above the State average<br />
during the past twenty years with greater seasonal fluctuations, but has been<br />
improving relative to the State average since 2000.<br />
In 2000, 32.8% of the County’s resident labor force worked outside of Clark<br />
County, which is relatively low for the region. The average travel times to work<br />
have increased to a mean travel time to work of 20.8 minutes in 2000.<br />
The construction industry had the largest number of establishments in 2006 and<br />
the largest number of new establishments between 1998 and 2006.<br />
In 2006, 30% of employment in the County was in the manufacturing industry,<br />
which is a relatively high percentage. Natural resources industries, primary<br />
forestry, saw the largest percent increase in employment from 2001 to 2006.<br />
Public administration industry experienced a decrease in employment during the<br />
same time period.<br />
Eleven manufacturing firms were among Clark County’s employers with 100 or<br />
more employees, as well as four school districts and two hospitals.<br />
The number of farms in Clark County continues to decrease. In 2002, Clark<br />
County ranked 5 th in the State in total value of agricultural products sold, of which<br />
91% were livestock, poultry, and related products. Clark County ranked 2 nd in the<br />
State and 19 th in the U.S. in the sale of milk and dairy products.<br />
In 2006, 15.5% of Clark County jobs were in farming.<br />
The education and health services industry is expected to have the largest increase<br />
in jobs (+22%) from 2004 to 2014 in our region.<br />
The overall number of manufacturing jobs in the region is expected to remain<br />
fairly unchanged between 2004 and 2014.<br />
28.1% of the potential labor force is employed in management, professional, and<br />
related occupations and 26% are in production, transportation, and material<br />
moving occupations.<br />
The food services and the health care practitioners/technicians occupations are<br />
expected to have the greatest total number of job increases in the region from<br />
2004 to 2014.<br />
Tourism in Clark County is strongly connected to its many natural, historical, and<br />
cultural resources, County Forest, and its agricultural and dairy economy.<br />
The State BRRTS database includes 199 sites in Clark County which have had<br />
significant contamination, though many of these sites have been remediated and<br />
are now closed. Environmentally contaminated sites are sometimes left vacant<br />
and deteriorating following remediation and offer opportunities for<br />
redevelopment. Communities may identify other redevelopment opportunities at<br />
locations which are not contaminated, but may also be vacant or deteriorating.<br />
In response to economic conditions and goals, there are a variety of economic<br />
development tools that are available to municipalities, including tax incentives, creative<br />
financing and loan guarantees, and business incubator industrial parks. As shown in<br />
158 Economic Development Information
Addendum: Inventory of Programs, Plans, and Land Use Policies in <strong>West</strong> <strong>Central</strong><br />
<strong>Wisconsin</strong>, communities and economic development agencies have been very active in<br />
utilizing many of these tools and programs. This list is not all-inclusive and communities<br />
may have additional community-specific reports and services.<br />
In numerous cases, these programs will prove more accessible as municipalities band<br />
together with other organizations and jurisdictions to collaborate and mutually pursue<br />
economic development efforts. Such collaboration will maximize a municipality’s ability<br />
to catalyze additional investment and meet shared economic development goals.<br />
Clark County Conditions and Trends Report 159
Table 6.10 – Contaminated Sites in Clark County (open & closed)<br />
Municipality or<br />
Nearest Post<br />
Location Activity Status<br />
Office<br />
ABBOTSFORD ALL METAL STAMPING INC LUST CLOSED<br />
KALEPP IMPLEMENT LUST CLOSED<br />
MEIGS ASPHALT TERMINAL LUST CLOSED<br />
FOREMOST FARMS USA LUST CLOSED<br />
LAMONT PROPERTY LUST CLOSED<br />
PETRO PANTRY LUST OPEN<br />
ABBOTSFORD AUTO STOP LUST OPEN<br />
CLIFFS SERVICE LUST OPEN<br />
MCKEE AUTO SALES LUST OPEN<br />
TRI COUNTY SOIL SERVICE CENTER ERP CLOSED<br />
FOREMOST FARMS USA ERP CLOSED<br />
LAMONTS BULK PLT ERP CLOSED<br />
KALEPP BROTHERS OIL INC FORMER ERP CLOSED<br />
KALEPP BROTHERS OIL INC FORMER ERP OPEN<br />
BEAVER BEAVER TN SHED LUST CLOSED<br />
CHILI E FREMONT ELEMENTARY SCHOOL LUST CLOSED<br />
CHILI CORNERS LUST CLOSED<br />
CHILI TN LUST OPEN<br />
DAIRY CONCEPTS LUST OPEN<br />
WOLF PROPERTY LUST OPEN<br />
CHILI SERVICE & STREY PROPERTY LUST OPEN<br />
CHRISTIE KOCH REFINING CO - CHRISTIE PUMPING STATION ERP CLOSED<br />
COLBY LES MOBIL LUST CLOSED<br />
PACKAGING CORP OF AMERICA LUST CLOSED<br />
COLBY CHEESE HOUSE LUST CLOSED<br />
COLBY JR SR HIGH SCHOOL LUST CLOSED<br />
PACKAGING CORP OF AMERICA LUST CLOSED<br />
LARRY OEHMICHEN ERP CLOSED<br />
CURTISS ERDMANS SERVICE LUST CLOSED<br />
OLDE SALOON RESTAURANT LUST CLOSED<br />
BOWEN, LESTER FARM LUST CLOSED<br />
BOWEN PROPERTY LUST OPEN<br />
WALTERS GARAGE ERP CLOSED<br />
HEARTLAND COOPERATIVE SERV-CARLSON PIT SITE ERP CLOSED<br />
DORCHESTER HEARTLAND COOP CONVENIENCE STORE LUST CLOSED<br />
HEARTLAND COOP CONVENIENCE STORE LUST CLOSED<br />
DORCHESTER STATE BANK LUST CLOSED<br />
NORTHWEST HARDWOODS -A WEYERHAEUSER BUSINESS LUST CLOSED<br />
HEARTLAND COOP LUST CLOSED<br />
BAKERS GARAGE LUST CLOSED<br />
HEARTLAND ERP CLOSED<br />
HEARTLAND ERP CLOSED<br />
NORTHWEST HARDWOODS -A WEYERHAEUSER BUSINESS ERP CLOSED<br />
PURE OIL FORMER AST SITE ERP CLOSED<br />
EATON SUSA HOWARD LUST CLOSED<br />
FAIRCHILD Y BAR ESTHER LUNA ESTATE LUST OPEN<br />
FOSTER BAR TWO LUST OPEN<br />
GRANT GRANT TN SHOP LUST CLOSED<br />
160 Economic Development Information
Table 6.10 – Contaminated Sites in Clark County (open & closed) continued<br />
Municipality or<br />
Nearest Post<br />
Location Activity Status<br />
Office<br />
GRANTON GRANTON AREA SCHOOL DIST LUST CLOSED<br />
GRANTON VIL GARAGE LUST CLOSED<br />
GRANTON HARDWARE STORE FORMER LUST CLOSED<br />
CENEX SUPPLY LUST CLOSED<br />
GRANTON AREA SCHOOL DIST LUST CLOSED<br />
GRANTON VIL LUST CLOSED<br />
HUBING STANDARD LUST OPEN<br />
ZAWISLAN PROPERTY LUST OPEN<br />
KUHL IMPLEMENT LUST OPEN<br />
GRANTON VIL ERP CLOSED<br />
GRANTON INVESTIGATION ERP OPEN<br />
GARBISCH BULK PLT OLD ERP OPEN<br />
GRANTON DIESEL SPILL ERP OPEN<br />
GREENWOOD UNION 76 FORMER LUST CLOSED<br />
KWIK TRIP #315 LUST CLOSED<br />
LAND O LAKES CHEESE PLT LUST CLOSED<br />
WI DOT BRANSTITER BROS INC LUST CLOSED<br />
ARTACS PLUMBING LUST CLOSED<br />
GRASSLAND DAIRY PRODUCTS LUST CLOSED<br />
WARNER TN SHOP LUST CLOSED<br />
WEATHER SHIELD MFG INC LUST CLOSED<br />
PINES SUPER SERVICE LUST CLOSED<br />
REDVILLE DAIRY LUST CLOSED<br />
WI DOT FORD GARAGE FORMER LUST OPEN<br />
ELMDALE CHEESE FACTORY INC LUST OPEN<br />
LAND O LAKES CHEESE PLT ERP CLOSED<br />
COOPERATIVE SERVICES ERP CLOSED<br />
CENEX AST BULK FACILITY ERP OPEN<br />
GREENWOOD CTY COOPERATIVE SERVICES INC LUST CLOSED<br />
COOPERATIVE SERVICES INC ERP OPEN<br />
HUMBIRD LARSON PROPERTY LUST OPEN<br />
STANDARD BARREL CO ERP CLOSED<br />
LOYAL LOYAL CTY LUST CLOSED<br />
DAIRYLAND TRANSIT LUST CLOSED<br />
KWIK TRIP #374 LUST CLOSED<br />
CLARK CNTY GARAGE LUST CLOSED<br />
MIKES TIRE SERVICE INC LUST CLOSED<br />
NORTHSIDE ELEVATOR CO LUST CLOSED<br />
LENNIES SALES & SERVICE LUST CLOSED<br />
D C 66 SERVICE LUST CLOSED<br />
LOYAL SCHOOL COMPLEX LUST CLOSED<br />
LOYAL TN GARAGE LUST CLOSED<br />
LOYAL CANNING CORP LUST CLOSED<br />
SMITH FEED SERVICE INC LUST CLOSED<br />
ROTH MFG LUST CLOSED<br />
SEEMAN OIL LUST OPEN<br />
WI DOT 7040-04-72 DAHL MOTORS LUST OPEN<br />
PERNSTEINER GAS & OIL CO ERP CLOSED<br />
BRENNER OIL ERP CLOSED<br />
LOYAL OIL ERP CLOSED<br />
VITA PLUS CORP-SMITH FEED SERV SHOP ERP CLOSED<br />
VITA PLUS CORP-SMITH FEED SERV SHOP ERP CLOSED<br />
NORTHSIDE ELEVATOR CO ERP OPEN<br />
NORTHSIDE ELEVATOR INC - DEPOT ST ERP OPEN<br />
Clark County Conditions and Trends Report 161
Table 6.10 – Contaminated Sites in Clark County (open & closed) continued<br />
Municipality or<br />
Nearest Post<br />
Location Activity Status<br />
Office<br />
NEILLSVILLE MEMORIAL MEDICAL CENTER LUST CLOSED<br />
ROSS AUTO CLINIC LUST CLOSED<br />
NELSON PROPERTY LUST CLOSED<br />
KWIK TRIP #313 LUST CLOSED<br />
SUNBURST YOUTH HOME LUST CLOSED<br />
M & I BANK OPELT LUST CLOSED<br />
THOMAS PROPERTY LUST CLOSED<br />
GAIER CONST LUST CLOSED<br />
JEPSEN RESIDENCE LUST CLOSED<br />
G STORE INC LUST CLOSED<br />
VAN GORDENS INC LUST CLOSED<br />
TUFTS MUSEUM LUST CLOSED<br />
BOB & CARYLS IGA LUST CLOSED<br />
NEILLSVILLE CEMETERY LUST CLOSED<br />
NEILLSVILLE CTY LUST CLOSED<br />
NEILLSVILLE CTY LUST CLOSED<br />
MARY LOUS RESTAURANT LUST CLOSED<br />
ASSEMBLY OF GOD CHURCH LUST CLOSED<br />
NEILLSVILLE ROW LUST CLOSED<br />
EISENTRAUT PROPERTY LUST CLOSED<br />
ELROY INVESTMENTS LUST CLOSED<br />
LARSEN RESIDENCE LUST CLOSED<br />
OUTPOST PUB & GRUB LUST CLOSED<br />
NSPW NEILLSVILLE OFFICE LUST CLOSED<br />
CLARK CNTY HWY DEPT LUST CLOSED<br />
CLARK CNTY HWY DEPT GARAGE LUST CLOSED<br />
WI ARMY NATL GUARD NEILLSVILLE LUST CLOSED<br />
NEILLSVILLE 76 STATION LUST OPEN<br />
AUTO STOP NEILLSVILLE LUST OPEN<br />
DRESCHER OIL LUST OPEN<br />
WEDGES CREEK RESEARCH FARM ERP CLOSED<br />
NEILLSVILLE FOUNDRY (FORMER) ERP CLOSED<br />
CLARK CNTY HWY DEPT ERP CLOSED<br />
CENEX SUPPLY ERP CLOSED<br />
NEILLSVILLE OIL CO ERP CONDITIONALLY CLOSED<br />
DRESCHER OIL CO ERP OPEN<br />
BOON TRUCKING & CONSTRUCTION LLC ERP OPEN<br />
OWEN AWE FARM LUST CLOSED<br />
CLARK CNTY HEALTH CARE CENTER LUST CLOSED<br />
KNAACK ESTATE LUST CLOSED<br />
GTE NORTH INC LUST CLOSED<br />
BADGER PRECISION INC LUST CLOSED<br />
WORDEN WACHSMUTH LAW OFC LUST CLOSED<br />
KERRY INGREDIENTS LUST CLOSED<br />
OWEN WITHEE SCHOOL DIST LUST CLOSED<br />
PAITEL CITGO LUST CLOSED<br />
RIVER COUNTRY COOP FEED MILL LUST CLOSED<br />
DELS EQUIPMENT & SERVICE LUST CLOSED<br />
ZAGER PROPERTY LUST OPEN<br />
OW SPORTS LUST OPEN<br />
LAKEHEAD OWEN PUMPING STATION ERP CLOSED<br />
HEARTLAND COOP ERP OPEN<br />
OWEN CTY LF/COMPOST SITE ERP OPEN<br />
COOP SERVICES CLARK CO-OWEN FERTILIZER PLT ERP OPEN<br />
BIG BILL'S AG SERVICE - OWEN ERP OPEN<br />
162 Economic Development Information
Table 6.10 – Contaminated Sites in Clark County (open & closed) continued<br />
Municipality or<br />
Nearest Post<br />
Location Activity Status<br />
Office<br />
SHORTVILLE WI DOT SHORTVILLE STORE SITE LUST OPEN<br />
THORP THORP TN GARAGE LUST CLOSED<br />
COURTESY AUTO & TRUCK CNTR LUST CLOSED<br />
HAAS TRANSPORT INC LUST CLOSED<br />
TURENNE PROPERTY LUST CLOSED<br />
LARRYS SERVICE LUST CLOSED<br />
COZY CORNER BAR LUST CLOSED<br />
WINKLER, DAVID PROPERTY LUST CLOSED<br />
GLORY MOTOR SALES LUST CLOSED<br />
EXPRESS MART LUST CLOSED<br />
TONYS CORNER SERVICE & BAIT LUST CLOSED<br />
EXPRESS MART LUST CLOSED<br />
CLOVERDALE MFG LUST CLOSED<br />
ST BENARDS ST HELWIG PARISH LUST CLOSED<br />
DELS MOBIL LUST OPEN<br />
ACE OIL CO LUST OPEN<br />
GRABOWSKI FARM ERP CLOSED<br />
FERMANICH FUEL CO BULK FACILITY FORMER ERP CLOSED<br />
WISCONSIN CENTRAL LTD (FORMER ROYAL OIL CO) ERP CLOSED<br />
THORP BULK PLT COOP SERVICE ERP OPEN<br />
HAAS TRANSPORT INC ERP OPEN<br />
413 W BIRCH ST ERP OPEN<br />
UNITY UNITY TN HALL LUST CLOSED<br />
HARMONY COUNTRY COOP ERP OPEN<br />
WILLARD WILLARD FARM & AUTO REPAIR LUST CLOSED<br />
HENDREN TN SHOP LUST CLOSED<br />
ARLENES INN LUST OPEN<br />
ARTAC PROPERTY LUST OPEN<br />
WILLARD SNOWMOBILE CLUB LUST OPEN<br />
KIRN ROGER PROPERTY ERP CLOSED<br />
WITHEE ISAACS PRINT SHOP LUST CLOSED<br />
RYONA GARAGE LUST CLOSED<br />
WITHEE GARAGE LUST CLOSED<br />
HAYLOFT BAR LUST CLOSED<br />
TRI COUNTY EQUIPMENT INC LUST CLOSED<br />
HENE SUPPLY LUST CLOSED<br />
GERMAN HAROLD & EDNA RESIDENCE LUST CLOSED<br />
POGOS HARDWARE PLUS LUST OPEN<br />
WITHEE OIL BULK PLT ERP CLOSED<br />
PAITEL OIL CO ERP OPEN<br />
WORDEN WILLIAMS PIPELINE ERP CLOSED<br />
STANLEY CTY LF ERP OPEN<br />
source: <strong>Wisconsin</strong> BRRTS database, April 21, 2008.<br />
Clark County Conditions and Trends Report 163
164 Economic Development Information
7. LAND USE INFORMATION<br />
Element Context<br />
Land use is a critical factor in managing the future growth of any community. Land use<br />
trends indicate what changes are occurring regarding type, location and intensity of uses<br />
over time. It is these land-use changes that have to be managed in a manner that is<br />
beneficial to the residents and environment of each community.<br />
In this section is the basic land use data necessary to further explore the land use issues<br />
facing those communities participating in this planning effort, and to begin the process of<br />
developing individual community land-use plans to meet the requirements of <strong>Wisconsin</strong><br />
Comprehensive <strong>Planning</strong> Law (s. 66.1001 (2)(h), Stats.).<br />
Once developed, the resulting land-use plans will act as a sound basis for the orderly<br />
development of their communities, and will assist the communities in achieving their<br />
individual goals. Their plan, along with their selected implementation tools, will provide<br />
local governments with the ability to effectively and efficiently make public investment<br />
decisions and to work with developers to ensure private investments are compatible with<br />
the public interest.<br />
Existing Land Use and Land Use Trends<br />
The land use/land coverage acreage statistics were taken from the most recent assessment<br />
data collected by the <strong>Wisconsin</strong> Department of Revenue. This is a consistent primary<br />
source data on land use/land cover acreage for all communities in Clark County, and<br />
allows for trend analysis. These classifications are: residential, commercial, industrial<br />
(manufacturing), agricultural, forest, undeveloped lands (vacant) and other.<br />
The predominant land use in the rural areas of Clark County is agriculture, as shown<br />
below in Table 7.1 (Source: <strong>Wisconsin</strong> Department of Revenue - based on assessment<br />
record). The 1987, 1998, and 2007 land uses based on reported assessments for all<br />
communities in Clark County are presented in Tables 7.11, 7.12, and 7.13, respectively.<br />
The percent of assessed acres assessed as agriculture range from highs of 84.6 percent,<br />
80.7 percent, 79.8 percent, 78.3 percent, 78.2 percent and 77.5 percent in the towns of<br />
Loyal, Mayville, Reseburg, York, Beaver, and Colby, respectively, to lows of 7.1<br />
percent, 16.7 percent, 20.6 percent, and 22.0 percent in the towns of Dewhurst, Hewett,<br />
Foster, and Sherwood, respectively. Twenty-one of Clark County’s 33 towns (64 percent<br />
of all towns) have more than half of their assessed land assessed as agriculture. It is clear<br />
that agriculture is a significant activity in Clark County.<br />
Clark County Conditions and Trends Report 165
Table 7.1 - Clark County Land Use – 1997 and 2007<br />
Assessment Class 1997Acres Assessed 2007Acres Assessed ’97-’07% change<br />
Agricultural 376,697 363,127 -3.6<br />
Forest 160,907 126,755 -21.2<br />
Undeveloped 19,060 57,296 200.6<br />
Residential 10,485 15,053 43.5<br />
Commercial 1,249 1,571 25.8<br />
Manufacturing 1,714 1,720 0.4<br />
Other 5,754 5,720 -0.6<br />
Total 591,738 571,242 -3.5<br />
source: WiDOR<br />
Those towns that have lower agricultural acreage generally have at least one of the<br />
following factors present; higher non-farm acres, higher forested acres, or other<br />
significant natural resource lands. As expected, large amounts of commercial and<br />
industrial land occurs in the villages and cities. Incorporated communities also generally<br />
have a greater percentage and concentration of residential uses.<br />
The existing land uses in Clark County are summarized and discussed in the remainder of<br />
this section.<br />
Agricultural Land Use<br />
The assessed agricultural acreage declined by more than 55,000 acres from 1987 to 2007<br />
in Clark County. See Table 7.9. The largest acreage decrease of 5,306, 4,425 and 4,249<br />
acres occurred in the Towns of Pine Valley, Unity, and Hendren, respectively. The<br />
largest percentage decrease of 40.1 percent occurred in the Town of Dewhurst. Other<br />
substantial acreages losses occurred:<br />
Table 7.2 - Leading Acreage Loss of Agricultural Land by Municipality, 1987-2007<br />
Town Town City/Village<br />
Pine Valley -5,306 Thorp -2,796 Neillsville -343<br />
Unity -4,425 Washburn -2,437 Greenwood -226<br />
Hendren -4,249 Lynn -2,373 Owen -193<br />
Withee -4,062 Levis -2,194 Granton -118<br />
Grant -3,093 Fremont -2,029 Dorchester -104<br />
source: WiDOR<br />
There was a 13.2 percent reduction in agricultural land in Clark County from 1987 to<br />
2007. The largest percent of agricultural land reductions between 1987 and 2007 were<br />
seen by the following communities:<br />
166 Land Use Information
Table 7.3 - Leading Percentage Loss of Agricultural Land by Municipality, 1987-2007<br />
Town<br />
City/Village<br />
Dewhurst -40.1 Colby -100.0<br />
Hewitt -39.2 Neillsville -81.9<br />
Pine Valley -37.7 Granton -81.4<br />
Washburn -35.2 Owen -74.2<br />
Sherwood -34.1 Withee -45.5<br />
Foster -32.1 Greenwood -35.0<br />
Levis -32.1 Dorchester -33.7<br />
source: WiDOR<br />
Despite these losses, agriculture remains a significant use of the land in the towns of<br />
Clark County. The towns with the least percentage loss of assessed agricultural land from<br />
1987 and 2007 were: Warner (-1.2%), York (-2.7%), Green Grove (-4.5%), Beaver<br />
(-5.0%), and Hoard (-6.5%). Several communities experienced an increase in assessed<br />
agricultural land.<br />
The 2007 assessed agricultural acreage in the County was 363,127 or 64 percent of total<br />
assessed acreage. The towns with the greatest amount of assessed agricultural acres are<br />
listed in Table 7.4 below.<br />
Table 7.4 - Most Agricultural Acres by Municipality, 2007<br />
Town Acres Town Acres<br />
Loyal 18,459 Thorp 14,580<br />
Reseburg 18,088 Eaton 14,542<br />
York 17,859 Warner 14,432<br />
Beaver 17,776 Grant 14,370<br />
Sherman 16,684 Longwood 14,234<br />
Mayville 16,593 Worden 13,424<br />
Withee 16,344 <strong>West</strong>on 13,183<br />
Colby 16,209 Unity 13,150<br />
Green Grove 15,685 Hixon 13,105<br />
Fremont 14,695 Hoard 12,258<br />
source: WiDOR<br />
In 1987, ten towns had less than 10,000 assessed acres in agricultural use. In 2007, the<br />
13 towns of Butler, Dewhurst, Foster, Hendren, Hewett, Levis, Lynn, Mead, Mentor,<br />
Pine Valley, Seif, Sherwood, and Washburn all had less than 10,000 assessed acres in<br />
agricultural use. In 1987, twenty-six towns of the County’s thirty-four towns (79%) had<br />
at least half of their assessed land assessed as agriculture. In 1987, twenty towns (61%)<br />
had more than two-thirds of their assessed land assessed as agriculture and 12 towns had<br />
at least three-fourths of their assessed land assessed as agriculture. In 2007, these<br />
numbers were 21 and eight, respectively. It is clear that over the past 20 years the<br />
agricultural land base in Clark County has stayed strong.<br />
Clark County Conditions and Trends Report 167
Forest Land Use<br />
In 2007, the combined assessed acres in forestland amounted to 126,755 acres or 22<br />
percent of the total assessed acreage for the County. See Tables 7.10 and 7.13.<br />
Assessed forest acreage in Clark County decreased by 2,971 acres between 1987 and<br />
1998. The decrease in forested acreage between 1998 and 2007 quickened as assessed<br />
forest acreage decreased by 34,152 acres.<br />
Between 1987 and 2007 only one town experienced an increase in assessed forest land,<br />
Withee with 435 acres and an increase of 83.2 percent. Between 1987 and 2007 the<br />
Towns of York (-87.8 percent), Loyal (-77.1 percent), Colby (-76.9 percent), Beaver (-<br />
74.9 percent), Warner (-73.8 percent) and Fremont (-70.4 percent) experienced the<br />
greatest percentage declines in forested acreage. The City of Owen, with 18 acres, was<br />
the only incorporated community that reported assessed forested acreage in 1987.<br />
However, in 2007, the cities and villages accounted for 391 acres of assessed forest lands.<br />
In 2007, the Town of Sherwood had the greatest amount of assessed forested acreage<br />
(4,962 acres) followed by Dewhurst (4,463), and Levis (4,365). There are significant<br />
public holdings of forested lands contained in public natural resource lands which are<br />
described in the next section.<br />
Public Natural Resource<br />
Lands<br />
There are significant natural<br />
resource, forest and park lands in<br />
Clark County owned by the Clark<br />
County, the State of <strong>Wisconsin</strong> or<br />
a Town. These lands are not<br />
assessed taxes and are not recorded<br />
in the <strong>Wisconsin</strong> Department of<br />
Revenue Statement of<br />
Assessments. Table 7.5 shows the<br />
acres by town for those with more<br />
than 50 acres of public natural<br />
resource lands.<br />
Snyder Lake County Park in Town of Hewett<br />
168 Land Use Information
Table 7.5 - Public Natural Resource Lands, 2006<br />
Town Acres Town Acres<br />
Foster 43,074 Levis 5,054<br />
Hewett 16,803 Mead 3,997<br />
Dewhurst 14,074 Hixon 1,365<br />
Butler 13,711 Hoard 1,084<br />
Seif 11,716 Green Grove 628<br />
Washburn 9,160 Worden 200<br />
Mentor 9,110 Colby 89<br />
Sherwood 7,548 Pine Valley 71<br />
source: WCWRPC<br />
Residential Land Use<br />
In 2007, the assessed residential acreage in the unincorporated areas of the County was<br />
14,224, or 94.5 percent of the total assessed residential acreage in the County. This is<br />
down from 98.3 percent in 1987. The assessed residential acreage increase in<br />
unincorporated areas from 1987 to 2007 was 5,587 acres or a 65 percent increase. The<br />
towns of Pine Valley, Fremont, and Grant had the most significant residential acreage<br />
(1,320, 728, and 706 respectively) in 2007. These towns are located in the southeast<br />
portion of the County.<br />
Regarding assessed residential acreage percentage increases between 1987 and 2007, the<br />
Town of Fremont (435 percent) had the greatest increase, followed by the towns of Mead<br />
(523 percent), Grant (227 percent), Warner (178 percent), and Butler (174 percent). Other<br />
towns that have at least doubled their residential acreage between 1987 and 2007 are<br />
Beaver, Hendren, Loyal, Pine Valley, Reseburg, Sherman, Unity, <strong>West</strong>on, and Worden.<br />
The cities and villages in Clark County also saw dramatic growth in residential land.<br />
Since many communities had reporting discrepancies during the period and the<br />
assessment data are inconclusive for 1987, comparisons between 1998 and 2007 follow<br />
for incorporated areas. The communities with the largest percent change are: Abbotsford<br />
(700 percent), Neillsville (200 percent), Granton (120 percent), and Colby (108 percent).<br />
The other cities and villages experienced significant increases in residential land. See<br />
Table 7.6.<br />
Commercial Land Use<br />
Fifty-six percent of commercial lands are located in the County’s unincorporated<br />
communities. However, commercial land is often much more intensively developed and<br />
contain larger buildings in incorporated communities than the commercial land in the<br />
unincorporated areas. Current assessed commercial lands account for about three-tenths<br />
of one percent of the total County assessed acreage. Many towns have experienced a<br />
decrease in the amount of assessed commercial land use, likely due to annexation. See<br />
Table 7.7.<br />
Clark County Conditions and Trends Report 169
In 2007, the towns with the largest commercial acreage were Reseburg (115), Pine Valley<br />
(74), Hixon (71), and Grant (62). Most of these towns see much of their commercial<br />
development within the fringe of their borders with incorporated communities<br />
There were very large percentage increases in assessed commercial acreage between<br />
1987 and 2007. This consisted of the towns Reseburg (423 percent), Hixon (318 percent),<br />
Green Grove (238 percent), Unity (150 percent), and Lynn (140 percent).<br />
Industrial Land Use<br />
Assessed manufacturing acreage in the<br />
County’s unincorporated areas is<br />
significant only in few areas, often near<br />
incorporated communities or associated<br />
with food production or non-metallic<br />
mining. The majority of manufacturing<br />
land (assembly, fabrication, processing,<br />
production, etc.) is in the County’s<br />
incorporated areas. Incorporated<br />
communities account for 71.4 percent of<br />
the land assessed for manufacturing in the<br />
County. See Table 7.8.<br />
Greenwood Milk Products<br />
Manufacturing acreage decreased between 1987 and 2007 in the County’s unincorporated<br />
areas with a decline of 719 acres from 1987 to 1997 followed by an increase of 33 acres<br />
from 1997 to 2007. The towns of Dewhurst and Thorp experienced increases of 63<br />
percent and 62 percent, respectively.<br />
Hewlett and Mentor experienced 100<br />
percent increases, but their increases were<br />
from zero acres to one acre.<br />
Parrett Windows, Dorchester<br />
Of the incorporated communities most<br />
gained assessed manufacturing land<br />
between 1987 and 2007. However,<br />
Neillsville (-31.5 percent) and Thorp (-<br />
19.4 percent) both experienced a decrease.<br />
Dorchester and Owen experienced<br />
increases of over 600 percent.<br />
170 Land Use Information
Land Demand and Prices<br />
Two indicators of a dynamic economy and potentially changing land use patterns are land<br />
sales and prices. These two indicators show a demand to convert undeveloped or underdeveloped<br />
land to more intensive uses such as residential, commercial or industrial. In<br />
turn, additional community services may be needed to support this change.<br />
An indicator of the demand for various land types is the number of land sales during the<br />
year for a given community or the County. Tables 7.14 and 7.15 show the sales of<br />
agricultural lands and forested lands respectively. These lands, converted to other uses,<br />
would include those for residential development. It can be seen that there is a steady<br />
demand for these lands for their conversion to other uses. The price paid is also listed.<br />
Comparing the numbers in Table 7.15 reveals in 1998 there was a small premium (about<br />
five percent) paid for forested lands intended to stay as forest land. The trend of no<br />
significant premium has continued through 2007.<br />
In 1998, agricultural land sold for agricultural use sold for $113 more than if it was sold<br />
for other uses. In 2007, this number changed dramatically. Agricultural land sold for<br />
other uses was sold for $2,285 more than if sold for continued agricultural use. It should<br />
be noted that the number of transactions for agricultural land being sold to be converted<br />
to other uses has been roughly 10 to 20 percent of total agricultural land sales. These<br />
differences are significantly reduced when the property is without buildings.<br />
Assessment information can help indicate land prices; however, this information has<br />
certain limitations due to assessment methods, timing and whether a particular assessor<br />
has completely established current fair-market value comparables for a given community.<br />
The State of <strong>Wisconsin</strong> attempts to equalize values so communities whose assessments<br />
are in different years will have assessments that are fair. Eventually all assessments are<br />
supposed to reflect fully equalized, fair-market value of property. Tables 7.16 and 7.17<br />
presents the price per acre of various land types based on assessment.<br />
The assessments for agricultural land are dramatically altered through state law that<br />
provides for land-use value assessment. As can be seen comparing Table 7.14 with Table<br />
7.16, the use value assessment for agricultural land does not correspond to sale prices for<br />
agricultural land. Forested land in areas more suitable for conversion to residential use<br />
will generally have higher value than lands better suited for forest production.<br />
In general, land prices in Clark County have been increasing faster than the rate of<br />
inflation. This is particularly true in the last few years with annual inflation being quite<br />
low. One possible reason for this is the recent increased prices of certain crops,<br />
specifically corn. Forested land is also increasing in price at a significant rate. Tracts of<br />
forest land are often seen as lifestyle natural resource amenities, many are near public<br />
natural resource holdings, and these tracts are being converted to residential use. This is<br />
contributing to forest parcel fragmentation.<br />
Clark County Conditions and Trends Report 171
Summary<br />
Land development, the demand for housing, the transportation system, the natural<br />
environment, the extent of public services and facilities, land ownership patterns,<br />
economic activity and governmental boundaries and actions, all guide and shape the built<br />
environment and determine its impact on the natural environment. Combining these<br />
factors determines the pattern of development that occurs throughout the County. Hence,<br />
the Housing; Transportation; Agricultural, Natural and Cultural Resources, Utilities and<br />
Community Facilities; Economic Development; and, Intergovernmental Cooperation<br />
elements also contain conditions and trends that affect land use.<br />
Land-use planning is concerned with properly combining development factors to attain<br />
the optimal or desired use of land. In total, the land-use element of each community will<br />
set the proposed pattern of the physical environment for the activities of people and<br />
organizations within that community. Land-use planning depends on population and<br />
economic projections and an understanding of the interrelationship of land-use activities<br />
and types for living, livelihood and leisure. It is the interrelated nature of the components<br />
that comprise a community that make a comprehensive plan worthwhile.<br />
In regards to total units, Clark County has experienced limited residential growth in the<br />
past two decades. However, it has experienced an increase of assessed residential<br />
acreage of approximately 70 percent. Due to their parcel size, this growth can have a<br />
dramatic impact on these communities. Often development of good productive farm or<br />
forest land impacts water resources, places greater demand on roads and schools, and<br />
causes conflicts between farm and non-farm uses and forest fragmentation. From 1987 to<br />
2007, assessed residential acreage increased by about 71.3 percent <strong>county</strong>-wide while the<br />
population increased 6.4 percent. Even though the County’s population growth is not as<br />
significant as other counties in the region, if this trend continues, it will have impacts on<br />
natural resources and productive lands, demands for services, and potentially conflicts<br />
between farm and non-farm uses in Clark County.<br />
While unincorporated communities in Clark County have 56 percent of the assessed<br />
commercial land in the County, commercial assessed value per acre is almost three times<br />
higher in villages and five times higher<br />
in cities than in the towns. This<br />
indicates commercial activity in cities<br />
and villages is more intensive and<br />
includes commercial uses much larger<br />
in scale than in the towns. However,<br />
scattered local-serving, resource-based<br />
and agriculturally related commercial<br />
enterprises in the rural area serve a<br />
useful purpose in those communities.<br />
Yet, cities and villages will continue to<br />
provide more shopping opportunities.<br />
Commercial Businesses in Downtown Neillsville<br />
172 Land Use Information
Industrial activity will continue to be located throughout Clark County. More intensive<br />
activity is located in the cities and villages where urban services are available, with light<br />
fabricating and non-metallic resources extraction located in the unincorporated areas.<br />
The most prevalent land uses in Clark County are agriculture and forest. In fact, almost<br />
64 percent of the assessed land in the County is considered agricultural and 22 percent<br />
forest. When adding the acres of natural resource lands, almost 100 percent of the County<br />
is agricultural, forest, or natural resource lands. Land assessed as “undeveloped” accounts<br />
for another 10 percent of the assessed land in the County.<br />
The County experienced a 13.2 percent reduction in assessed agricultural land from 1987<br />
to 2007. It is evident that this has serious implications for towns that are losing large<br />
amounts of acreage. However, the County has not experienced as a significant decrease<br />
in agricultural land as many other counties throughout the State.<br />
Not all the land converted from agriculture is going to non-farm uses. It is likely that<br />
some of it was being converted to forested land due to programs like the Conservation<br />
Reserve Program. Productive forested land will continue to be an important part of Clark<br />
County’s landscape and economy, not only for forest products but also for recreational<br />
opportunities.<br />
Rural countryside, Town of Eaton<br />
Land-use projections are an important part of a comprehensive plan. They are a “best<br />
guess” of the amount of land that will be needed for future development and are based on<br />
population and household projections, community development standards (accepted<br />
density or intensity of various land uses) and community desires. Each community will<br />
prepare its 25-year land-use projections in five-year increments for its comprehensive<br />
plan land use element. These projections will be reflected in the individual community’s<br />
future land use maps that will show the general locations of different land uses for the<br />
next 25 years. It is from these projections and the future land use map that each<br />
community will communicate how land use change is likely to occur, influenced by how<br />
they would like it to occur.<br />
Clark County Conditions and Trends Report 173
Land Use Tables<br />
Table 7.6<br />
Assessed Residential Acres by Municipality • 1987, 1997, and 2007<br />
Clark County<br />
Total Acres 87-07 Percent 97-07 Percent<br />
Town 1987 1997 2007 Change Change<br />
Beaver 156 240 375 140.4 56.3<br />
Butler 31 61 85 174.2 39.3<br />
Colby 256 334 350 36.7 4.8<br />
Dewhurst 310 473 610 96.8 29.0<br />
Eaton 229 271 321 40.2 18.5<br />
Foster 103 155 202 96.1 30.3<br />
Fremont 136 511 728 435.3 42.5<br />
Grant 216 327 706 226.9 115.9<br />
Green Grove 240 242 308 28.3 27.3<br />
Hendren 178 254 360 102.2 41.7<br />
Hewett 352 382 487 38.4 27.5<br />
Hixon 258 482 464 79.8 -3.7<br />
Hoard 351 342 326 -7.1 -4.7<br />
Levis 463 312 418 -9.7 34.0<br />
Longwood 262 293 375 43.1 28.0<br />
Loyal 137 219 309 125.5 41.1<br />
Lynn 307 333 372 21.2 11.7<br />
Mayville 337 387 644 91.1 66.4<br />
Mead 61 85 380 523.0 347.1<br />
Mentor 264 434 521 97.3 20.0<br />
Pine Valley 637 761 1,320 107.2 73.5<br />
Reseburg 134 316 315 135.1 -0.3<br />
Seif 122 130 130 6.6 0.0<br />
Sherman 208 319 520 150.0 63.0<br />
Sherwood 206 254 395 91.7 55.5<br />
Thorp 1,198 237 361 -69.9 52.3<br />
Unity 185 324 449 142.7 38.6<br />
Warner 131 248 364 177.9 46.8<br />
Washburn 225 257 364 61.8 41.6<br />
<strong>West</strong>on 198 298 425 114.6 42.6<br />
Withee 318 279 549 72.6 96.8<br />
Worden 165 218 373 126.1 71.1<br />
York 263 290 318 20.9 9.7<br />
TOTAL 8,637 10,068 14,224 64.7 41.3<br />
Villages<br />
Curtiss n/a n/a 8 n/a n/a<br />
Dorchester 9 31 37 311.1 19.4<br />
Granton n/a 54 119 n/a 120.4<br />
Unity n/a 1 3 n/a 200.0<br />
Withee 21 31 46 119.0 48.4<br />
TOTAL 30 117 213 610.0 82.1<br />
Cities<br />
Abbotsford n/a 29 232 n/a 700.0<br />
Colby n/a 24 50 n/a 108.3<br />
Greenwood 23 66 72 213.0 9.1<br />
Loyal 26 62 62 138.5 0.0<br />
Neillsville 13 42 126 869.2 200.0<br />
Owen 59 66 69 16.9 4.5<br />
Stanley n/a n/a 1 n/a n/a<br />
Thorp n/a 1 4 n/a 300.0<br />
TOTAL 121 290 616 409.1 112.4<br />
COUNTY TOTAL 8,788 10,475 15,053 71.3 43.7<br />
Source: WI DOR<br />
174 Land Use Information
Table 7.7<br />
Assessed Commercial Acres by Municipality • 1987, 1997, and 2007<br />
Clark County<br />
Total Acres 87-07 Percent 97-07 Percent<br />
Town 1987 1997 2007 Change Change<br />
Beaver 8 4 7 -12.5 75.0<br />
Butler 1 1 1 0.0 0.0<br />
Colby 118 129 34 -71.2 -73.6<br />
Dewhurst 10 14 20 100.0 42.9<br />
Eaton 16 15 14 -12.5 -6.7<br />
Foster 5 6 8 60.0 33.3<br />
Fremont 112 95 23 -79.5 -75.8<br />
Grant 41 43 62 51.2 44.2<br />
Green Grove 16 45 54 237.5 20.0<br />
Hendren 4 5 8 100.0 60.0<br />
Hewett 34 34 35 2.9 2.9<br />
Hixon 17 20 71 317.6 255.0<br />
Hoard 2 2 2 0.0 0.0<br />
Levis 17 17 29 70.6 70.6<br />
Longwood 33 28 33 0.0 17.9<br />
Loyal 60 71 45 -25.0 -36.6<br />
Lynn 5 4 12 140.0 200.0<br />
Mayville 55 49 22 -60.0 -55.1<br />
Mead 7 9 7 0.0 -22.2<br />
Mentor 15 34 9 -40.0 -73.5<br />
Pine Valley 84 68 74 -11.9 8.8<br />
Reseburg 22 90 115 422.7 27.8<br />
Seif 1 1 1 0.0 0.0<br />
Sherman 18 18 13 -27.8 -27.8<br />
Sherwood 3 3 3 0.0 0.0<br />
Thorp 29 34 47 62.1 38.2<br />
Unity 10 24 25 150.0 4.2<br />
Warner 24 25 9 -62.5 -64.0<br />
Washburn 2 2 1 -50.0 -50.0<br />
<strong>West</strong>on 27 27 27 0.0 0.0<br />
Withee 37 33 54 45.9 63.6<br />
Worden 52 48 14 -73.1 -70.8<br />
York 4 0 4 0.0 n/a<br />
TOTAL 889 998 883 -0.7 -11.5<br />
Villages<br />
Curtiss 9 8 71 688.9 787.5<br />
Dorchester 10 22 39 290.0 77.3<br />
Granton 6 1 2 -66.7 100.0<br />
Unity n/a 1 10 n/a 900.0<br />
Withee 4 7 22 450.0 214.3<br />
TOTAL 29 39 144 396.6 269.2<br />
Cities<br />
Abbotsford n/a 18 75 n/a 316.7<br />
Colby n/a 1 1 n/a 0.0<br />
Greenwood 2 33 88 4,300.0 166.7<br />
Loyal 71 28 47 -33.8 67.9<br />
Neillsville 11 53 229 1981.8 332.1<br />
Owen 23 25 37 60.9 48.0<br />
Stanley n/a n/a 32 n/a n/a<br />
Thorp n/a 54 35 n/a -35.2<br />
TOTAL 107 212 544 408.4 156.6<br />
COUNTY TOTAL 1,025 1,249 1,571 53.3 25.8<br />
Source: WI DOR<br />
Clark County Conditions and Trends Report 175
Table 7.8<br />
Assessed Industrial Acres by Municipality • 1987, 1997, and 2007<br />
Clark County<br />
Total Acres 87-07 Percent 97-07 Percent<br />
Town 1987 1997 2007 Change Change<br />
Beaver 0 0 0 0 0<br />
Butler 0 0 0 0 0<br />
Colby 0 0 0 0 0<br />
Dewhurst 117 195 191 63.2 -2.1<br />
Eaton 411 80 86 -79.1 7.5<br />
Foster 79 0 0 -100.0 0<br />
Fremont 14 4 4 -71.4 0.0<br />
Grant 36 36 0 -100.0 -100.0<br />
Green Grove 0 0 0 0 0<br />
Hendren 13 9 9 -30.8 0.0<br />
Hewett 0 0 1 100 100<br />
Hixon 130 37 12 -90.8 -67.6<br />
Hoard 0 0 0 0 0<br />
Levis 194 194 230 18.6 18.6<br />
Longwood 89 0 0 -100.0 0<br />
Loyal 4 0 0 -100.0 0<br />
Lynn 83 88 88 6.0 0.0<br />
Mayville 1 1 0 -100.0 -100.0<br />
Mead 43 0 0 -100.0 0<br />
Mentor 0 1 1 100 0.0<br />
Pine Valley 77 38 40 -48.1 5.3<br />
Reseburg 2 3 3 50.0 0.0<br />
Seif 40 40 42 5.0 5.0<br />
Sherman 0 0 0 0 0<br />
Sherwood 0 0 0 0 0<br />
Thorp 79 79 128 62.0 62.0<br />
Unity 16 2 2 -87.5 0.0<br />
Warner 305 338 349 14.4 3.3<br />
Washburn 0 0 0 0 0<br />
<strong>West</strong>on 172 39 39 -77.3 0.0<br />
Withee 0 0 0 0 0<br />
Worden 3 5 3 0.0 -40.0<br />
York 6 6 0 -100.0 -100.0<br />
TOTAL 1,914 1,195 1,228 -35.8 2.8<br />
Villages<br />
Curtiss n/a 4 4 n/a 0.0<br />
Dorchester 19 119 141 642.1 18.5<br />
Granton n/a 0 0 n/a 0<br />
Unity n/a 2 2 n/a 0.0<br />
Withee n/a 8 12 n/a 50.0<br />
TOTAL 19 133 159 736.8 19.5<br />
Cities<br />
Abbotsford 23 26 28 21.7 7.7<br />
Colby n/a 7 7 n/a 0.0<br />
Greenwood 49 114 114 132.7 0.0<br />
Loyal 21 35 36 71.4 2.9<br />
Neillsville 73 66 50 -31.5 -24.2<br />
Owen 10 84 73 630.0 -13.1<br />
Stanley n/a n/a 0 n/a n/a<br />
Thorp 31 54 25 -19.4 -53.7<br />
TOTAL 207 386 333 60.9 -13.7<br />
COUNTY TOTAL 2,140 1,714 1,720 -19.6 0.4<br />
Source: WI DOR.<br />
176 Land Use Information
Table 7.9<br />
Assessed Agricultural Parcels and Acreage by Municipality • 1987, 1997, and 2007<br />
Clark County<br />
Total Parcels Total Acres 1987-2007<br />
Acres<br />
1997-2007<br />
Acres<br />
Town 1987 1997 2007 1987 1997 2007 % Change % Change<br />
Beaver 603 623 650 18,706 17,679 17,776 -5.0 0.5<br />
Butler 88 93 98 2,045 1,768 2,230 9.0 26.1<br />
Colby 567 587 600 17,462 16,987 16,209 -7.2 -4.6<br />
Dewhurst 32 35 16 710 709 425 -40.1 -40.1<br />
Eaton 497 502 528 16,361 14,012 14,542 -11.1 3.8<br />
Foster 28 25 17 623 575 423 -32.1 -26.4<br />
Fremont 591 578 546 16,724 15,952 14,695 -12.1 -7.9<br />
Grant 680 688 584 17,463 16,403 14,370 -17.7 -12.4<br />
Green Grove 557 564 579 16,421 16,154 15,685 -4.5 -2.9<br />
Hendren 462 474 352 13,342 11,558 9,093 -31.8 -21.3<br />
Hewett 87 87 57 1,462 1,384 889 -39.2 -35.8<br />
Hixon 547 528 516 14,441 13,850 13,105 -9.3 -5.4<br />
Hoard 464 462 479 13,110 12,803 12,258 -6.5 -4.3<br />
Levis 246 248 243 6,840 5,144 4,646 -32.1 -9.7<br />
Longwood 548 554 577 15,855 15,537 14,234 -10.2 -8.4<br />
Loyal 654 656 655 19,844 18,875 18,459 -7.0 -2.2<br />
Lynn 441 469 388 10,817 10,516 8,444 -21.9 -19.7<br />
Mayville 608 613 607 18,268 17,655 16,593 -9.2 -6.0<br />
Mead 229 223 176 6,024 5,824 5,003 -16.9 -14.1<br />
Mentor 288 246 245 6,824 6,015 5,951 -12.8 -1.1<br />
Pine Valley 565 508 493 14,075 9,763 8,769 -37.7 -10.2<br />
Reseburg 597 588 596 19,445 18,588 18,088 -7.0 -2.7<br />
Seif 174 174 158 4,158 3,934 3,231 -22.3 -17.9<br />
Sherman 622 623 593 18,220 17,219 16,684 -8.4 -3.1<br />
Sherwood 128 117 102 3,503 2,827 2,310 -34.1 -18.3<br />
Thorp 625 635 603 17,376 17,107 14,580 -16.1 -14.8<br />
Unity 582 586 554 17,575 16,715 13,150 -25.2 -21.3<br />
Warner 502 499 513 14,607 14,408 14,432 -1.2 0.2<br />
Washburn 257 266 197 6,916 6,912 4,479 -35.2 -35.2<br />
<strong>West</strong>on 484 486 537 12,144 11,805 13,183 8.6 11.7<br />
Withee 631 620 574 20,406 17,871 16,344 -19.9 -8.5<br />
Worden 527 531 537 15,418 15,227 13,424 -12.9 -11.8<br />
York 619 639 663 18,362 18,190 17,859 -2.7 -1.8<br />
TOTAL 14,530 14,527 14,033 415,547 389,966 361,563 -13.0 -7.3<br />
Villages<br />
Curtiss 10 13 10 115 203 135 17.4 -33.5<br />
Dorchester 18 16 17 309 274 205 -33.7 -25.2<br />
Granton 16 9 3 145 91 27 -81.4 -70.3<br />
Unity 5 5 5 112 70 90 -19.6 28.6<br />
Withee 13 16 11 165 188 90 -45.5 -52.1<br />
TOTAL 62 59 46 846 826 547 -35.3 -33.8<br />
Cities<br />
Abbotsford 6 4 4 74 117 94 27.0 -19.7<br />
Colby 13 2 0 66 36 0 -100.0 -100.0<br />
Greenwood 25 23 19 645 679 419 -35.0 -38.3<br />
Loyal 18 14 12 322 284 227 -29.5 -20.1<br />
Neillsville 36 18 3 419 352 76 -81.9 -78.4<br />
Owen 13 12 6 260 262 67 -74.2 -74.4<br />
Stanley n/a n/a 0 n/a n/a 0 n/a n/a<br />
Thorp 5 5 48 47 47 134 185.1 185.1<br />
TOTAL 116 78 92 1,833 1,777 1,017 -44.5 -42.8<br />
COUNTY TOTAL 14,708 14,664 14,171 418,226 392,569 363,127 -13.2 -7.5<br />
Source: WI DOR<br />
Clark County Conditions and Trends Report 177
Table 7.10<br />
Assessed Forest Parcels and Acreage by Town • 1987, 1997, and 2007<br />
Clark County<br />
Total Parcels<br />
Total Acres<br />
Town 1987 1997 2007 1987-1997<br />
% Change<br />
1997-2007<br />
% Change<br />
1987 1997 2007 1987-1997<br />
% Change<br />
1997-2007<br />
% Change<br />
1987-2007<br />
% Change<br />
Beaver 203 251 44 23.6 -82.5 3,790 4,265 951 12.5 -77.7 -74.9<br />
Butler 183 180 84 -1.6 -53.3 4,921 4,858 2,084 -1.3 -57.1 -57.7<br />
Colby 213 211 36 -0.9 -82.9 2,877 2,706 665 -5.9 -75.4 -76.9<br />
Dewhurst 225 241 215 7.1 -10.8 6,384 5,806 4,463 -9.1 -23.1 -30.1<br />
Eaton 169 302 63 78.7 -79.1 3,584 5,341 3,379 49.0 -36.7 -5.7<br />
Foster 52 59 53 13.5 -10.2 1,675 1,443 1,113 -13.9 -22.9 -33.6<br />
Fremont 268 279 65 4.1 -76.7 5,009 4,629 1,483 -7.6 -68.0 -70.4<br />
Grant 252 350 122 38.9 -65.1 4,211 4,708 1,920 11.8 -59.2 -54.4<br />
Green Grove 284 262 72 -7.7 -72.5 4,383 4,418 1,376 0.8 -68.9 -68.6<br />
Hendren 267 384 174 43.8 -54.7 6,924 7,409 3,350 7.0 -54.8 -51.6<br />
Hewett 210 209 177 -0.5 -15.3 3,847 3,580 2,683 -6.9 -25.1 -30.3<br />
Hixon 293 280 114 -4.4 -59.3 4,581 4,416 1,999 -3.6 -54.7 -56.4<br />
Hoard 266 291 121 9.4 -58.4 5,935 6,550 2,848 10.4 -56.5 -52.0<br />
Levis 360 378 236 5.0 -37.6 7,575 7,689 4,365 1.5 -43.2 -42.4<br />
Longwood 228 240 98 5.3 -59.2 4,997 5,153 2,277 3.1 -55.8 -54.4<br />
Loyal 145 190 28 31.0 -85.3 1,918 2,425 439 26.4 -81.9 -77.1<br />
Lynn 364 357 191 -1.9 -46.5 8,652 7,507 3,549 -13.2 -52.7 -59.0<br />
Mayville 184 181 32 -1.6 -82.3 1,794 1,783 498 -0.6 -72.1 -72.2<br />
Mead 356 277 155 -22.2 -44.0 9,142 6,219 2,961 -32.0 -52.4 -67.6<br />
Mentor 280 266 130 -5.0 -51.1 5,461 5,397 2,723 -1.2 -49.5 -50.1<br />
Pine Valley 236 503 257 113.1 -48.9 5,215 8,499 3,911 63.0 -54.0 -25.0<br />
Reseburg 184 200 52 8.7 -74.0 3,288 3,254 1,063 -1.0 -67.3 -67.7<br />
Seif 219 200 103 -8.7 -48.5 5,834 5,125 2,225 -12.2 -56.6 -61.9<br />
Sherman 183 219 61 19.7 -72.1 2,228 3,668 1,283 64.6 -65.0 -42.4<br />
Sherwood 252 275 196 9.1 -28.7 6,944 7,140 4,962 2.8 -30.5 -28.5<br />
Thorp 214 258 65 20.6 -74.8 2,669 2,891 820 8.3 -71.6 -69.3<br />
Unity 229 227 84 -0.9 -63.0 3,069 3,142 1,317 2.4 -58.1 -57.1<br />
Warner 244 234 81 -4.1 -65.4 6,410 5,985 1,682 -6.6 -71.9 -73.8<br />
Washburn 267 256 175 -4.1 -31.6 5,114 4,882 3,164 -4.5 -35.2 -38.1<br />
<strong>West</strong>on 381 390 154 2.4 -60.5 8,641 7,944 3,129 -8.1 -60.6 -63.8<br />
Withee 28 168 60 500.0 -64.3 523 2,475 958 373.2 -61.3 83.2<br />
Worden 279 267 91 -4.3 -65.9 6,261 5,702 2,209 -8.9 -61.3 -64.7<br />
York 234 241 36 3.0 -85.1 4,006 3,824 487 -4.5 -87.3 -87.8<br />
TOTALS 7,752 8,626 3,625 11.3 -58.0 157,862 160,833 72,336 1.9 -55.0 -54.2<br />
Source: WI DOR<br />
178 Land Use Information
Table 7.11<br />
Land Use Acreage by Municipality • 1987*<br />
Clark County<br />
Town<br />
Residential<br />
Commercial<br />
Manufacturing<br />
Agricultural<br />
Undeveloped<br />
Forest<br />
Other<br />
Total<br />
Beaver 156 8 0 18,706 162 3,790 22,822<br />
Butler 31 1 0 2,045 580 4,921 7,578<br />
Colby 256 118 0 17,462 421 2,877 21,134<br />
Dewhurst 310 10 117 710 15 6,384 7,546<br />
Eaton 229 16 411 16,361 60 3,584 20,661<br />
Foster 103 5 79 623 48 1,675 2,533<br />
Fremont 136 112 14 16,724 599 5,009 22,594<br />
Grant 216 41 36 17,463 305 4,211 22,272<br />
Green Grove 240 16 0 16,421 713 4,383 21,773<br />
Hendren 178 4 13 13,342 692 6,924 21,153<br />
Hewett 352 34 0 1,462 129 3,847 5,824<br />
Hixon 258 17 130 14,441 678 4,581 20,105<br />
Hoard 351 2 0 13,110 399 5,935 19,797<br />
Levis 463 17 194 6,840 2,742 7,575 17,834<br />
Longwood 262 33 89 15,855 570 4,997 21,806<br />
Loyal 137 60 4 19,844 188 1,918 22,151<br />
Lynn 307 5 83 10,817 713 8,652 20,577<br />
Mayville 337 55 1 18,268 422 1,794 20,877<br />
Mead 61 7 43 6,024 217 9,142 15,494<br />
Mentor 264 15 0 6,824 404 5,461 12,968<br />
Pine Valley 637 84 77 14,075 347 5,215 20,435<br />
Reseburg 134 22 2 19,445 130 3,288 23,021<br />
Seif 122 1 40 4,158 51 5,834 10,206<br />
Sherman 208 18 0 18,220 1,774 2,228 22,448<br />
Sherwood 206 3 0 3,503 992 6,944 11,648<br />
Thorp 1,198 29 79 17,376 1,932 2,669 23,283<br />
Unity 185 10 16 17,575 1,056 3,069 21,911<br />
Warner 131 24 305 14,607 105 6,410 21,582<br />
Washburn 225 2 0 6,916 1,304 5,114 13,561<br />
<strong>West</strong>on 198 27 172 12,144 407 8,641 21,589<br />
Withee 318 37 0 20,406 906 523 22,190<br />
Worden 165 52 3 15,418 508 6,261 22,407<br />
York 263 4 6 18,362 36 4,006 22,677<br />
TOTAL 8,637 889 1,914 415,547 19,605 157,862 604,457<br />
Villages<br />
Curtiss 0 9 0 115 0 0 124<br />
Dorchester 9 10 19 309 0 0 347<br />
Granton 0 6 0 145 0 0 151<br />
Unity 0 0 0 112 0 0 112<br />
Withee 21 4 0 165 0 0 190<br />
TOTAL 30 29 19 846 0 0 924<br />
Cities<br />
Abbotsford 0 0 23 74 0 0 97<br />
Colby 0 0 0 66 0 0 66<br />
Greenwood 23 2 49 645 0 0 719<br />
Loyal 26 71 21 322 0 0 440<br />
Neillsville 13 11 73 419 0 0 516<br />
Owen 59 23 10 260 7 18 377<br />
Stanley n/a n/a n/a n/a n/a n/a n/a<br />
Thorp n/a n/a 31 47 0 0 78<br />
TOTAL 121 107 207 1,833 7 18 2,293<br />
COUNTY TOTAL 8,788 1,025 2,140 418,226 19,612 157,880 607,674<br />
Source: WI DOR * Based on assessment records<br />
Clark County Conditions and Trends Report 179
Table 7.12<br />
Land Use Acreage by Municipality • 1997*<br />
Clark County<br />
Town<br />
Residential<br />
Commercial<br />
Manufacturing<br />
Agricultural<br />
Undeveloped<br />
Forest<br />
Other<br />
Total<br />
Beaver 240 4 0 17,679 255 4,265 225 22,668<br />
Butler 61 1 0 1,768 225 4,858 37 6,950<br />
Colby 344 129 0 16,987 582 2,706 238 20,986<br />
Dewhurst 473 14 195 709 71 5,806 1 7,269<br />
Eaton 271 15 80 14,012 153 5,341 194 20,066<br />
Foster 155 6 0 575 100 1,443 10 2,289<br />
Fremont 511 95 4 15,952 984 4,629 246 22,421<br />
Grant 327 43 36 16,403 209 4,708 302 22,028<br />
Green Grove 242 45 0 16,154 629 4,418 223 21,711<br />
Hendren 254 5 9 11,558 817 7,409 205 20,257<br />
Hewett 382 34 0 1,384 229 3,580 14 5,623<br />
Hixon 482 20 37 13,850 701 4,416 208 19,714<br />
Hoard 342 2 0 12,803 311 6,550 166 20,174<br />
Levis 312 17 194 5,144 1,802 7,689 89 15,247<br />
Longwood 293 28 0 15,537 485 5,153 201 21,697<br />
Loyal 219 71 0 18,875 264 2,425 228 22,082<br />
Lynn 333 4 88 10,516 824 7,507 230 19,502<br />
Mayville 387 49 1 1,783 534 1,783 288 20,697<br />
Mead 85 9 0 5,824 122 6,219 110 12,369<br />
Mentor 434 34 1 6,015 603 5,397 75 12,559<br />
Pine Valley 761 68 38 9,763 670 8,499 173 19,972<br />
Reseburg 316 90 3 18,588 265 3,254 287 22,803<br />
Seif 130 1 40 3,934 51 5,125 60 9,341<br />
Sherman 319 18 0 17,219 990 3,668 196 22,410<br />
Sherwood 254 3 0 2,827 1,083 7,140 52 11,359<br />
Thorp 237 34 79 17,107 1,384 2,891 278 22,010<br />
Unity 324 24 2 16,715 1,473 3,142 193 21,873<br />
Warner 248 25 338 14,408 106 5,985 n/a 21,110<br />
Washburn 257 2 0 6,912 1,211 4,882 85 13,349<br />
<strong>West</strong>on 298 27 39 11,805 229 7,944 192 20,534<br />
Withee 279 33 0 17,871 1,147 2,475 374 22,179<br />
Worden 218 48 5 15,227 500 5,702 196 21,896<br />
York 290 0 6 18,190 51 3,824 354 22,715<br />
TOTAL 10,078 998 1,195 389,966 19,060 160,833 5,730 587,860<br />
Villages<br />
Curtiss 0 8 4 203 0 9 4 228<br />
Dorchester 31 22 119 274 0 4 4 454<br />
Granton 54 1 0 91 0 0 0 146<br />
Unity 1 1 2 70 0 0 2 76<br />
Withee 31 7 8 188 0 0 0 234<br />
TOTAL 117 39 133 826 0 13 10 1,138<br />
Cities<br />
Abbotsford 29 18 26 117 0 18 0 208<br />
Colby 24 1 7 36 0 0 0 68<br />
Greenwood 66 33 114 679 0 43 5 940<br />
Loyal 62 28 35 284 0 0 4 413<br />
Neillsville 42 53 66 352 0 0 3 516<br />
Owen 66 25 84 262 0 0 2 439<br />
Stanley n/a n/a n/a n/a n/a n/a n/a n/a<br />
Thorp 1 54 54 47 0 0 0 156<br />
TOTAL 290 212 386 1777 0 61 14 2,740<br />
COUNTY TOTAL 10,485 1,249 1,714 392,569 19,060 160,907 5,754 591,738<br />
Source: WI DOR * Based on assessment records<br />
180 Land Use Information
Table 7.13<br />
Land Use Acreage by Municipality • 2007<br />
Clark County<br />
Town<br />
Residential<br />
Commercial<br />
Manufacturing<br />
Agricultural<br />
Undeveloped<br />
Forest +<br />
Other<br />
Total<br />
Beaver 375 7 0 17,776 818 3,537 219 22,732<br />
Butler 85 1 0 2,230 403 2,996 30 5,745<br />
Colby 350 34 0 16,209 1,195 2,787 331 20,906<br />
Dewhurst 610 20 191 425 257 4,476 0 5,979<br />
Eaton 321 14 86 14,542 683 3,379 175 19,200<br />
Foster 202 8 0 423 243 1,170 8 2,054<br />
Fremont 728 23 4 14,695 2,761 3,323 225 21,759<br />
Grant 706 62 0 14,370 1,660 4,417 264 21,479<br />
Green Grove 308 54 0 15,685 1,493 3,766 187 21,493<br />
Hendren 360 8 9 9,093 3,837 4,743 200 18,250<br />
Hewett 487 35 1 889 600 3,279 32 5,323<br />
Hixon 464 71 12 13,105 1,319 4,273 180 19,424<br />
Hoard 326 2 0 12,258 1,714 5,287 194 19,781<br />
Levis 418 29 230 4,646 2,555 6,193 74 14,145<br />
Longwood 375 33 0 14,234 1,553 5,093 178 21,466<br />
Loyal 309 45 0 18,459 1,171 1,614 232 21,830<br />
Lynn 372 12 88 8,444 3,597 5,371 202 18,086<br />
Mayville 644 22 0 16,593 1,059 1,844 408 20,570<br />
Mead 380 7 0 5,003 1,460 4,011 103 10,964<br />
Mentor 521 9 1 5,951 1,045 4,015 109 11,651<br />
Pine Valley 1,320 74 40 8,769 2,172 6,982 91 19,448<br />
Reseburg 315 115 3 18,088 955 2,976 224 22,676<br />
Seif 130 1 42 3,231 1,399 3,342 77 8,222<br />
Sherman 520 13 0 16,684 1,206 3,142 174 21,739<br />
Sherwood 395 3 0 2,310 1,909 5,804 58 10,479<br />
Thorp 361 47 128 14,580 3,388 2,982 222 21,708<br />
Unity 449 25 2 13,150 4,817 2,715 289 21,447<br />
Warner 364 9 349 14,432 616 3,700 178 19,648<br />
Washburn 364 1 0 4,479 3,454 3,929 71 12,298<br />
<strong>West</strong>on 425 27 39 13,183 662 5,893 169 20,398<br />
Withee 549 54 0 16,344 2,554 2,095 302 21,898<br />
Worden 373 14 3 13,424 2,337 4,859 148 21,158<br />
York 318 4 0 17,859 1,904 2,371 353 22,809<br />
TOTAL 14,224 883 1228 361,563 56,796 126,364 5,707 566,765<br />
Villages<br />
Curtiss 8 71 4 135 18 3 0 239<br />
Dorchester 37 39 141 205 20 0 2 444<br />
Granton 119 2 0 27 1 0 0 149<br />
Unity 3 10 2 90 0 0 2 107<br />
Withee 46 22 12 90 84 40 0 294<br />
TOTAL 213 144 159 547 123 43 4 1,233<br />
Cities<br />
Abbotsford 232 75 28 94 23 19 0 471<br />
Colby 50 1 7 0 0 0 0 58<br />
Greenwood 72 88 114 419 163 127 5 988<br />
Loyal 62 47 36 227 18 0 4 394<br />
Neillsville 126 229 50 76 1 186 0 668<br />
Owen 69 37 73 67 100 0 0 346<br />
Stanley 1 32 0 0 8 0 0 41<br />
Thorp 4 35 25 134 64 16 0 278<br />
TOTAL 616 544 333 1,017 377 348 9 3,244<br />
COUNTY TOTAL 15,053 1571 1,720 363,127 57,296 126,755 5,720 571,242<br />
Source: WI DOR * Based on assessment records. + Includes Forest and Ag Forest<br />
Clark County Conditions and Trends Report 181
Table 7.14<br />
Agricultural Land Sales • 1998 - 2007<br />
Clark County<br />
Agricultural land continuing in Agricultural land being diverted Total of all agricultural land<br />
Year<br />
agricultural use<br />
to other uses<br />
2007 Number of Acres Sold Dollars per Number of Acres Sold Dollars per Number of Acres Sold Dollars per<br />
transactions<br />
acre transactions<br />
acre transactions<br />
acre<br />
All 85 6,511 2,285 7 238 4,019 92 6,749 2,346<br />
Without 37 2,371 1,700 2 69 1,779 39 2,440 1,702<br />
Buildings<br />
2006 Number of Acres Sold Dollars per Number of Acres Sold Dollars per Number of Acres Sold Dollars per<br />
transactions<br />
acre transactions<br />
acre transactions<br />
acre<br />
All 82 5,778 2,201 7 278 4,174 89 6,056 2,292<br />
Without 32 1,586 1,608 3 195 1,847 35 1,781 1,634<br />
Buildings<br />
2005 Number of Acres Sold Dollars per Number of Acres Sold Dollars per Number of Acres Sold Dollars per<br />
transactions<br />
acre transactions<br />
acre transactions<br />
acre<br />
All 66 5,803 1,927 12 394 2,367 78 6,197 1,955<br />
Without 20 1,242 1,329 5 131 1,445 25 1,373 1,340<br />
Buildings<br />
2004 Number of Acres Sold Dollars per Number of Acres Sold Dollars per Number of Acres Sold Dollars per<br />
transactions<br />
acre transactions<br />
acre transactions<br />
acre<br />
All 88 6,589 1,746 24 909 2,106 112 7,498 1,790<br />
Without 39 1,943 1,184 12 323 2,025 51 2,266 1,304<br />
Buildings<br />
2003 Number of Acres Sold Dollars per Number of Acres Sold Dollars per Number of Acres Sold Dollars per<br />
transactions<br />
acre transactions<br />
acre transactions<br />
acre<br />
All 90 7,376 1,361 22 661 1,618 112 8,037 1,382<br />
Without 44 2,478 976 17 445 1,280 61 2,923 1,022<br />
Buildings<br />
2002 Number of Acres Sold Dollars per Number of Acres Sold Dollars per Number of Acres Sold Dollars per<br />
transactions<br />
acre transactions<br />
acre transactions<br />
acre<br />
All 93 8,042 1,501 14 478 1,368 107 8,520 1,493<br />
Without 38 1,997 1,054 8 247 1,011 46 2,244 1,049<br />
Buildings<br />
2001 Number of Acres Sold Dollars per Number of Acres Sold Dollars per Number of Acres Sold Dollars per<br />
transactions<br />
acre transactions<br />
acre transactions<br />
acre<br />
All 101 8,001 1,405 13 479 1,105 114 8,420 1,388<br />
Without 39 1,954 893 8 190 973 47 2,144 901<br />
Buildings<br />
2000 Number of Acres Sold Dollars per Number of Acres Sold Dollars per Number of Acres Sold Dollars per<br />
transactions<br />
acre transactions<br />
acre transactions<br />
acre<br />
All 119 9,664 1,212 21 735 1,585 140 10,399 1,238<br />
Without 42 1,964 854 12 275 939 54 2,239 864<br />
Buildings<br />
1999 Number of Acres Sold Dollars per Number of Acres Sold Dollars per Number of Acres Sold Dollars per<br />
transactions<br />
acre transactions<br />
acre transactions<br />
acre<br />
All 112 8,234 1,061 15 526 1,054 127 8,760 1,061<br />
Without 45 2,295 651 9 191 838 54 2,486 665<br />
Buildings<br />
1998 Number of Acres Sold Dollars per Number of Acres Sold Dollars per Number of Acres Sold Dollars per<br />
transactions<br />
acre transactions<br />
acre transactions<br />
acre<br />
All 142 12,868 888 20 949 775 162 13,817 880<br />
Without 59 3,184 546 15 565 537 74 3,749 545<br />
Buildings<br />
Source: USDA<br />
182 Land Use Information
Table 7.15<br />
Forested Land Sales • 1998, 2001, 2005, and 2007<br />
Clark County<br />
Forested land continuing in forest<br />
Forested land being diverted to Total of all forested land<br />
land<br />
other uses<br />
Number of Acres Sold Dollars per Number of Acres Sold Dollars per Number of Acres Sold Dollars per<br />
Year transactions<br />
acre transactions<br />
acre transactions<br />
acre<br />
2007 39 1,275 1,876 3 99 1,854 42 1,374 1,874<br />
2005 27 984 1,580 9 365 1,677 36 1,349 1,606<br />
2001 80 2,341 1,157 13 311 1,210 93 2,652 1,163<br />
1998 94 2,545 688 20 674 652 114 3,219 681<br />
Source: USDA<br />
Table 7.16<br />
Land Assessed Value per Acre by Town (dollars) • 2007*<br />
Clark County<br />
Town<br />
Residential<br />
Commercial<br />
Manufacturing<br />
Agricultural<br />
Undeveloped<br />
Ag Forest<br />
Forest<br />
Beaver 2,143 2,229 0 158 148 751 1,504<br />
Butler 2,318 1,000 0 150 265 778 1,559<br />
Colby 3,252 3,003 4,900 151 315 697 1,242<br />
Dewhurst 34,734 10,580 756 129 180 485 1,162<br />
Eaton 1,830 2,193 721 151 144 555 1,071<br />
Foster 8,443 4,275 0 114 191 465 960<br />
Fremont 4,380 9,657 2,975 168 413 875 1,629<br />
Grant 1,810 2,427 0 140 262 540 1,073<br />
Green Grove 2,371 1,667 0 153 189 559 1,129<br />
Hendren 2,414 7,688 1,089 134 409 490 1,001<br />
Hewett 3,515 1,629 3,900 137 409 770 1,557<br />
Hixon 4,427 3,463 1,683 131 150 598 1,200<br />
Hoard 2,173 2,250 0 153 252 456 935<br />
Levis 2,630 2,034 972 118 223 658 1,318<br />
Longwood 1,913 1,855 0 177 322 743 1,533<br />
Loyal 2,162 2,031 0 140 138 466 978<br />
Lynn 2,718 2,458 240 188 492 759 1,639<br />
Mayville 2,756 2,700 7,600 177 535 698 1,110<br />
Mead 19,948 1,714 0 116 446 582 1,175<br />
Mentor 4,775 5,144 4,300 154 156 763 1,525<br />
Pine Valley 4,736 3,414 1,013 135 287 683 1,358<br />
Reseburg 1,941 1,681 4,533 137 197 651 1,300<br />
Seif 2,428 2,000 8,860 141 284 687 1,372<br />
Sherman 2,639 2,100 0 154 173 650 1,122<br />
Sherwood 1,648 1,167 0 131 250 687 1,371<br />
Thorp 3,145 2,636 1,520 146 230 637 1,142<br />
Unity 2,452 3,328 4,850 163 245 532 1,053<br />
Warner 1,927 2,467 1,274 138 242 749 1,465<br />
Washburn 1,868 2,500 0 120 262 597 1,227<br />
<strong>West</strong>on 2,667 3,274 1,190 150 203 703 1,481<br />
Withee 3,009 2,087 0 158 238 800 1,589<br />
Worden 3,186 2,557 7,400 165 293 751 1,507<br />
York 1,599 975 0 147 201 600 1,158<br />
Average for all Towns 4,362 3,027 3,750 146 265 649 1,286<br />
Source: WI DOR * Based on assessment records.<br />
Clark County Conditions and Trends Report 183
Table 7.17<br />
Land Assessed Value per Acre by Village or City (dollars) • 2007*<br />
Clark County<br />
Village or<br />
City<br />
Residential<br />
Commercial<br />
Manufacturing<br />
Villages<br />
Curtiss +2,844 8,093 6,475 217 233 0 900<br />
Dorchester +5,421 +11,522 3,409 163 305 0 0<br />
Granton 7,233 +3,726 0 185 100 0 0<br />
Unity +7,710 5,380 8,250 160 0 0 0<br />
Withee +6,168 +11,870 4,975 133 470 0 1,290<br />
Average for all Villages 5,875 8,118 5,777 172 277 0 1,095<br />
Cities<br />
Abbotsford 34,001 29,933 6,836 165 943 0 2,084<br />
Colby +8,820 +8,209 15,957 0 0 0 0<br />
Greenwood 43,640 7,024 1,261 161 112 0 456<br />
Loyal 53,116 24,927 2,722 111 261 0 0<br />
Neillsville +9,909 18,878 3,680 145 30,000 0 2,360<br />
Owen 37,454 16,405 2,745 207 387 0 0<br />
Stanley 10,600 903 0 0 863 0 0<br />
Thorp +8,025 +18,465 8,160 177 584 1,813 0<br />
Average for all Cities 25,696 15,593 5,909 161 4,736 1,813 1,633<br />
Source: WI DOR * Based on assessment records. + per parcel, acreage incomplete<br />
Agricultural<br />
Undeveloped<br />
Ag Forest<br />
Forest<br />
184 Land Use Information
Municipality Land Use Maps<br />
The final component of the land-use element includes a series of maps that show current<br />
land uses, productive agricultural soils, natural limitations for building site development,<br />
floodplains, and wetlands. Resource and development limitations maps are described in<br />
the Agricultural, Natural and Cultural Resources section and previously within this<br />
section. The city, village, and town maps themselves are found in Adobe Acrobat .pdf<br />
format in the Clark County Resource and Land Use Atlas DVD-ROM.<br />
Limitations to Development Maps<br />
The existence of some natural features in the physical environment, such as water,<br />
topography, and soil conditions, can act as constraints on development. Understanding<br />
the physical characteristics of the County can help identify areas that are more conducive<br />
to development activities and areas that may be better suited for non-developed land uses,<br />
such as agriculture and natural resource management. The Clark County Resource and<br />
Land Use Atlas DVD-ROM contains maps of the resources, development limitations, and<br />
other environmentally sensitive lands within each community. County level maps are in<br />
Appendix A (Maps 7.1-7.5) and in the Atlas DVD-ROM.<br />
In a number of instances, some of these development limitations may be overcome by<br />
more extensive and costly development methods; however, development should be<br />
encouraged in areas in which it can be best accommodated and have the least impact on<br />
environmentally sensitive and valued resource areas.<br />
Existing Land Use Maps<br />
The existing land-use maps are derived from a windshield survey done in 1998 and plat<br />
maps. The Clark County Resource and Land Use Atlas DVD-ROM contains the existing<br />
land use maps which depict the general land uses in each community by approximate<br />
location in Adobe Acrobat .pdf format for each local jurisdiction in Clark County.<br />
Clark County Conditions and Trends Report 185