CEB Investors' and Analysts' Briefing 2Q11 - Cebu Pacific Air
CEB Investors' and Analysts' Briefing 2Q11 - Cebu Pacific Air
CEB Investors' and Analysts' Briefing 2Q11 - Cebu Pacific Air

Create successful ePaper yourself
Turn your PDF publications into a flip-book with our unique Google optimized e-Paper software.
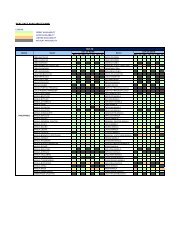
Strong Balance Sheet Allows for Further Expansion<br />
Php Millions<br />
As of Dec-31 As of Jun-30<br />
2010 2011<br />
Cash <strong>and</strong> cash equivalents (1) 13,267 12,391<br />
Current assets 15,139 14,366<br />
Plant <strong>and</strong> equipment 33,986 36,623<br />
Other noncurrent assets 812 1,063<br />
Total assets 49,937 52,052<br />
Total debt (2) 20,503 20,794<br />
Other liabilities 11,527 12,906<br />
Total liabilities 32,030 33,699<br />
Cash balance (including financial<br />
assets at FVPL) after cash<br />
dividend payout stood at Php12.4<br />
billion as at end 2Q2011.<br />
Strong gearing <strong>and</strong> debt service<br />
ability allow <strong>CEB</strong> to tap financing<br />
for aircraft acquisition.<br />
Total equity 17,907 18,353<br />
Capitalized lease (3) 11,234 11,490<br />
Net debt 7,236 8,403<br />
Adjusted net debt 18,470 19,893<br />
Net debt-to-equity (x) 0.40 0.46<br />
Adjusted net debt-to-equity (x) 1.03 1.08<br />
Adjusted net debt/EBITDAR (x) (4) 1.82 2.22<br />
Cash-to-sales ratio (5) 45.6% 40.1%<br />
(1) Cash balance includes financial assets held-for-trading (at fair value) as well as available for sale assets.<br />
(2) Includes LT debt, current portion of LT debt, <strong>and</strong> ARO liability<br />
(3) Capitalized lease for June 30, 2011 is based on LTM aircraft <strong>and</strong> engine lease expense x7<br />
(4) EBITDAR for June 30, 2011 is based on LTM EBITDAR<br />
(5) Sales for June 30, 2011 is based on LTM Revenues<br />
16