Microtremor Measurements Used to Map Thickness of Soft Sediments
Microtremor Measurements Used to Map Thickness of Soft Sediments
Microtremor Measurements Used to Map Thickness of Soft Sediments

Create successful ePaper yourself
Turn your PDF publications into a flip-book with our unique Google optimized e-Paper software.
252 M. Ibs-von Seht and J. Wohlenberg<br />
reference recording site placed on hard rock and a second<br />
recorder that is placed on the sediments <strong>to</strong> be mapped. The<br />
spectral ratio <strong>of</strong> noise recordings at the two sites is assumed<br />
<strong>to</strong> show something similar <strong>to</strong> the site effect (Lermo et al.,<br />
1988; Field and Jacob, 1990; Field et al., 1995; Lachet et<br />
al., 1996). We call this kind <strong>of</strong> spectral ratio S/R spectrum<br />
(because the spectral ratio <strong>of</strong> a sediment site and a reference<br />
site is formed). The second method, proposed by Nakamura<br />
(1989) and known as Nakamura's technique, requires only<br />
one recording station. This is because the spectral ratio <strong>of</strong><br />
the horizontal and the vertical components recorded at the<br />
same site is formed (H/V spectrum). This process is said <strong>to</strong><br />
eliminate the influence <strong>of</strong> the source effect. A more detailed<br />
description <strong>of</strong> the method can be found in Lermo and Ch~vez-Garcfa<br />
(1993).<br />
Nakamura's technique has awakened interest because it<br />
seems <strong>to</strong> show some essential advantages over traditional<br />
S/R spectra. Nakamura (1989), Lermo and Chavez-Garcia<br />
(1993), Field et al. (1995), and Lachet et al. (1996) applied<br />
the method for site response estimations in Japan, Europe,<br />
and America. They found out that determination <strong>of</strong> the fundamental<br />
resonant frequency <strong>of</strong> the subsoil is possible. In<br />
contrast <strong>to</strong> classical S/R spectra, Nakamura's technique<br />
should also allow a rough estimate <strong>of</strong> the soil amplification<br />
fac<strong>to</strong>r. In field practice, Nakamura's technique is less expensive,<br />
because only one recording station is needed, and<br />
it is said <strong>to</strong> be less sensitive <strong>to</strong> local noise sources. A satisfac<strong>to</strong>ry<br />
theoretical explanation <strong>of</strong> the method has not yet<br />
been given. Lachet and Bard (1994) investigated the method<br />
using numerical noise simulations. They conclude that H/V<br />
spectra show clear maxima at the resonant frequency <strong>of</strong> the<br />
subsoil, but its amplitudes are dependent on the Poisson's<br />
ratio <strong>of</strong> the uppermost layer and are therefore not suitable<br />
for soil amplification estimates. Further theoretical support<br />
has been given by Field and Jacob (1995).<br />
Field Data<br />
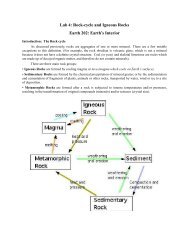
<strong>Microtremor</strong> measurements were carried out in two<br />
boundaried areas <strong>of</strong> the western Lower Rhine Embayment<br />
(Germany) <strong>to</strong> the north <strong>of</strong> Aachen (Fig. 4). The geological<br />
evolution <strong>of</strong> this region has produced sedimentary covers <strong>of</strong><br />
different thicknesses <strong>of</strong> Tertiary and Quaternary ages. The<br />
southern area <strong>of</strong> investigation (Fig. 5, <strong>to</strong>p) covers the northern<br />
border <strong>of</strong> the Eifel, where the Paleozoic basement dips<br />
<strong>to</strong>ward the north. The s<strong>of</strong>t-rock thicknesses increase from<br />
0 m in the south <strong>to</strong> about 350 m in the north. The northern<br />
area <strong>of</strong> investigation (Fig. 5, bot<strong>to</strong>m) is situated in a region<br />
where sediment thickness is much higher and may exceed<br />
1000 m. The various layer thicknesses are crucial for the<br />
study because they produce the various spectral responses<br />
observed. One further advantage <strong>of</strong> the areas investigated is<br />
the large number <strong>of</strong> drilling sites. At these points, detailed<br />
information about the subsurface structure, namely, the<br />
thickness <strong>of</strong> sedimentary covers, is available. This is needed<br />
for calibrating the results <strong>of</strong> the noise investigations.<br />
: i!i:i:i:}:i!i! : il i?:i:i ~:i~i~<br />
Tertiary [.......................<br />
1 areas <strong>of</strong><br />
Quaternary [..........................<br />
i investigation<br />
Mesozoic S fault<br />
Paleozoic<br />
Figure 4. Geological overview <strong>of</strong> the western<br />
Lower Rhine Embayment and areas <strong>of</strong> investigation.<br />
We present here the results <strong>of</strong> measurements at 102<br />
sites. Thirty-four <strong>of</strong> them were made very close <strong>to</strong> or directly<br />
at drilling sites where the cover thickness is known. Ten sites<br />
were placed on hard rock and used as reference stations for<br />
the forming <strong>of</strong> S/R spectra. To minimize the influence <strong>of</strong><br />
human noise, all recordings were taken at night between<br />
1 a.m. and 4 a.m. We used digital equipment (Lennartz PCM<br />
5800) and three different seismometer types (Mark L4-3D/<br />
1 second, Lennartz LE-3D/1 second, and LE-3D/5 second).<br />
Table 1 gives the labels and the coordinates <strong>of</strong> the sites.<br />
For further processing, only quiet sections <strong>of</strong> the noise<br />
recordings were used. Therefore, all recordings were examined<br />
<strong>to</strong> identify and cut <strong>of</strong>f those parts <strong>of</strong> the traces disturbed<br />
by very near-local sources, such as passing cars or<br />
opera<strong>to</strong>r's footsteps. The resulting length <strong>of</strong> the clean recordings<br />
varies between 1 and 10 min and is given in Table<br />
1. During data processing, an instrument correction was applied<br />
<strong>to</strong> those recordings taken by 1-sec seismometers <strong>to</strong><br />
obtain a flat response above approx. 0.5 Hz. Amplitude spectra<br />
were calculated for all sites and components. The spectra<br />
were smoothed by applying a low-pass filter. Furthermore,<br />
rms amplitudes <strong>of</strong> the noise recordings were calculated for<br />
all traces (see Table 1).<br />
The H/V spectral ratio [Ti-vv(o))] was obtained by dividing<br />
the averaged spectra <strong>of</strong> the horizontal components <strong>of</strong><br />
the sediment site [SNs(O)) and SEW(O))] by the spectrum <strong>of</strong><br />
the vertical component [Sv(o))] <strong>of</strong> the sediment site:<br />
Twv(CO) = [SNs(O)) + Szw(o))]/2 (6)<br />
Sv(o))<br />
The S/R spectral ratio [Tspa(o))] was formed by dividing the<br />
averaged spectra <strong>of</strong> the horizontal components <strong>of</strong> the sedi-