Microtremor Measurements Used to Map Thickness of Soft Sediments
Microtremor Measurements Used to Map Thickness of Soft Sediments
Microtremor Measurements Used to Map Thickness of Soft Sediments

You also want an ePaper? Increase the reach of your titles
YUMPU automatically turns print PDFs into web optimized ePapers that Google loves.
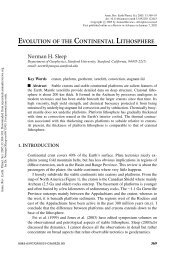
258 M. Ibs-von Seht and J. Wohlenberg<br />
Application<br />
Relationship (11) found for the s<strong>of</strong>t rocks <strong>of</strong> the western<br />
Lower Rhine Embayment enables direct calculations <strong>of</strong> estimates<br />
<strong>of</strong> sediment thicknesses from the main peak in the<br />
microtremor H/V spectral ratios. We demonstrate that this<br />
method can be used <strong>to</strong> obtain information about subsoil geological<br />
structure. The cross sections (Fig. 11) show the subsurface<br />
structures <strong>of</strong> the areas investigated. The morphologies<br />
<strong>of</strong> the hard-rock basement shown in the figures were<br />
constructed using the data <strong>of</strong> the microtremor measurements<br />
only. The positions <strong>of</strong> the two pr<strong>of</strong>iles are indicated in Figure<br />
5. Pr<strong>of</strong>ile 1 is situated in the southern area <strong>of</strong> investigation<br />
and extends across the S<strong>to</strong>lberg Graben. Pr<strong>of</strong>ile 2 is situated<br />
in the northern area <strong>of</strong> investigation and crosses the Roer<br />
Boundary Fault and the Kleingladbach Fault. Cover thicknesses<br />
were calculated according <strong>to</strong> equation (11) for the<br />
stations involved. <strong>Thickness</strong>es known from drilling are<br />
drawn as vertical bars in the pr<strong>of</strong>iles. Additionally, the figures<br />
contain an interpretation <strong>of</strong> the geological and tec<strong>to</strong>nic<br />
situation.<br />
While in the southeastern part <strong>of</strong> pr<strong>of</strong>ile 1, cover thicknesses<br />
around 50 m were calculated; thicknesses <strong>of</strong> up <strong>to</strong><br />
200 m can be observed for its northwestern part. This increase<br />
<strong>of</strong> thickness is confirmed by numerous drillings and<br />
is due <strong>to</strong> a northwestern tilt <strong>of</strong> the Paleozoic basement, as is<br />
typical for the blocks <strong>of</strong> the Lower Rhine Embayment. Additionally,<br />
the results <strong>of</strong> the noise investigations include a<br />
strong relief <strong>of</strong> the basement for the center part <strong>of</strong> the pr<strong>of</strong>ile.<br />
In this part, not supported by information from drillings, the<br />
cover thickness decreases <strong>to</strong> less than 25 m. This ridge-type<br />
high <strong>of</strong> the basement corresponds well <strong>to</strong> the assumed position<br />
<strong>of</strong> the Aachen Thrust Fault, a prominent Paleozoic<br />
lineament at the base <strong>of</strong> the Tertiary. The strong relief accompanying<br />
the fault results from the different resistance <strong>to</strong><br />
weathering <strong>of</strong> the rock types on both sides <strong>of</strong> the fault. The<br />
upper Devonian shale and limes<strong>to</strong>ne in the south are less<br />
subject <strong>to</strong> weathering than the upper Carboniferous muds<strong>to</strong>nes<br />
and silts<strong>to</strong>nes <strong>to</strong> the north <strong>of</strong> the fault. Therefore, the<br />
observed structure at the base <strong>of</strong> the Tertiary can be interpreted<br />
as a paleo relief <strong>of</strong> the postcarboniferous landscape.<br />
Pr<strong>of</strong>ile 2 is situated in a region <strong>of</strong> much thicker covers.<br />
The results <strong>of</strong> the noise investigations prove a tilt <strong>of</strong> the Roer<br />
Block in the direction <strong>of</strong> the Roer Boundary Fault. The thickness<br />
calculated for site E6 is 1500 m. Site E7, which is<br />
situated only approx. 1 km northeasterly, but beyond the<br />
Roer Boundary Fault, proves <strong>to</strong> have less cover thickness<br />
for the Wassenberg Block. Increasing thicknesses beyond<br />
the Kleingladbach Fault could also be detected by the measurements.<br />
Information from drillings supports the observations.<br />
The results <strong>of</strong> the noise investigations on pr<strong>of</strong>ile 2<br />
show that also in regions <strong>of</strong> thick sedimentary covers, the<br />
method provides reliable information on thicknesses. Vertical<br />
shifts in the basement <strong>of</strong> more than 1000 m can be<br />
detected.<br />
NW<br />
SE<br />
200 . . . . . . . . . . . . . . . . . . . . . . . . . . . . . . . . . . . . . . . . . . . . . . . . . . . . . . . . . . . . . . . . . . .<br />
Z loo<br />
ii I<br />
0 :2<br />
-100 """""''"'''''''''''"<br />
0 1 2 3 4 5 6 7 8 9 10 11 12 13 14<br />
relative distance [km]<br />
v measuring site<br />
base <strong>of</strong> s<strong>of</strong>t sediments<br />
o determined by noise<br />
measurements<br />
thickness <strong>of</strong> s<strong>of</strong>t<br />
sediments determined<br />
by drilling<br />
SW<br />
NE<br />
o 5 lO 15<br />
relative distance [kin]<br />
Figure 11. Cross sections showing the subsurface structure <strong>of</strong> the areas investigated<br />
constructed using results <strong>of</strong> microtremor analysis. For location <strong>of</strong> pr<strong>of</strong>ile 1 and pr<strong>of</strong>ile<br />
2, see Figure 5.