calculating critical loads of acid deposition for forest soils in ... - CCME
calculating critical loads of acid deposition for forest soils in ... - CCME
calculating critical loads of acid deposition for forest soils in ... - CCME

You also want an ePaper? Increase the reach of your titles
YUMPU automatically turns print PDFs into web optimized ePapers that Google loves.
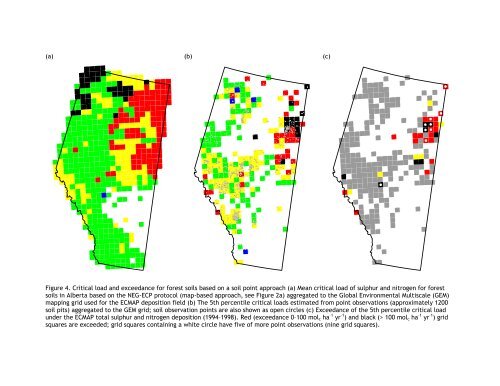
(a) (b) (c)<br />
Figure 4. Critical load and exceedance <strong>for</strong> <strong>for</strong>est <strong>soils</strong> based on a soil po<strong>in</strong>t approach (a) Mean <strong>critical</strong> load <strong>of</strong> sulphur and nitrogen <strong>for</strong> <strong>for</strong>est<br />
<strong>soils</strong> <strong>in</strong> Alberta based on the NEG-ECP protocol (map-based approach, see Figure 2a) aggregated to the Global Environmental Multiscale (GEM)<br />
mapp<strong>in</strong>g grid used <strong>for</strong> the ECMAP <strong>deposition</strong> field (b) The 5th percentile <strong>critical</strong> <strong>loads</strong> estimated from po<strong>in</strong>t observations (approximately 1200<br />
soil pits) aggregated to the GEM grid; soil observation po<strong>in</strong>ts are also shown as open circles (c) Exceedance <strong>of</strong> the 5th percentile <strong>critical</strong> load<br />
under the ECMAP total sulphur and nitrogen <strong>deposition</strong> (1994–1998). Red (exceedance 0–100 mol c ha –1 yr –1 ) and black (> 100 mol c ha –1 yr –1 ) grid<br />
squares are exceeded; grid squares conta<strong>in</strong><strong>in</strong>g a white circle have five <strong>of</strong> more po<strong>in</strong>t observations (n<strong>in</strong>e grid squares).<br />
10